Disease burden of food-related pathogens in the Netherlands, 2010
33
0
0
Hele tekst
(2) Disease burden of food-related pathogens in the Netherlands, 2012. RIVM Letter report 330331004/2012 A.H. Havelaar | I.H.M. Friesema | W. van Pelt. |.
(3) RIVM Letter report 330331004. Colophon. © RIVM 2012 Parts of this publication may be reproduced, provided acknowledgement is given to the 'National Institute for Public Health and the Environment', along with the title and year of publication.. Arie H. Havelaar Igrid H.M. Friesema Wilfrid van Pelt Contact: Arie Havelaar RIVM/CIb/LZO arie.havelaar@rivm.nl. This investigation has been performed by order and for the account of Ministery of Public Health, welfare and Sports, within the framework of Programma 5.. Page 2 of 31.
(4) RIVM Letter report 330331004. Abstract. Disease burden of food-related pathogens in the Netherlands, 2010. The Ministry of VWS has requested RIVM to present an annual update on the number of illnesses caused by 14 enteric pathogens. These pathogens can be transmitted by food, the environment, animals and humans. The number of persons who are ill and who die from the infections is expressed in DALYs (Disability Adjusted Life Years), a measure of the disease burden in the population. The total disease burden caused by the 14 pathogens increased from 13,500 DALY in 2009 to 14,400 DALY in 2010. The share of foodborne transmission in this burden increased from 6,020 to 6,440 DALY. The increase in disease burden was a result of an increase in the incidence of disease by Campylobacter spp., Salmonella spp., norovirus, rotavirus and hepatitis A virus. Furthermore, more persons died from an infection with Listeria monocytogenes. Most observed increases are within the range of observed disease incidence in the previous decennium. However, the incidence of campylobacteriosis was approximately 25% higher than in previous years. No explanation for this increase is available. This research results in more insight in the true incidence of foodborne diseases and the associated disease burden. The Dutch Food and Consumer Product Safety Authority (NVWA) and Regional Health Services register and investigate outbreaks of foodborne disease in the Netherlands. However, the majority of foodborne diseases in not reported. Keywords: food-related disease, disease burden, DALY, trend. Page 3 of 31.
(5) RIVM Letter report 330331004. Rapport in het kort. Ziektelast van via voedsel overdraagbare pathogenen in Nederland in 2010 Op verzoek van het ministerie van VWS onderzoekt het RIVM jaarlijks hoeveel mensen ziek worden van 14 darminfecties. Deze infecties kunnen worden overgedragen via voedsel, het milieu, dieren en de mens. Het aantal mensen dat ziek wordt van een infectie of eraan overlijdt, wordt uitgedrukt in DALY’s (Disability Adjusted Life Year); een maat voor gezondheidsverlies onder de bevolking. De ziektelast die door de 14 darminfecties in totaal werd veroorzaakt steeg van 13.500 DALY in 2009 naar 14.400 DALY in 2010. Het deel van deze ziektelast dat alleen via voedsel werd overgedragen, steeg van 6.020 tot 6.440 DALY. De stijging in de ziektelast via voedsel komt doordat er ten opzichte van 2009 meer mensen ziek zijn geworden van een infectie met de Campylobacter spp., Salmonella spp., het norovirus, het rotavirus en het hepatitis A-virus. Daarnaast zijn er meer mensen overleden als gevolg van een infectie met Listeria monocytogenes. De meeste van deze stijgingen vallen binnen de marges voor de mate waarin deze infecties voorkomen ten opzichte van het voorgaande decennium. Dit geldt niet voor het aantal infecties met de Campylobacterbacterie. Deze veroorzaakte in 2010 ongeveer 25 procent vaker een infectie dan in voorgaande jaren. Een verklaring hiervoor is niet voorhanden. De resultaten van dit onderzoek bieden handvaten om meer zicht te krijgen op het daadwerkelijke aantal voedselinfecties dat mensen jaarlijks oplopen en de ziektelast die daardoor wordt veroorzaakt. De Nederlandse Voedsel- en Warenautoriteit (NVWA) en GGD’en registeren en onderzoeken in Nederland uitbraken van voedselinfecties en -vergiftigingen. Het merendeel van de infecties wordt echter niet gemeld. Trefwoorden: Voedsel-gerelateerde ziekte, ziektelast, DALY, trend. Page 4 of 31.
(6) RIVM Letter report 330331004. Contents. Summary—6 1. Introduction—7. 2 2.1 2.2 2.3. Methods—8 Trend information—8 Model corrections—8 Disease burden—8. 3 3.1 3.2 3.3 3.4. Results—9 Trend information—9 Disease incidence—9 Disease burden by pathogen—10 Attribution—10. 4. Discussion—11 Acknowledgement—12 References—13. Page 5 of 31.
(7) RIVM Letter report 330331004. Summary Since 2008, RIVM regularly publishes estimates of the incidence, burden and costs of 14 enteric pathogens on its web pages. In this report, trend information from epidemiological surveillance and demographic information is used to update the information to the year 2010. Compared to 2009, the incidence of campylobacteriosis increased by 14% and the incidence of salmonellosis by 19%. The incidence of gastroenteritis by rotavirus increased by 14% and by norovirus with 25% (based on all hospitalisations for viral gastroenteritis). The incidence of perinatal and acquired listeriosis was similar to 2009 with 4 and 73 cases, respectively. There were 13 fatal cases of acquired listeriosis, considerably more than in 2009. The incidence of STEC O157 was similar to 2009. The incidence of hepatitis A increased by 49%. Trends in cryptosporidiosis and giardiasis were extrapolated from surveillance data up to 2007. No trend information was available for bacterial toxins and toxoplasmosis. Because of the higher incidence, there was also an increase in the burden of campylobacteriosis, salmonellosis, norovirus, and rotavirus. Due to the high number of fatal cases, the burden of listeriosis also increased considerably. Perinatal listeriosis was the disease outcome with the highest individual burden among all pathogens. The total burden of the 14 pathogens increased with 10% from 13,500 to 14,900 DALY. The burden of foodborne disease increased with 7% from 6,020 to 6,440 DALY. A particularly high increase was estimated in human-human transmitted disease, with 18% from 2,370 to 2,800 DALY (related to strong increases in virus incidence). Among food pathways, the highest burden was attributed to poultry, beef/mutton and transmission by humans or animals (mainly infected food handlers). Foods from animal origin caused 50% of all cases but 72% of the burden due to food, indicating that the pathogens associated with these foods tend to cause more severe infections than pathogens associated with other foods. The changes in incidence and burden as presented in this report need to be interpreted with care due to limitations in the available trend information for specific pathogens. The observed increases in 2010 compared to 2009 are within the range of observed disease incidence in the previous decennium, except for the incidence of campylobacteriosis that was approximately 25% higher than in previous years. No explanation for this increase is available.. Page 6 of 31.
(8) RIVM Letter report 330331004. 1. Introduction. Since 2008, RIVM regularly publishes estimates of the incidence, burden and costs of food-related disease on its web pages in the “Nationaal Kompas Volksgezondheid”1. The presented information includes estimates of the disease burden, expressed in Disability Adjusted Life Years. The methodology is described in detail in a peer-reviewed paper (Havelaar et al., Submitted for publication). Data in that paper referred to the year 2009. In this report, trend information from epidemiological surveillance and demographic information is used to update the information to the year 2010. For comparison, data for 2009 are also presented.. 1. http://www.nationaalkompas.nl/gezondheidsdeterminanten/omgeving/milieu/voedselveiligheid/microbiologisch/. Page 7 of 31.
(9) RIVM Letter report 330331004. 2. Methods. 2.1. Trend information Data on the size and age distribution of the Dutch population, as well as mortality risks and the number of live births and stillbirths were obtained from Statistics Netherlands2. Trend information on the incidence of gastro-enteritis by pathogen in the general population and consulting the general practitioner was obtained from the following sources (partly also presented in Aalten et al., 2011): Thermophilic Campylobacter spp.: laboratory surveillance; Shiga-toxin producing Escherichia coli O157 (STEC O157): active surveillance; Non-typhoidal Salmonella spp.: laboratory surveillance; Norovirus: hospitalisation for viral gastro-enteritis (ICD code 86); Rotavirus: laboratory surveillance; Perinatal and acquired listeriosis: active surveillance; Hepatitis-A: OSIRIS (mandatory notifications); Cryptosporidium spp.: a stable incidence since 2003 was assumed, based on laboratory surveillance data from 2001 to 2007; Giardia spp.: a continuing decrease with the rate observed between 2001 and 2007 was assumed; No trend information was available for the GE toxin-producing bacteria (Bacillus cereus, Clostridium perfringens and Staphylococcus aureus), hepatitis-E and toxoplasmosis. Trends in hospitalizations for gastro-enteritis as primary cause (ICD codes 2093; 558.9) were obtained from the National Medical Register. Age-specific excess mortality risks from campylobacteriosis and salmonellosis were assumed constant. Fatalities due to STEC O157 were from active surveillance. Age-specific case fatality ratios for norovirus and rotavirus, originally obtained from German surveillance data, and for protozoan pathogens, originally obtained from the international literature, were assumed constant.. 2.2. Model corrections Three coding errors in the 2009 model were corrected, both relating to acquired listeriosis. The probability of meningitis for 2009 was corrected from 39% to 30%. Including 2010 data did not change this estimate. A correction for comorbidity in fatal cases of acquired listeriosis by reducing the statistical life expectancy by 50% had not been implemented and is now included in the model. The proportion of children under 18 years among cases hospitalised for gastroenteritis was changed from 18 to 38% in 2009, this was 35% in 2010.. 2.3. Disease burden Disease burden calculations were not changed; hence all differences in results will reflect the impact of trends in the underlying information on demographics and pathogen incidence.. 2. http://statline.cbs.nl/statweb/, accessed 8 August 2011. Page 8 of 31.
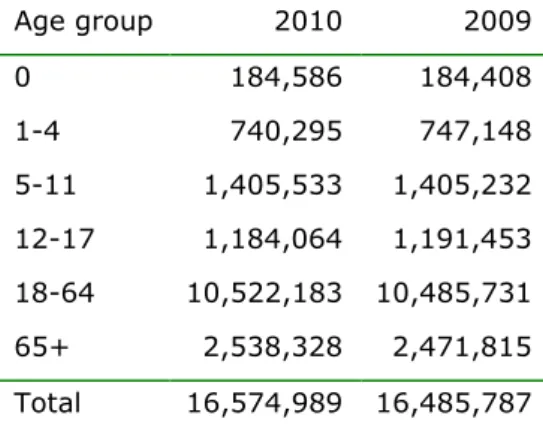
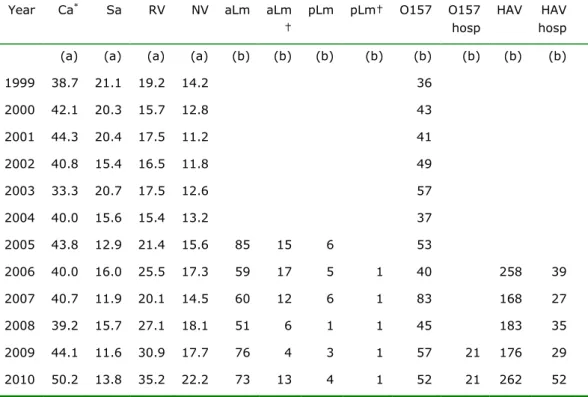
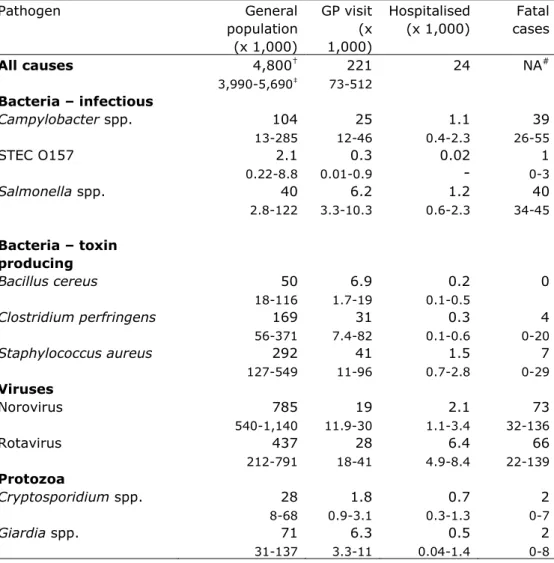
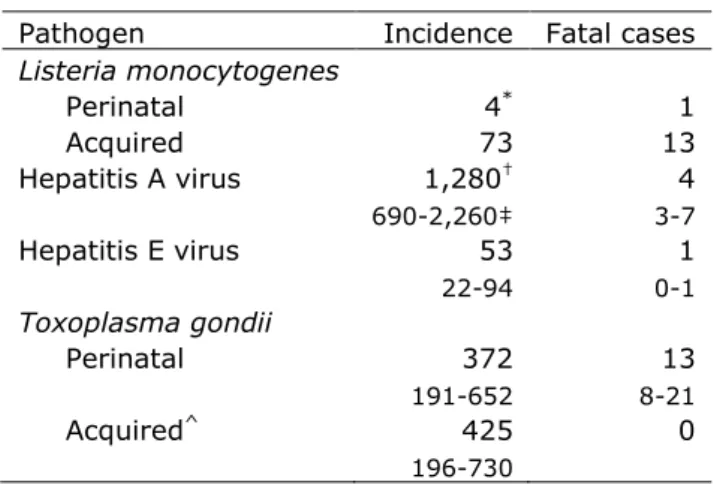
(10) RIVM Letter report 330331004. 3. Results. 3.1. Trend information The number of inhabitants in the Netherlands slightly increased from 16.5 million in 2009 to 16.6 million in 2010 (Table 1). There was a slight decrease in the number of persons below 18 years of age. Survival tables for 2010 were not available from Statline at the time of finalizing the model calculations for this report (01 November 2011). Therefore, the survival table for 2009 was used. The number of live births decreased slightly from 184,900 in 2009 to 184,400 in 2010 (Table 2). The age of mothers was fairly similar in the two years, although a decrease in the number of births from mothers between 35 and 39 years was observed, with a concomitant increase in the 30-34 years age group. The number of stillbirths (24 weeks or more gestational age) in 2010 was 648, the same as in 2009. The number of hospitalizations for gastroenteritis increased with 9% from 21,932 to 23,871. Trend information for specific pathogens is presented in Table 3. A summary of trends (in comparison with 2009) is discussed below: The incidence of campylobacteriosis (laboratory confirmed cases) increased by 14% from 44.1 to 50.2 cases per 100,000 inhabitants; there is no significant trend (p=0.19) since 1999. The incidence of salmonellosis (laboratory confirmed cases) increased by 19% from 11.6 to 13.8 per 100,000 inhabitants; nevertheless there is a significantly decreasing trend (p=0.001) since 1999. The incidence of gastroenteritis by rotavirus (laboratory confirmed cases) increased by 14% from 30.9 to 35.2 cases per 100,000 inhabitants; there is a significantly increasing trend (p<0.001) since 1999. The incidence of hospitalizations for viral gastroenteritis (a proxy for the incidence of gastroenteritis by norovirus) increased by 25% from 17.7 to 22.2 cases per 100,000 inhabitants; there is a significantly increasing trend (p<0.001) since 1999. The incidence of acquired listeriosis (active surveillance) was 73 cases, similar to 2009. There were 13 fatalities, considerably more than the 4 fatal cases in 2009. The statistical life expectancy of fatal cases was 13.7 years; in the DALY model half of this life expectancy is used for calculating years of life lost to correct for comorbidity. Including new data from 2010, the probability of developing meningitis as a consequence of acquired listeriosis was updated to 30% (95% confidence interval 25-36%). The incidence of perinatal listeriosis (active surveillance) was 4 cases with 1 fatality, similar to 2009. The incidence of diseases caused by STEC O157 (active surveillance) was 52 with 21 hospitalizations, similar to 2009. There were 2 fatal cases. The incidence of hepatitis A (notified cases) increased by 49% from 176 to 262 with 52 hospitalizations; there is no significant trend (p= 0.93 for incidence and p=0.45 for hospitalizations) since 2006.. 3.2. Disease incidence The incidence of gastroenteritis by pathogen, of non-gastrointestinal pathogens and sequelae by pathogen in 2010 is presented in Tables 4-6, and Figure 1. There were increases in the incidence of campylobacteriosis, salmonellosis, norovirus, and rotavirus at all levels of the surveillance pyramid while the incidence of listeriosis and giardiasis decreased slightly. For other pathogens, no trend information was available. The total number of cases by the 14 pathogens increased from 1,770,000 to 1,990,000. In comparison with 2009, there were Page 9 of 31.
(11) RIVM Letter report 330331004. considerably more fatal cases of listeriosis (14 vs. 4). Table 3 suggests that the incidence of fatal cases varies considerably over the years, with relatively low numbers in 2008 and 2009. 3.3. Disease burden by pathogen The burden by pathogen is presented in Table 7 and Figures 2-3. Because of the higher incidence, there was also an increase in the burden of campylobacteriosis, salmonellosis, norovirus, and rotavirus. Due to the high number of fatal cases, the burden of listeriosis also increased considerably (from 114 to 217 DALY), resulting in a corresponding increase in the burden per 1,000 cases. Perinatal listeriosis was the disease outcome with the highest individual burden among all pathogens (27.2 DALY per case). The total burden of the 14 pathogens increased with 10% from 13,500 to 14,900 DALY. The standardized burden (per 100,000) increased in parallel with the total burden. There were few changes in the individual burden with the exception of listeriosis, which increased from 1,450 to 2,820 DALY per 1,000 cases due to more fatal cases.. 3.4. Attribution Attribution results are presented in Tables 8-9. The burden of foodborne disease increased with 7% from 6,020 to 6,440 DALY. A particularly high increase was estimated in human-human transmitted disease, with 18% from 2,370 to 2,800 DALY (related to strong increases in virus incidence). Among food pathways, the highest burden was attributed to poultry (up 10% from 1,050 to 1,150 DALYs), followed by beef/mutton (up 3% from 951 to 981 DALY) and transmission by humans or animals (mainly infected food handlers, up 12% from 573 to 642 DALY). Foods from animal origin caused 50% of all cases but 72% of the burden due to food, indicating that the pathogens associated with these foods tend to cause more severe infections than pathogens associated with other foods.. Page 10 of 31.
(12) RIVM Letter report 330331004. 4. Discussion. The disease burden of 14 enteric pathogens increased from 13,500 DALY in 2009 to 14,400 DALY in 2010. The share of foodborne transmission in this burden increased from 6,020 to 6,440 DALY. The increase was a result of an increase in the incidence of cases by Campylobacter spp., Salmonella spp., norovirus, rotavirus and hepatitis A virus and an increase in fatal cases by Listeria monocytogenes. Of three of these (Campylobacter spp., Salmonella spp., and rotavirus), trend data are based on laboratory surveillance, for hepatitis A virus on disease notification. The observed increases in disease incidence in 2010 compared to 2009 are within the range of those in the previous decennium, except for the incidence of campylobacteriosis that was approximately 25% higher than in previous years (see Table 3). No explanation for this increase is available. For norovirus, no direct trend information is available, but is estimated from trends in hospitalisation for viral gastroenteritis, which includes also rotaviruses. Hence the trend in norovirus incidence may be overestimated. Even though the incidence of listeriosis was similar to previous years, the burden increased due to a higher incidence of fatal cases. The 2010 data were more similar to the long-term average; hence the burden of listeriosis in 2010 is a more accurate reflection of the public health impact of listeriosis in the Netherlands than the burden in 2009. There is no trend information available on bacterial toxins and toxoplasmosis while trends for Cryptosporidium spp. and Giardia spp. are extrapolated from trends until 2007, when systematic surveillance was discontinued. Attribution data used in this report are based on an expert elicitation study, conducted in 2006 (Havelaar et al., 2008). No timetrends in the expert estimates are available. As a consequence, the changes in incidence and burden as presented in this report need to be interpreted with care.. Page 11 of 31.
(13) RIVM Letter report 330331004. Acknowledgement. The authors thank Margaret Wilson (Risk Science International, Ottawa, Canada) for support in developing the stochastic simulation model.. Page 12 of 31.
(14) RIVM Letter report 330331004. References. Aalten M, De Jong A, Stenvers O, Braks M, Friesema I, Maassen K, Van Pelt W, Schimmer B, Geenen P. Staat van zoönosen 2010. Bilthoven, Rijksinstituut voor Volksgezondheid en Milieu, rapport 3302911007/2011. Havelaar, A. H.; Galindo, A. V.; Kurowicka, D., and Cooke, R. M. Attribution of foodborne pathogens using structured expert elicitation. Foodborne Pathog Dis 2008;5:649-656. Havelaar, A.H., Haagsma, J.A., M.-J.J., M., Kemmeren, J.M., Verhoef, L.P.B., Vijgen, S.M.C., Wilson, M., Friesema, I.H., Kortbeek, L.M., Van Duynhoven, Y.T.H.P., Van Pelt, W. Submitted for publication. Disease burden of food-related pathogens in the Netherlands, 2009.. Page 13 of 31.
(15) RIVM Letter report 330331004. Table 1. Population in the Netherlands by age group, 2009-10 Age group. 2010. 2009. 0. 184,586. 184,408. 1-4. 740,295. 747,148. 5-11. 1,405,533. 1,405,232. 12-17. 1,184,064. 1,191,453. 18-64. 10,522,183. 10,485,731. 2,538,328. 2,471,815. 16,574,989. 16,485,787. 65+ Total. Table 2. Live births by age of mothers in the Netherlands, 2009-10. Page 14 of 31. Age of mother. 2010. 2009. -19. 1,884. 1,953. 20-24. 16,417. 16,499. 25-29. 51,570. 51,459. 30-34. 69,420. 68,828. 35-39. 37,213. 38,637. 40-44. 7,565. 7,252. 45+. 328. 287. Total. 184,397. 184,915.
(16) RIVM Letter report 330331004. Table 3. Trends in incidence of food-related pathogens, 1999-2010 Ca*. Sa. RV. NV. aLm. aLm †. pLm. pLm†. O157. O157 hosp. HAV. HAV hosp. (a). (a). (a). (a). (b). (b). (b). (b). (b). (b). (b). (b). 1999. 38.7. 21.1. 19.2. 14.2. 36. 2000. 42.1. 20.3. 15.7. 12.8. 43. 2001. 44.3. 20.4. 17.5. 11.2. 41. 2002. 40.8. 15.4. 16.5. 11.8. 49. 2003. 33.3. 20.7. 17.5. 12.6. 57. 2004. 40.0. 15.6. 15.4. 13.2. 37. 2005. 43.8. 12.9. 21.4. 15.6. 85. 15. 6. 2006. 40.0. 16.0. 25.5. 17.3. 59. 17. 5. 1. 40. 258. 39. 2007. 40.7. 11.9. 20.1. 14.5. 60. 12. 6. 1. 83. 168. 27. 2008. 39.2. 15.7. 27.1. 18.1. 51. 6. 1. 1. 45. 183. 35. 2009. 44.1. 11.6. 30.9. 17.7. 76. 4. 3. 1. 57. 21. 176. 29. 2010. 50.2. 13.8. 35.2. 22.2. 73. 13. 4. 1. 52. 21. 262. 52. Year. 53. Data sources: see text *. Ca: Campylobacter spp.; Sa: Salmonella spp., RV: rotavirus, NV:. aLm: acquired listeriosis, pLm: perinatal listeriosis, †: fatal cases, O157: STEC O157, HAV: hepatitis-A virus, hosp: hospitalized. (a) per 100,000 inhabitants (b) reported cases. Page 15 of 31.
(17) RIVM Letter report 330331004. Table 4. Incidence of gastroenteritis by pathogen in the Netherlands, 2010 (population 16.5 million) Pathogen. All causes. General population (x 1,000) 4,800†. GP visit (x 1,000) 221. ‡. 73-512. 3,990-5,690. Bacteria – infectious Campylobacter spp. STEC O157 Salmonella spp.. Bacteria – toxin producing Bacillus cereus Clostridium perfringens Staphylococcus aureus Viruses Norovirus Rotavirus Protozoa Cryptosporidium spp. Giardia spp.. †. mean 2.5-97.5 percentile # not available ‡. Page 16 of 31. Hospitalised (x 1,000). Fatal cases. 24. NA#. 104. 25. 1.1. 39. 13-285. 12-46. 0.4-2.3. 26-55. 2.1. 0.3. 0.02. 1. 0.22-8.8. 0.01-0.9. -. 0-3. 40. 6.2. 1.2. 40. 2.8-122. 3.3-10.3. 0.6-2.3. 34-45. 0. 50. 6.9. 0.2. 18-116. 1.7-19. 0.1-0.5. 169. 31. 0.3. 4. 56-371. 7.4-82. 0.1-0.6. 0-20. 292. 41. 1.5. 7. 127-549. 11-96. 0.7-2.8. 0-29. 785. 19. 2.1. 73. 540-1,140. 11.9-30. 1.1-3.4. 32-136. 437. 28. 6.4. 66. 212-791. 18-41. 4.9-8.4. 22-139. 28. 1.8. 0.7. 2. 8-68. 0.9-3.1. 0.3-1.3. 0-7. 71. 6.3. 0.5. 2. 31-137. 3.3-11. 0.04-1.4. 0-8.
(18) RIVM Letter report 330331004. Table 5. Incidence of non-gastrointestinal pathogens in the Netherlands, 2010 Pathogen Listeria monocytogenes Perinatal Acquired Hepatitis A virus Hepatitis E virus Toxoplasma gondii Perinatal Acquired^. Incidence. Fatal cases. 4* 73 1,280†. 1 13 4. 690-2,260‡. 3-7. 53. 1. 22-94. 0-1. 372. 13. 191-652. 8-21. 425. 0. 196-730 *. No uncertainty because cases were acquired through active surveillance † mean ‡ 2.5-97.5 percentile ^ Chorioretinitis only. Page 17 of 31.
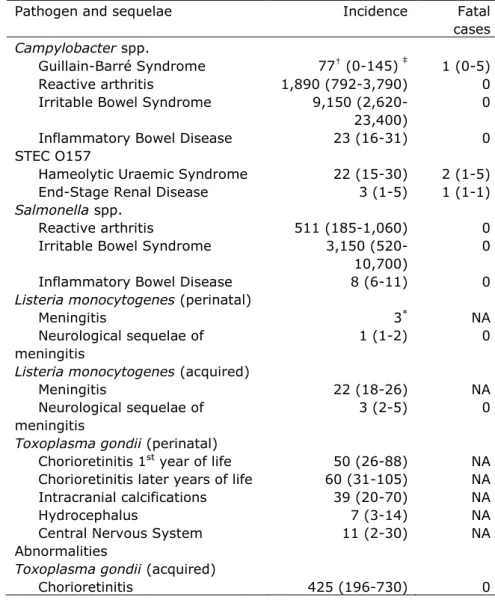
(19) RIVM Letter report 330331004. Table 6. Incidence of sequelae by pathogen in the Netherlands, 2010 Pathogen and sequelae Campylobacter spp. Guillain-Barré Syndrome Reactive arthritis Irritable Bowel Syndrome Inflammatory Bowel Disease STEC O157 Hameolytic Uraemic Syndrome End-Stage Renal Disease Salmonella spp. Reactive arthritis Irritable Bowel Syndrome Inflammatory Bowel Disease Listeria monocytogenes (perinatal) Meningitis Neurological sequelae of meningitis Listeria monocytogenes (acquired) Meningitis Neurological sequelae of meningitis Toxoplasma gondii (perinatal) Chorioretinitis 1st year of life Chorioretinitis later years of life Intracranial calcifications Hydrocephalus Central Nervous System Abnormalities Toxoplasma gondii (acquired) Chorioretinitis †. Incidence. Fatal cases. 77† (0-145) 1,890 (792-3,790) 9,150 (2,62023,400) 23 (16-31). ‡. 1 (0-5) 0 0. 22 (15-30) 3 (1-5). 2 (1-5) 1 (1-1). 511 (185-1,060) 3,150 (52010,700) 8 (6-11). 0 0. 3* 1 (1-2). NA 0. 22 (18-26) 3 (2-5). NA 0. 50 (26-88) 60 (31-105) 39 (20-70) 7 (3-14) 11 (2-30). NA NA NA NA NA. 425 (196-730). 0. mean 2.5-97.5 percentile * No uncertainty because cases were acquired through active surveillance Not applicable (fatal cases reported in Table 2) ‡. Page 18 of 31. 0. 0.
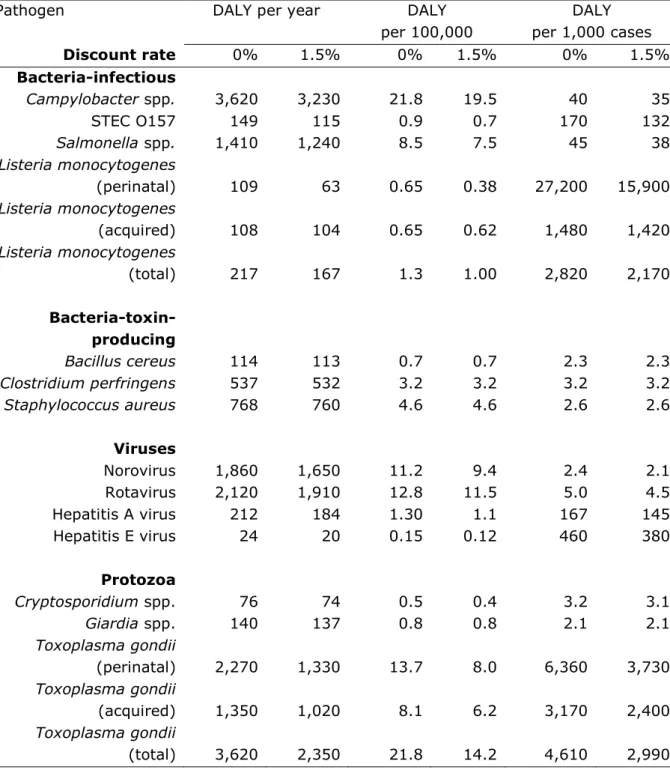
(20) RIVM Letter report 330331004. Table 7. Overall disease burden, disease burden per 100.000 inhabitants and mean disease burden per case of illness in the Netherlands, 2010 Pathogen Discount rate. DALY per year. DALY per 100,000. DALY per 1,000 cases. 0%. 1.5%. 0%. 1.5%. 0%. 1.5%. 3,620 149 1,410. 3,230 115 1,240. 21.8 0.9 8.5. 19.5 0.7 7.5. 40 170 45. 35 132 38. 109. 63. 0.65. 0.38. 27,200. 15,900. 108. 104. 0.65. 0.62. 1,480. 1,420. 217. 167. 1.3. 1.00. 2,820. 2,170. Bacteria-toxinproducing Bacillus cereus Clostridium perfringens Staphylococcus aureus. 114 537 768. 113 532 760. 0.7 3.2 4.6. 0.7 3.2 4.6. 2.3 3.2 2.6. 2.3 3.2 2.6. Viruses Norovirus Rotavirus Hepatitis A virus Hepatitis E virus. 1,860 2,120 212 24. 1,650 1,910 184 20. 11.2 12.8 1.30 0.15. 9.4 11.5 1.1 0.12. 2.4 5.0 167 460. 2.1 4.5 145 380. 76 140. 74 137. 0.5 0.8. 0.4 0.8. 3.2 2.1. 3.1 2.1. 2,270. 1,330. 13.7. 8.0. 6,360. 3,730. 1,350. 1,020. 8.1. 6.2. 3,170. 2,400. 3,620. 2,350. 21.8. 14.2. 4,610. 2,990. Bacteria-infectious Campylobacter spp. STEC O157 Salmonella spp. Listeria monocytogenes (perinatal) Listeria monocytogenes (acquired) Listeria monocytogenes (total). Protozoa Cryptosporidium spp. Giardia spp. Toxoplasma gondii (perinatal) Toxoplasma gondii (acquired) Toxoplasma gondii (total). Page 19 of 31.
(21) RIVM Letter report 330331004. Table 8. Attribution of the incidence, fatalities and disease burden to the major transmission pathways in the Netherlands, 2010 Transmission pathway Incidence (x 1000) Fatal cases Disease burden (DALY per year, not discounted) Disease burden (DALY per year, discounted) † ‡ *. Food. Environment. 725† 339-1,390. ‡. Animal. Travel. Total*. 255. 745. 98. 169. 1,990. 142-446. 459-1,190. 51-186. 93-300. 1,080-3,510. 89. 43. 88. 19. 29. 269. 54-159. 23-76. 37-171. 12-31. 17-51. 143-489. 6,440. 3,030. 2,800. 1,180. 1,450. 14,900. 3, 160-11,500. 1,900-4,830. 1,860-4,260. 690-2,090. 880-2,470. 8,950-25,100. 5,350. 2,400. 2,500. 1200. 1,250. 12,500. 2,840-9,990. 1,460-3,850. 1,630-3,850. 580-1,880. 740-2,090. 7,240-21,800. mean 2.5-97.5 percentile due to 14 pathogens included in this study. Page 20 of 31. Human.
(22) RIVM Letter report 330331004. Table 9. Attribution of the incidence, fatalities and disease burden of foodborne disease to food groups in the Netherlands, 2010 Food group Incidence (x 1000) Fatal cases Disease burden (DALY per year, not discounted) Disease burden (DALY per year, discounted) † ‡. Beef/ mutton 109†. Pork 46. 63. 23. 43-225. 20-91. 24-138. 9-50. ‡. Poultry. Eggs. Dairy. Fruit/ veg. 47. Beverages 17. Cereals. 57. Fish/ shellfish 64. Human/an imal 131. Total. 42. Other foods 125. 26-111. 33-113. 23-89. 8-33. 20-81. 56-242. 76-218. 340-1,390. 728. 9.9. 10. 15. 6.3. 7.5. 8.5. 7.0. 2.3. 3.6. 5.9. 14. 89. 5.6-21. 6.7-16. 9.8-22. 5.7-8.3. 5.2-12. 5.4-15. 3.6-15. 1.4-5.4. 2.1-6.9. 2.7-14. 6.6-27. 54-159. 981. 1330. 1,150. 269. 474. 429. 409. 108. 187. 470. 642. 6,450. 516-1,800. 822-2,080. 644-2,140. 143-546. 260-866. 254-737. 242-700. 59-206. 92-373. 199-992. 388-1,060. 3,620-11,500. 786. 949. 1,010. 240. 405. 367. 337. 98. 173. 433. 557. 5,350. 384-1,520. 564-1,540. 537-1,950. 118-510. 210-772. 208-653. 192-602. 50-192. 81-354. 175-944. 321-935. 2,840-9,980. mean 2.5-97.5 percentile. Page 21 of 31.
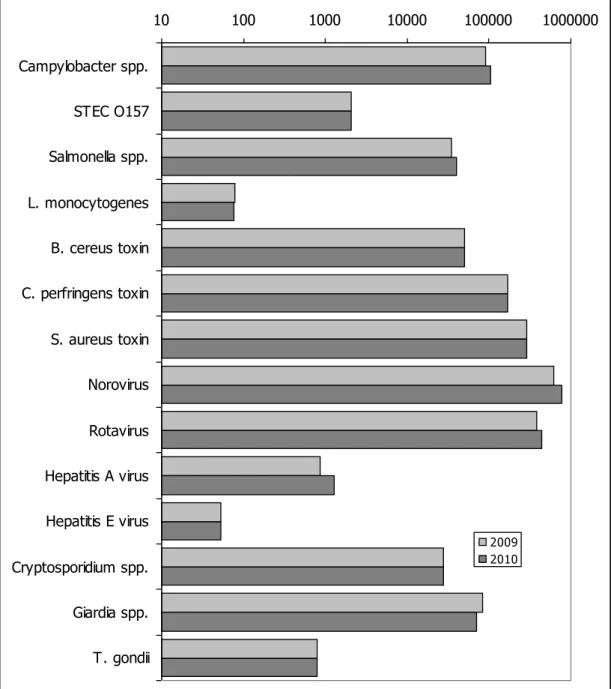
(23) RIVM Letter report 330331004. 10. 100. 1000. 10000. 100000. Campylobacter spp. STEC O157 Salmonella spp. L. monocytogenes B. cereus toxin C. perfringens toxin S. aureus toxin Norovirus Rotavirus Hepatitis A virus Hepatitis E virus Cryptosporidium spp.. 2009 2010. Giardia spp. T. gondii. Figure 1. Comparison of incidence of food-related pathogens in 2009 and 2010. Page 22 of 31. 1000000.
(24) RIVM Letter report 330331004. 0. 500. 1000. 1500. 2000. 2500. 3000. 3500. Campylobacter spp. STEC O157 Salmonella spp. L. monocytogenes B. cereus toxin C. perfringens toxin S. aureus toxin Norovirus Rotavirus Hepatitis A virus Hepatitis E virus Cryptosporidium spp.. 2009 2010. Giardia spp. T. gondii. Figure 2. Comparison of disease burden of food-related pathogens in 2009 and 2010. Page 23 of 31. 4000.
(25) RIVM Letter report 330331004. Annex. Detailed results Summary of results. Incidence Deaths Disease burden (per year) (per (DALY) Campylobacter 105388 39.4 3621 STEC O157 2134 4.0 149 L. monocytogenes 77 13.9 217 Salmonella 41165 39.5 1414 B. cereus toxine 49883 0.0 113 C. perfringens toxine 169038 4.5 537 S. aureus toxine 291961 7.2 769 Hepatitis-A virus 1283 4.1 212 Hepatitis-E virus 53 0.6 24 Norovirus 786972 73.0 1862 Rotavirus 443561 66.1 2122 C. parvum 28189 1.7 76 G. lamblia 71673 2.0 139 T. gondii 797 13.2 3616 Totaal 1992173 269 14871. Pathogen. Page 24 of 31.
(26) RIVM Letter report 330331004. Attribution to main pathways, all pathogens. Main pathway Incidence (per year) Deaths (per year) Disease burden (DALY) Disease burden (DALY, discounted). Food Environment 725279 254526 89 43 6439 3034 5345 2396. Human 745924 88 2805 2502. Animal 98135 19 1177 1023. Travel Total 169036 1992900 30 269 1450 14905 1248 12514. Attribution of incidence by pathogen to main pathways. Pathogen Campylobacter STEC O157 L. monocytogenes Salmonella B. cereus toxine C. perfringens toxine S. aureus toxine Hepatitis-A virus Hepatitis-E virus Norovirus Rotavirus C. parvum G. lamblia T. gondii Total. Food Environment 44263 22132 854 363 53 5 22640 5351 44894 499 153825 3381 254006 11678 141 141 7 13 133785 110176 57663 75405 3383 7893 9318 17202 447 287 725279 254526. Human 6323 213 4 3705 499 3381 8759 231 4 432835 257265 7611 25086 8 745924. Animal 20024 448 4 3705 499 3381 5839 0 6 39349 13307 3665 7884 24 98135. Reizen Total 12647 105389 256 2134 10 76 5763 41164 3492 49883 5071 169039 11678 291960 770 1283 23 53 70827 786972 39920 443560 5638 28190 12901 72391 40 806 169036 1992900. Page 25 of 31.
(27) RIVM Letter report 330331004. Attribution of deaths by pathogen to main pathways. Pathogen Campylobacter STEC O157 L. monocytogenes Salmonella B. cereus toxine C. perfringens toxine S. aureus toxine Hepatitis-A virus Hepatitis-E virus Norovirus Rotavirus C. parvum G. lamblia T. gondii Total. Page 26 of 31. Food 16.6 1.6 9.7 21.7 0.0 4.1 6.3 0.4 0.1 12.4 8.6 0.2 0.3 7.3 89.3. Environment 8.3 0.7 1.0 5.1 0.0 0.1 0.3 0.4 0.2 10.2 11.2 0.5 0.5 4.7 43.2. Human 2.4 0.4 0.7 3.6 0.0 0.1 0.2 0.7 0.0 40.2 38.3 0.4 0.7 0.1 87.9. Animal 7.5 0.8 0.7 3.6 0.0 0.1 0.1 0.0 0.1 3.7 2.0 0.2 0.2 0.4 19.3. Reizen 4.7 0.5 1.8 5.5 0.0 0.1 0.3 2.4 0.3 6.6 5.9 0.3 0.4 0.7 29.5. Totaal 39.4 4.0 13.9 39.5 0.0 4.5 7.2 4.1 0.6 73.0 66.1 1.7 2.0 13.2 269.2.
(28) RIVM Letter report 330331004. Attribution of disease burden (DALY per year, undiscounted) to main pathways. Pathogen Campylobacter STEC O157 L. monocytogenes Salmonella B. cereus toxine C. perfringens toxine S. aureus toxine Hepatitis-A virus Hepatitis-E virus Norovirus Rotavirus C. parvum G. lamblia T. gondii Total. Food Environment 1521 760 60 25 150 15 778 184 102 1 489 11 669 31 23 23 3 6 316 261 276 361 9 21 18 33 2025 1302 6439 3034. Human 217 15 11 127 1 11 23 38 2 1024 1231 20 49 36 2805. Animal 688 31 11 127 1 11 15 0 3 93 64 10 15 108 1177. Reizen Total 434 3620 18 149 28 215 198 1414 8 113 16 538 31 769 127 211 10 24 168 1862 191 2123 15 75 25 140 181 3652 1450 14905. Page 27 of 31.
(29) RIVM Letter report 330331004. Attribution to food groups, all pathogens. Food group Incidence (per year) Deaths (per year) Disease burden (DALY) Disease burden (DALY, discounted). Page 28 of 31. Beef & Fish & Beverag Other Lamb Pork Poultry Eggs Dairy shellfish Produce es Grains foods 109255 45985 63731 23136 57490 63760 47416 17362 42578 125440 9.9 10.0 14.5 6.3 7.5 8.5 7.0 2.3 3.6 5.9 980.0 1331.0 1150.0 269.0 473.0 428.0 409.0 106.0 187.0 472.0 785.0 948.0 1009.0 242.0 405.0 367.0 339.0 97.0 172.0 437.0. Humans & animals 131678 14.0 642.0 550.0. Total 727683 88.9 6420.0 5327.0.
(30) RIVM Letter report 330331004. Attribution of incidence by pathogen to food groups. Pathogen Campylobacter STEC O157 L. monocytogenes Salmonella B. cereus toxine C. perfringens toxine S. aureus toxine Hepatitis-A virus Hepatitis-E virus Norovirus Rotavirus C. parvum G. lamblia T. gondii Total. Beef & Lamb 1771 376 6 2943 3143 73836 20320 0 0 4014 0 879 1864 103 109255. Pork Poultry 2213 23902 51 26 5 4 3170 3396 1347 898 12306 10768 20320 20320 0 0 5 0 4014 4014 1730 0 135 101 466 280 223 22 45985 63731. Eggs 1328 17 2 4981 1796 4615 7620 0 0 2676 0 101 0 0 23136. Fish & Beverag Dairy shellfish Produce es Grains 3984 3098 2213 885 885 60 26 60 34 26 13 10 4 2 3 1585 906 1358 679 906 2694 898 898 898 7632 6153 9229 10768 3076 4615 38101 15240 5080 5080 17780 0 18 18 6 6 0 0 1 0 0 2676 21406 9365 4014 6689 1153 10956 13839 2307 4036 304 744 710 101 0 745 1211 3075 280 0 22 18 27 0 0 57490 63760 47416 17362 42578. Other foods 1328 34 3 1358 24243 12306 76202 4 0 6689 2883 101 280 9 125440. Humans & animals 2213 145 3 1358 898 6153 30481 89 1 68230 20759 203 1118 27 131678. Total 43820 855 55 22640 45345 153825 256544. 133787 57663 3379 9319 451 727683. Page 29 of 31.
(31) RIVM Letter report 330331004. Attribution of deaths by pathogen to food groups. Pathogen Campylobacter STEC O157 L. monocytogenes Salmonella B. cereus toxine C. perfringens toxine S. aureus toxine Hepatitis-A virus Hepatitis-E virus Norovirus Rotavirus C. parvum G. lamblia T. gondii Total. Page 30 of 31. Beef & Lamb 0.7 0.7 1.1 2.8 0.0 2.0 0.5 0.0 0.0 0.4 0.0 0.1 0.1 1.7 9.9. Pork Poultry 0.8 8.9 0.1 0.0 0.9 0.7 3.0 3.3 0.0 0.0 0.3 0.3 0.5 0.5 0.0 0.0 0.1 0.0 0.4 0.4 0.3 0.0 0.0 0.0 0.0 0.0 3.7 0.4 10.0 14.5. Eggs 0.5 0.0 0.4 4.8 0.0 0.1 0.2 0.0 0.0 0.2 0.0 0.0 0.0 0.0 6.3. Fish & Beverag Dairy shellfish Produce es Grains 1.5 1.2 0.8 0.3 0.3 0.1 0.0 0.1 0.1 0.0 2.4 1.7 0.8 0.3 0.6 1.5 0.9 1.3 0.7 0.9 0.0 0.0 0.0 0.0 0.0 0.2 0.2 0.3 0.1 0.1 0.9 0.4 0.1 0.1 0.4 0.0 0.1 0.1 0.0 0.0 0.0 0.0 0.0 0.0 0.0 0.2 2.0 0.9 0.4 0.6 0.2 1.6 2.1 0.3 0.6 0.0 0.0 0.0 0.0 0.0 0.0 0.0 0.1 0.0 0.0 0.4 0.3 0.4 0.0 0.0 7.5 8.5 7.0 2.3 3.6. Other foods 0.5 0.1 0.6 1.3 0.0 0.3 1.9 0.0 0.0 0.6 0.4 0.0 0.0 0.1 5.9. Humans & animals Total 0.8 16.4 0.3 1.6 0.5 9.9 1.3 21.7 0.0 0.0 0.2 4.1 0.8 6.3 0.3 0.4 0.0 0.1 6.3 12.4 3.1 8.6 0.0 0.2 0.0 0.3 0.4 7.4 14.0 89.4.
(32) RIVM Letter report 330331004. Attribution of disease burden (DALY per year, undiscounted) to food groups. Pathogen Campylobacter STEC O157 L. monocytogenes Salmonella B. cereus toxine C. perfringens toxine S. aureus toxine Hepatitis-A virus Hepatitis-E virus Norovirus Rotavirus C. parvum G. lamblia T. gondii Total. Beef & Lamb 61 26 16 101 7 235 53 0 0 9 0 2 4 466 980. Pork Poultry 76 821 4 2 13 10 109 117 3 2 39 34 53 53 0 0 3 0 9 9 8 0 0 0 1 1 1013 101 1331 1150. Eggs 46 1 6 171 4 15 20 0 0 6 0 0 0 0 269. Fish & Beverag Dairy shellfish Produce es Grains 137 106 76 30 30 4 2 4 2 2 37 27 12 4 9 54 31 47 23 31 6 2 2 2 17 20 29 34 10 15 100 40 13 13 47 0 3 3 1 1 0 0 0 0 0 6 51 22 9 16 6 52 66 11 19 1 2 2 0 0 1 2 6 1 0 101 81 122 0 0 473 428 409 106 187. Other foods 46 2 9 47 55 39 201 1 0 16 14 0 1 41 472. Humans & animals 76 10 7 47 2 20 80 15 0 161 99 1 2 122 642. Total 1505 59 150 778 102 490 673. 314 275 8 19 2047 6420. Page 31 of 31.
(33) Disease burden of food-related pathogens in the Netherlands, 2012 RIVM Letter Report 330331004/2012 A.H. Havelaar | I.H.M. Friesema | W. van Pelt. National Institute for Public Health and the Environment P.O. Box 1 | 3720 BA Bilthoven www.rivm.com.
(34)
Afbeelding
+4
GERELATEERDE DOCUMENTEN
Bereken het buigend moment op de hefboom en de benodigde diameter van de hefboom.. Oefenopgaven Leerjaar 2 periode 4 11
Eigenlijk is het moment in punt D nul maar door het extern moment van 10 kNm zit er een piek van 10 kNm.. Gelijkmatige belasting: Eigen gewicht van de balk is 12 kN
volgens een vruchtwisselingsschema met een 4- of 5-jarige cyclus. De opvolging van gewassen is in grote lijnen te voorspellen, maar zal van tevoren moeten worden nagevraagd
Again, on most farms, positive results for vaginal swabs in goats and/or sheep were accompanied by positive results for the surface area swabs taken on the same farm, and vice
The parts that make up a reinforcement learning algorithm are typically the policy (which maps states to actions), a reward function (returns a numerical evaluation of the
To understand the connection between the fairy tale tourism in Croatia and its visitors, the following research question is formed: In what ways and to what extent
corrigeren van morfosyntactische fouten, waardoor er minder aandachtscapaciteit voor de coherentie over is en hierdoor een slechtere coherentie verwacht wordt. Bij
Deze beschouwing over het spanningsveld tussen insecten als voorbeeld van vooruitgang en als mogelijke oorzaak van degeneratie krijgt een extra dimensie dankzij het verhaal over
