s
Greenhouse gas mitigation scenarios
for major emitting countries
Analysis of current climate policies and mitigation pledges
(Update: November 2016)
Authors:
Takeshi Kuramochi, Niklas Höhne, Sofia Gonzales-Zuñiga, Frederic Hans,
Sebastian Sterl, Markus Hagemann, Erika Hernandez Legaria (NewClimate
Institute); Michel den Elzen, Mark Roelfsema, Heleen van Soest (PBL
Netherlands Environmental Assessment Agency); Nicklas Forsell, Olga
Turkovska (IIASA)
November 2016
Greenhouse gas mitigation scenarios
for major emitting countries
Analysis of current climate policies and mitigation pledges
(Update: November 2016)
Authors:
Takeshi Kuramochi, Niklas Höhne, Sofia Gonzales-Zuñiga, Frederic Hans,
Sebastian Sterl, Markus Hagemann, Erika Hernandez Legaria (NewClimate
Institute); Michel den Elzen, Mark Roelfsema, Heleen van Soest (PBL
Netherlands Environmental Assessment Agency); Nicklas Forsell, Olga
Turkovska (IIASA)
Greenhouse gas mitigation
scenarios for major emitting
countries
Analysis of current climate policies and mitigation
pledges (Update: November 2016)
Project number
15032
© NewClimate Institute 2016
Lead authors:
Takeshi Kuramochi, Niklas Höhne, Sofia Gonzales-Zuñiga, Frederic Hans, Sebastian Sterl, Markus Hagemann (NewClimate Institute)
Michel den Elzen, Mark Roelfsema, Heleen van Soest (PBL Netherlands Environmental Assessment Agency) Nicklas Forsell, Olga Turkovska (IIASA)
Contributing authors:
Erika Hernandez Legaria (NewClimate Institute), Annemiek Admiraal (PBL), Petr Havlik (IIASA), Michael Obersteiner (IIASA)
This report has been prepared by PBL/NewClimate Institute/IIASA under contract to DG CLIMA (EC Service contract N° 340201/2015/717962/SERJCLIMA.A4) started in December 2015.
This project is funded by the EU:
Disclaimer
The information and views set out in this study are those of the authors and do not necessarily reflect the official opinion of the Commission. The Commission does not guarantee the accuracy of the data included in this study. Neither the Commission nor any person acting on the Commission’s behalf can be held responsible for the use of any information from this study.
Executive Summary
This report provides an overview of projected greenhouse gas emissions in 25 major emitting countries/regions (Argentina, Australia, Brazil, Canada, Chile, China, Colombia, Democratic Republic of the Congo, Ethiopia, the European Union, India, Indonesia, Japan, Kazakhstan, Mexico, Morocco, the Philippines, Republic of Korea, the Russian Federation, South Africa, Saudi Arabia, Thailand, Turkey, Ukraine, and the United States) up to 2030, taking into account the emission trajectories based on current policies and the implementation of intended nationally determined contributions (INDCs) and nationally determined contributions (NDCs).
Current policies scenarios assume that no additional mitigation action is taken beyond currently implemented climate policies, even if it results in 2020 pledges and 2030 targets not being achieved - or being overachieved. Whenever possible, current policies trajectories reflect all adopted and implemented policies, defined here as legislative decisions, executive orders, or their equivalent. This excludes publicly announced plans or strategies, while individual policies to implement such plans or strategies would qualify. Ultimately, however, these definitions could be interpreted differently, and therefore this assessment is bound by the interpretations that our research group uses. This definition of current policies scenario is consistent with that applied in the UNEP Emissions Gap Report (UNEP, 2015).
The findings of the current study are:
The degree to which countries/regions are likely to achieve their self-chosen 2030 targets under current policies was found to vary: of those considered in this report, Brazil, Chile, China, India, the Russian Federation, Turkey and Ukraine are likely to - or are roughly on track to - (over) achieve their (unconditional) 2030 targets with currently implemented policies. Argentina, Australia, Canada, Colombia, Democratic Republic of the Congo, Ethiopia, the EU, Indonesia, Japan, Kazakhstan, Mexico, Morocco, Republic of Korea, Saudi Arabia, South Africa, Thailand, the Philippines and the United States require additional measures to achieve their 2030 targets.
Currently implemented policies are projected to influence GHG emissions but do not stop emissions from increasing until 2030 (above 2010 levels) in Argentina, Australia, Chile, China, India, Indonesia, Kazakhstan, Mexico, Morocco, the Philippines, Saudi Arabia, South Africa, Thailand and Turkey, mainly due to their projected high economic growth. GHG emissions in Brazil, Canada, South Korea, the Russian Federation, Ukraine and the United States would remain stable at approximately current levels with the currently implemented policies. In Colombia, Japan and the EU, GHG emissions are projected to decrease further under current policies.
Figure ES-1: Progress of countries to achieve their self-chosen 2030 targets under current policies. Note: current policies do not include implementation measures that are under development at the time of publication.
It should be noted that a country being likely to meet its NDC/INDC does not necessarily mean that it undertakes more stringent action on mitigation than a country that is not on track due to a number of reasons. First, the targets differ in their ambition levels across countries because they are nationally determined and heterogeneous by nature. Second, it has only been less than two years since the countries formulated their NDCs/INDCs. It is not surprising to see a gap between the mitigation targets and current policies trajectories if countries pledged something above what they would have achieved anyway.
Nevertheless, it is essential that the gaps between the mitigation targets and current policies trajectories begin to close in the years to come as countries adopt implementation measures. For this reason, it is essential that this report, and similar efforts, are updated in the years to come.
Uncertainty around future estimates remains high. In Japan, for example, decisions on the future of nuclear power will strongly influence the development of emissions in the power sector. In the Republic of Korea, the enforcement of their emissions trading system may have a significant impact, even though that alone is not enough to achieve the national target. In Australia, the effect of policies replacing the carbon pricing mechanism is difficult to assess. China and India have pledges indexed to economic growth, implying that the absolute emissions target level is very uncertain. Emissions projections for Turkey and many developing countries are subject to considerable uncertainty around economic growth. In Argentina, Colombia, Democratic Republic of the Congo, Ethiopia, Indonesia and the Philippines, emissions from land use, land use change, and forestry (LULUCF), which are very uncertain, strongly determine total emission projections.
It is also worth noting that, for several countries, the GHG emissions projections under current policies have been revised considerably downward for a number of countries (Australia, China, and Japan) since our last assessment (den Elzen et al., 2015), which is partly attributable to a faster-than-expected transition towards low-carbon economy through deployment of renewable energy and energy efficiency, as well as the recent slowdown of global economic growth.
Table of Contents
Executive Summary ... i
Table of Contents ... iii
Acronyms... iv
Acknowledgements ... vi
1 Introduction ... 1
2 Main findings ... 3
3 Results per country ... 5
3.1 Argentina ... 6 3.2 Australia ... 9 3.3 Brazil ... 12 3.4 Canada ... 15 3.5 Chile ... 17 3.6 China ... 20 3.7 Colombia ... 23
3.8 Democratic Republic of the Congo (DRC) ... 26
3.9 Ethiopia ... 28 3.10 European Union ... 31 3.11 India ... 33 3.12 Indonesia ... 36 3.13 Japan ... 39 3.14 Kazakhstan ... 42 3.15 Mexico ... 45 3.16 Morocco ... 47 3.17 Philippines ... 50 3.18 Republic of Korea ... 53 3.19 Russian Federation ... 56 3.20 Saudi Arabia ... 58 3.21 South Africa ... 61 3.22 Thailand ... 64 3.23 Turkey ... 67
3.24 United States of America ... 69
3.25 Ukraine ... 72
Appendix ... 75
A1: Notes on historical emission data ... 75
A2: Notes on population data ... 75
A3: Overview of GHG emissions projections by country ... 76
Acronyms
AFOLU agriculture, forestry and other land use
AR4 IPCC’s FourthAssessment Report BAU business as usual
CAT Climate Action Tracker
CH4 methane
CNG compressed natural gas CO2 carbon dioxide
CO2e carbon dioxide equivalent
COP21 UNFCCC Conference of the Parties 21st session (Paris)
CPP United States of America’s Clean Power Plan CSP concentrated solar power
ECDBC Colombian Low-Carbon Development Strategy
EDGAR Emissions Database for Global Atmospheric Research
EPA United States of America’s Environmental Protection Agency ERF Emissions Reduction Fund
ETS emissions trading system
FAIR PBL’s Framework to Assess International Regimes for differentiation of commitments
NF3 nitrogen trifluoride
F-gas fluorinated greenhouse gas
G4M IIASA’s Global Forest Model GCF Green Climate Fund GDP gross domestic product
GHG greenhouse gas
GLOBIOM IIASA's Global Biosphere Management Model
Gt gigatonne (billion tonnes)
GTP I Ethiopia’s First Growth and Transformation Plan
GW gigawatt (billion watts)
GWh gigawatt-hour (billionwatts per hour) GWP Global Warming Potential
ha Hectare
HEPS High Energy Performance Standards
HFC hydrofluorocarbon
IEA International Energy Agency
IIASA International Institute for Applied Systems Analysis
IMAGE PBL’s Integrated Model to Assess the Global Environment
INDC intended nationally determined contribution
IPCC Intergovernmental Panel on Climate Change
IPPU Industrial Processes and Product Use
JCM Joint Crediting Mechanism
km/l kilometre per litre
ktoe thousand tonnes of oil equivalent
kWh kilowatt-hour (thousand watts-hour) LPG liquefied petroleum gas
LULUCF land use, land use change, and forestry
MEPS Minimum Energy Performance Standards
MJ megajoule (million joules)
Mm3 mega cubic meters (million cubic metres)
mpg miles per gallon
NDC nationally determined contribution NOX nitrogen oxides
NRE New and Renewable Energies
OECD Organisation for Economic Co-operation and Development
PAT (India’s) Perform Achieve and Trade scheme PBL PBL Netherlands Environmental Assessment Agency PES Payments for Ecosystem Services
PFC perfluorocarbon
PV photovoltaic
RE renewable energy
REC Renewable Energy Certificate
REDD+ Reducing Emissions from Deforestation and Forest Degradation and the role of conservation,
sustainable management of forests and enhancement of forest carbon stocks in developing countries
REDD-PAC REDD+ Policy Assessment Centre
RET Renewable Energy Target RPS renewable portfolio standards SAR Second Assessment Report SF6 sulphur hexafluoride
SSP2 Shared Socio-economic Pathways middle scenario
t tonne (thousand kilograms) tce tonne coal equivalent (29.288 GJ)
TIMER PBL’s Targets IMage Energy Regional Model
TPES total primary energy supply
TWh terawatt-hour
SENER Mexico’s Secretariat of Energy
UN United Nations
UNEP United Nations Environment Programme
UNFCCC United Nations Framework Convention on Climate Change
Acknowledgements
The project was financed by the European Commission, Directorate General Climate Action (DG CLIMA). The report and the calculations have benefited from comments by Tom van Ierland and Miles Perry, Silvia Vera Garcia, Alessandra Sgobbi and Maddalena Dali (DG CLIMA). We also thank all colleagues involved, in particular Pieter Boot, Andries Hof and Detlef van Vuuren (PBL), Maria Jose de Villafranca Casas and Eva Moser (NewClimate Institute), with a special thanks to Marian Abels (PBL) for the graphic design work and Cindy Baxter for her editorial work. The calculations by NewClimate Institute are largely based on its analyses for, and informed by, the Climate Action Tracker project jointly carried out with Ecofys and Climate Analytics.
This report has been prepared by PBL/NewClimate Institute/IIASA under contract to DG CLIMA (EC Service contract N° 340201/2015/717962/SERJCLIMA.A4) started in December 2015.
1 Introduction
The 21st session of the Conference of the Parties (COP21) to the United Nations Framework Convention on
Climate Change (UNFCCC) held in 2015, adopted the Paris Agreement as the new international climate policy agreement for the post-2020 period (UNFCCC, 2015a). In the lead-up to COP21, governments were asked to put forward offers on how - and by how much - they were willing to reduce their greenhouse gas (GHG) emissions after 2020; these are so-called “intended nationally determined contributions” (INDCs).1 Nearly 200 countries
submitted their INDCs before the COP21 (UNFCCC, 2015c). To date,2 81 Parties covering more than 60% of
global GHG emissions have ratified the Paris Agreement, when their INDCs became “nationally determined contributions” (NDCs).
This report presents an assessment of progress by 25 countries on the achievement of the mitigation part of the 2030 targets (NDCs and INDCs) presented in the context of the Paris Agreement as well as on their 2020 pledges in the UNFCCC Cancún Agreements. More specifically, it provides an overview of projected greenhouse gas (GHG) emissions in 25 major emitting countries/regions (Argentina, Australia, Brazil, Canada, Chile, China, Colombia, Democratic Republic of the Congo, Ethiopia, the European Union, India, Indonesia, Iran, Japan, Kazakhstan, Mexico, Morocco, the Philippines, Republic of Korea, the Russian Federation, South Africa, Saudi Arabia, Thailand, Turkey, Ukraine, and the United States) up to 2030, taking into account the emissions trajectories based on the most effective current climate and energy policies, as well as the full implementation of NDCs and INDCs. The 25 countries comprised 79% of total global GHG emissions in 2012 (JRC/PBL, 2014).3
It should be noted that a country being likely to meet its NDC/INDC does not necessarily mean that it undertakes more stringent action on mitigation than a country that is not on track for a number of reasons. First, the targets differ in their ambition levels across countries because they are nationally determined and heterogeneous by nature. Second, it has only been less than two years since the countries formulated their NDCs/INDCs. It is not surprising to see a gap between the mitigation targets and current policies trajectories if countries pledged something above what they would have achieved anyway. Third, countries have different policy-making approaches. Some countries use their pledges or targets as a device to drive more ambitious policies, while others use them merely to formalise the expected effect of existing measures.
Nevertheless, gaps between the mitigation targets and current policies trajectories may close in the years to come as countries adopt implementation measures. For this reason, it is essential that this report, and similar efforts, is updated in the years to come.
In this report, current policies scenarios assume that no additional mitigation action is taken beyond currently implemented climate policies, even if it results in 2020 pledges and 2030 targets not being achieved or being overachieved. Whenever possible, current policies trajectories reflect all adopted and implemented policies, which are defined here as legislative decisions, executive orders, or their equivalent. This excludes publicly announced plans or strategies, while individual policies to implement such plans or strategies would qualify. Ultimately, however, these definitions could be interpreted differently, and therefore this assessment is bound by the interpretations that our research group uses. This definition of current policies scenario is consistent with that applied in the UNEP Emissions Gap Report (UNEP, 2015).
This report builds upon our earlier studies (den Elzen et al., 2015, Fekete et al., 2015), which provide an overview of projected greenhouse gas emissions of 13 major emitting countries (Australia, Brazil, Canada, China, the European Union, India, Indonesia, Japan, Mexico, the Russian Federation, South Korea, Turkey, and the United States) out to 2030. In contrast to the earlier studies, which presented planned policies scenario and/or enhanced policies scenario projections, this report exclusively focuses on the analysis of current policies scenarios and
1 UNFCCC decision 1/CP.19, http://unfccc.int/resource/docs/2013/cop19/eng/10a01.pdf#page=3 2 As of 17 October, 2016.
3 The emissions data from the EDGAR database excludes short-cycle biomass burning (e.g. agricultural waste
burning and Savannah burning) but includes other biomass burning (e.g. forest fires, post-burn decay, peat fires and decay of drained peatlands).
NDCs/INDCs.4 The NDC/INDC analysis is estimated by NewClimate Institute, as described in detail in Climate
Action Tracker (CAT, 2015) and by PBL/IIASA in Admiraal et al. (2015) and Den Elzen et al. (2016a).
This report extends these earlier analyses, in several ways. First, we analyse the impact of more and updated current policies and INDCs. Second, we look at the current state of affairs with national policies.
NewClimate Institute, IIASA and PBL have estimated the impact of the most effective current policies on greenhouse gas emissions. The selection of current policies was based on literature research and expert knowledge. The calculations by NewClimate Institute are largely based on its analyses for, and informed by, the Climate Action Tracker project jointly carried out with Ecofys and Climate Analytics (CAT, 2016), and used existing scenarios from national and international studies (e.g. IEA's World Energy Outlook 2015) as well as their own calculations of the impact of individual policies in different subsectors.
PBL has updated their calculations of the impact of individual policies in different subsectors using the IMAGE integrated assessment modelling framework (Stehfest et al., 2014), including a global climate policy model (FAIR), a detailed energy-system model (TIMER), and a land-use model (IMAGE land). The starting point for the calculations of the impact of climate policies is the latest SSP2 (no climate policy) baseline as implemented in the IMAGE model (van Vuuren et al., 2016). Both NewClimate and PBL scenario calculations were supplemented with those on land-use and agricultural policies using IIASA's global land-use model GLOBIOM and global forest model G4M.
There are a number of methodological limitations related to the current assessment, which are largely attributable to the differences in the nature and characteristics of NDCs/INDCs and climate policies across countries.
First, this report considers a wide range of effective national climate and energy policies, but does not provide a complete assessment of all policies. This has the risk of underestimating or overestimating the total impact of a country’s policies on GHG emissions.
Second, existing policies may change and/or be abandoned for a variety of reasons, and new policies may be implemented. This implies that all numbers are subject to change; this study provides the current state of play.
Third, countries are implementing policies in various areas to a varying degree. Many countries have set renewable energy targets, which are to be achieved by national support policies. For some countries, in particular the non-OECD countries, there is not enough information about the implementation status. For some countries, we have assumed a full implementation of those targets without sufficient evidence of concrete support policies, in some cases by considering other factors (e.g. historical trends and projections from other studies), but this has the risk of overestimating the reductions.
Fourth, for bottom-up calculations performed by NewClimate Institute using external emissions scenarios from various sources, it is not always fully clear how the impacts of existing policy measures are quantified.
The main findings for the current policies scenarios are presented in fact sheets below, followed by an Appendix with a brief description of the datasets used in this study as well as an overview table of GHG emissions under NDCs/INDCs and current policies. Detailed descriptions of the quantification of future GHG emissions under NDCs/INDCs and current policies are provided as supplementary information for each country on the NewClimate Institute website.5
2 Main findings
The findings of the current study are:
The degree to which countries/regions are likely to achieve their pledges under current policies was found to vary: of those considered in this report, Brazil, Chile, China, India, the Russian Federation, Turkey and Ukraine are likely or roughly on track to (over-) achieve their (unconditional) 2030 targets. Argentina, Australia, Canada, Colombia, Democratic Republic of the Congo, Ethiopia, the EU, Indonesia, Japan, Kazakhstan, Mexico, Morocco, Republic of Korea, Saudi Arabia, South Africa, Thailand, the Philippines and the United States require additional measures to achieve their 2030 targets.
Currently implemented policies were projected to influence GHG emissions but do not stop emissions from increasing in Argentina, Australia, Chile, China, India, Indonesia, Kazakhstan, Mexico, Morocco, the Philippines, Saudi Arabia, South Africa, Thailand and Turkey until 2030 compared to 2010 levels, mainly due to their projected high economic growth. GHG emissions in Brazil, Canada, South Korea, the Russian Federation, Ukraine and the United States would remain stable approximately at current levels with the currently implemented policies. In Colombia, Japan and the EU, GHG emissions were projected to decrease further under current policies.
Figure 1: Progress of countries achieve their 2030 targets under current policies. Note: current policies do not include implementation measures that are under development at the time of publication.
Uncertainty around future estimates remains high:
In Japan, for example, decisions on the future of nuclear power will strongly influence the development of emissions in the power sector.
In the Republic of Korea, the enforcement of its emissions trading system may have significant impact, even though that alone is not enough to achieve the national target. In Australia, the effect of policies replacing the carbon pricing mechanism is difficult to assess.
China and India have pledges indexed to economic growth, implying that the absolute emission target level is very uncertain.
Emissions projections for Turkey and many developing countries are subject to considerable uncertainty related to economic growth.
In Argentina, Colombia, Democratic Republic of the Congo, Ethiopia, Indonesia and the Philippines, emissions from land use, land use change, and forestry (LULUCF), which are very uncertain, strongly determine total emission projections.
It is also worth noting that, for several countries, the GHG emissions projections under current policies have been revised downward considerably for a number of countries (Australia, China, and Japan) since our last assessment
(den Elzen et al., 2015), which is partly attributable to a larger-than-expected GHG emissions reductions through deployment of renewable energy and energy efficiency as well as the recent slowdown of global economic growth.
3 Results per country
This section summarises the results per country for current policies, 2020 pledges, and 2030 targets (NDCs/INDCs). For each country section, the following are presented:
Description of 2020 pledge and NDC/INDC Overview of key climate change mitigation policies Impact of climate policies on greenhouse gas emissions
Detailed explanations on the historical GHG emissions data and the population data used in this study are explained in the Appendix (sections A1 and A2). Details of NDC/INDC quantification and current policies projections are described in the Supporting Information.
3.1 Argentina
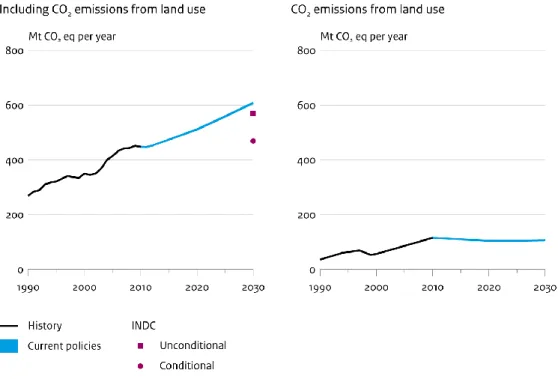
Argentina pledged to reduce its GHG emissions by 15% below business-as usual (BAU) levels by 2030. The current policies projection for Argentina considers its biofuels law and renewable energy law. As a result, GHG emissions in 2030 including LULUCF are projected to be about 610 MtCO2e or 36% above 2010 levels. Argentina
is, therefore, not yet on track to meet its unconditional INDC.
Table 1: Description of Argentina’s 2020 pledge and INDC
Indicator INDC (submitted 1st October, 2015)
Target: unconditional 15% GHG reduction by 2030 from BAU levels
Target: conditional 30% GHG reduction by 2030 from BAU levels, subject to international financing, support for transfer, innovation and technology development, and capacity building
Sectoral coverage Energy, agriculture, waste, industrial processes, LULUCF
General Accounting method IPCC guidelines; 100-year GWPs from the 2nd Assessment Report
GHGs covered CO2, CH4, N2O, HFCs, PFCs and SF6
Consideration of LULUCF LULUCF emissions/removals are included in the target Accounting approaches and methodologies are unclear Other sector-level targets N/A
Use of bilateral, regional and international credits
N/A
Availability of reference scenarios in the latest UNFCCC submissions
Yes, INDC refers to BAU scenario and gives values for emissions in 2030
Last available year for GHG inventory reporting
2012 (Government of Argentina, 2015).
Note: Argentina has not set its 2020 pledge.
Table 2: Overview of key climate change mitigation policies in Argentina. Source: (Ministry of Economy and Public Finance, 2007, IPEEC, 2016, Ministry of Energy and Mining, 2016, The World Bank, 2015, The World Bank, 2016, IEA, 2010, Infoleg, 2016, Infoleg, 2007, CCAP, 2013, Ministry of Environment and Sustainable Development, 2008)
Sector Policies (marked with “(+)” when
mentioned in the NDC document)
Description
Economy-wide
National Program for Rational and Efficient Use of Energy
(PRONUREE) (2007)
10-12% of energy savings by 2016 in residential, public/private services
Decrease electricity consumption by 6% compared to baseline scenario and energy savings of 1500 MW by 2016
Energy supply
Renewable Energy Programme in Rural Markets (2000)
Reduce GHG emissions by replacing small-diesel electricity generation with renewable energy systems Renewable Energy Law 27191.
National Development Scheme for the Use of Renewable Energy Sources (RenovAr) (2016)
Total individual electric consumption to be substituted with renewable sources given the following schedule: 8% by 2017, 18% by 2023 and 20% by 2025 1)
PROBIOMASA: promotion of biomass energy (2013)
8.7 MtCO2e yearly reductions by replacing fossil fuels
Energy Efficiency Project (2009) USD 99.44 million to reduce 10.7 MtCO2e by the end
of 2016 are the global benefits of the Energy Efficiency Project
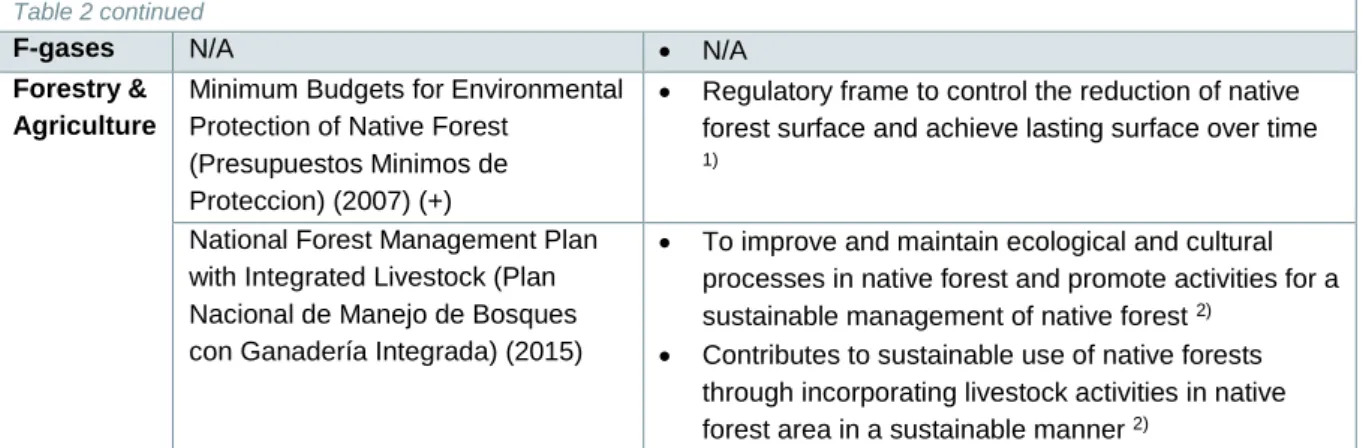
Table 2 continued
F-gases N/A N/A
Forestry & Agriculture
Minimum Budgets for Environmental Protection of Native Forest
(Presupuestos Minimos de Proteccion) (2007) (+)
Regulatory frame to control the reduction of native forest surface and achieve lasting surface over time
1)
National Forest Management Plan with Integrated Livestock (Plan Nacional de Manejo de Bosques con Ganadería Integrada) (2015)
To improve and maintain ecological and cultural processes in native forest and promote activities for a sustainable management of native forest 2)
Contributes to sustainable use of native forests through incorporating livestock activities in native forest area in a sustainable manner 2)
1) No information available on implementation status. For the current analysis, we have assumed full
implementation.
2) Policy not quantified in the IIASA LULUCF projections
Table 3: Impact of climate policies on greenhouse gas emissions (including LULUCF) in Argentina. Absolute emission levels and emission levels relative to 2010 levels are presented. References for official emission data are provided in Table A – 1 in the Appendix.
2010 GHG emissions, incl. LULUCF
2020 pledge and INDC Current policies
Official data
NewClimate estimates
Official data NewClimate estimates
Absolute: 450 MtCO2e 469 to 570 MtCO2e in 2030 470 to 570 MtCO2e; 5% to 27% in 2030 463 MtCO2e; 3% in 2020 549 MtCO2e;23% in 2030 510 MtCO2e; 14% in 2020 605 to 610 MtCO2e; 36% in 2030 Per capita: 11.2 tCO2e/capita N/A 9.5 to 11.5 tCO2e/capita in 2030
N/A 11.2 – 11.3 tCO2e/capita
in 2020
12.3 tCO2e/capita in
Figure 2: Impact of climate policies in greenhouse gas emissions in Argentina (including LULUCF). Source: NewClimate Institute calculations (excluding LULUCF) based on its analysis for Climate Action Tracker (CAT, 2016) using the BAU scenario from the 2015 National GHG Inventory Report (Ministry of the Environment and Sustainable Development, 2015), adapted to include the quantification of the biofuels law and the renewable energy law. Both PBL and NewClimate projections are supplemented with IIASA GLOBIOM/G4M model projections of net LULUCF emissions.Historical greenhouse gas emissions are based on the 3rd National Communication (Government of Argentina, 2015).
3.2 Australia
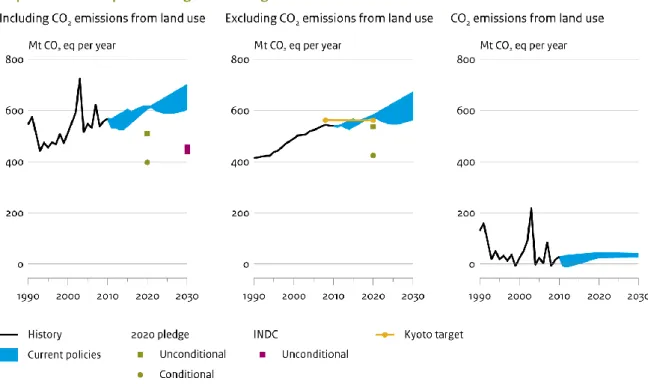
The Australian government states that it is “on track” to meet its target of 5% below 2000 levels by 2020 (Australian Government, 2015a), and that the Emissions Reduction Fund (ERF) plays a major role in lowering the abatement task. However, our current policy projections that include the abatements of the ERF result in emissions far above the pledge level (6–23% above 2000 levels). This contrasting conclusion drawn from our assessment is partly due to the accounting approach for the emissions reductions purchased through ERF. The Australian Government (2015a) counts all emissions reductions purchased in 2015 (92 MtCO2e) in the 2015/16
emissions reporting, although they occur over many years. In our analysis, we distributed the expected emissions reductions over the average contract period of 9 years.
Australia has stated that it will also meet the 2030 targets through policies that provide positive incentives to reduce emissions. At the core of Australia’s climate change policies is the Emissions Reduction Fund and linked safeguard mechanisms. Our current policies projections show a significant difference with the INDC trajectory in 2030.
Table 4: Description of Australia’s 2020 pledge and INDC
Indicator 2020 pledge INDC (submitted 11th August,
2015)
Target: unconditional 5% GHG reduction by 2010 from
2000 level
Kyoto target: 108% of 1990 levels 2013-2020
26 to 28% GHG reduction by 2030 from 2005 level
Target: conditional 15% and 25% GHG reduction by
2010 from 2000 level
Not specified
Sectoral coverage All GHG emissions, including
emissions from afforestation, reforestation and deforestation
Economy wide
General Accounting method IPCC guidelines; 100-year GWPs
from the Fourth Assessment Report
IPCC guidelines; 100-year GWPs from the Fourth Assessment Report
GHGs covered CO2, CH4, N2O, HFCs, PFCs, SF6
and NF3
CO2, CH4, N2O, HFCs, PFCs,
SF6 and NF3
Consideration of LULUCF Kyoto Protocol accounting rules
(Article 3.7)
Land use credits: 27 MtCO2e by
2020 (den Elzen et al., 2015)
LULUCF emissions/removals are included
Net-net approach will be used for emission accounting Use of bilateral, regional and
international credits
N/A N/A
Availability of reference scenarios in the latest UNFCCC submissions
Yes Yes
Last available year for GHG inventory reporting
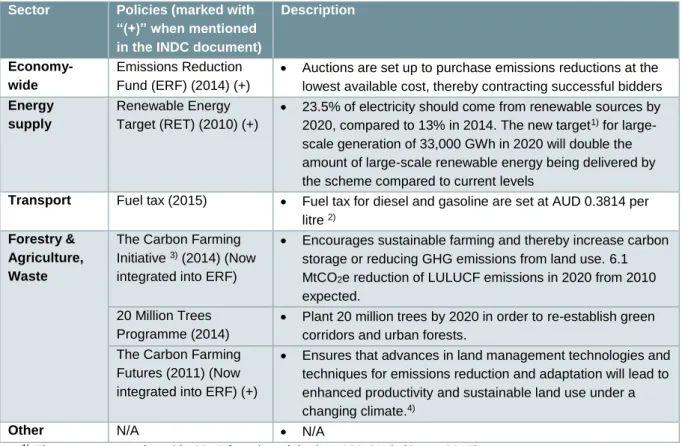
Table 5: Overview of key climate change mitigation policies in Australia (Australian Government, 2015a). See Supporting Information for details.
Sector Policies (marked with
“(+)” when mentioned in the INDC document)
Description
Economy-wide
Emissions Reduction Fund (ERF) (2014) (+)
Auctions are set up to purchase emissions reductions at the lowest available cost, thereby contracting successful bidders Energy
supply
Renewable Energy Target (RET) (2010) (+)
23.5% of electricity should come from renewable sources by 2020, compared to 13% in 2014. The new target1) for
large-scale generation of 33,000 GWh in 2020 will double the amount of large-scale renewable energy being delivered by the scheme compared to current levels
Transport Fuel tax (2015) Fuel tax for diesel and gasoline are set at AUD 0.3814 per
litre 2)
Forestry & Agriculture, Waste
The Carbon Farming Initiative 3) (2014) (Now
integrated into ERF)
Encourages sustainable farming and thereby increase carbon storage or reducing GHG emissions from land use. 6.1 MtCO2e reduction of LULUCF emissions in 2020 from 2010
expected. 20 Million Trees
Programme (2014)
Plant 20 million trees by 2020 in order to re-establish green corridors and urban forests.
The Carbon Farming Futures (2011) (Now integrated into ERF) (+)
Ensures that advances in land management technologies and techniques for emissions reduction and adaptation will lead to enhanced productivity and sustainable land use under a changing climate.4)
Other N/A N/A
1) The target was reduced in 2015 from its original 41,000 GWh (Scott, 2015) 2) OECD (2013)
3) Australian Government (2015b)
4) Policy not quantified in the IIASA LULUCF projections
Table 6: Impact of climate policies on greenhouse gas emissions (including LULUCF) in Australia. Absolute emission levels and emission levels relative to 2010 levels are presented. Note that the official values for 2020 and 2030 are based on GWP values from the IPCC Fourth Assessment Report. References for official emission data are provided in Table A – 1 in the Appendix.
2010 GHG emissions, incl. LULUCF
2020 pledge and INDC Current policies
Official data
PBL and NewClimate estimates
Official data PBL and NewClimate
estimates Absolute: 570 MtCO2e 530 MtCO2e in 2020 425 to 535 MtCO2e in 2020; 25% to 6% in 2020 440 to 460 MtCO2e in 2030; 23% to 20% in 2030 577 to 656 MtCO2e in 2020 724 MtCO2e in 2030 610 to 615 MtCO2e in 2020; 7% to 8% in 2020 605 to 700 MtCO2e; 6% to 23% in 2030 Per capita: 25.1 tCO2e/cap
N/A 16.3 to 20.7 tCO2e/capita in
2020
14.9 to 15.5 tCO2e/capita in
2030
N/A 23.4 to 23.7 tCO2e/capita
in 2020
20.5 to 23.7 tCO2e/capita
Figure 3: Impact of climate policies in greenhouse gas emissions in Australia (upper figure: all gases and sectors, lower figure: excluding LULUCF (left) and only LULUCF (right) separately). Source: PBL FAIR/TIMER model (upper bound through 2020, lower bound from 2021 onwards) and NewClimate Institute calculations adapted from Climate Action Tracker (CAT, 2015) based on the Australian Government (2015a) for non-LULUCF emissions and the Australian Government (2015b) for LULUCF emissions (lower bound through 2020, upper bound from 2021 onwards). PBL projections are supplemented with IIASA GLOBIOM/G4M model projections of net LULUCF emissions. Historical greenhouse gas emissions from 2014 GHG inventory data submitted to the UNFCCC.
3.3 Brazil
The main GHG mitigation policies in Brazil include the policies in the LULUCF sector, i.e. the enforcement of the Brazilian Forest Code and efforts to reduce deforestation in the Amazon and Cerrado regions. The impact of the proposed measures outside of the Amazon strongly depends on the success of policy enforcement. If all implemented policies are successful, emissions (including those from LULUCF) may reach about 7% to 25% below 2010 levels by 2030. Our analysis shows that Brazil is on track to meet its NDC with currently implemented policies. In its NDC Brazil announced a 45% share of renewables in the energy mix by 2030, and a 75% share of renewables in its electricity supply by 2030, but we don’t include these planned policies in our analysis.
Table 7: Description of Brazil’s 2020 pledge and NDC
Indicator 2020 pledge NDC (21st September, 2016)
Target: unconditional Between 36.1 and 38.9%
reduction by 2020 from a baseline scenario
37% GHG reduction by 2025 from 2005 level and indicative contribution of 43% GHG reduction by 2030 from 2005 level (equivalent to 4% to 8% below 2010 levels by 2030)
Target: conditional N/A N/A
Sectoral coverage Economy wide Economy wide
General Accounting method
100-year GWPs from the IPCC Second Assessment Report
IPCC guidelines; 100-year GWPs from the Fifth Assessment Report
GHGs covered All Kyoto GHGs, excluding
NF3
All Kyoto GHGs, excluding NF3
Consideration of LULUCF
Land sector is included in the target;
Accounting approaches and methodologies are not specified
Land sector is included in the target Accounting approaches and
methodologies are not specified
Use of bilateral, regional and international credits
N/A Possible use of market mechanisms that
may be established under the Paris Agreement
Other sector-level targets
N/A 45% share of renewables in total energy
mix by 2030 Availability of reference
scenarios in the latest UNFCCC submissions
No No
Last available year for GHG inventory reporting
2012 (Ministry of Science, Technology and Innovation of Brazil, 2014) 2014 (Observatório do Clima) 1)
Table 8: Overview of key climate change mitigation policies in Brazil. Source: (Ministry of Mines and Energy, 2012) ; (Government of Brazil, 2008)
Sector Policies (marked with “(+)”
when mentioned in the NDC
document) 1) Description Economy-wide 2020 pledge anchored in national law (2010) Not specified Energy supply
10-year National Energy Expansion Plan (2011)
38 GW installed by 2022 (17.4 GW wind, 13.8 GW biomass, 6.9 GW small hydro) and 114 GW large hydro installed by 2022
41.4% renewable share in total primary energy supply by 2022
National Plan on Climate Change (2008)
16% renewable electricity (excl. hydro) by 2020 (supported by renewable energy auctions, Government of Brazil, 2007)
Transport National Plan on Climate
Change (2008)
Not specified
Forestry & Agriculture
The Brazilian Forest Code (2012) (+)
Enforcement of the Brazilian Forest Code for the Cerrado region and the rest of Brazil
Restoring and reforesting 12 million hectares of forests by 2030
The Low-Carbon Agriculture (ABC) Plan) (2010) (+)
Restoring an additional 15 million hectares of degraded pasturelands by 2030 and enhancing 5 million hectares of integrated cropland-livestock-forestry systems by 2030
Plan for Prevention and Control of Deforestation in the Amazon (1996)
Zero illegal deforestation by 2030 in the amazon and compensating for greenhouse gas emissions from legal suppression of vegetation by 2030
1) The energy- and industry-related NDC policies are not quantified, but partly covered in the current policies
projection
Table 9: Impact of climate policies on greenhouse gas emissions (including LULUCF) in Brazil. Absolute emission levels and emission levels relative to 2010 levels are presented. References for official emission data are provided in Table A – 1 in the Appendix.
2010 GHG emissions, incl. LULUCF
2020 pledge and NDC Current policies
Official data PBL and NewClimate
estimates
Official data
PBL and NewClimate estimates
Absolute: 1,300 MtCO2e 2,070 MtCO2e 1,975 to 2,070 MtCO2e in 2020; 52% to 59% in 2020 1,200 to 1,250 MtCO2e; -4% to -8% in 2030 1,200 MtCO2e in 2020 1,080 to 1,225 MtCO2e; -6% to -17% in 2020 980 to 1,205 MtCO2e; 7% to -25% in 2030 Per capita: 6.7 tCO2e/capita
N/A 9.4 to 9.8 tCO2e/capita in
2020
5.4 to 5.6 tCO2e/capita in
2030
N/A 5.1 to 5.8 tCO2e/capita in 2020
Figure 4: Impact of climate policies in greenhouse gas emissions in Brazil (upper figure: all gases and sectors, lower figure: excluding LULUCF (left) and only LULUCF (right) separately). Source: PBL FAIR/TIMER model (upper bound) and NewClimate Institute calculations based on Climate Action Tracker (CAT, 2015) using the IEA WEO 2015 current policies scenario (lower bound); IIASA GLOBIOM model projections of net LULUCF emissions (REDD-PAC Brazil, 2015). Historical greenhouse gas emissions (excluding LULUCF) are based on inventory data submitted to the UNFCCC (until 2005), energy-related CO2
emissions from IEA (2014), non-energy-related emissions from EDGAR 4.2 (JRC/PBL, 2014). Historical LULUCF emissions are taken from the Brazilian First Biennial Update Report submitted to the UNFCCC (UNFCCC, 2015c), taking into account the same pools and sources of emissions as projection of net LULUCF emissions.
3.4 Canada
The policy with the largest projected effect in Canada is its fuel efficiency standard for passenger vehicles, which is harmonised with US standards and will be introduced in two phases. Another policy is the carbon standard for newly built coal-fired power plants, but this has a small impact on 2020 emission levels, as it does not affect existing power plants. Under current policies, Canada’s GHG emissions are projected to be about 680 to 800 MtCO2e by 2030 excluding LULUCF, which is above 2010 levels, and Canada will therefore have to implement
additional policies to achieve its NDC (17% below 2005 levels).
Table 10: Description of Canada’s 2020 pledge and NDC
Indicator 2020 pledge NDC (5th October, 2016)
Target: unconditional 17% GHG reduction by 2030 from
2005 level
30% GHG reduction by 2030 from 2005 level
Target: conditional N/A N/A
Sectoral coverage Economy wide Economy wide
General Accounting method
IPCC guidelines; 100-year GWPs from the Fourth Assessment Report
IPCC guidelines; 100-year GWPs from the Fourth Assessment Report
GHGs covered CO2, CH4, N2O, HFCs, PFCs, SF6
and NF3
CO2, CH4, N2O, HFCs, PFCs,
SF6 and NF3
Consideration of LULUCF Land sector is included in the target;
net-net accounting approach will be applied
Canada will exclude emissions from natural disturbances
LULUCF accounting could produce 19 MtCO2e to 28 MtCO2e of credits
per year (CAT, 2015) (Government of Canada, 2014)
Land sector is included; net-net accounting approach is expected to be applied Canada will exclude emissions
from natural disturbances LULUCF accounting could
produce 126 MtCO2e of credits
per year (CAT, 2015) Use of bilateral, regional
and international credits
N/A International mechanisms may
be used Availability of reference
scenarios in the latest UNFCCC submissions
Yes Yes
Last available year for GHG inventory reporting
2014 (GHG inventory report submitted to the UNFCCC)
Table 11: Overview of key climate change mitigation policies in Canada. Source: Government of Canada (2014))
Sector Policies (marked with “(+)” when
mentioned in the NDC document)
Description
Energy supply
CO2 standard for new power plants (2012) 420 gCO2/kWh from 1 July 2015
Transport Efficiency standards light commercial
vehicles (2004)
34.1 mpg (14.9 km/l) by 2017, 55 mpg (23.2 km/l) by 2025
Efficiency standards heavy-duty trucks (2013)
Differs per type of truck (aligned with federal-level regulations in the US) Forestry &
Agriculture
The Growing Forward 2 (2013) Supports the initiatives to advance environmentally sustainable agriculture 1)
Table 12: Impact of climate policies on greenhouse gas emissions (excluding LULUCF) in Canada. Absolute emission levels and emission levels relative to 2010 levels are presented. References for official emission data are provided in Table A – 1 in the Appendix.
2010 GHG emissions, excl. LULUCF
2020 pledge and NDC Current policies
Official data PBL and NewClimate
estimates
Official data PBL and NewClimate
estimates Absolute: 700 MtCO2e 622 MtCO2e in 2020 610 to 630 MtCO2e by 2020; -10% to -13% in 2020 525 to 640 MtCO2e; 8% to -25% in 2030 1) 815 MtCO2e in 2030 690 to 755 MtCO2e; -1% to 8% in 2020 680 to 805 MtCO2e; -2% to 15% in 2030 Per capita: 20.5 tCO2e/capita
N/A 12.7 to 15.5 tCO2e/capita in
2030
N/A 18.3 to 20.0 tCO2e/capita in
2020
16.5 to 19.5 tCO2e/capita in
2030
1) The range in emission projections is due to the assumed adopted land use credits, which differs more than
100 MtCO2 in the PBL and NewClimate calculations. The NewClimate Institute emission levels after
implementation of the NDC assumes net-net accounting and around 125 MtCO2e land use credits by 2030,
whereas PBL also assumes net-net accounting but no land-use credits.
Figure 5: Impact of climate policies in greenhouse gas emissions in Canada. Source: PBL FAIR/TIMER model (lower bound) and NewClimate Institute calculations based on Climate Action Tracker (CAT, 2015) using data from Canada’s Emissions Trends report (Environment Canada, 2014) and the Sixth National Report on Climate Change (Government of Canada, 2014) (upper bound), and IIASA GLOBIOM/G4M model projections of net LULUCF emissions. Historical greenhouse gas emissions from 2014 GHG inventory data submitted to the UNFCCC. Historical net LULUCF emissions have been revised downwards to be consistent with the NDC target which excludes emissions from natural disturbances.
3.5 Chile
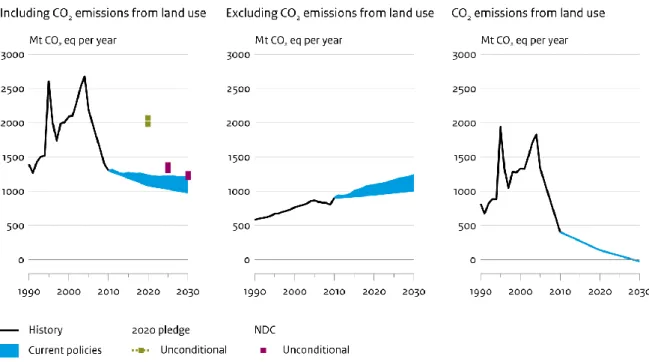
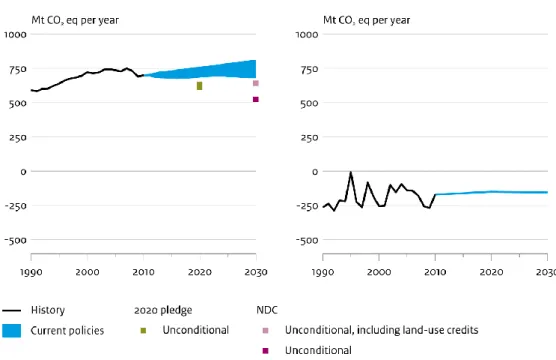
By 2030 Chile aims to reduce its GHG emission intensity per unit GDP by 30% from 2007 levels under unconditional INDC and 35% to 45% under conditional INDC, which is subject international support. Under its INDC, Chile’s emissions (excl. LULUCF) are estimated to reach 162 MtCO2e by 2030 under its unconditional
INDC and to 127 MtCO2e under its conditional INDC. Some of its most relevant current policies are the
Non-Conventional Renewable Energy Law (NCRE) Law 20698, which aims to achieve a 20% renewable energy target in 2025 and the Energy Efficiency Action Plan, which aims for a 12% reduction of the final energy demand below BAU by 2020. Under the current policies scenario, estimates show 10% emissions reduction by 2030 below 2007 levels, i.e. 161 MtCO2e, excl. LULUCF. This puts Chile on track to achieve its unconditional target.
Table 13: Description of Chile’s 2020 pledge and INDC
Indicator 2020 pledge INDC (submitted 29th September, 2015)
Target: unconditional
N/A 30% GHG reduction per unit GDP by
2030, from 2007 levels
Target: conditional 20% reduction compared to BAU
emission growth trajectory (as projected from year 2007) in 2020; conditional to a relevant level of international support
Until 35% to 45% GHG reduction per unit GDP by 2030 from 2007 levels subject to a grant of international monetary funds
Sectoral coverage Energy, agriculture, livestock and
forestry, transport, mining, fishing
Energy, industrial processes, use of solvents and other products, agriculture and waste. Excluding LULUCF sector General Accounting
method
N/A IPCC guidelines; 100-year GWPs from
the Fourth Assessment Report
GHGs covered N/A CO2, CH4, N2O, SF6, HFCs and PFCs
Consideration of LULUCF
LULUCF emissions/removals are included in the target
Accounting approaches and methodologies are unclear
LULUCF sector is excluded from INDC 2030 target
A reduction of net LULUCF emissions is expected in the order of 0.6 MtCO2e
related to increased sequestration from native forest management, and 0.9 – 1.2 MtCO2e related to increased
sequestration from afforestation Accounting approaches and
methodologies are unclear Use of bilateral,
regional and international credits
N/A To be considered (“Chile does not rule
out using international GHG emission transaction markets to comply with its commitments” as stated in the INDC) Other sector-level targets N/A N/A Availability of reference scenarios in the latest UNFCCC submissions
No Yes, scenario “Energias Renovables No
Convencionales” from the MAPS Chile Project (2014), which incorporates all relevant policy measures, was used as reference scenario.
Last available year for GHG inventory reporting
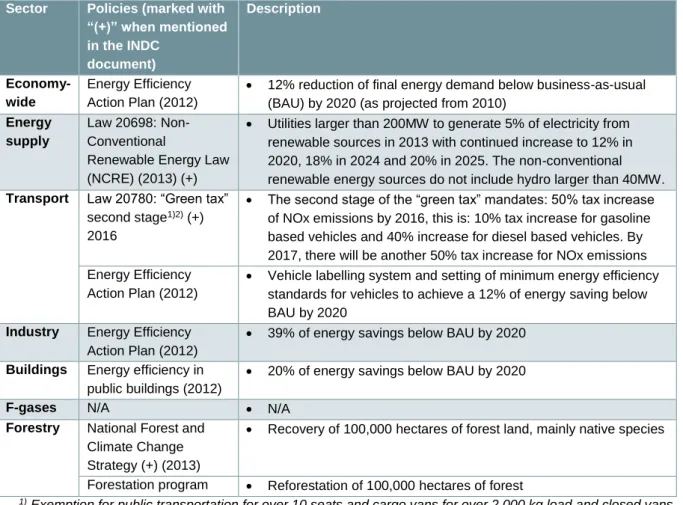
Table 14: Overview of key climate change mitigation policies in Chile. Source: (FAO, 2015, Government of Chile, 2013, Government of Chile, 2015, IEA/IRENA, 2016, Ministry of Energy, 2014, Ministry of Environment, 2015, Ministry of Environment, 2016, National Forest Corporation and Ministry of Agriculture, 2012, National Environmental Commission, 2010)
Sector Policies (marked with
“(+)” when mentioned in the INDC document) Description Economy-wide Energy Efficiency Action Plan (2012)
12% reduction of final energy demand below business-as-usual (BAU) by 2020 (as projected from 2010)
Energy supply
Law 20698: Non-Conventional
Renewable Energy Law (NCRE) (2013) (+)
Utilities larger than 200MW to generate 5% of electricity from renewable sources in 2013 with continued increase to 12% in 2020, 18% in 2024 and 20% in 2025. The non-conventional renewable energy sources do not include hydro larger than 40MW.
Transport Law 20780: “Green tax”
second stage1)2) (+)
2016
The second stage of the “green tax” mandates: 50% tax increase of NOx emissions by 2016, this is: 10% tax increase for gasoline based vehicles and 40% increase for diesel based vehicles. By 2017, there will be another 50% tax increase for NOx emissions Energy Efficiency
Action Plan (2012)
Vehicle labelling system and setting of minimum energy efficiency standards for vehicles to achieve a 12% of energy saving below BAU by 2020
Industry Energy Efficiency
Action Plan (2012)
39% of energy savings below BAU by 2020
Buildings Energy efficiency in
public buildings (2012)
20% of energy savings below BAU by 2020
F-gases N/A N/A
Forestry National Forest and
Climate Change Strategy (+) (2013)
Recovery of 100,000 hectares of forest land, mainly native species
Forestation program Reforestation of 100,000 hectares of forest
1) Exemption for public transportation for over 10 seats and cargo vans for over 2,000 kg load and closed vans
of lower capacity
2) No information available on implementation status. For the current analysis, we have assumed full
implementation.
Table 15: Impact of climate policies on greenhouse gas emissions (excluding LULUCF) in Chile. Absolute emission levels and emission levels relative to 2010 levels are presented. References for official emission data are provided in Table A – 1 in the Appendix.
2010 GHG emissions, excl. LULUCF
2020 pledge and INDC Current policies
Official data
NewClimate estimates Official
data NewClimate estimates Absolute: 90 MtCO2e N/A 120 MtCO2e; 30% in 2020 125 to 160 MtCO2e; 39% to 76% in 2030 N/A 135 to 140 MtCO2e; 47% to 51% in 2020 160 to 165 MtCO2e; 76% to 82% in 2030 Per capita: 5.4 tCO2e/capita
N/A 6.4 tCO2e/capita in 2020
6.5 to 8.3 tCO2e/capita in
2030
N/A 7.2 to 7.4 tCO2e/capita in
2020
8.2 to 8.5 tCO2e/capita in
Figure 6: Impact of climate policies in greenhouse gas emissions in Chile. Source: NewClimate Institute calculations (excluding LULUCF) based on its analysis for the Climate Action Tracker (CAT, 2016) using using data from the MAPS Chile Project (2014) and its “Energias Renovables No Convencionales” scenario, and IIASA GLOBIOM/G4M model projections of net LULUCF emissions. Historical greenhouse gas emissions (1990-2010) are taken from Ministerio del Medio Ambiente (2014).
3.6 China
China has pledged to peak CO2 emissions around 2030, to achieve 20% share of non-fossil energy sources in
total primary energy consumption by 2030, and to reduce the carbon intensity of its GDP by 60-65% compared to 2005 levels. Current policy projections, which take the latest renewable capacity targets into account, as well as a cap on coal consumption, indicate that China’s policies are more or less in line with what the NDC targets would mean for overall emissions, which will keep rising until 2030 but with a much slower growth rate than in the previous decade, reaching 13.0 to 14.5 GtCO2e/yr in 2030.
Table 16: Description of China’s 2020 pledge and NDC
Indicator 2020 pledge NDC (submitted 3rd September, 2016)
Target: unconditional 40-45% CO2 emission intensity
reduction by 2020; 15% non-fossil fuels in primary energy consumption and increased forest stock volume
Peaking CO2 emissions around 2030;
60-65% CO2 emission intensity
reduction by 2030, compared to 2005 levels; 20% non-fossil fuels in primary energy consumption by 2030 and increased forest stock volume
Target: conditional N/A N/A
Sectoral coverage Not specified Not specified
General Accounting
method
Not specified Not specified
GHGs covered CO2 only CO2 only
Consideration of
LULUCF
LULUCF emissions and removals are considered. The forest stock in China will be increased by 1.3 billion m3 by 2020, compared to
the 2005 level
Accounting approaches and methodologies are unclear
LULUCF emissions and removals are considered. The forest stock in China will be increased by 4.5 billion m3 by
2030, compared to the 2005 level Accounting approaches and
methodologies are unclear
Use of bilateral,
regional and
international credits
Not specified Not specified
Other sector-level
targets
Not specified Non-fossil target
Availability of
reference scenarios
in the latest UNFCCC submissions
N/A N/A
Last available year for GHG inventory reporting
Table 17: Overview of key climate change mitigation policies in China, Source: (The People’s Republic of China, 2014a, The People’s Republic of China, 2014b, The People’s Republic of China, 2012, State Council, 2015). Note: Policy targets may change significantly under the 13th Five Year Plan (2016-2020) currently in action.
Sector Policies (marked with “(+)”
when mentioned in the NDC document)
Description
Economy-wide
Energy Development Strategy Action Plan (2014)
Cap on coal consumption in 2020 at 4.2 billion tce A 10% target share of gas in primary energy supply in
2020 National Action Plan on Climate
Change (2014)
Emission trading program to be expanded to nationwide scale by 2017
13th Five Year Plan (2016-2020) Cap on total primary energy use in 2020 at 5.0 billion tce Energy
supply
Targets for low-carbon energy supply for 2020
Renewable electricity: 350 GW hydropower excl. pumped storage, 200 GW wind, 100 GW solar, 30 GW biomass, 0.1 GW tidal
800 million m2 collector area
10 million tonnes ethanol, 2 million tonnes biodiesel 58 GW nuclear power (150 GW by 2030)
Transport Vehicle fuel economy standards
(2005)
5 litres/100km for new cars (20 km/l) by 2020
Biofuel targets Ethanol blending mandates 10% in selected provinces
Industry “Made in China 2025” CO2
intensity target (2013)
Manufacturing industries reduce their CO2 emissions per
unit of added value by 22% by 2020 and 40% by 2025 from 2015 levels1),2)
Buildings Appliance standards and labelling
programme
Supplemented with subsidies and awareness-raising campaigns 1)
F-gases N/A N/A
Forestry Promotion of afforestation and
sustainable forest management
Increasing the forest area by 40 million hectares and the forest stock volume by 1.3 billion m3 from 2005 levels by
2020. Program Plan of Fast Growing
and High Yielding Timber Plantations (2001)
Establishment of at least 15 million hectares of fast-growing, high-yield plantations, of which 5.8 million hectares of fast-growing pulpwood plantations Mid and Long-Term Plan for
National Forest Management (2011)
Building young and mid-aged forest tending areas and transformation of low-yield forest area in the range of 35 million hectares 3)
1) Not quantified in PBL TIMER model
2) Not quantified by NewClimate Institute model 3) Policy not quantified in the IIASA LULUCF projections
Table 18: Impact of climate policies on greenhouse gas emissions (including LULUCF) in China. Absolute emission levels and emission levels relative to 2010 levels are presented. References for official emission data are provided in Table A – 1 in the Appendix.
2010 GHG emissions, incl. LULUCF
2020 pledge and NDC Current policies
Official data PBL and NewClimate estimates Official data PBL and NewClimate estimates Absolute: 10,130 MtCO2e 14,500 MtCO2e 11,885 to 13,580 MtCO2e; 17% to 34% in 2020 12,890 to 14,350 MtCO2e; 27% to 42% in 2030 N/A 12,410 to 12,855 MtCO2e; 20% to 27% in 2020 13,390 to 14,455 MtCO2e; 29% to 43% in 2030 Per capita: 7.6 tCO2e/capita
N/A 8.6 to 9.8 tCO2e/capita in
2020
9.3 to 10.4 tCO2e/capita in
2030
N/A 9.0 to 9.3 tCO2e/capita in
2020
9.7 to 10.5 tCO2e/capita in
Figure 7: Impact of climate policies in greenhouse gas emissions in China (all gases and sectors). Source: PBL FAIR/TIMER model (upper bound) and NewClimate Institute calculations (excluding LULUCF) based on its analysis for the Climate Action Tracker (CAT, 2016) using the IEA WEO 2015 current policies scenario (lower bound); both PBL and NewClimate projections are supplemented with IIASA GLOBIOM/G4M model projections of net LULUCF emissions. Historical greenhouse gas emissions are based on energy-related emissions (IEA, 2015b), non-energy-related emissions (EDGAR 4.2) (JRC/PBL, 2014) and historical net LULUCF emissions (2nd National Communication) (The People’s Republic of China, 2012).
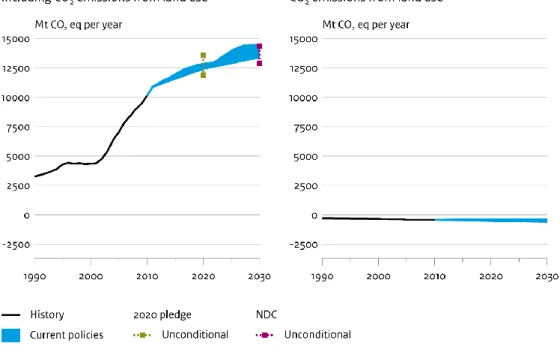
3.7 Colombia
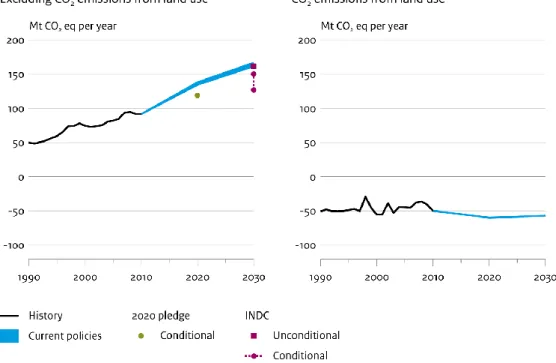
In its INDC, Colombia intends to reduce its GHG emissions by 20% from BAU level by 2030 and commits to increase the target to 30% subject to provision of international support. Colombia’s INDC partially includes LULUCF; emissions and removals from forest plantations and permanent crops are included but removals from natural forests that remain as natural forests are excluded.
Colombia’s unconditional and conditional reduction targets translate to 268 MtCO2e and 235 MtCO2e,
respectively, by 2030 including LULUCF. The current policies projection estimates a range of 290 to 326 MtCO2e
in 2030, thus Colombia will not yet achieve its unconditional INDC target with existing policies.
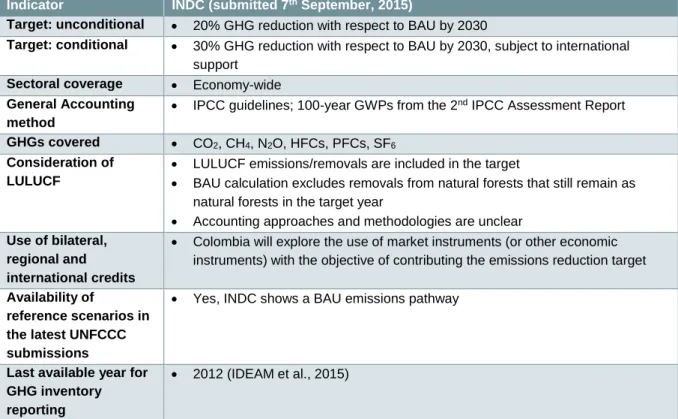
Table 19: Description of Colombia’s 2020 pledge and INDC
Indicator INDC (submitted 7th September, 2015)
Target: unconditional 20% GHG reduction with respect to BAU by 2030
Target: conditional 30% GHG reduction with respect to BAU by 2030, subject to international
support
Sectoral coverage Economy-wide
General Accounting method
IPCC guidelines; 100-year GWPs from the 2nd IPCC Assessment Report
GHGs covered CO2, CH4, N2O, HFCs, PFCs, SF6
Consideration of LULUCF
LULUCF emissions/removals are included in the target
BAU calculation excludes removals from natural forests that still remain as natural forests in the target year
Accounting approaches and methodologies are unclear Use of bilateral,
regional and international credits
Colombia will explore the use of market instruments (or other economic instruments) with the objective of contributing the emissions reduction target Availability of
reference scenarios in the latest UNFCCC submissions
Yes, INDC shows a BAU emissions pathway
Last available year for GHG inventory reporting
2012 (IDEAM et al., 2015)
Table 20: Overview of key climate change mitigation policies in Colombia. Source: (Ministry of Environment and Sustainable Development, 2016, Ministry of External Relations, 2016, IEA, 2013, NAMA Facility, 2016, Colombian Government, 2014)
Sector Policies (marked with “(+)” when
mentioned in the INDC document) Description Economy-wide N/A N/A Energy supply Colombian Low-Carbon
Development Strategy (+) (ECDBC) (2012)
Through the implementation of 8 Sectorial Mitigation Action Plans (SMAPs), approved by the relevant sectorial Ministries, the ECDBC aims to deviate from BAU emissions growth, estimated to be over 60% from current levels by 2030
Law 697: Programme for rational and efficient use of energy and other forms of non-conventional Energy (PROURE) (2010)
PROURE plans to achieve a 20% and 30% of RE sources by 2015 and 2020, respectively
Buildings NAMA II Project – For the domestic
refrigeration sector (2017-2021)
GHG emissions reduction of 16.8 MtCO2e over the
lifetime of the equipment, and an annual reduction of around 3.8 MtCO2e by 2030, which is a 50%
reduction from BAU in the sector
Transport NAMA I Project – Colombia Transit
Development (TOD) (2015)
Estimated reductions of annual GHG emissions by 3.6 to 5.5 MtCO2e by 2040.
F-gases N/A N/A
Forestry The National Development Plan of
Colombia (+) (2015)
Reduction of the annual deforestation rate from 121,000 hectares in 2013 to 90,000 hectares by 2018
The Amazon Vision Program (+) (2016)
Achieve zero net deforestation by 2020 1)
REDD+ Zero Deforestation in the Amazon by 2020 (2009)
REDD+ consists of 4 phases strategy with a total of 18.5 million USD for planning and
implementation 11)
1) Policy is not implemented in the IIASA LULUCF projections
Table 21: Impact of climate policies on greenhouse gas emissions (including LULUCF but excluding net removals from natural forests) in Colombia. Absolute emission levels and emission levels relative to 2010 levels are presented. References for official emission data are provided in Table A – 1 in the Appendix.
2010 GHG emissions, incl. LULUCF
2020 pledge and INDC Current policies
Official data NewClimate estimates Official
data NewClimate estimates Absolute: 230 MtCO2e 235 to 268 MtCO2e in 2030; 1% to 16% in 2030 235 to 270 MtCO2e; 5% to 20% in 2030 N/A 245 to 265 MtCO2e; 10% to 19% in 2020 290 to 325 MtCO2e; 29% to 45% in 2030 Per capita: 5.0 tCO2e/capita 4.4 to 5.0 tCO2e/capita in 2030 4.4 to 5.0 tCO2e/capita in 2030
N/A 4.9 to 5.3 tCO2e/capita in
2020
5.5 to 6.1 tCO2e/capita in
2030
Figure 8: Impact of climate policies on greenhouse gas emissions in Colombia (left: including LULUCF, right: only LULUCF). Source: NewClimate Institute calculations done for this study and based on a list of mitigation measures highly probable of being implemented and proposed by Universidad de los Andes (Cadena et al., 2016), which the MAPS Colombia Project cited upon formulating the country’s INDC; supplemented with IIASA GLOBIOM/G4M model projections of net LULUCF emissions. Historical greenhouse gas emissions are based on the 1st Biennial Update Report (IDEAM et al., 2015).
Note: the BAU emission projection in Colombia’s INDC excludes removals from natural forests, which accounted for 263 MtCO2e/yr in 2010. Therefore, net removals from natural forests are excluded from the current policies scenario and INDC