Academic year 2019-20
Determinants of informal sales in a precarious region: The case of Arabica coffee producers in the Eastern DRC
Vijaya
Promotor : Prof. dr. ir. Jeroen Buysse Tutor: Wannes Slosse
Thesis submitted in partial fulfilment of the requirements
for the joint academic degree of International Master of Science in Rural Development from Ghent University (Belgium), Agrocampus Ouest (France), Humboldt University of Berlin (Germany), Slovak University of Agriculture in Nitra (Slovakia), University of Pisa (Italy) and
University of Córdoba (Spain) in collaboration with Can Tho University (Vietnam), China Agricultural University (China), Escuela Superior Politécnica del Litoral (Ecuador), Nanjing Agricultural University (China), University of Agricultural Science Bengaluru (India), University of
Deze pagina is niet beschikbaar omdat ze persoonsgegevens bevat.
Universiteitsbibliotheek Gent, 2021.
This page is not available because it contains personal information.
Ghent University, Library, 2021.
3
Acknowledgment
First of all, I would like to thank Ghent University, the generous support it has provided me through scholarship and the IMRD management board. These 2 years of Masters in Europe has given me much more than a degree. I am taking home many memories, experiences, and life long friendships with me.
I would then like to express my gratitude to my promotor Prof. dr. ir. Jeroen Buysse for his precious feedback and suggestions and supporting me in research whenever I needed it. And I would like to thank my tutor Wannes Slosse for his constant support, patience, and timely guidance. His constant feedback during the process of the study has helped me to improve the thesis each time and at every step. I always believed in the importance of hard work, but I would not exaggerate if I say that my belief in hard work has even become stronger after seeing the dedication of my tutor.
Then I would like to thank all my IMRD 2018-20 colleagues with who, Europe did not feel like far from home and Michaela Boyen for her valuable support in the research.
Vijaya
4 Contents Acknowledgment ... 3 List of abbreviations ... 5 List of figures ... 5 List of tables ... 5 List of appendices ... 6 Abstract ... 7 1. Introduction ... 8 1.1. Context ... 8
1.1.1. Coffee and the Eastern DRC ... 8
1.1.2. Informal cross border trade of coffee in the Eastern DRC ... 9
1.1.3. Coffee prices in the world market ... 10
1.1.4. Trends in coffee industry ... 10
1.1.5. Coffee production in the Eastern DRC, challenges and solution ... 11
1.1.5.1. Challenges ... 11
1.1.5.2. Solution ... 12
1.2. Problem statement ... 14
1.3. Research question ... 15
1.3.1. Specific research question ... 15
1.4. Significance of the study ... 16
2. Literature review ... 16
2.1.Coffee specific characteristics ... 17
2.2.Cooperative characteristics ... 18
2.3. Socio-economic characteristics of the members ... 20
3.Methodology ... 23
3.1.Data collection ... 23
3.2.Econometric model ... 25
4.Results ... 27
4.1.Independent variables and descriptive statistics ... 27
5
5.Discussion ... 42
6. Conclusion and policy implications ... 45
7.Limitations and future research ... 47
References ... 48
Appendices ... 56
List of abbreviations DRC: Democratic Republic of Congo ICBT: Informal cross border trade PTA: Preferential Trade Agreement GDP: Gross Domestic Product USAID: United States Agency for International Development NGO: Non-Governmental Organisation FO: Farmers Organisation List of figures Figure 1 Trend in international coffee prices (In USD/Kg). Source: World Bank ... 10
Figure 2 Map of the treatment area ... 13
Figure 3 Frequency of observations of share sold informally ... 25
Figure 4 Percent of respondents receiving credits from various sources ... 34
Figure 5 Relationship between farm size and y* ... 42
List of tables Table 1 Result of independent sample T-test to compare average sales price in 2017 and 2019 ... 29
Table 2 Result of paired sample t-test to compare the prices received by the farmers who sell in both the formal and the informal market in 2019 (n=73) ... 29
Table 3 Result of independent sample T-test to compare share of coffee sold via informal market in 2017 and 2019 ... 29
Table 4 Result of independent sample T-test to compare quantity sold via cooperatives in 2017 and 2019 ... 30
6 Table 5 Percentage distribution of respondents in different categories in the year 2017 and 2019 ... 31 Table 6 Result of Independent Sample t-test to compare average prices received by members based on their education ... 32 Table 7 Result of Independent sample t-test to compare production by male and female
members in 2017 and 2019 ... 33 Table 8 Result of Independent sample t-test to compare "share of production sold informally" by male and female members in 2017 and 2019 ... 33 Table 9 Result of t-test to compare productivity based on production type ... 35 Table 10 Result of independent sample T-test to compare share income derived from coffee in 2017 and 2019 ... 36 Table 11 Result of Tobit regression ... 38 Table 12 Marginal effect of independent variables on the share of coffee sold informally of the two limit Tobit model ... 40
List of appendices
Appendix 1. Correlation coefficients of target group data ... 55 Appendix 2. VIF values to check for multicollinearity ... 56 Appendix 3 Result of tobit regression with Production as one of the independent variables instead of Size of farmland ... 57
7
Abstract
The study examines the factors which determine farmers in cooperatives to sell on informal markets in precarious regions, using the case of Arabica coffee producers in the Eastern DRC. Using data from four NGO-supported cooperatives in two timeframes, 2017 and 2019, we perform a Tobit regression to uncover these determinants. The results of the Tobit regression suggest that over time the probability and proportion of coffee sold informally has decreased. Older farmers, farmers more diversified in production, and farmers who have more access to information are found to sell a larger proportion informally. A U-shaped relationship has been found between proportion sold informally and the size of the farmland for coffee. Also, it has been found that cooperatives pay higher prices when compared to the informal market, and that these higher prices affect the share sold to cooperatives positively. Education is found to affect average prices received by members positively. Cooperatives are advised to address the problem of payment delays by announcing the floor prices and the maximum time within which they will make the payments. Older members, members who are producing more diverse crops, farmers with no formal education, the largest farmers and the smallest farmers should be focused more to fit as a target group for programs designed to increase sales to the cooperatives.
8
1. Introduction 1.1. Context
The Democratic Republic of Congo (DRC) presents a Sub-Saharan African country for which economic transition is still underway. Its economy is characterised as weak and underdeveloped with over 60% of the population living in rural areas (Lubanda, Smutka, & Selby, 2016). Over 60% of its economically active population is dependent on agriculture and the share of agriculture in its total GDP formation is over 42.5% (Lubanda et al., 2016). However, difficult circumstances of production, high insecurity and lack of infrastructure characterise agriculture in the Eastern DRC affecting agricultural productivity which decreased to 50% of its 1960 level in 2000. (World Bank, 2010).
1.1.1. Coffee and the Eastern DRC
For the Eastern provinces of North and South Kivu, these places have suffered from insecurity and governance crisis for long decades. After long years of violence and displacement, they need to rebuild their livelihoods and for that they need opportunities. Coffee farming could be that opportunity needed for them to achieve their goals (Downie, 2017). Arabica coffee is mainly grown in the Eastern provinces of North and South Kivu, and Ituri as the region has a favourable climate for production (World Bank, 2010).
The overall Arabica production in the early 1960s was around 15,000 tonnes both on plantations of colonisers and plantations of locals. Later, with the adoption of the policy of “Zairianisation” 1 in the early 1970s, plantations were abandoned except village plantations. Zairianisation together with conflict (1991-1993) and war (1996 to 2001) led to the destruction of transport infrastructure thus cutting the producers from the market and other services essential for production. In 1989, 20,000 tonnes of Arabica was still exported. However, the total production and the area under production fell to a very low level due to conflict in the Eastern
Kivu-1 Zairianisation- Zairianisation is the expropriation plan of President Mobutu of Zaire, which aimed at achieving
economic autonomy. It involved seizing and redistributing the nation’s foreign business to local people which consisted mainly of ministers, bureaucrats, army officials and few notable locals. The assets expropriated consisted of buildings, light industry and agricultural holdings including plantations ( http://www.country-data.com/cgi-bin/query/r-15067.html).
9 provinces. By 2003, the export of Arabica fell below 4,000 tonnes which again increased to 7,000 tonnes in 2008 because of an improvement in the security conditions. Extremely low productivity, low-density planting, lack of knowledge and technology are some of the factors still affecting the Arabica sector of the region (World Bank, 2010).
1.1.2. Informal cross border trade of coffee in the Eastern DRC
According to some studies, the Congolese coffee farmers prefer to sell high volumes of their coffee on the black market (informal selling) of the neighbouring countries. (Titeca, 2009; World Bank, 2010). As the producers are isolated, the markets of the neighbouring countries are more accessible leading to informal cross border trade (ICBT). ICBT is prevalent across the borders of African countries. It is common to see women crossing borders with heaps of saleable goods including industrial and agricultural commodities carrying on their heads and men with goods carrying on their bicycles or trucks (FAO, 2017). ICBT is the trade which involves traders or small entrepreneurs who do not possess PTAs (Preferential Trade Agreements) for formal cross border trade. They sell or buy on the informal markets across borders or to traders who do not follow the formal channel of import and export. This is done with the entirety of their goods or part of it. Almost 50% of African cross border trade is informal (FAO, 2017).
In the case of the DRC, coffee is smuggled from the Congolese side of the border to north-western Uganda and Rwanda. As there is almost no domestic consumption in the region, coffee is needed to be exported. Official export taxes are at 1%, but informal levies dramatically increase the cost of the legal channel of trade across the border on the Congolese side (World Bank, 2010). Coffee was smuggled from Uganda to Congo during the 1980s, as the price given for coffee in Congo was very high compared to Uganda. However, after Uganda adopted the liberalisation of trade in 1994, prices of coffee became higher in Uganda, thus changing the direction of this informal trade. Another reason for this is the destruction of coffee plantations and local coffee firms by local armed groups which forced farmers to sell coffee to Ugandan traders who had collaborations with the armed groups. Also, on the Ugandan side, the government supports its exports, they are not strict on smuggling from the DRC. Thus, after the coffee enters Uganda, it is exported as Ugandan coffee after processing. This results in the DRC losing the opportunity to
10 earn foreign currency. This shows the incapacity of the Congolese government in dealing with this situation (Titeca, 2009; Vwakyanakazi, 1991).
1.1.3. Coffee prices in the world market
High volatility in international coffee prices is another phenomenon affecting coffee production of the producing countries. Besides the DRC, Coffee is grown in many non-arid countries of the world. It is grown in more than 50 countries and for many of these countries, it has been recognised as an important commodity for trade and is very important for their balance of payment. Most of the coffee producing countries are developing countries and a significant amount of coffee is produced by the least developed countries while coffee consumption mainly occurs in industrialised countries. Coffee production is a labour-intensive process thus employing a significant amount of population in the producer countries (ICO, 2014). However, due to very high production in Brazil, international coffee prices have decreased from 4.42 USD/ Kg in 2014 to around 2.88 USD/Kg in 2019 (World Bank, 2019). South America has been the largest producer of coffee accounting for 47% of world production (ICO, 2018). Figure 1 shows the trend in international coffee prices from 2001 to 2019.
1.1.4. Trends in coffee industry
Coffee trade is traditionally a buyer-driven supply chain governed by roasters and retailers of consuming countries. They buy coffee from traders with all information of the quality, and after
11 processing, they sell it under one brand name. This way they maintain an asymmetry of information and enjoy maximum profits while leaving a very small share for the producing countries. However, the demand for coffee is increasing as coffee is now being consumed in producing countries as well but the production of coffee has reached saturation (Borrella, Mataix, & Carrasco-Gallego, 2015; ICO, 2014). Now coffee buying companies are focussing on sustainability certifications and direct trade between producer and processing companies excluding traders. Focussing on the quality of coffee through “Speciality coffee” is another way of competing in a saturated coffee market by the companies. Both sustainability certification and speciality coffee are instrumental in the decommodification2 of coffee (Borrella et al., 2015). This study focuses on coffee producers who are members of cooperatives. These cooperatives have contracts with buyers of speciality coffee sector and they have provisions of certification as well.
1.1.5. Coffee production in the Eastern DRC, challenges and solution 1.1.5.1. Challenges
Besides fluctuations in the world market price, internal problems of coffee industry, the situation of insecurity in the DRC and ICBT, there are some problems within the coffee producing sector of the DRC. Coffee plantations were established by Belgian colonisers in Congo after the First World War. Favourable climate, fertile soil and dense population which ensured labour availability were some of the factors which favoured the proliferation of coffee plantations especially in regions around Lake Kivu (Van Melkebeke, 2016). During the 1980s, the average coffee export of the DRC was around 88,000 tonnes but by 2016, the coffee output fell to 8000 tonnes (Downie, 2018). Some of the factors responsible for downfall in coffee production of the region as listed by Downie (2018) are poor governance leading to neglect of coffee sector, conflict in the Eastern Congo which is the main coffee producing region leading to farmers abandoning their fields and poor infrastructure making market access difficult. Another set of challenges affecting the coffee sector of the DRC is poor quality planting material, old coffee gardens, poor management and lack of knowledge and skill for producing good quality coffee in smallholder
2 Decommodification of coffee means differentiating coffee to reduce the substitutability between the suppliers,
thus, increasing the share of added value captured by the suppliers. The produce is presented as unique, as different from the homogenous bulk commodity (Galtier, Belletti, & Marescotti, 2008).
12 farmers (Adrien Kalonyi-Mbuyi, Tschilenge-Djim, P., & Saiba, 2010). Bellemare, Barrett, & Just, (2013) and Nsabimana & Tirkaso, (2020) suggested that price volatility, variability in climate and decreasing competitiveness in the international market are the reasons for the poor performance of the coffee sector in Eastern and South African countries. Mujawamariya, D’Haese, & Speelman, (2013); Chiputwa, Spielman, & Qaim, (2015); Minten, Dereje, Engida, & Tamru, (2018); Nsabimana & Tirkaso, (2020) found that poor quality of coffee, lack of standards, lack of cooperatives and problems in the supply chain are some of the reasons of declining coffee production in these countries.
1.1.5.2. Solution
Despite all these problems, the quality of Congo arabica coffee is considered high and has recently attracted the speciality coffee industry (Downie, 2018). Many non-government organisations, private parties, entrepreneurs, and donor agencies like USAID are working to improve the livelihood of the local population by focussing on the cash crop (mainly coffee and cocoa) sector of the country. Market development, the inclusion of marginalised community into the value chain and formation and functioning of cooperatives are some of the strategies these agencies are following for achieving their goal (R. Downie, 2018). These non-government organisations and companies are instrumental in filling the “governance void” in the conflict-hit region. They are supporting the formation of coffee cooperatives. As coffee production is a labour intensive process, farmers are forced to collaborate for production. These collaborations are also helpful in marketing. The coffee partnerships are seen as an important tool in fostering a new relationship between different actors thus providing new opportunities. The coffee cooperatives are instrumental in promoting the collaboration among the farmers (Kolk & Lenfant, 2015).
Cooperatives are locally developed, owned and controlled, their main aim is to develop social capital, human capital and financial capital of the community (Fulton & Ketilson, 1992; Novkovic, 2006; Sentime, 2019; Zeuli & Radel, 2005). In the DRC, the evolution of cooperatives is studied into two phases, i.e. before and after independence. Most of the cooperatives which were established before independence collapsed after independence in 1960 as most of the Congolese who were employed by cooperatives were employed for subaltern jobs. So, a lack of expertise to
13 run a cooperative is said to be another reason for the failure of cooperatives in DRC (Mwanalessa, 1983: 11, as quoted by Sentime, 2019). However, after independence, several NGOs and foreign aids are helping in the creation and functioning of cooperatives(Kamwanya, 1992; Sentime, 2019). One such organisation which is supporting farmers to set up cooperatives is an NGO called Rikolto3.
Rikolto supports farmers to develop into cooperatives in the Eastern DRC. These cooperatives aim at processing quality coffee and the NGO also connects these cooperatives with buyers of gourmet coffee. Providing new and quality planting material, introducing good agronomic practices, providing training, construction of micro washing stations, diversification of buyers of coffee, diversification of products, negotiation of contracts and access to credit are some of the activities this NGO does to support the members of the cooperatives (Rikolto, n.d.). Figure 2 shows the location of the cooperatives supported by the NGO. Theses cooperatives are located in the Eastern part of the DRC in the areas bordering Uganda and Rwanda. This study is based on the data collected by Rikolto from these cooperative members.
3https://congo.rikolto.org/fr/project/la-renaissance-du-cafe-arabica-lest-de-la-rdc
14
1.2. Problem statement
The effectiveness of cooperatives is negatively affected by several internal and external problems. Some of them are non-compliance, underinvestment, poor-management and side selling (Mujawamariya et al., 2013). Side selling is a situation where an individual cooperative member benefits from the cooperative but not fully contributing to the success of the cooperative (Shumeta, 2017; Wollni & Fischer, 2014). Side selling is considered as a prevalent problem of agricultural cooperatives (Bhuyan, 2007). Side selling results in compromise with the quality, affects the participation of members in the functioning of the cooperative negatively, and in the long term, the economic sustainability of the cooperative becomes difficult (Shumeta, 2017). However, as reported by Rikolto, the cooperatives in this study permit some side selling as they have quotas. Those cooperatives realise that farmers need this informal sale to dispose off their production beyond quota.
For the Eastern DRC, which shares a border with Uganda and Rwanda, part of this problem of side selling involves coffee smuggling across the border. Farmers sell coffee to cooperatives (formal sale), through other formal contracts selling directly to coffee exporters, and via private intermediaries (informal sale). Most of the coffee which is sold on informal markets, ends up in Uganda and Rwanda through informal channels. This happens because there is almost no domestic consumption of coffee in the DRC and farmers are isolated from their own domestic markets. Markets of neighbouring countries are more accessible to them. Also, due to very high formal and informal taxes on formal export channels, farmers choose to go for ICBT. Most of the coffee that is sold via ICBT comes from the village producers in the form of pre-dried parchment coffee that is sold at lower prices instead of the coffee that is fully washed and deparched. Fully washed and deparched coffee is sold at higher prices in the international market (World Bank, 2010). Thus, farmers lose the fair price for their coffee. However, as reported by Rikolto, cooperative members can use washing stations of the cooperatives and not sell that coffee to the cooperative. There is no difference in the quality of coffee sold on informal market and coffee sold to cooperatives.
15 As reported by Rikolto, side selling also results from the fact that farmers have quotas to sell coffee to the cooperatives. Also, farmers sell informally when the cooperatives are not operating at full level (out of high season) or when the quality of coffee is not good enough for the cooperatives to accept. Another issue, which some farmers face in the region is having less access to the sources of formal credit and many farmers face delayed payments by cooperatives by even more than 6 months. Farmers need immediate cash for paying hired labours and for household consumption. Such immediate cash is easily available from intermediaries or informal sources. However, in exchange, farmers need to sell their produce to the lenders or other intermediaries even if they pay lower prices. The study aims at finding different socio-economic factors that affect the choice of market channel (formal/ informal) through which the coffee producers who are the members of the cooperatives sell their coffee in the conflict-hit region.
1.3. Research question
Given the problem of extensive illegal cross border trade of coffee across the borders of Eastern DRC, Uganda and Rwanda, with the farmers from the DRC being the selling party, this study aims to find the important determinants which cause a coffee producer who is a cooperative member to sell informally. Most of this coffee ends up being smuggled to the neighbouring countries of Uganda and Rwanda. Therefore, the informal sales of coffee result in the DRC losing its source of foreign exchange and the farmers losing the fair price of their produce. The study aims at finding the areas of interventions to increase the formal sale of coffee.
The socio-economic characteristics of the cooperative members have been focussed upon to study the determinants of informal sale. Extensive data on the characteristics of cooperatives could not be gathered, therefore cooperative specific characteristics are not included in the model.
1.3.1. Specific research question
The specific research question for the study could be summarised into the following points:
1. Determining the socio-economic factors of the coffee cooperative members in the Eastern DRC which make them sell coffee on the informal market.
16 2. The main areas of interventions which could increase formal sales.
1.4. Significance of the study
According to Mujawamariya et al., (2013) very few recent work on African cooperatives have been done and especially study on reasons for side selling is scarce. This study takes the specific case of Eastern DRC where coffee cooperative members are involved in sideselling. The case of the Eastern DRC is specific because of its location (bordering Uganda and Rwanda), situation of insecurity, institutional problems, ICBT, isolation and being affected by conflicts.
2. Literature review
Along with building a farmer’s capacity, cooperatives also support the adoption of better technology, better inputs and an increase in productivity thus increasing farmer’s welfare (Ortega et al., 2019). Cooperatives help to exploit economies of scale and reduces external transaction costs. Patronage funds (dividends) paid to the members of a cooperative is an important incentive for the members to sell to the cooperatives (Sexton, 1986; Shumeta, 2017). Some studies like Wollni & Zeller, (2007) on cooperatives in Costa Rica and Mujawamariya et al., (2013) in their study in Rwanda and Nkwasibwe, Mugisha, Elepu, & Kaneene, (2015) in their study on Ugandan milk cooperative found that cooperative membership increases the probability of the farmer selling to the cooperative. Arana-Coronado, Trejo-Pech, Velandia, & Peralta-Jimenez, (2019) found in their study of Mexican coffee farmers that “relational commitment” with cooperative influences formal sales positively.
Cooperative membership can result in the adoption of better technology. A study conducted in Ethiopia found that the impact of cooperative membership is heterogenous on different groups of farmers in terms of technology adoption. Poorer farmers and farmers who lived farther away from all-weather roads were observed to be adopting fertilizer more than other members (Abebaw & Haile, 2013).
A study conducted in Rwanda (Verhofstadt & Maertens, 2014) found the effect of cooperative membership on poverty reduction to be positive. However, the effect was heterogenous on
17 different groups of farmers. Richer farmers were gaining more from being a member of a cooperative (Verhofstadt & Maertens, 2014).
Despite above mentioned benefits of cooperatives, not all cooperative members sell all their produce to cooperatives. A study of apple producers in China concluded that cooperative membership has no significant role in selling to cooperative (Hao et al., 2018). Delays in payments by cooperatives (Shumeta, 2017) and repeated transactions with middlemen resulting in trust between farmers and middlemen favour informal selling outside cooperative (Mujawamariya et al., 2013).
This literature review aims to study different socio-economic factors which influence the choice of market channels by cooperative members.
2.1.Coffee specific characteristics
Prices of coffee in the international market and prices received by the farmers affect the choice of the market outlet of the farmers. The International Coffee Agreement (ICA) 4was abolished in 1989, resulting in the liberalisation of the coffee market. Liberalisation exposed producers of coffee to price volatility (Mohan, Gemech, Reeves, & Struthers, 2014). In Africa, the effect of the slump in coffee prices is felt mainly by marginalised producers as they are the major group of producers (Oko-Isu et al., 2019). This world market price volatility can affect production decisions.
Price differences can also be seen across the different formal and informal marketing channels with formal channels like cooperatives offering higher prices. This affects the choice of the market channel by the producers or the amount of coffee sold through a certain channel (Saitone, Sexton, & Malan, 2018; Shiferaw, Obare, Muricho, & Silim, 2009). Alene et al., (2008) found in their study that price has no significant role in entry into the formal market, however, it affects positively the amount of produce sold in formal markets. Nkwasibwe, Mugisha, Elepu, &
4 ICA- The first International Coffee Agreement was signed in 1962 with most of the coffee producing and consuming
country. The aim was to regulate coffee market and introducing export quotas. It was abolished in 1989 owing to cold war politics, free riding, issues among members over quota, increasing trade with non-member countries and changes in the consumer preference of the USA which involved shifting from Robusta to Arabica (Ponte, 2002).
18 Kaneene, (2015) found in their study on milk producers in Uganda that price plays a positive role in increasing formal sales. However, another study based on cooperatives in Ethiopia found that price incentive does not increase quantity sold to cooperatives by small farmers. The author explained self-consumption as the reason for this (Bernard, Taffesse, & Gabre-Madhin, 2008). However, in DRC, domestic consumption of coffee is very low because of limited processing facilities (World Bank, 2010). Therefore, the price could play a different role in different regions based on the underlying conditions.
Asset specificity of coffee is another factor determining market outlet of coffee. Coffee being highly perishable, needs to be processed within a few hours of harvest to maintain its quality. While cooperatives accept only high-quality coffee, middlemen can accept the lower quality product as well (Mujawamariya et al., 2013). Thus, resulting in quality related asset specificity. The size of cultivated land is another factor which makes coffee asset specific. As larger farm size could result in larger production, a two-sided dependency both on farmers and cooperatives is created. Farmers need to sell coffee and cooperatives need to buy coffee for processing as they have a higher capacity to handle. Such dependency is not seen in the case of traders as they do not invest in infrastructure for processing coffee (Mujawamariya et al., 2013). Arana-Coronado et al., (2019) in their study of Mexican coffee farmers, Nkwasibwe et al., (2015) in their study on milk cooperatives and Pascucci, Gardebroek, & Dries, (2011) in their study on Italian cooperatives also found that asset specificity has a positive influence on the amount of products sold to cooperatives. Another study of specialty rice farmers based in Vietnam found that farmers in rural areas commonly deliver to local traders, but due to a decrease in transaction cost in terms of uncertainty and asset specificity was leading farmers to sell more to cooperatives (Pham, Theuvsen, & Otter, 2019).
2.2.Cooperative characteristics
As for cooperative characteristics, certification is a first factor which is expected to reduce side selling because of its property to secure market access through long term contracts. Certification is found to have a positive relationship with the amount of formal selling, however, it did not
19 have any significant impact on the probability of side selling in a study conducted on coffee cooperatives of Ethiopia (Shumeta, 2017). The provision of certification can strengthen the position of cooperatives thus enhancing social capital. It also provides benefits to individual members, however, relatively richer households tend to adopt certification (Bray & Neilson, 2017). Minten, Dereje, Engida, & Tamru, (2018) found in their study on coffee certification that modest amount of premium is passed on to the farmers, thus resulting in a very small impact of these communal investments. Most of the part of the premium is used on “overheads and
programme management”.
A second cooperative specific characteristic which influences the choice of coffee market of farmers is the size of the group, or number of members in the cooperative. A larger group size causes economies of scale leading to bigger payments. Thus, farmers sell more to cooperatives (Morfi, Ollila, Nilsson, Feng, & Karantininis, 2015), while, Wollni & Fischer, (2014)found in their study in Costa Rica that group size has a negative influence on the amount sold to cooperative as it would be difficult for the cooperative to monitor. A similar result was found by Shumeta, (2017) in their study in Ethiopia. Thus, group sizes have region and condition specific effects on the quantity of coffee commercialised through different market channels.
Payment delays and access to credit are third factors influencing marketing channel of coffee. Delays in payment to members of cooperatives are a common problem of cooperatives in Africa. Even modest delay in payment by cooperatives results in a decrease in the amount of produce sold to cooperative, even though cooperatives provide dividends to the members (Wedig & Wiegratz, 2018). Payment delays compel farmers to sell to intermediaries. Farmers sell coffee with the expectation to fulfil immediate household consumption, as there can be a need for cash in rural areas (Mujawamariya et al., 2013). Besides payment delays, smallholder farmers often faces problems like limited access to credits and other services (Fischer & Qaim, 2012; Reardon et al., 2009). Therefore, the source of credit available to the farmers plays an essential role in the choice of the market channel through which they sell their products. The source of credit could be both formal or informal. Farmers tend to access credit from private traders compared to other
20 formal sources because of their contact with them and the process is easy and quick. They pay them back by selling their produce to them after harvest (Mujawamariya et al., 2013). Arana-Coronado, Trejo-Pech, Velandia, & Peralta-Jimenez, (2019) also found that uncertainty in the time of payment by cooperatives has a negative influence on the amount of coffee sold by Mexican coffee farmers to their cooperatives.
2.3. Socio-economic characteristics of the members
Across Africa, women are over-proportionally involved in ICBT when compared to men (FAO, 2017). In the Great lake region, women are involved in cross border trade of low valued agricultural products while men are more involved in the selling of high valued agricultural goods across the border (FAO, 2017; Titeca & Célestin, 2012). A study of agricultural cooperatives of Ethiopia found that women participate less in agricultural cooperatives and the reason for this is gender discrimination within households and cooperatives where cooperatives prefer more literate men who are landowners over women who are resource-poor (Woldu & Tadesse, 2015). Another study reported that households with more male members participate lesser in certification (Wollni & Zeller, 2007). The authors explained the off-farm employment of males as the reason for this. However, a study based in Vietnam found no significant relationship between female-headed households and preference of marketing channels (Pham et al., 2019).
Years of experience in coffee production or age of farmers can affect the market choice of the farmers. Wollni & Zeller, (2007) found in their study that years of experience in farming have a positive role in participation in the specialty coffee sector in Costa Rica. Anteneh, Muradian, & Ruben, (2011) found that the age of the household head influence side selling positively in Ethiopia. As with age, farmers gain marketing experience and sell to private buyers. While Shumeta et al., (2017) found that older farmers sell more to cooperatives. They explained that older farmers may be risk-averse and perceive the cost of the search for new markets higher. They may consider non-monetary benefits that are provided by cooperatives important.
The highest education attained by the farmer can affect his choice of market outlet. More literate farmers are found to participate more in agricultural cooperatives in Ethiopia (Bernard &
21 Spielman, 2009). In another study, more educated farmers were found to diversify their market outlet more than illiterate farmers in Ethiopia (Anteneh et al., 2011). While Shumeta, (2017) found that more educated farmers are more committed to cooperatives in Ethiopia. Education is expected to enhance the information processing of a farmer resulting in the adoption of new production standards (Wollni & Zeller, 2007; Zbinden & Lee, 2005). Education has a positive relationship with certification, thus formal selling (Wollni & Zeller, 2007).
Information on market development, credit and training are considered as “public collective
goods” because all the members and non-members of cooperatives get those services. The
exclusion of non-members or not fully committed members is not possible. The difference between the prices paid to individual members and the export prices is the payoff to individual members of cooperatives generated from these services (Wollni & Fischer, 2014). Thus, access to information and training can affect the choice of the market of the members. Cooperatives can play an important role in enabling farmers to access to specialised markets by reducing the cost of information gathering (Blackman, Albers, Avalos-Sartorio, & Crooks, 2005). A Vietnam based study of rice farmers suggested that farmers value highly of the information received from cooperatives and that more farmers should be reached by extension agents (Pham et al., 2019). Wollni & Zeller, (2007) found in their study that prices received by households having information on world prices were significantly higher, they also found that access to training has a positive relation with certification. Therefore, access to training can result in more formal selling. Another study conducted in Kenya also found that market information and higher output price are important factors determining formal sales positively (Omiti, Otieno, Nyanamba, & McCullough, 2009).
Off-farm income is another important factor determining marketing channel of members. Wollni & Fischer, (2014) found in their study that patronage (dividends) is positively related to the number of off-farm activities performed by the household. As they have cash flow from other sources, they can wait until the end of the season to receive payment from the cooperative in case the cooperative suffers from lack of funds thus resulting in payment delays. Similar results
22 were obtained by Shumeta, (2017) where farmers with off-farm income were selling more to cooperatives. While, Anteneh et al., (2011) found that off-farm income affects side selling positively.
Farm size is another important factor determining choice of market for selling coffee by the farmers. A study on cooperatives members of coffee cooperatives in Costa Rica suggested a U- shaped relationship between the amount of produce sold to cooperative and amount produced. Larger farm size would mean larger production. Thus, the study confirms that small and large farmers sell more to cooperative while farmers cultivating medium-sized land sell more to intermediaries. This is because small farmers have less opportunity cost of side selling as they have less bargaining power. As farm size increases, it becomes attractive to side sell, however, very large farmers are more attracted to sell to the cooperative as they can have more influence in decisions of the cooperative because of their larger share of deliveries (Wollni & Fischer, 2014). Wollni & Zeller, (2007) also found a positive relationship between the size of farm and certification. They found that small farmers are more likely to sell via their cooperative. While, a study of the dairy farmers in Uganda suggests that large herd size and large land ownership contributes positively to formal selling to cooperatives (Nkwasibwe et al., 2015). Arana-Coronado, Trejo-Pech, Velandia, & Peralta-Jimenez, (2019) found in another study of coffee farmers in Mexico that farm size has a negative impact on percent of coffee sold to their cooperatives. Another study conducted on Finnish agricultural cooperatives found no relationship between farm size and loyalty of farmers to their cooperative (Morfi et al., 2015)
Household size has also been found to affect informal sale of agricultural produce. A study of the dairy farmers in Uganda suggested that the number of members in a household is a significant determinant that affects formal selling negatively as a larger household may need cash earlier for consumption purposes. Therefore, they sell to middlemen for instant cash (Nkwasibwe et al., 2015). Also, a larger household could be more inefficient in the use of labour, thus consuming more than selling (Alene et al., 2008; Nkwasibwe et al., 2015) However, a study based in Vietnam found no significant relationship between the size of the household and preference of marketing
23 channel (Pham et al., 2019). While a study in Rwanda found that household size affects participation in coffee cooperative positively. The reason being the labour-intensive nature of coffee production (Mujawamariya et al., 2013).
The distance of the collection centre from coffee plantation also is found to affect the market channel. Shumeta, (2017) in his study on coffee cooperatives in Ethiopia, found that the bigger the distance between the collection centre of cooperatives and farms, the higher the amount of side selling. Another study of milk (which is also highly perishable) producers in Uganda suggests that farmers tend to sell more to the cooperatives if the distance to the milk collection centres is less (Nkwasibwe et al., 2015). This could be because a large distance means more transportation costs (Omiti et al., 2009). This could also affect frequency of contact of members with their cooperative. Wollni & Fischer, (2014)found in their study that higher the frequency of contact between the members and their cooperative, the higher the selling to the cooperative. Similarly, farmers who have better access to the outside market, tend to sell outside.
Trust in cooperative leadership is another factor determining the amount of coffee sold to cooperatives. A study of coffee cooperatives in Ethiopia found that farmers who are committed to cooperatives have more trust in cooperative leadership (Shumeta, 2017). Another study by Morfi et al., (2015) found that trust reduces transaction costs in business and social life. Farmers who are more loyal to their cooperatives, trust the information from the cooperatives more.
Risk aversion is another important characteristic determining amount of coffee sold to the cooperatives. Cooperatives are seen as assured markets by the farmers who are more loyal to their cooperatives (Morfi et al., 2015). Thus, more risk averse farmers tend to sell more to cooperatives. However, Mujawamariya et al., (2013) found that when farmers fear low income because of lower quality of coffee, they side sell.
3.Methodology 3.1.Data collection
The data collected for this study is part of an impact study of the NGO Rikolto. Rikolto’s main missions are to support smallholder farmers in combatting rural poverty and to contribute in
24 discovering how to feed the growing world population. The data consists of baseline data collected in 2017, and midterm data collected in 2019. Additionally, end line data will be collected in 2021. The baseline data and the midterm data have been used for this study. Households were chosen randomly for the study, irrespective of their remoteness. Data were collected in interview settings by trained enumerators, with interviews being conducted at the respondent’s residence. From the membership list of the 4 cooperatives in one excel file, each member was randomly assigned a number, and these numbers were then arranged into order. From this order, the top 350 number of interviewees were selected. In this list, it was then checked if the list contained, first, a minimum of 50 observations per cooperative, second, enough female and young farmers, and third, if all farmers in the list were indeed still alive and active members of their respective cooperative. This sampling strategy, coupled with asking for availability of farmers and willingness to participate, led to the selection of the final set of interviewees. If farmers dropped out, the next members on the list were chosen.
In 2017, data were collected from 338 households belonging to 4 cooperatives which are supported by Rikolto. It was taken into account that a minimum number of young farmers (farmers below 35 years old (86 farmers)) and female farmers (94 farmers) had to be included during the data collection). Data of a comparison group (farmers who are not members of cooperatives and thus are not supported by Rikolto) were collected from by geographical proximity of beneficiary farmers to ensure a similar production environment.
In 2019, data for the comparison group were not collected as Rikolto did not expect to see any significant statistical differences between the two groups at that point in time. Data from only a reduced number of target group farmers (147 farmers) out of the farmers surveyed at baseline were collected.
25
3.2.Econometric model
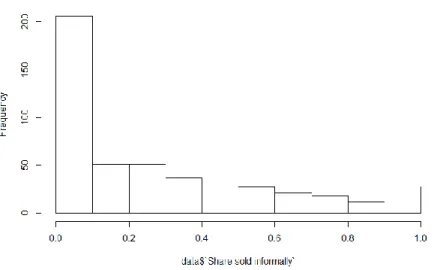
To study the factors which determine the proportion of coffee which is sold informally by the farmers in the Eastern part of the DRC, a regression model has been used. The dependent variable, which is “share of production sold on the informal market”, has been calculated by dividing the amount of coffee sold on the informal market by the total amount of coffee produced by each cooperative member. It has a lower limit of 0 and an upper limit of 1, with a higher number of observations censored at 0. Figure 3 shows a high frequency of responses at 0.
Conventional OLS estimates of such censored data give biased parameter estimates. In such cases, the model proposed by Tobin (1958) gives consistent estimates (Henningsen, 2012). Since the dependent variable ranges from 0 to 1, a two-limit Tobit model will be used in this study (Rosett & Nelson, 1975).
In this study, the dependent variable “share of production sold on the informal market” is assumed to be the censored version of a latent variable “Intention of a member to do side selling”. As we have a rather high number of observations of the dependent variable (share of side selling) at 0, it is assumed that the members could differ in their intention of side selling even
26 though the observed value of the share of side selling for them is 0. Following Brehanu & Fufa (2008), the linear model to predict the latent variable is given in equation 1:
𝑦𝑖∗ = 𝛽′𝑥𝑖 + 𝜀𝑖 (1)
Here, 𝑦𝑖∗ is a latent variable (intention to side sell) which is not observed for values less than 0 and greater than 1 for observation 𝑖. 𝑥𝑖 is the vector of independent variables and 𝛽′ is the vector of parameters to be estimated. 𝜀𝑖 is the error term which is normally distributed with mean equals to 0 and variance equals to 𝜎2.
As 𝑦𝑖 is observed dependent variable “share of proportion sold informally” which is censored having a lower limit at 𝐿 = 0 and the upper limit at 𝑈 = 1. Thus,
𝑦𝑖 = 0 𝑖𝑓 𝑦𝑖∗ ≤ 𝐿 𝑦𝑖 = 𝑦𝑖∗ 𝑖𝑓 𝐿 ≤ 𝑦𝑖∗ ≤ 𝑈
𝑦𝑖 = 1 𝑖𝑓 𝑦𝑖∗ ≥ 𝑈 (2)
The expected value of the latent variable 𝑦𝑖∗ can be described by equation 3: 𝐸(𝑦𝑖∗|𝑥) = 𝛽′𝑥 (3)
The change in the probability of informal sale and proportion of informal sale if an explanatory variable changes by 1 unit is given by equation 4:
𝜕𝐸(𝑦∗|𝑥)
𝜕𝑥𝑖 = 𝛽𝑖 (4)
As the share of production sold informally is censored at 0 at the lower limit and at 1 at the upper limit, the conditional expected value is given by equation 5 of the Tobit model:
𝐸(𝑦|𝑥, 𝐿 < 𝑦∗ < 𝑈) = 𝛽𝑥 + 𝜎 ∅(𝑍𝐿)−∅(𝑍𝑈) 𝜑(𝑍𝑈)−𝜑(𝑍𝐿) (5) Where,
27 𝑍𝑈 = (𝑈 − 𝛽𝑥)/𝜎
𝜎 is the standard error of the estimate. ∅(. ) and 𝜑(. ) are the density distribution and cumulative function of a variable with a standard normal distribution. 𝑦 is equal to 𝑦∗ if 𝑦∗ is within range. Otherwise, 𝑦 is equal to the limit values of 0 or 1.
Following Brehanu & Fufa (2008) and McDonald & Moffitt (1980), the marginal effect of the explanatory variables on the dependent variable can be decomposed into 3 components:
First, the effect of change in the independent variable on the probability of participation in the informal sale by fully committed members is estimated by equation 6,
𝜕𝜑(𝑍𝐿)
𝜕𝑥𝑖 = ∅(𝑍𝐿) ( 𝛽𝑖
𝜎) (6)
Second, the change in the proportion of informal sale for those who are already selling some part of their coffee through the informal sale is given by equation 7,
𝐸(𝑦|𝑥,𝐿<𝑦∗<𝑈) 𝜕𝑥𝑖 = 𝛽𝑖 [1 + 𝑍𝐿∅(𝑍𝐿)− 𝑍𝑈∅(𝑍𝑈) 𝜑(𝑍𝑈)−𝜑(𝑍𝐿) − ⌈∅(𝑍𝐿)−∅(𝑍𝑈)⌉2 ⌈𝜑(𝑍𝐿)−𝜑(𝑍𝑈)⌉2] (7)
And finally, the change in probability of 100% informal sale is given by equation 8, 𝜕𝜑(𝑍𝑈)
𝜕𝑥𝑖 = ∅(𝑍𝑈) ( 𝛽𝑖
𝜎) (8) 4.Results
4.1.Independent variables and descriptive statistics
Cooperatives which are included in the study, are reported to pay a 40% higher price when compared to the informal market price of coffee. For midterm evaluation, the price received via formal and informal market were reported separately. Thus, the average sales price of coffee which was received by each farmer is calculated by taking the prices paid on each market times the share sold on that market. However, in 2017 (at the baseline) prices in the formal and informal markets were not reported separately. The average sales price which was received by each farmer is the value as directly reported by the farmer. The mean of the average sales prices
28 (average price received by a member in both formal and informal market) received by all the farmers who were members of cooperatives in 2017 was 282 USD/ton. The average sales price received by the farmers in 2019 in both the markets was 281 USD/ton. Independent sample T-test revealed that there was no significant difference between the average prices received in 2017 and 2019 (Table 1). One thing to be noted here is that the price of arabica coffee decreased in the world market (Figure 1) but no such decrease in prices received via member is observed.
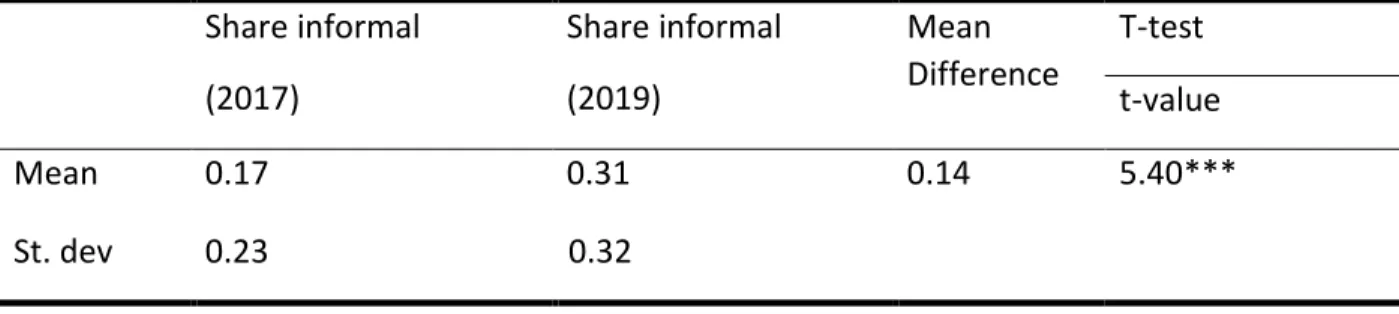
In 2019, 73 out of 147 members sold coffee in both formal and informal markets. The prices received by the members in both the formal and informal markets are compared using a Paired sample t-test of which the results are presented in Table 2. Prices received via FO were significantly higher than prices received on the informal market. Also, the share of production sold via the informal market is significantly lower in 2019 when compared to 2017 (Table 3). But the amount delivered to cooperatives is not significantly different in 2017 and 2019 (Table 4).
Therefore, the average prices received by the members remain the same in 2017 and 2019, while the world market price of coffee has decreased. This phenomenon can be attributed to the fact that cooperatives are paying higher prices compared to the informal market. Also, a significantly higher share of coffee is sold via cooperatives in 2019 compared to 2017 but the amount of coffee sold via cooperatives remains the same in 2017 and 2019. Thus, it can be said that while the production of coffee has decreased among the members from 2017 to 2019, share allocated to cooperatives has increased and the average price of coffee received by members remains the same in 2017 and 2019 even though world price of Arabica has decreased from 2017 to 2019. Higher prices paid by the cooperatives could result in the allocation of a higher share of coffee to the cooperatives.
Even though cooperatives are paying a significantly higher price compared to the informal market, members are still allocating some proportion of their produce on the informal market. Cooperatives are reported to delay in payments for more than even 6 months. Thus, the availability of faster payments and credits from the intermediaries could be a reason for informal sales. Some other reasons which results in informal sale is the quota system where farmers
29 cannot sell all their coffee to the cooperative if the production exceeds beyond quota. This extra coffee is sold in the informal market. Sometimes, when cooperatives are not operating at full scale, farmers are compelled to sell outside. Also, lower quality coffee is not accepted by the cooperatives, thus resulting in the informal sale by farmers.
Table 1 Result of independent sample T-test to compare average sales price in 2017 and 2019
Average sales price (USD/ton)
(2017)
Average sales price (USD/ton) (2019) Mean Difference T-test t-value Mean 282 281 1 0.17 St. dev 74.07 47.52 (*p = 10%, **p = 5%, ***p=1%)
Table 2 Result of paired sample t-test to compare the prices received by the farmers who sell in both the formal and the informal market in 2019 (n=73)
Price (received via FO) in USD/ton
Price (informal sale) in USD/ton Mean Difference Paired sample t-test t- value Mean 309.46 221.50 87.95 16.97*** Std. dev 19.39 40.19 (*p = 10%, **p = 5%, ***p=1%)
Table 3 Result of independent sample T-test to compare share of coffee sold via informal market in 2017 and 2019 Share informal (2017) Share informal (2019) Mean Difference T-test t-value Mean 0.17 0.31 0.14 5.40*** St. dev 0.23 0.32 (*p = 10%, **p = 5%, ***p=1%)
30
Table 4 Result of independent sample T-test to compare quantity sold via cooperatives in 2017 and 2019 Sold via cooperative (tons) (2017) Sold via cooperative (tons) (2019) Mean Difference T-test t-value Mean 0.83 0.68 0.15 1.46 St. dev 1.05 1.13 (*p = 10%, **p = 5%, ***p=1%)
The total production of coffee by each farmer has not been taken as an explanatory variable in the main model because of the high correlation (0.56) between “Farm size” (ha) and “Production” (tons) which could cause multicollinearity. The mean production of the target group respondents in 2017 was 1.28 tonnes and for 2019, it was 0.88 tonnes. The curvilinear relationship between production and share sold informally as proposed by Wollni & Fischer, (2014) has also been checked in another Tobit model with the same set of variables, but the variable “Farm size” was dropped from the set of explanatory variable and a linear term and squared term for quantity produced was added. No significant relationship between quantity produced and share allocated to the informal market was observed.
Some characteristic of the farmers which could affect their choice of market channel and which are included in the model as explanatory variables are age, years of cooperative membership, education, and gender of the farmers. Table 5 shows the percentage distribution of respondents in different categories in 2017 and 2019. For the variable age, two age groups of farmers, above 35 years old (older farmers) and below 35 years old (younger farmers) are reported. Age is coded as a dummy variable with farmers over 35 years old taking value of 1 and those below 35 taking value of 0. 75 % farmers are above 35 years old in 2017 data while 80.6 % farmers are above 35 years old in 2019 data.
31
Table 5 Percentage distribution of respondents in different categories in the year 2017 and 2019
Variables 2017 (%) 2019 (%)
Age (over 35 years old) 75 81
Education (no formal education) 39 41
Gender (females) 27 30
Access to credit 49 63
Access to training more than once in a year 47 93 Access to information more than once in a year 51 84
Farmers in 2017 reported years of membership of a cooperative from a minimum of 0.2 years to a maximum of 35 years. The average years of cooperative membership was 3.14 years. While in 2019, the minimum years of membership are was 1 year and the maximum was 8 years. The average years of membership of the respondents in 2019 were 4.4 years.
Members in the study vary in their level of education from no formal education to a Master's degree or above. Around 39% of the respondents have not received any formal education in 2017 and around 41% of respondents have no school education in 2019.
Education of members and non-members of cooperatives are also compared in 2017 data, and the null hypothesis of independence is not rejected. Thus, participation in a cooperative is not affected by having some formal education. However, the average sales price received by members on all the markets were significantly higher for the members who had attained some formal education in 2017. In 2019, there was no significant difference between the average prices received by the members. The decreasing role of education in the average sales prices received by the farmers could be attributed to the efforts of the NGO and the cooperatives, and the evolution over time. Table 6 shows the result of the independent sample t-test.
32
Table 6 Result of Independent Sample t-test to compare average prices received by members based on their education
No formal education (USD/Ton) Formal Education (USD/Ton) Mean Difference T-test t-value Mean(2017) 264.44 293.38 28.94 -3.36*** St. dev (2017) 83.56 64.88 Mean (2019) 277.86 282.56 4.7 -0.55 St. dev (2019) 43.61 49.44 (*p = 10%, **p = 5%, ***p=1%)
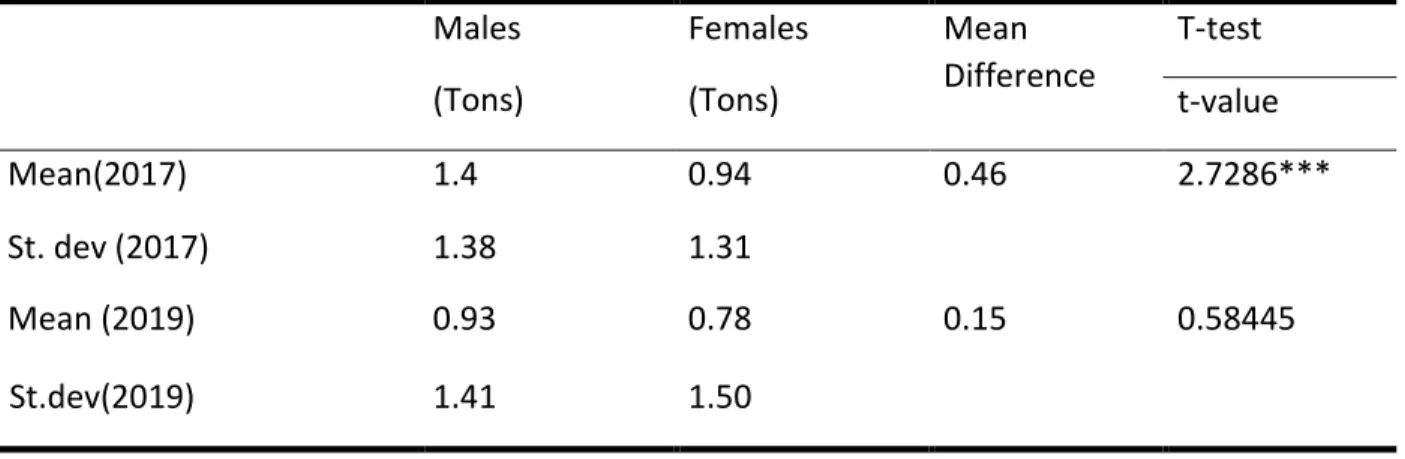
The variable gender is coded as a dummy variable with females taking a value of 1 and males taking 0. In 2017, there were 332 respondents in the target group, out of which 242 were males and 90 were females. In 2019, there were 144 respondents out of which 101 were males and 43 were females. Independent sample t-tests were performed to check for the differences between
mean production (Table 7) and mean share of informal sales (Table 8) based on gender. In both
the years mean production by male farmers were higher, however, it was significantly high in 2017 only. The mean “share of production sold informally” was higher for males in both the years, but the difference was significant in none. However, any conclusions from this result should be drawn carefully. This is because the cooperative member which is interviewed is not always the household head. Sometimes the man is part of one cooperative and the woman of another. As Rikolto reports about informal sales in the DRC being the women’s terrain, and other studies pointing out that women are mostly involved in ICBT in the great lake region (FAO, 2017; Titeca & Célestin, 2012), but the data to really assess the issue is not available.
33
Table 7 Result of Independent sample t-test to compare production by male and female members in 2017 and 2019 Males (Tons) Females (Tons) Mean Difference T-test t-value Mean(2017) 1.4 0.94 0.46 2.7286*** St. dev (2017) 1.38 1.31 Mean (2019) 0.93 0.78 0.15 0.58445 St.dev(2019) 1.41 1.50 (*p = 10%, **p = 5%, ***p=1%)
Table 8 Result of Independent sample t-test to compare "share of production sold informally" by male and female members in 2017 and 2019
Males Females Mean Difference T-test t-value Mean(2017) 0.32 0.28 0.04 1.0017 St. dev (2017) 0.32 0.31 Mean (2019) 0.19 0.13 0.06 1.5462 St. dev (2019) 0.25 0.16 (*p = 10%, **p = 5%, ***p=1%)
Access to credit, information, and training are some other factors that could affect the informal sale. 49% of respondents had access to credit to finance for production when needed in 2017 while 63 % of respondents had access to credit in 2019. The main sources of informal credit were family, community, and intermediaries and the sources of formal credit were farmer organisations, buyer companies, and micro-financial organisations. None of the respondents received credit from commercial banks in 2017 and 2019. Figure 4 shows the percentage of respondents who received credits from various sources. In 2017, out of the total respondents who received credits from one of the formal or informal sources, 15% of respondents received
34 credits from farmer organisations and 37% received from micro financial organisations. In 2019, it was 31% from farmer organisations and 9.8% from micro financial institutions. For this study, access to credit is coded as a dummy variable. Members who have access to credit from some source have taken a value of 1 and 0 otherwise.
For variable access to information and training, respondents were asked the frequency of access to market information like prices in the local market, global prices, prices of buyers and information on livestock and cropping practices through training on a scale of 0 to 3. 47% of respondents in 2017 and 93% in 2019 had access to training more than once in a year. While 51% of respondents in 2017 and 84% in 2019 had access to information more than once in a year.
The size of the farmland for coffee production is another variable expected to influence the choice of market for selling coffee. In the data, the size of farmland for coffee production varied from 0.01 ha to 10 ha in 2017 with 0.72 ha as mean and 0.5 ha as a median. In 2019, it was from 0.01 to 0.69 with a mean of 0.65 and a median of 0.49. The relationship between share sold informally and farm size could be either linear or curvilinear as found by Wollni & Fischer, (2014). Hence, for the regression model, the squared term of the variable for farm size has been taken along with the linear term for estimating the curvilinear relationship.
0 5 10 15 20 25 30 35 40 45 Perc en t o f r es p o n d en ts Sources of credits
Non-members Members 2017 Members 2019
35 The number of members in the household has been used as another determining factor of the proportion of the informal sale of coffee. Households reported up to 10 members in the household in both the years.
Some variables to show diversification of income by the household has been included in the model as explanatory variables. Those are “production type”, “share of total household income derived from coffee”, “number of other crops commercialised” and “number of different livestock commercialised”. The variable “Production type” consists of 2 types of production of coffee. Intercropping of coffee with other crops and monocropping of coffee. This variable has been included in the model as an element of diversification of income. Also, a t-test has been performed to see differences between coffee productivity based on “production type”. The result showed a significant difference between productivity with the mean productivity of farmers practicing intercropping being higher in 2017. The result of the t-test is given in Table 9.
Table 9 Result of t-test to compare productivity based on production type
Intercropping Monocropping Mean Difference in productivity (tons/ha) T-test t-value Mean(2017) 2.414 1.762 0.652 3.99*** St. dev (2017) 1.7 1.27 Mean (2019) 1.547 2.139 0.592 -1.725* St. dev (2019) 1.37 2.64 (*p = 10%, **p = 5%, ***p=1%)
Percent of total income derived from coffee is another element used as a proxy to show diversification of income of the household through other off-farm and on-farm income activities. This is a continuous variable varying from 0 to 100 percent. A significant decrease in the share of total household income derived from coffee is observed from 2017 to 2019 (Table 10).
36
Table 10 Result of independent sample T-test to compare share income derived from coffee in 2017 and 2019
Share income from coffee
(2017)
Share income from coffee (2019) Mean Difference T-test t-value Mean 58 50 0.14 4.53*** St. dev 20.75 17.20 (*p = 10%, **p = 5%, ***p=1%)
Other than coffee, farmers are engaged in cultivation and commercialisation of crops like cacao, manioc, haricot, peanut, plantain, potato, and vegetables. Therefore, a variable “Number of other crops commercialised” is included in the model which shows how many crops a farmer commercialises out of the above mentioned crops. It is assumed that more diversification of crops would reduce dependency on coffee for income. However, this assumption does not stand true if farmers are cultivating many other crops but in small amounts. Data on the amount of these crops produced were collected but data on the prices of these crops were not collected. Therefore, the only number of crops are included in the model and not their monetary values. Similarly, “Number of different kinds of livestock for commercialisation” by the households are also included in the study.
4.2. Econometric results
The Tobit model presented in Table 11 has been run using “share of coffee sold informally” as the dependent variable and a set of independent variables which includes the year of data collection, sex and age of the respondent, credit access, highest diploma attained by the members, years of cooperative membership, size of farmland for focus crop (in ha), number of members in the household, frequency of access to information, Production type, share (%) of total income derived from coffee, number of other crops commercialised and number of different livestock for commercialisation. The variables have been checked for correlations. Correlation coefficients of the variables are given in appendix 1. Production (in tons) and the size
37 of farmland (ha) are found to have a correlation coefficient of 0.56. A correlation coefficient of 0.6 is also found between the frequency of Information and Training. Therefore, these two variables are not included in the main model (Table 11). However, to check for multicollinearity, an OLS model has been run using the same set of explanatory variables plus training and production and has been checked for VIF (Variance Inflation Factor). All the VIF values were below 1.8 indicating no problem of multicollinearity. The VIF values are given in Appendix 2. Also, when variable “size of farmland (ha)” was replaced with “production (tons)”, “production (tons)” was not significant (it was significant when used with the size of farmland, appendix 3) indicating a problem of multicollinearity. Therefore, the model without production and training has been proposed as the main model and the results are proposed based on that model. The estimated beta coefficients of the model are further decomposed to obtain the probability of coffee sold via informal market by fully committed members and members who sell all informally and to obtain the marginal change in the proportion of informal sale by members who are selling some part of their produce on the informal market.
38
Table 11 Result of Tobit regression
Independent variables: Dependent Variable:
Share sold informally (%)
Estimate Std. Error z value
Constant -0.152 0.121 -1.258 Collection Midterm -0.218 0.052 -4.220*** Sex -0.057 0.049 -1.164 Age 0.109 0.053 2.044** Credit access -0.028 0.045 -0.618 Education -0.051 0.047 -1.100
Years of cooperative membership -0.003 0.009 -0.374
Farmland for focus crop (in ha) -0.183 0.049 -3.748***
Farmland for focus crop (in ha), squared 0.024 0.007 3.411***
Household members 0.014 0.009 1.480
Information 0.131 0.026 5.099***
Production type-mono -0.055 0.048 -1.149
Share (%) of total income derived from coffee 0.001 0.001 1.123
39 Number of different livestock for
commercialisation -0.002 0.016 -0.116 Observation 476 Log Likelihood -305.5 Wald Test 83.04 (df = 16) 𝜎 0.42 𝑍𝐿 -0.37 𝑍𝑈 0.63 Note: *p**p***p<0.01
40
Table 12 Marginal effect of independent variables on the share of coffee sold informally of the two limit Tobit model
𝜕𝜑(𝑍𝐿) 𝜕𝑥𝑖 𝐸(𝑦|𝑥, 𝐿 < 𝑦∗ < 𝑈) 𝜕𝑥𝑖 𝜕𝜑(𝑍𝑈) 𝜕𝑥𝑖 Collection Midterm*** -0.196 -0.018 -0.172 Sex -0.051 -0.005 -0.044 Age** 0.098 0.009 0.086 Credit access -0.025 -0.002 -0.022 Education -0.046 -0.004 -0.040
Years of cooperative membership -0.003 0.000 -0.003
Farmland for focus crop (in ha)*** -0.164 -0.015 -0.144
Farmland for focus crop (in ha), squared*** 0.021 0.002 0.019
Household members 0.013 0.001 0.011
Information*** 0.118 0.011 0.103
Production type-mono -0.049 -0.004 -0.043
Share (%) of total income derived from coffee 0.001 0.000 0.001
Number of other crops commercialised*** 0.091 0.008 0.080
Number of different livestock for