RIVM report 601501029/2005
Environmental Risk Limits for Nine Trace Elements
P.L.A. van Vlaardingen, R. Posthumus and C.J.A.M. Posthuma-Doodeman
This investigation has been performed for the account of the Directorate-General for
Environmental Protection, Directorate for Chemicals, Waste and Radiation, in the context of the project ‘International and National Environmental Quality Standards for Substances in the Netherlands’, RIVM-project no. 601501.
Contact:
P. van Vlaardingen
Expert Centre for Substances
E-mail: peter.van.vlaardingen@rivm.nl
National Institute for Public Health and the Environment, PO Box 1, 3720 BA Bilthoven, The Netherlands. Tel. 31-3—2749111, fax 31-30-2742971
Rapport in het kort
Milieurisicogrenzen voor negen sporenelementen
In dit rapport wordt een herziening van milieurisicogrenzen gepresenteerd voor de
sporenelementen beryllium, vanadium, cobalt, selenium, molybdeen, tin, antimoon, barium en thallium. Er werd literatuuronderzoek uitgevoerd om de gegevenssets die in 1992 voor de normafleiding zijn gebruikt, aan te vullen. Er zijn milieurisicogrenzen afgeleid voor zoet water, grondwater, bodem en sediment. De herziene milieurisicogrenzen voor water en grondwater zijn in de meeste gevallen lager dan de bestaande waarden. Dit wordt veroorzaakt door het vinden van nieuwe informatie op het gebied van toxiciteit en door veranderingen in de methodologie die bij de afleiding van normen gebruikt wordt. De nieuw afgeleide
risicogrenzen voor bodem zijn nu gebaseerd op toxiciteitsgegevens voor bodemorganismen, terwijl de bestaande waarden alle zijn berekend uit de risicogrenzen voor water, middels evenwichtspartitie. De risicogrenzen voor sediment zijn wel berekend met behulp van
evenwichtspartitie bij gebrek aan toxiciteitsgegevens. In het algemeen zijn de nieuw afgeleide milieurisicogrenzen voor sediment weinig veranderd ten opzichte van de bestaande. Het gemiddelde van gemeten concentraties van beryllium, vanadium, cobalt en barium in zoet oppervlaktewater overschrijdt het maximaal toelaatbaar risiconiveau (MTR). Voor selenium en antimoon was dit niet het geval. Voor grondwater laat een kwalitatieve vergelijking zien dat het MTR wordt overschreden voor beryllium, vanadium, cobalt, selenium en barium, maar niet voor molybdeen, tin, antimoon en thallium. Voor de compartimenten bodem, sediment en zeewater werden geen meetgegevens gevonden.
Trefwoorden: milieurisicogrenzen; metalen; sporenelementen; maximaal toelaatbaar risiconiveau; verwaarloosbaar risiconiveau
Abstract
Environmental Risk Limits for Nine Trace Elements
In this report, we present an update of environmental risk limits (ERLs), based on the literature, for nine trace elements, namely, beryllium (Be), vanadium (V), cobalt (Co), selenium (Se), molybdenum (Mo), tin (Sn), antimony (Sb), barium (Ba) and thallium (Tl). The updated ERLs, established for these elements in freshwater, groundwater, soil and sediment, are to supplement 1992 datasets for risk limit derivation. The updated ERLs for water and groundwater have turned out to be generally lower than existing limits as a result of both new information on toxicity and changes in the methodology used to derive risk limits. Risk limits derived for soil are now based on soil toxicity data for the elements investigated, whereas the existing values for soil were all based on ERLs for water using equilibrium partitioning (EqP). Due to lack of data, ERLs for sediment are still based on EqP and
generally show minor changes when compared to existing limits. The maximum permissible concentration (MPC) in rivers and lakes in the Netherlands was found to be exceeded by average measured concentrations of Be, V, Co and Ba, but not of Se and Sb. A qualitative comparison shows that the MPC in groundwater is exceeded for Be, V, Co, Se and Ba concentrations but not for Mo, Sn, Sb and Tl concentrations, although some data on deeper groundwater are missing. No measurement data could be found for the soil, sediment and marine water compartments.
Keywords: environmental risk limits; metals; trace elements; maximum permissible concentration; negligible concentration
Contents
SAMENVATTING... 9
SUMMARY ... 13
ABBREVIATIONS AND VARIABLES ... 17
1. INTRODUCTION ... 19
1.1 PROJECT FRAMEWORK... 19
1.2 ADAPTED METHODOLOGY FOR COMPOUNDS EVALUATED IN EU... 20
1.2.1 EU-risk assessment reports... 21
1.3 MAJOR DEVIATIONS DUE TO CHANGE IN GUIDANCE... 21
1.3.1 No harmonisation between compartments ... 21
1.3.2 Use of equilibrium partitioning... 21
1.3.3 No separate MPC based on microbial processes or enzymatic activities. ... 22
1.3.4 No normalisation to standard soil and sediment for metals... 22
1.4 STRATEGY FOR BIOAVAILABILITY,DEFICIENCY AND BACKGROUND CONCENTRATIONS... 23
1.4.1 Bioavailability ... 23
1.4.2 Deficiency/Essentiality ... 24
1.4.3 Background concentrations... 24
2. SUBSTANCE PROPERTIES, USE AND OCCURENCE... 27
2.1 PHYSICO-CHEMICAL PROPERTIES OF THE ELEMENTS... 27
2.2 USE, PRODUCTION AND DISCHARGE... 30
2.2.1 Beryllium... 30 2.2.2 Vanadium ... 30 2.2.3 Cobalt... 30 2.2.4 Selenium ... 31 2.2.5 Molybdenum... 31 2.2.6 Tin ... 31 2.2.7 Antimony ... 32 2.2.8 Barium... 32 2.2.9 Thallium ... 32
2.3 OCCURRENCE AND BACKGROUND CONCENTRATIONS... 33
2.3.1 Occurence – general remarks ... 33
2.3.2 Background concentrations in the Netherlands ... 33
2.3.3 Occurence and background in the Netherlands ... 34
2.3.4 Occurrence in air ... 40
3. METHODS... 41
3.1 DATA SEARCH... 41
3.2 DATA SELECTION AND TREATMENT... 41
3.2.1 Selection of data... 41
3.2.2 Treatment of data ... 41
3.3 DERIVATION OF ERLS... 45
3.3.1 Derivation of maximum permissible addition (MPA)... 45
3.3.2 Derivation of negligible addition (NA)... 45
3.3.3 Derivation of serious risk addition (SRAECO) ... 45
4. TOXICITY DATA AND DERIVATION OF MPAS AND NAS FOR WATER... 49
4.1 DATA AND ANALYSIS... 49
4.2 SPECIFIC PROBLEMS... 49
4.3 DERIVATION OF ERLS FOR WATER... 50
4.3.1 Beryllium... 50 4.3.2 Vanadium ... 50 4.3.3 Cobalt... 51 4.3.4 Selenium ... 51 4.3.5 Molybdenum... 54 4.3.6 Tin ... 56 4.3.7 Antimony ... 56 4.3.8 Barium... 57 4.3.9 Thallium ... 57
4.4 SUMMARY OF MPAWATER... 59
5. TOXICITY DATA AND DERIVATION OF ERLS FOR SOIL AND SEDIMENT... 63
5.1 DATA AND ANALYSIS... 63
5.2 EQUILIBRIUM PARTITIONING... 63
5.3 PARTITION COEFFICIENTS... 63
5.3.1 Kp values for soil ... 63
5.3.2 Kp values for sediment... 64
5.4 ERLS FOR SOIL... 65
5.4.1 Beryllium... 65 5.4.2 Vanadium ... 65 5.4.3 Cobalt... 65 5.4.4 Selenium ... 66 5.4.5 Molybdenum... 66 5.4.6 Tin ... 67 5.4.7 Antimony ... 67 5.4.8 Barium... 68 5.4.9 Thallium ... 68
5.5 SUMMARY OF NA,MPA AND SRAECO FOR SOIL... 69
5.6 NA,MPA AND SRAECO FOR SEDIMENT... 69
5.7 ERLS FOR THE SOIL AND SEDIMENT COMPARTMENT... 70
6. OVERVIEW OF ERLS, COMPARISON WITH EXISTING DUTCH EQSS... 71
6.1 SURFACE WATER... 71
6.2 GROUNDWATER... 72
6.3 SOIL... 73
6.4 SEDIMENT... 74
7. PRELIMINARY RISK ANALYSIS ... 75
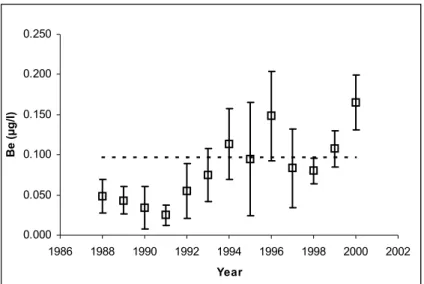
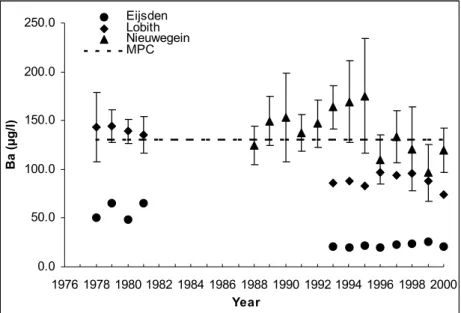
7.1 OCCURRENCE IN MAJOR DUTCH RIVERS AND LAKES... 75
7.1.1 Preliminary risk analysis surface water... 78
7.2 GROUNDWATER... 80
7.2.1 Preliminary risk analysis groundwater... 81
8. CONCLUSIONS AND RECOMMENDATIONS... 83
ACKNOWLEDGEMENTS... 89
REFERENCES... 91
APPENDIX 1: TOXICITY DATASETS OF 1992 VS 2004 ... 95
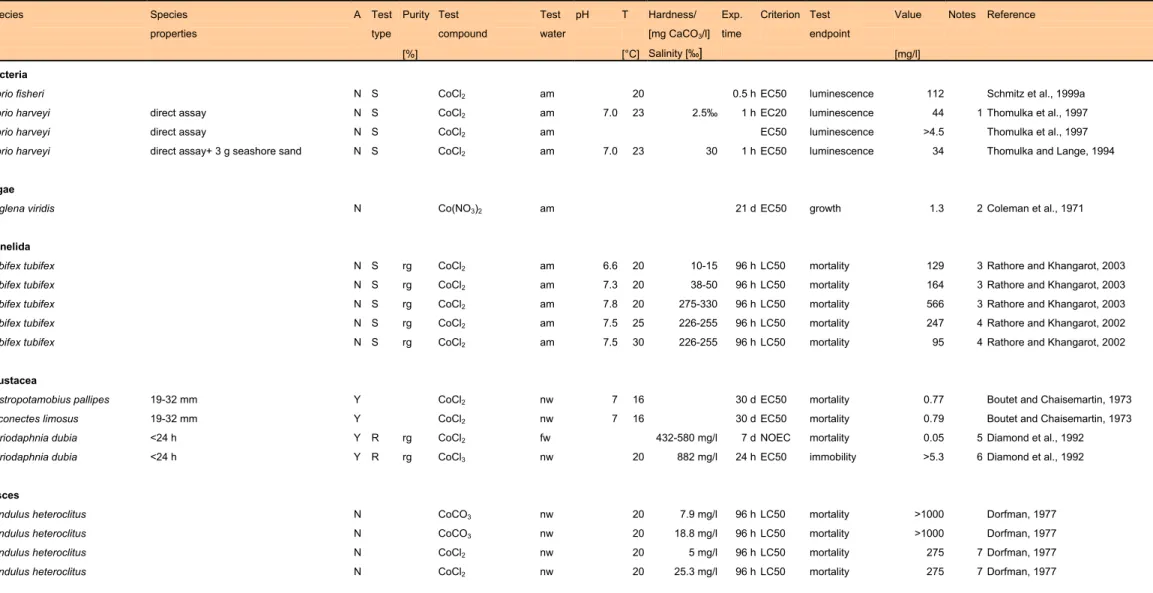
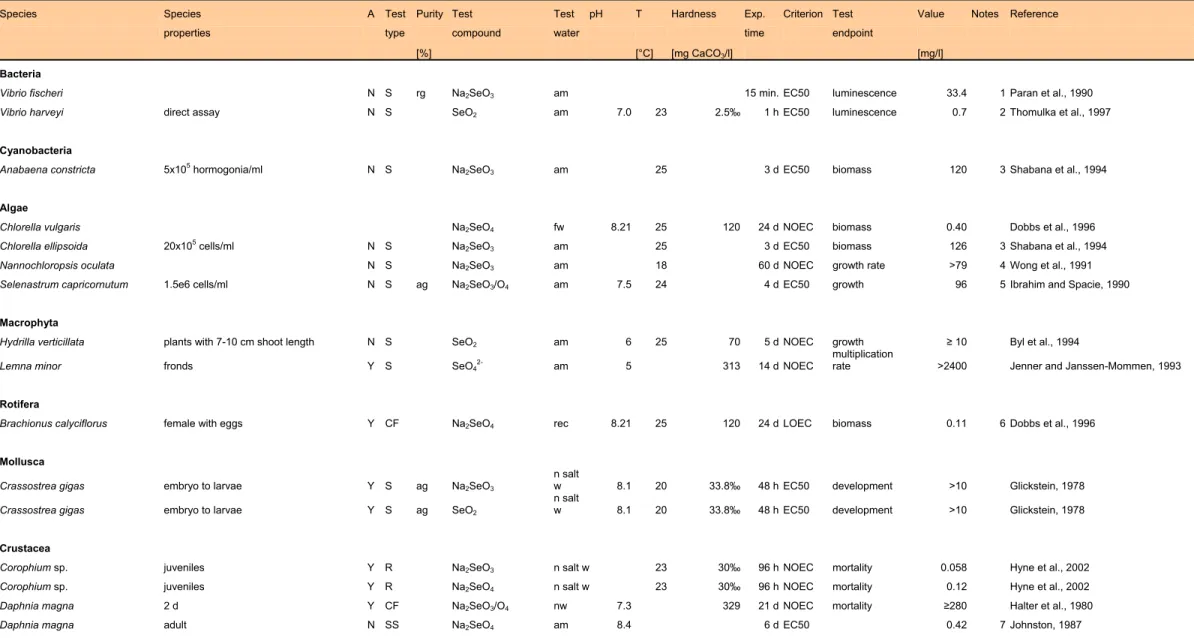
APPENDIX 2. INFORMATION ON AQUATIC TOXICITY... 97
APPENDIX 3. INFORMATION ON SOIL TOXICITY... 165
APPENDIX 4. AQUATIC TOXICITY DATA USED FOR EXTRAPOLATION... 197
APPENDIX 5. TERRESTRIAL TOXICITY DATA USED FOR EXTRAPOLATION ... 207
APPENDIX 6. WATER CONCENTRATIONS OF SEVERAL ELEMENTS... 213
APPENDIX 7. WATER SOLUBILITIES OF SALTS... 227
APPENDIX 8. REFERENCES TO TOXICITY DATA ... 231
Samenvatting
In dit rapport zijn maximaal toelaatbare risiconiveaus (MTRs), verwaarloosbaar risiconiveaus (VRs) en ‘Serious Risk Concentrations’ voor ecosystemen (SRCECOs ) afgeleid voor negen
elementen die in lage concentraties in het milieu voorkomen (sporenelementen), te weten: beryllium (Be), vanadium (V), cobalt (Co), selenium (Se), molybdeen (Mo), tin (Sn),
antimoon (Sb), barium (Ba) en thallium (Tl). Het MTR representeert het potentiële risico van een stof voor een ecosysteem en deze norm wordt afgeleid met gebruik van ecotoxicologische en milieuchemische data. MTRs vormen de wetenschappelijke basis voor
milieukwaliteitsnormen die worden vastgesteld door de stuurgroep stoffen. De meeste van de negen onderzochte elementen worden beschouwd als metalen en/of ze gedragen zich als metalen in het milieu. De bestaande gegevensset met ecotoxicologische gegevens dateert uit 1992. In het huidige onderzoek werd literatuuronderzoek uitgevoerd om nieuwe
ecotoxicologische gegevens over deze elementen te verzamelen. De gegevensset uit 1992 werd aangevuld met de nieuwe gegevens. Er werd ook gezocht naar gegevens omtrent adsorptiegedrag van de negen elementen en naar gegevens omtrent het voorkomen in verscheidene milieucompartimenten (oppervlaktewater, zeewater, grondwater, bodem) in Nederland. Voor de volledigheid moet worden opgemerkt dat voor antimoon geen VR en MTR zijn afgeleid omdat momenteel een Europese risicobeoordeling wordt opgesteld voor diantimoon trioxide.
De stuurgroep van het project INS heeft besloten voor het afleiden van nationale
milieukwaliteitsnormen per 1-1-2004 de Europese richtlijnen voor de risicobeoordeling van nieuwe en bestaande stoffen en biociden (TGD) te gebruiken. Dit rapport is het eerste waarin deze richtlijnen werden gebruikt voor de afleiding van Nederlandse milieukwaliteitsnormen. De keuze voor het gebruik van een andere richtlijn heeft verschillende gevolgen voor wat betreft afleidingsmethoden en de karakteristieken van de afgeleide normen. De belangrijkste veranderingen worden kort in dit rapport besproken.
Voor de afleiding van de normen is gebruik gemaakt van het toegevoegd risico-concept (achtergrondconcentratie + toevoeging). Als gevolg van een toename van het aantal
toxiciteitsstudies met bodemorganismen en een minder belangrijke rol voor evenwichtspartitie (EqP) door de keuze voor de nieuwe richtlijn, zijn alle milieukwaliteitsnormen voor bodem voor de negen elementen nu gebaseerd op toxiciteitsgegevens voor bodemorganismen. Van de nieuw afgeleide MTRs vallen er 7 van de 8 binnen een factor 3 van de oude. Een belangrijk verschil is dat de TGD geen percentage lutum definieert voor standaard-bodem. Daarom zijn de nieuwe normen niet langer uitgedrukt in standaard-bodem. De meeste nieuw afgeleide MTRs voor het aquatisch compartiment zijn lager (d.w.z. strenger) dan de bestaande MTRs. De verschillen worden veroorzaakt door het beschikbaar komen van nieuwe gegevens en/of de verandering van beoordelingsmethodiek (TGD). De MTRs voor grondwater zijn ook iets verlaagd, maar ze vallen in het algemeen binnen een factor 2-3 van de bestaande MTRs. De belangrijkste reden voor de verlaging is dat deze MTRs berekend worden uit het MTR voor water waarvan, zoals gezegd, de meeste verlaagd zijn. Voor sediment werden, evenals in 1992, geen toxiciteitsgegevens gevonden en alle milieunormen werden ook nu berekend met behulp van evenwichtspartitie. Een verandering ten opzichte van de bestaande normen is dat in dit rapport, bij de toepassing van evenwichtspartitie, gebruik werd gemaakt van
karakteristieken van zwevend stof (TGD). Voor zeewater werd voor alle negen elementen een maximaal toelaatbare toevoeging (MTT) afgeleid. Omdat achtergrondconcentraties voor zeewater ontbraken konden geen MTR, VR en SRCECO worden berekend.
Voor bodem, zeewater en sediment zijn geen meetgegevens beschikbaar. Er werden
meetgegevens gevonden voor Be, V, Co, Se, Sb en Ba in Nederlands oppervlaktewater (meest grote rivieren en enkele meren) in de periode 1972-2000. Op sommige locaties overschrijden jaargemiddelde of langjarig gemiddelde concentraties van Be, V, Co en Ba het MTR, terwijl de gemiddelden voor Se en Sb onder het MTR blijven. In grondwater zijn voor de meeste gevallen uitgebreide meetseries voorhanden, gemeten in jaren uit de periode 1982-1999. In ondiep grondwater overschrijden Be, V, Co en Se concentraties het MTR op veel van de bemonsterde locaties, terwijl in dieper grondwater het MTR regelmatig wordt overschreden door Be, Co, Se en Ba concentraties.
De afgeleide milieurisiconiveaus voor oppervlaktewater zijn weergegeven in Tabel 1
(opgeloste fractie) en in Tabel 2 (totale waterfase). Voor grondwater zijn alleen risiconiveaus voor de opgeloste fractie berekend (Tabel 3) en de toegevoegd risiconiveaus voor zeewater zijn weergegeven in Tabel 4. De afgeleide milieurisiconiveaus voor bodem en sediment zijn weergegeven in Tabel 5 en Tabel 6.
N.B. De waarden voor bodem en sediment zijn uitgedrukt in µg.kg-1 bodem en µg.kg-1 sediment, niet in standaard-bodem of standaard-sediment.
Tabel 1. Achtergrondconcentraties, toevoegingen en milieurisiconiveaus voor negen sporenelementen in water (opgeloste fractie).
Opgelost Opgelost Opgelost Opgelost
Element Symbool
Cb
[µg.l-1] [µg.lVT -1] [µg.lVR -1] [µg.lMTT -1] [µg.lMTR -1] SRA[µg.lECO-1] SRC[µg.lECO-1]
beryllium Be 0,017 0,00080 0,018 0,080 0,097 49 49 vanadium V 0,82 0,041 0,86 4,1 4,9 98 99 cobalt Co 0,19 0,0050 0,20 0,50 0,69 750 750 selenium Se 0,041 0,021 0,062 2,1 2,1 220 220 molybdeen Mo 1,3 0,29 1,6 29 30 54000 54000 tin Sn 0,0082 0,03 0,038 3,0 3,0 400 400 antimoon Sb 0,29 –a –a –a –a 11000 11000 barium Ba 73 0,58 74 58 130 15000 15000 thallium Tl 0,038 0,0016 0,040 0,16 0,20 6,5 6,5
ageen VT, VR, MTT en MTR afgeleid (zie paragraaf 1.2.1).
Tabel 2. Milieurisiconiveaus voor negen sporenelementen in water (totale water fase).
T o t a a l Element Symbool VR [µg.l-1] [µg.lMTR -1] SRC[µg.lECO-1] beryllium Be 0,018 0,10 51 vanadium V 1,0 5,8 120 cobalt Co 0,23 0,81 880 selenium Se 0,063 2,2 230 molybdeen Mo 1,7 31 56000 tin Sn 0,46 37 4900 antimoon Sb –a –a 12000 barium Ba 77 140 16000 thallium Tl 0,041 0,21 6,8
Tabel 3. Achtergrondconcentraties, toevoegingen en milieurisiconiveaus voor negen sporenelementen in grondwater (opgeloste fractie).
Opgelost Opgelost Opgelost Opgelost
Element Symbool
Cb
[µg.l-1] [µg.lVT -1] [µg.lVR -1] [µg.lMTT -1] [µg.lMTR -1] SRA[µg.lECO-1] SRC[µg.lECO-1]
beryllium Be 0,05 0,00080 0,051 0,080 0,13 49 49 vanadium V 1,2 0,041 1,2 4,1 5,3 98 99 cobalt Co 0,63 0,0050 0,64 0,50 1,1 750 750 selenium Se 0,024 0,021 0,045 2,1 2,1 220 220 molybdeen Mo 0,69 0,29 1,0 29 30 54000 54000 tin Sn 2 0,030 2,0 3,0 5,0 400 400 antimoon Sb 0,091 –a –a –a –a 11000 11000 barium Ba 197 0,58 200 58 260 15000 15000 thallium Tl 2 0,0016 2,0 0,16 2,2 6,5 8,5
ageen VT, VR, MTT en MTR afgeleid (zie paragraaf 1.2.1).
Tabel 4. Achtergrondconcentraties, toevoegingen en milieurisiconiveaus voor negen sporenelementen in zeewater (opgeloste fractie).
Opgelost Opgelost Opgelost Opgelost
Element Symbool [µg.lCb-1] [µg.lVT -1] [µg.lVR -1] [µg.lMTT -1] [µg.lMTR -1] SRA[µg.lECO-1] SRC[µg.lECO-1]
beryllium Be - 0,000080 – 0,0080 – 49 – vanadium V - 0,0041 – 0,41 – 98 – cobalt Co - 0,0010 – 0,10 – 750 – selenium Se - 0,021 – 2,1 – 220 – molybdeen Mo - 0,029 – 2,9 – 54000 – tin Sn - 0,0030 – 0,30 – 400 – antimoon Sb - –a – –a – 11000 – barium Ba - 0,058 – 5,8 – 15000 – thallium Tl - 0,00016 – 0,016 – 6,5 –
- betekent: geen waarde beschikbaar.
ageen VT en MTT afgeleid (zie paragraaf 1.2.1).
Tabel 5. Achtergrondconcentraties, toevoegingen en milieurisiconiveaus voor negen sporenelementen in bodem.
Element Symbool
Cb
[mg.kg-1] [mg.kgVT -1] [mg.kgVR -1] [mg.kgMTT -1] [mg.kgMTR -1] [mg.kgSRAECO-1] [mg.kgSRCECO-1]
beryllium Be 1,1 0,0043 1,1 0,43 1,5 1,9 3,0 vanadium V 42 0,00032 42 0,032 42 25 67 cobalt Co 9 0,0023 9,0 0,23 9,2 15 24 selenium Se 0,7 0,000058 0,70 0,0058 0,71 1,2 1,9 molybdeen Mo 0,5 0,0076 0,51 0,76 1,3 270 270 tin Sn 19 0,00068 19 0,068 19 250 270 antimoon Sb 3,0 –a –a –a –a 51 54 barium Ba 155 0,082 160 8,2 160 210 360 thallium Tl 1,0 0,001 1,0 0,10 1,1 1,0 2,0
De waarden in deze tabel zijn uitgedrukt mg.kg-1 bodem (geen karakteristieken), niet in standaard-bodem. ageen VT, VR, MTT en MTR afgeleid (zie paragraaf 1.2.1).
Tabel 6. Achtergrondconcentraties, toevoegingen en milieurisiconiveaus voor negen sporenelementen in sediment.
Element Symbool
Cb
[mg.kg-1] [mg.kgVT -1] [mg.kgVR -1] [mg.kgMTT -1] [mg.kgMTR -1] [mg.kgSRAECO-1] [mg.kgSRCECO-1]
beryllium Be 1,1 0,00068 1,1 0,078 1,2 42 43 vanadium V 42 0,24 42 24 66 560 610 cobalt Co 9 0,030 9,0 3,0 12 4500 4500 selenium Se 0,7 0,013 0,71 1,3 2,0 140 140 molybdeen Mo 0,5 0,37 0,87 37 38 70000 70000 tin Sn 19 56 75 5600 5600 150000 150000 antimoon Sb 3,0 –a –a –a –a 43000 43000 barium Ba 155 0,88 160 88 240 23000 23000 thallium Tl 1,0 0,0024 1,0 0,24 1,2 10 11
De waarden in deze tabel zijn uitgedrukt mg.kg-1 sediment (geen karakteristieken), niet in standaard-sediment. ageen VT, VR, MTT en MTR afgeleid (zie paragraaf 1.2.1).
Summary
In this report maximum permissible concentrations (MPCs), negligible concentrations (NCs) and Serious Risk Concentrations for the ecosystem (SRCECOs) are derived for nine elements
that occur in low concentrations in the environment (trace elements): beryllium (Be), vanadium (V), cobalt (Co), selenium (Se), molybdenum (Mo), tin (Sn), antimony (Sb), barium (Ba) and thallium (Tl). The MPC represents the potential risk of substances to the ecosystem and it is derived using data on (eco)toxicology and environmental chemistry. MPCs are the scientific basis for Environmental Quality Standards (EQSs) set by the Steering Committee for Substances. Most of the elements are considered to be metals and/or behave like metals in the environment. The existing dataset on ecotoxicological information dates from 1992. In the present project, literature research was performed to collect new
ecotoxicological data on these elements. The 1992 dataset was supplemented with newly found data. A data search was also performed for data on sorption properties of the nine elements and on occurrence of the nine elements in several environmental compartments (surface water, sea water, groundwater, soil). It should be noted that no NC and MPC were derived for antimony since a European risk assessment is currently being drafted for diantimony trioxide.
The steering committee of the project ‘International and National environmental quality standards for Substances in the Netherlands’ (INS) has recently decided to use the guidance given in the Technical Guidance Document (TGD) of the European Commission for the derivation of ERLs in the Netherlands. This report is the first in which this guidance was applied to the derivation of Dutch national environmental risk limits. The choice for the use of a different guideline has had several consequences with respect to methods of derivation and characteristics of the standards derived. The most important changes are highlighted in this report.
The added risk approach was used for derivation of the standards. Due to an increase in the number of available soil toxicity studies and a less important role for equilibrium partitioning (EqP) as a consequence of new guidance, all ERLs for soil for all nine elements are now based on soil toxicity data. Of the derived MPCs, 7 out of 8 are a within factor of 3 of the old MPCs. One important difference that should be kept in mind, is that ERLs are no longer expressed in standard soil since the TGD does not define a fixed percentage lutum for
standard soil. Most of the newly derived MPCs for the aquatic compartment decrease (i.e. are more conservative) compared to existing MPC values. The retrieval of new toxicity data or the change in guidance (or a combination of both) has caused most of these changes. The MPCs for groundwater have generally decreased within a factor of 2-3 of the existing MPCs. The main reason here, is that these values are based on the MPCs for water, most of which have decreased. For sediment, no toxicity data were found (as in 1992), and all ERLs are calculated using EqP. A difference with respect to the existing standards is that in this report, in the application of EqP, suspended matter characteristics are used (following TGD). For seawater, only a maximum permissible addition (MPA) was derived for all nine elements. Since background concentrations were absent, we could not calculate MPCs, NCs and SRCECOs.
Measurement data were found for Be, V, Co, Se, Sb and Ba in freshwater bodies in the Netherlands (mostly major rivers and some lakes) within the period 1972-2000. At some locations, long-term average values of concentrations of Be, V, Co and Ba exceed the MPC,
while these averages for Se and Sb are below the MPC. In groundwater extended
measurement series are available in most cases, measured in years from the period 1982-1999. In shallow groundwater Be, V, Co and Se concentrations exceed the MPC at many of the locations, while in deeper groundwater regular MPC exceedance for Be, Co, Se and Ba is observed. Monitoring data of these compounds in several compartments are missing: data for soil, seawater and sediment are lacking and for some elements no data in surface water are available.
The derived enironmental risk limits for surface water are shown in Table 1 (dissolved fraction) and Table 2 (total water phase). Risk limits for groundwater were calculated for the dissolved fraction only (Table 3) and the added risk limits for seawater are presented in Table 4. Environmental risk limits for soil and sediment are shown in Table 5 and Table 6. N.B. The values for soil and sediment are expressed in µg.kg-1 soil and µg.kg-1 sediment, not in standard soil or standard sediment.
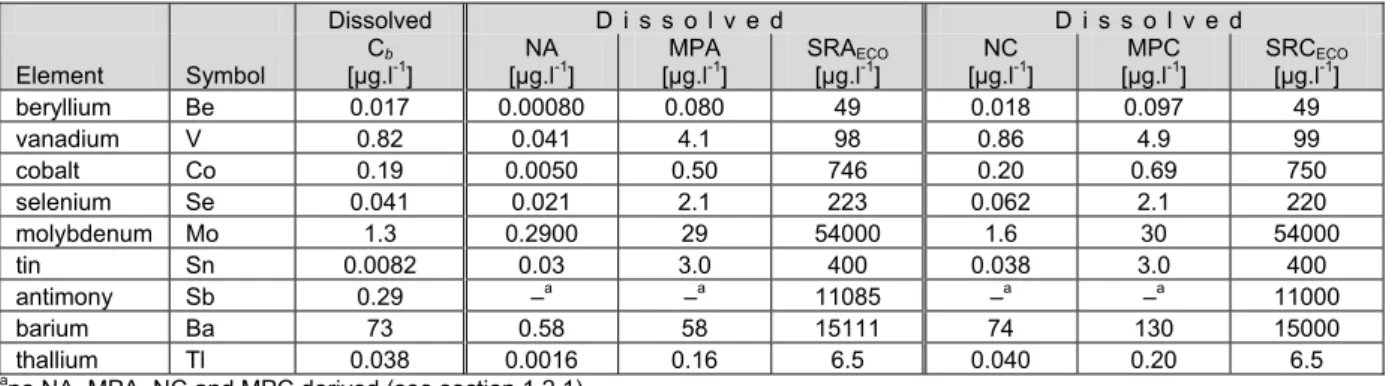
Table 1. Background concentrations, additions and environmental risk limits for nine trace elements for surface water (dissolved fraction).
Dissolved Dissolved Dissolved Dissolved
Element Symbol
Cb
[µg.l-1] [µg.lNA -1] [µg.lNC -1] [µg.lMPA -1] [µg.lMPC -1] SRA[µg.lECO-1] SRC[µg.lECO-1]
beryllium Be 0.017 0.00080 0.018 0.080 0.097 49 49 vanadium V 0.82 0.041 0.86 4.1 4.9 98 99 cobalt Co 0.19 0.0050 0.20 0.50 0.69 750 750 selenium Se 0.041 0.021 0.062 2.1 2.1 220 220 molybdenum Mo 1.3 0.29 1.6 29 30 54000 54000 tin Sn 0.0082 0.03 0.038 3.0 3.0 400 400 antimony Sb 0.29 –a –a –a –a 11000 11000 barium Ba 73 0.58 74 58 130 15000 15000 thallium Tl 0.038 0.0016 0.040 0.16 0.20 6.5 6.5
ano NA, NC, MPA and MPC derived (see section 1.2.1).
Table 2. Environmental risk limits for nine trace elements for surface water (total water phase).
T o t a l Element Symbol NC [µg.l-1] [µg.lMPC -1] SRC[µg.lECO-1] beryllium Be 0.018 0.10 51 vanadium V 1.0 5.8 120 cobalt Co 0.23 0.81 880 selenium Se 0.063 2.2 230 molybdenum Mo 1.7 31 56000 tin Sn 0.46 37 4900 antimony Sb –a –a 12000 barium Ba 77 140 16000 thallium Tl 0.041 0.21 6.8
Table 3. Background concentrations, additions and environmental risk limits for nine trace elements for ground water (dissolved fraction).
Dissolved Dissolved Dissolved Dissolved
Element Symbol
Cb
[µg.l-1] [µg.lNA -1] [µg.lNC -1] [µg.lMPA -1] [µg.lMPC -1] SRA[µg.lECO-1] SRC[µg.lECO-1]
beryllium Be 0.05 0.00080 0.051 0.080 0.13 49 49 vanadium V 1.2 0.041 1.2 4.1 5.3 98 99 cobalt Co 0.63 0.0050 0.64 0.50 1.1 750 750 selenium Se 0.024 0.021 0.045 2.1 2.1 220 220 molybdenum Mo 0.69 0.29 1.0 29 30 54000 54000 tin Sn 2 0.030 2.0 3.0 5.0 400 400 antimony Sb 0.091 –a –a –a –a 11000 11000 barium Ba 197 0.58 200 58 260 15000 15000 thallium Tl 2 0.0016 2.0 0.16 2.2 6.5 8.5
ano NA, NC, MPA and MPC derived (see section 1.2.1).
Table 4. Background concentrations, additions and environmental risk limits for nine trace elements for sea water (dissolved fraction).
Dissolved Dissolved Dissolved
Element Symbol [µg.lCb-1] [µg.lNA -1] [µg.lNC -1] [µg.lMPA -1] [µg.lMPC -1] SRA[µg.lECO-1] SRC[µg.lECO-1]
beryllium Be – 0.000080 – 0.0080 – 49 – vanadium V – 0.0041 – 0.41 – 98 – cobalt Co – 0.0010 – 0.10 – 750 – selenium Se – 0.021 – 2.1 – 220 – molybdenum Mo – 0.029 – 2.9 – 54000 – tin Sn – 0.0030 – 0.30 – 400 – antimony Sb – –a – –a – 11000 – barium Ba – 0.058 – 5.8 – 15000 – thallium Tl – 0.00016 – 0.016 – 6.5 –
- means: no data available.
ano NA and MPA derived (see section 1.2.1).
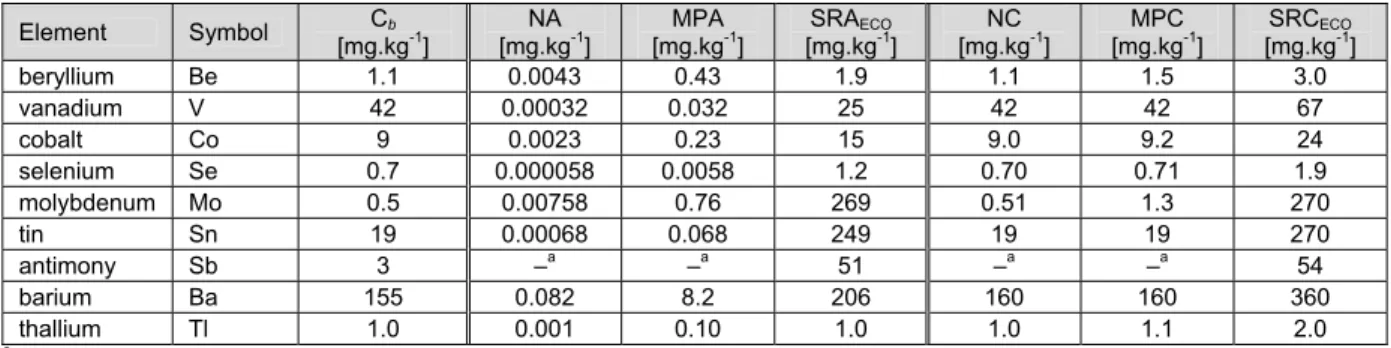
Table 5. Background concentrations, additions and environmental risk limits for nine trace elements for soil.
Element Symbol
Cb
[mg.kg-1] [mg.kgNA -1] [mg.kgNC -1] [mg.kgMPA -1] [mg.kgMPC -1] [mg.kgSRAECO-1] [mg.kgSRCECO-1]
beryllium Be 1.1 0.0043 1.1 0.43 1.5 1.9 3.0 vanadium V 42 0.00032 42 0.032 42 25 67 cobalt Co 9 0.0023 9.0 0.23 9.2 15 24 selenium Se 0.7 0.000058 0.70 0.0058 0.71 1.2 1.9 molybdeen Mo 0.5 0.0076 0.51 0.76 1.3 270 270 tin Sn 19 0.00068 19 0.068 19 250 270 antimoon Sb 3 –a –a –a –a 51 54 barium Ba 155 0.082 160 8.2 160 210 360 thallium Tl 1.0 0.001 1.0 0.10 1.1 1.0 2.0
The values in this table are expressed in mg.kg-1 soil (no characteristics), not in standard soil. ano NA, NC, MPA and MPC derived (see section 1.2.1).
Table 6. Background concentrations, additions and environmental risk limits for nine trace elements for sediment.
Element Symbol
Cb
[mg.kg-1] [mg.kgNA -1] [mg.kgNC -1] [mg.kgMPA -1] [mg.kgMPC -1] [mg.kgSRAECO-1] [mg.kgSRCECO-1]
beryllium Be 1.1 0.00068 1.1 0.078 1.2 42 43 vanadium V 42 0.24 42 24 66 560 610 cobalt Co 9 0.030 9.0 3.0 12 4500 4500 selenium Se 0.7 0.013 0.71 1.3 2.0 140 140 molybdenum Mo 0.5 0.37 0.87 37 38 70000 70000 tin Sn 19 56 75 5600 5600 150000 150000 antimony Sb 3 –a –a –a –a 43000 43000 barium Ba 155 0.88 160 88 240 23000 23000 thallium Tl 1.0 0.0024 1.0 0.24 1.2 10 11
The values in this table are expressed in mg.kg-1 sediment (no characteristics), not in standard sediment. ano NA, NC, MPA and MPC derived (see section 1.2.1).
Abbreviations and variables
Ba barium Be beryllium CAS chemical abstract service
CEC cation exchange capacity
Co cobalt
dw dry weight
EC10, EC50 effect concentration causing 10% or 50% effect, respectively EPA Environmental Protection Agency
EqP equilibrium partitioning
ERL environmental risk limit EQS environmental quality standard
EU European Union
EU-RAR European Union-risk assessment report
TGD technical guidance document (for the risk assessment of new and existing chemicals and biocides within the European Union)
HC hazardous concentration
INS the project ‘International and National environmental quality standards for Substances in the Netherlands’
Kd sorption coefficient soil/water or sediment/water
Koc organic carbon normalised sorption coefficient
Kp partition coefficient soil/water or sediment/water
Kppm partition coefficient standard suspended (particulate) matter/water
Kp, susp partition coefficient suspended matter/water (nomenclature as used in
EU-RAR)
LC10, LC50 lethal concentration (causing 10% or 50% lethality, respectively) LOEC lowest observed effect concentration
MATC maximum acceptable toxicant concentration Mo molybdenum
MPA maximum permissible addition MPC maximum permissible concentration
NA negligible addition
NC negligible concentration
NOEC no observed effect concentration
o.m. organic matter
PNEC predicted no effect concentration
RIKZ National Institute for Coastal and Marine Management RIVM National Institute for Public Health and the Environment
RIZA Institute for Inland Water Management and Waste Water Treatment
RQ risk quotient
SRAECO ecotoxicological serious risk addition
SRCECO ecotoxicological serious risk concentration
Sb antimony (stibium)
Se selenium
Sn tin (stannum)
SSD species sensitivity distribution
Sw water solubility
Tl thallium V vanadium
VROM Dutch Ministry of Housing, Spatial Planning and the Environment V&W Dutch Ministry of Transport, Public Works and Water Management
1.
Introduction
1.1
Project Framework
This report is a result in the project ‘International and National environmental quality standards for Substances in the Netherlands’, abbreviated with INS. Until 1-1-2004 this project was called ‘Setting Integrated Environmental Quality Standards’. The guidance for this project was laid down in Traas (2001). From 1-1-2004, the context of the project has changed, which has resulted in a different name: ‘International and National Environmental Quality Standards for Substances in the Netherlands’. The abbreviation INS is still used as acronym for the project. The most important change with respect to content is that the
guidance used to derive environmental risk limits is now the Technical Guidance Document
(TGD), issued by the European Commission and developed in support of the risk assessment of new notified chemical substances, existing substances and biocides (ECB, 2003).
The aim of the project is to derive environmental risk limits (ERLs) for substances in the environment for the compartments air, (ground)water, sediment and soil. Environmental risk limits (ERLs) serve as advisory values to set environmental quality standards (EQS) by the Ministry of VROM for various policy purposes. The term EQS is used to designate all legally and non-legally binding standards that are used in Dutch environmental policy and Table 7 shows the correspondence between ERLs and EQSs. The various ERLs are:
• the negligible concentration (NC) for water, soil, groundwater, sediment and air; • the maximum permissible concentration (MPC) for water, soil, groundwater, sediment
and air;
• the ecotoxicological serious risk concentration (SRCECO) for water, soil, groundwater and
sediment.
Table 7. Environmental risk limits (ERLs) and related environmental quality standards (EQS) that are set by the Dutch government in the Netherlands for the protection of ecosystems.
Description ERL EQS
The NC represents a value causing negligible effects to ecosystems. The NC is derived from the MPC by dividing it by 100. This factor is applied to take possible combined effects into account.
NC (for air, water, soil,
groundwater and sediment)
Target value (for air, water, soil, groundwater and sediment) The MPC is the concentration of a substance in air,
water, soil or sediment that should protect all species in ecosystems from adverse effects of that substance. Depending on the amount of
toxicological data available, the lowest toxicity result is divided by a fixed value (assessment factor). When enough data are available, a cut-off value is used. This is the fifth percentile if a species sensitivity distribution of NOECs is used. This is the hazardous concentration for 5% of the species, the HC5NOEC.
MPC (for air, water, soil,
groundwater and sediment)
MPC
(for air, water, sediment)
The SRCECO is the concentration of a substance in
the soil, sediment or groundwater at which functions in these compartments will be seriously affected or are threatened to be negatively affected. This is assumed to occur when 50% of the species and/or 50% of the microbial and enzymatic processes are possibly affected, the HC50NOEC.
SRCECO
(for water, soil, groundwater and
sediment)
Intervention value after comparison with SRChuman (for
soil, sediment and groundwater)
The process of deriving integrated ERLs is shown schematically in Figure 1. ERLs for water are reported for dissolved and total concentrations (including a standard amount of suspended matter) and if found significantly different, differentiated to freshwater and salt water. Each of
the ERLs and its corresponding EQS represents a different level of protection, with increasing numerical values in the order NC < MPC1 < SRCECO. Each EQS demands different actions
when one of them is exceeded, explained elsewhere (VROM, 2001).
This report is one of a series of RIVM reports that were published in the framework of the project INS in which ERLs and EQSs were derived for approximately 250 substances and groups of substances. For an overview of the EQSs set by the Ministry of VROM, see INS (1999) and VROM (2001). The Expert Centre for Substances of RIVM has recently launched a website at which all EQSs are available. The website can be found at: http://www.stoffen-risico.nl.
1. Literature search and evaluation of ecotoxicological data for water, air, soil and sediment
RIVM
VROM
Parameters and criteria
3. Calculation of MPC and NC for water, air, soil, sediment and groundwater; SRCeco for water, soil,
sediment and groundwater 2. Data selection
5. Setting of EQS: MPC, target value and intervention value
Figure 1. The process of deriving integrated environmental risk limits. Above the line the method to derive ERLs is indicated, i.e. MPC, NC and SRCECO. Below the line the MPC and target value are
indicated, set by the Ministry of Housing, Spatial Planning and the Environment (VROM).
1.2
Adapted methodology for compounds evaluated in EU
At present the Dutch Ministry of Housing, Spatial Planning and the Environment (VROM) has the policy to take over predicted no effect concentrations (PNEC) from a European risk assessment report (EU-RAR) for an existing substance when these PNECs have already been or are being derived at the time the Ministry seeks advice (that is, requests for an MPC to be derived) for that substance. During the course of this project a first draft of a European risk assessment report (EU-RAR) became available for antimony tri-oxide (Sb2O3). The
environmental risk assessment section of this EU-RAR does include effect studies with antimony salts other than antimony tri-oxide. The derived PNEC values will therefore be valid for antimony. In the present report, we will present our collected effect data on
1 A complicating factor is that the term MPC is used both as an ERL and as an EQS. For historical reasons,
antimony, but we will not derive environmental risk limits for the reason outlined above. The following section very briefly introduces the European existing substances framwork.
In 1993 the Council of the European Communities adopted Council Regulation (EEC) 793/93 or the Existing Substances Regulation (ESR), thereby introducing a comprehensive
framework for the evaluation and control of existing chemical substances. This is a legal instrument that was proposed by the European Commission upon approval of the Fourth Community Action Programme on the Environment (1987-1992) by the Council. The Commission, in consultation with member states, drew up four priority lists for substances that are to be evaluated for both human and environmental risks. For a given prioritised compound, this process will result in a EU-RAR at step 3 of the regulation. In the
environmental section of a RAR, environmental risk limits are derived for each environmental compartment, which are called predicted no effect concentrations (PNEC). A PNEC is
comparable to the maximum permissible concentration (MPC), which is the environmental risk limit (ERL) used as an advisory value within the Dutch national framework of setting environmental quality standards (EQS).
1.2.1 EU-risk assessment reports
During the course of this project a project, a draft version of an EU RAR for antimony tri-oxide (Sb2O3) became available. Since this RAR has a draft status, no data may be used for
publication, until the final report is issued. MPCs and NCs will not be derived for antimony in this report for reasons outlined in the following section.
To derive an MPC at the national level while a PNEC derivation at the European level is in progress is not preferable because new data (e.g. toxicity studies) may be added to the data set that may alter the outcome of the ERL derivation. In compliance with the present viewpoint of the Ministry of VROM (see section 1.2), the PNEC values of antimony will be taken over as MPC values when the finalised version of the draft EU-RAR is issued.
We will, however, derive SRCECO values for antimony in this report, since the SRCECO is an
ERL derived at the national level, that is not derived in an EU-RAR.
1.3
Major deviations due to change in guidance
This section gives an overview of the major consequences of the change in guidance from INS to TGD. Some of the differences between the TGD methodology (ECB, 2003) and former INS methodology with regard to environmental risk limit derivation are highlighted in Janssen et al. (2004).
1.3.1 No harmonisation between compartments
Following TGD guidance, ERLs are no longer harmonised between environmental compartments. This means that preclusion of ERL exceedance in a given environmental compartment by some environmental concentration of a substance below the ERL in another compartment is no longer warranted.
1.3.2 Use of equilibrium partitioning
The difference with the former INS methodology is that the use of EqP for the derivation of soil standards is restricted to very limited datasets. As explained in section 1.3.1,
harmonisation is no longer performed, while in the former INS methodology this step was always performed (making use of EqP).
For application of assessment factors to derive a PNECsoil, the TGD states in section 3.6,
(Effects assessment for the terrestrial compartment): ‘when only one test result with soil dwelling organisms is available the risk assessment is performed both on the basis of this result using assessment factors and on the basis of the equilibrium partitioning (EqP) method.’ This statement is later refined to ‘If only one terrestrial test result is available (earthworms or plants), the risk assessment should be performed both of this test result and on the basis of the outcome of the aquatic toxicity data to provide an indication of risk’.
Our interpretation of this guidance is that when only one test result is available with a soil dwelling organism, the MPCsoil will be derived using both EqP and using assessment factors. The lowest result will be chosen as MPC.
1.3.3 No separate MPC based on microbial processes or enzymatic
activities.
In the former INS methodology, two MPC values for the soil compartment were derived (if enough data were available): an MPC for microbial processes and enzymatic activities and an MPC for other soil species (e.g. plants, earthworms, insects). The rationale behind this
separation was that an ecotoxicological tests on microbial processes is fundamentally different from a single species test. In a microbial community under toxic stress, the processes carried out can be taken over by less sensitive species. The results of these types of studies can therefore not be averaged.
Following TGD guidance, tests on microbial communities, micro-organisms, enzymatic reactions etc. are considered to represent one trophic level and are treated as such in the scheme of assessment factors. Therefore, only one MPCsoil per element will be derived in this
report. Note that if enough data are available to calculate a species sensitivity distribution (SSD), data on microbial processes and enzymatic activity and terrestrial species are separated as well.
1.3.4 No normalisation to standard soil and sediment for metals
In this report, concentrations in soil and sediment have not been normalised to a predefined standard soil (or sediment) with fixed characteristics, as was the case in the former INS methodology. For the application of this methodology, a standard lutum (or clay) content should be defined, which was 25% for both soil and sediment in the INS methodology. The TGD does not define a standard lutum content. Further considerations on this topic are elaborated in section 1.3.4.1. The interpretation of ERLs for soil and sediment is nowcomparable to ERLs for the aquatic environment in that an ERL in soil or sediment should be regarded as ‘a’ concentration in soil (or sediment), applicable to any soil (or sediment), regardless of its characteristics.
1.3.4.1 No normalisation to standard soil and sediment: considerations
In this section, the considerations are given on the decision not to normalise toxicity data in soil to standard soil. However, the conclusion of this is also applicable to sediment. In parts 1, 3 and 4 of this section, soil can be read as synonym to sediment and terrestrial to benthic. 1. For the effect assessment of the terrestrial compartment, the TGD states that test results
should be converted to a standard soil containing 3.4% organic matter. However, for metals, the organic matter fraction in soil does not play a significant role in
bioavailability, and if so, it has not been quantified for the elements investigated here. The TGD further states that ‘data should be normalised using relationships that describe the bioavailability of chemicals in soils’. In Appendix VIII, the TGD takes notice of the reference lines that have been used in Dutch risk limit derivation for metals in the past. Van de Plassche et al. (1992), have also used these reference lines for their ERL
derivation of the nine elements considered here. For these elements, the relationship described by the reference lines is based on the lutum content of the soil only. However, for the EU standard soil, a value for the lutum (or clay) content has not been defined (ECB, 2003). A recalculation to EU standard soil using the reference lines is therefore not possible. Defining a standard lutum value for the EU standard soil within the framework of this report would be an option to overcome this problem. We reject this possibility since the change in direction of the project, taken since 1-1-2004 (see section 1.1), is to follow EU guidance rather than using national guidance and standards. The choice for an EU standard soil with an INS clay content would be in contradiction with this viewpoint. 2. In two current drafts of EU-risk assessment reports (EU-RARs, cadmium and zinc)
normalisation of toxicity data to standard soil is not applied. This indicates that, following EU-guidance, normalisation of soil toxicity data for metals is apparently not the
preferential route.
3. For four of the nine elements investigated in this report, no reference line is available. This would mean that for these elements either no ERLs for soil can be derived (based on soil toxicity data) or ERLs should be derived without normalisation. The second option is undesirable because this would lead to two different types of soil standards.
4. In order to perform normalisation using the reference lines, the lutum or clay content of the soil used in the toxicity experiment should be reported. Since this is not the case for all soil toxicity studies, the number of available toxicity data that can be used for risk limit derivation would decrease. This would seriously affect the reliability of the risk limit. 5. The item of normalisation of soil metal concentrations to standard soil was addressed in a
Dutch national workshop (September 2001) on bioavailability and its place in
environmental policy (Sijm et al., 2002). It was emphasised that the use of the reference lines should be applied as soil type correction for background concentrations rather than as a bioavailability-correction. With respect to normalisation of metal concentrations in soil, it was concluded that the use of reference lines should not be rejected under the condition that improved bioavailability relationships would be developed for ERL derivation in the near future. At present, no improved relationships have been developed for the elements (metals) investigated in this report. The methodology followed in this report is therefore not in accordance with the recommendations of this workshop.
1.4
Strategy for Bioavailability, Deficiency and Background
concentrations
1.4.1 Bioavailability
The concentration of an element, added in a toxicity test, generating a certain toxic response in an organism, might differ from the concentration needed in the field to generate the same response. One of the factors that may cause this difference is the availability of the element to the organism.
Departing from the hypothesis that exposure of an organism to an element occurs
predominantly via the aqueous phase for both the terrestrial as well as aquatic organisms, the parameters that influence the aqueous concentration are important factors in determining the (bio)availability. Although different between the terrestrial and the aquatic compartment, some of these factors are: pH, concentration of organic matter (e.g. humic acids), clay content, cation concentration, presence of oxides, carbonates and other complex-forming ions or salts. In addition, most elements occur in various valence states in the environment and the
speciation in a particular environment is often unknown. For some elements considered in this project it might be possible to calculate the speciation, however, there are several open ends: speciation calculations are often not validated; complexation of metals to dissolved organic
matter is not very well investigated and moreover, properties of organic matter vary considerably between different water types. The latter argument would lead to large
uncertainties in concentration estimations when these concentrations are to be used in generic standard setting. With respect to bioavailability in soil, an example of incorporation of
bioavailability can be found in the draft EU-RAR for zinc. This report is not yet finalised, but the approach followed here is to use a fixed factor to account for differences in zinc
availability. This factor is based on several studies at field locations (with the metal being present for months or years) compared to laboratory experiments. These type of experiments are available for only very few metals.
Although the importance of bioavailability is recognised, it will not be incorporated into the derivation of ERLs in this report. The approach followed in earlier INS reports will be followed here. That means that results from experiments will be based on total added (nominal) or total measured concentrations and differences in bioavailability between laboratory and field situations are not taken into account.
1.4.2 Deficiency/Essentiality
It is difficult to establish whether or not an element is essential and moreover, if it is essential to one organism it is not necessarily essential to other organisms. If an element is considered to be essential to organisms, the advised environmental standard for a given compartment should not be lower than the minimum amount needed by the organisms that naturally inhabit that compartment. Striving for that standard (=concentration) would lead to the disappearance or malfunctioning of naturally occurring species due to shortage of the essential element. It should be stressed however, that occurrence of deficiency itself is natural: not all organisms find optimal conditions in all types of habitats.
Following the added risk approach in ERL derivation means that the background
concentration is incorporated in the environmental standard. As a consequence, the standard can never be lower than the background. Assuming that, for a given compartment, the local background concentration is the distinguishing factor (seen with respect to this specific element; there are other factors that determine potential occurrence) for the possibility of organisms to occur, standards causing shortage of essential elements will not be derived. The fact that the background concentration (90th percentile values) probably contains
anthropogenic influence (see also section 1.4.1) makes it even less probable that there will be species that will be deficient at this level.
An additional remark can be made to the above concept. The ERLs are set generically, meaning that one standard for e.g. the complete (Dutch) terrestrial environment is derived. In reality, the background concentrations will vary from location to location, determined by e.g. soil characteristics. Since the background that is part of the ERL is set at the 90th percentile of measured concentrations, the majority of locations wil have lower background concentrations. The consequence might be that for some locations ERLs are set at a level which is too high.
1.4.3 Background concentrations
Fraters et al. (2001) have published an extensive study in which detailed information on groundwater concentrations of 17 metals is gathered from a multitude of sampling locations in the Netherlands over several years and at several depths. Moreover, the authors present an historic overview on the terminology, use and derivation of the topics background
concentration (Cb), negligible addition (NA), negligible concentration (NC) and target value
(TV). They have also criticised the use of non-natural background concentrations as
background concentrations as the basis for calculation of the NC. The current procedure is to use the 90th percentile of all measured or collected background concentrations for a given
element as background concentration, rather than the median. Fraters et al. argue that this procedure allows anthropogenic influence in the background concentration, where
anthropogenic influence should only be present in the NA. They state that using the added risk approach in this way is incorrect; it suggests the contribution of anthropogenic influence to be lower than it in fact is.
The background concentrations used in the underlying report are taken from
Crommentuijn et al. (1997). To the opinion of Fraters et al. these groundwater background concentrations are neither natural background concentrations, nor are they a good indication of the 90th percentile of the background concentrations for the upper and to a lesser extent for the shallow groundwater. Table 8 shows the background concentrations as used in this report compared to 90th percentile and median values as found under three different soil types reported by Fraters et al.. Given are the values at 25 m depth.
Table 8. Background concentrations for groundwater for nine elements under three different soil types. INS values compared to values published by Fraters et al. (2001) for groundwater at 25 m depth.
90th percentile median
Element Cb INS Sand Clay Peat Sand Clay Peat
Be 0.05 0.9 0.9 0.9 <0.2 <0.2 <0.2 V 1.2 2.7 2.7 2.7 0.86 0.86 0.86 Co 0.63 0.7 0.7 0.7 0.28 0.28 0.28 Se 0.024 0.06 0.06 0.06 <0.005 <0.005 <0.005 Mo 0.69 1.6 1.6 1.6 0.25 0.25 0.25 Sn <2 <2 <2 <2 <2 <2 <2 Sb 0.091 0.16 0.16 0.16 0.05 0.05 0.05 Ba 197 160 990 990 52 190 190 Tl <2 <2 <2 <2 <2 <2 <2
The above issue was raised as a question in the interim report on this project
(Van Vlaardingen, 2003). The outcome was that the policy with respect to the use of background concentrations has not been changed as a result of the points put forward by Fraters et al. (2001). The 90th percentile data should still be used. Since groundwater
background concentrations have not been changed within the framework of environmental standard setting policy, we have used the values as reported by Crommentuijn et al. (1997).
2.
Substance properties, use and occurence
2.1
Physico-chemical properties of the elements
2The nine trace elements that are subject of this report will be cited in the order of atomic number, i.e. as they appear the periodic table of elements: beryllium, vanadium, cobalt, selenium, molybdenum, tin, antimony, barium and thallium. Figure 2 shows the periodic table in which the position of the nine elements is indicated by a shaded background.
Table 9 shows some physical and chemical properties of the nine elements discussed in this report, for the elemental state. The elements belong to different groups depending on the properties focussed at. When dividing the elements into the series discerned in the periodic table, the following scheme emerges:
metals Sn, Tl, Sb*
alkali-earth metals Be, Ba transition metals V, Co, Mo non-metals Se *Sb can also be classified as a metalloid
Metals are cation forming elements when in solution. Oxides of metals are usually
hydroxides. Most metals conduct electricity, are crystalline solids, with high reactivity. Most of them are hard and have a high density. The series of the alkali-earth metals, transition metals fall within the group of metals. Alkali-earth metals are elements in the second column (from the left) of the periodic table. They are generally white, and are malleable, extrudable and machinable. Transition metals are generally known for their hardness, high density, and high melting and boiling point. The elements within the groups of the Lanthanides, Actinides and some of the Transactinides fall within the series of transition metals. Non-metals do not display properties of metals: they have low thermal and electrical conductivity and usually high electronegativity. The group comprises halogens, noble gasses and some metalloids. Metalloids is a term that is less commonly used. It refers to elements that exhibit properties of both metals and non-metals. Most metalloids are semiconductors.
1 2 3 4 5 6 7 8 9 10 11 12 13 14 15 16 17 18
IA IIA IIIA IVA VA VIA VIIA VIIIA IB IIB IIIB IVB VB VIB VIIB
1 H 1.00794 +1 -1 2 He 4.002602 o 3 Li 6.941 +1 4 Be 9.012182 +2 23 V 50.9415 +2,3,4,5 5 B 10.811 +3 6 C 12.0107 +2,4 -4 7 N 14.00674 +1,2,3,4,5 -1,2,3 8 O 15.9994 -2 9 F 18.9984032 -1 10 Ne 20.1797 0 11 Na 22.989770 +1 12 Mg 24.3050 +2 13 Al 26.981538 +3 14 Si 28.0855 +2,4 -4, 15 P 30.973761 +3,5 -3 16 S 32.066 +4,6 -2 17 Cl 35.4527 +1,5,7 -1 18 Ar 39.948 0 19 K 39.0983 +1 20 Ca 40.078 +2 21 Sc 44.955910 +3 22 Ti 47.867 +2,3,4 23 V 50.9415 +2,3,4,5 24 Cr 51.9961 +2,3,6 25 Mn 54.938049 +2,3,4,7 26 Fe 55.845 +2,3 27 Co 58.933200 +2,3 28 Ni 58.6934 +2,3 29 Cu 63.546 +1,2 30 Zn 65.39 +2 31 Ga 69.723 +3 32 Ge 72.61 +2,4 33 As 74.92160 +3,5 -3 34 Se 78.96 +4,6 -2 35 Br 79.904 +1,5 -1 36 Kr 83.80 0 37 Rb 85.4678 +1 38 Sr 87.62 +2 39 Y 88.90585 +3 40 Zr 91.224 +4 41 Nb 92.90638 +3,5 42 Mo 95.94 +6 43 Tc (98) +4,6,7 44 Ru 101.07 +3 45 Rh 102.90550 +3 46 Pd 106.42 +2,3 47 Ag 107.8682 +1 48 Cd 112.411 +2 49 In 114.818 +3 50 Sn 118.710 +2,4 51 Sb 121.760 +3,5 -3 52 Te 127.60 +4,6 -2 53 I 126.90447 +1,5,7 -1 54 Xe 131.29 0 55 Cs 132.90545 +1 56 Ba 137.327 +2 57 La* 138.9055 +3 72 Hf 178.49 +4 73 Ta 180.9479 +5 74 W 183.84 +6 75 Re 186.207 +4,6,7 76 Os 190.23 +3,4 77 Ir 192.217 +3,4 78 Pt 195.078 +2,4 79 Au 196.96655 +1,3 80 Hg 200.59 +1,2 81 Tl 204.3833 +1,3 82 Pb 207.2 +2,4 83 Bi 208.98038 +3,5 84 Po (209) +2,4 85 At (210) 86 Rn (222) +0 87 Fr (223) +1 88 Ra (226) +2 89 Ac** (227) +3 104 Rf (261) +4 105 Db (262) 106 Sg (266) 107 Bh (264) 108 Hs (269) 109 Mt (268) 110 Uun (271) 111 Uuu (272) 112 Uub *Lanthanides 58 Ce 140.116 +3,4 59 Pr 140.90765 +3 60 Nd 144.24 +3 61 Pm (145) +3 62 Sm 150.36 +2,3 63 Eu 151.964 +2,3 64 Gd 157.25 +3 65 Tb 158.92534 +3 66 Dy 162.50 +3 67 Ho 164.93032 +3 68 Er 167.26 +3 69 Tm 168.93421 +3 70 Yb 173.04 +2,3 71 Lu 174.967 +3 **Actinides 90 Th 232.0381 +4 91 Pa 231.03588 +4,5 92 U 238.0289 +3,4,5,6 93 Np (237) +3,4,5,6 94 Pu (244) +3,4,5,6 95 Am (243) +3,4,5,6 96 Cm (247) +3 97 Bk (247) +3,4 98 Cf (251) +3 99 Es (252) +3 100 Fm (257) +3 101 Md (258) +2,3 102 No (259) +2,3 103 Lr (262) +3 Transition elements Atomic number Atomic weight Symbol Oxidation states
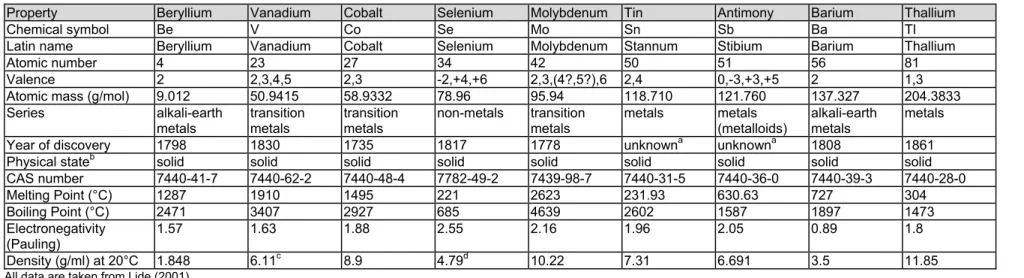
Table 9. Some physical and chemical properties of the considered elements, valid for the elemental state.
Property Beryllium Vanadium Cobalt Selenium Molybdenum Tin Antimony Barium Thallium
Chemical symbol Be V Co Se Mo Sn Sb Ba Tl
Latin name Beryllium Vanadium Cobalt Selenium Molybdenum Stannum Stibium Barium Thallium
Atomic number 4 23 27 34 42 50 51 56 81
Valence 2 2,3,4,5 2,3 -2,+4,+6 2,3,(4?,5?),6 2,4 0,-3,+3,+5 2 1,3 Atomic mass (g/mol) 9.012 50.9415 58.9332 78.96 95.94 118.710 121.760 137.327 204.3833 Series alkali-earth metals transition metals transition metals non-metals transition metals metals metals (metalloids) alkali-earth metals metals Year of discovery 1798 1830 1735 1817 1778 unknowna unknowna 1808 1861 Physical stateb solid solid solid solid solid solid solid solid solid CAS number 7440-41-7 7440-62-2 7440-48-4 7782-49-2 7439-98-7 7440-31-5 7440-36-0 7440-39-3 7440-28-0 Melting Point (°C) 1287 1910 1495 221 2623 231.93 630.63 727 304 Boiling Point (°C) 2471 3407 2927 685 4639 2602 1587 1897 1473 Electronegativity (Pauling) 1.57 1.63 1.88 2.55 2.16 1.96 2.05 0.89 1.8 Density (g/ml) at 20°C 1.848 6.11c 8.9 4.79d 10.22 7.31 6.691 3.5 11.85
All data are taken from Lide (2001).
aalready known to ancient people; bat 20°C and 1 atm; cat 18.7°C; dT not reported
Table 10. Concentration of the considered elements in various environmental compartments – data not pertaining to the Netherlands.
Seawater
[µg.l-1] Surface water [µg.l-1] Groundwater [µg.l-1] [mg.kgSoil -1]
Source 1 2 2 2 1 Beryllium 0.0006 2.10-5-9.10-5 0.05-1 -- 0.01-40 Vanadium 0.9-2.5 <0.3-2.1 0.6-1.6 -- 3-500 Cobalt 0.01-4.1 0.03 0.19 - 0.05-65 Selenium 0.052-0.2 0.004-0.009 0.15-0.33 0.1-0.001 0.0112 Molybdenum 4-10 8.9-13.5 0.1-1 0.1-1 0.1-40 Tin 0.002-0.81 0.3-1.22 0.03-0.09 - 1-200 Antimony 0.18-5.6 0.21-0.53 0.06 0.01-0.5 0.2-10 Barium 2-63 20 45 4.6-34 100-3000 Thallium 0.019 0.009-0.0163 <0.01 - 0.1-0.8
2.2
Use, production and discharge
2.2.1 Beryllium
Beryllium compounds are divalent (Be2+). The beryllium atom has a small radius, causing strong binding of its valence electrons, high electronegativitiy, and stability in lattices of beryllium minerals. Beryllium easily reacts with oxygen and forms very stable BeO surface films, providing high resistance to corrosion and water etc. Beryllium is used in brake discs of plane brakes, in golf clubs, bicycle frames and in springs in the form of berylliumbronze (beryllium-copper alloys), since berylliumbronze is antimagnetic, firm and elastic.
Approximately 72% of the world production is in the form of berylliumbronze or other alloys and about 20% is used as the free metal in aerospace-, spacecraft-, weapon- and nuclear industries. Some of many applications in these areas are x-ray transmission windows, space vehicle optics, missile guidance systems, nuclear warhead triggering devices, fuel containers, heat shields, mirrors etc. (ATSDR, 2000). Further areas of use are electronics (springs, switches, relays, connectors etc.) and medical applications (pacemakers, dental alloys). The world production of beryllium minerals in 1980-1984 was estimated to be 10,000 tonnes of which 400 tonnes were beryllium. In 2000, the USA used 390 tons of beryllium.
At high pH, beryllium has been observed to be able to substitute magnesium in some micro-organisms, algae and crops, whereas below pH 7 it becomes toxic to aquatic and terrestrial plants (regardless of magnesium levels). Beryllium probably inhibits phosphatases in plants; its bioavailability in soils is dependent on pH and cation exchange capacity (CEC). Toxicity to fish, daphnia and salamanders occurs in the mg.l-1 range, based on LC
50 values.
(Source: WHO, 1990a). ATSDR (2000) states that several evaluating institutions have classified beryllium and/or beryllium compounds as probably carcinogenic.
2.2.2 Vanadium
Vanadium is widespread thoughout the lithosphere, estimated at 0.017% and ranked above copper, zinc and lead. Vanadium is obtained from minerals -that usually have low vanadium content- through mining together with other metals or from fossil fuels (oil, coal, tars,
bitumens and asphaltites). V2O5 (vanadium pentoxide) is the most common commercial form
of vanadium: it is water- and acid soluble. Global production (V2O5) in the first half of the
1980’s was 34,000-45,000 tonnes, while 35,000 tonnes is reported for 1990. V3+ is basic and its salts (e.g. V2O3) are strong reducing agents. Vanadium is being used in alloys with steel,
because of the hardness of these alloys. These types of alloys are often used in armoured cars, safes in atomic energy industry, aircraft construction and space technology. Vanadium steel is suitable for the manufacturing of tools that are to function under severe conditions. Vanadium is also used as a catalyst in chemical industry in production processes of anti-fouling paints and various chemicals. Power and heat producing plants using fossil fuels cause emission of vanadium to the air, and coal waste burning in mining areas also contributes. Furthermore, industry producing steel alloys or handling vanadium combinations will emit relatively high amounts.
(Sources: WHO, 1999; Byerrum et al., 1974; ATSDR, 1992c; Kjøholt et al., 2003; Newland, 1982)
2.2.3 Cobalt
Cobalt is an essential trace element. A well known cobalt compound is vitamin B12 (cyanocobalamin), which is synthesised by the gut flora but also by bacteria, macrophytes, blue-green algae and actinomycetes. It resembles iron and nickel in physical and chemical properties and is mined from nickel-, silver-, lead-, copper- and iron ores. Cobalt is widely used as pigment in glassmaking, ceramic and paint industries, as catalyst in petroleum
industry, in electrical and military industry. Cobalt alloys have a high wear-resistance and high corrosion resistance and are used in applications requiring those properties (e.g. razor blades). Superalloys are used under circumstances with elevated temperatures and high mechanical stress (e.g. gas turbines of aircraft engines). Furthermore, cobalt alloys have outstanding magnetic properties.
(Source: ATSDR, 2001)
2.2.4 Selenium
Coal combustion and crude oil processing are human activities causing environmental input of Se. Other input sources of Se input are sulphide ore mining and erosion of seliniferous rocks or soils; these are of no importance in the Netherlands. The copper refining industry is a source of selenium, which is further processed a.o. in pigments (used in plastics, paints, enamels, inks, rubber), glass, anti-dandruff shampoos and fungicides. The capacity for electric conductivity of selenium (semiconductor) is strongly dependent on the amount of light it receives, a property that is being used in light meters.
(Sources: WHO, 1987; ATSDR, 2002)
2.2.5 Molybdenum
Molybdenum is considered an essential trace element. The concentration in the earth’s crust is low (0.001%) and the fractions present in the ores from which it is enriched to form MoS2 are
also low. The consumption in the USA was approximately 15,000 tons in 2000. Metallic molybdenum is used in the construction of electric lighting bulbs and vacuum electronic devices; molybdenum wires are also used in anodes, cathodes, filament holders etc.. Both pure molybdenum and molybdenum alloys are processed as resistance wire in electric heaters and ovens. Molybdenum is the metal with the highest resistance against breaking and
molybdenum alloys produce materials that are very firm, have a high tensile strength and are very heat resistant. They are therefore very useful for processing in engines of jet turbines and rocket engines. Molybdenum also has applications as flame retardant and smoke oppressor in textile and plastic. The main anthropogenic source of molybdenum in the air is burning of fossil fuels, while mining activities are the major source for emission to aquatic systems. Industrial discharges, manufacturing by-products and municipal wastes are also known to contribute to molybdenum presence in the hydrosphere and atmosphere.
(Sources: Izmerov, 1988; Kjøholt et al., 2003; Parker, 1986)
2.2.6 Tin
Tin is an element which occurs in nature in 9 mineral forms. It is thought to be essential to rats, but probably not to other species. The estimated world production of tin around 1980 was 225,000 tonnes/year, while in the Netherlands 3463 tonnes was produced in 1988. Tin has its main applications in production of tin plate for use in containers (aerosol-, food- and beverage containers), solder, pewter, coins, bronzes, type metal (printing) jewellery and in alloys such as dental amalgams and titanium alloys used in aircraft industry. Inorganic tin compounds are used in various applications such as glass strengthening, catalysts, stabilisers in perfumes and soaps and as dental anticariogenic agents. Tin forms inorganic compounds in the 2+ (stannous) and 4+ (stannic) oxidation state. There are many Sn (II) compounds with various applications: e.g. SnCl2 (reducing agent) as mordant in dye printing and SnF2 in
toothpastes etc. Tin (II) compounds are easily oxidised to Sn (IV). Sn (IV) compounds also have a wide application in industry (SnO2) or technology (SnCl4). Since the amount of wastes
from tin processing is low and the degree of recovery in industry is high, contamination of the environment with tin is thought to be low.