Colophon
© RIVM 2017
Parts of this publication may be reproduced, provided acknowledgement is given to: National Institute for Public Health and the Environment, along with the title and year of publication.
M. Bouwknegt (author), RIVM
M.J. Mangen (author), Julius Centrum, UMCU I.H.M. Friesema (author), RIVM
W. van Pelt (author), RIVM A.H. Havelaar (author), RIVM Contact:
Martijn Bouwknegt
Centre for Zoonoses and Environmental Microbiology, Centre for Infectious Disease Control Netherlands, RIVM
martijn.bouwknegt@rivm.nl
This investigation has been performed by order and for the account of the Ministry of Public Health, welfare and Sports, within the framework of Programme 5
This is a publication of:
National Institute for Public Health and the Environment
P.O. Box 1 | 3720 BA Bilthoven The Netherlands
Synopsis
The Ministry of VWS has requested RIVM to present an annual update on the number of illnesses caused by 14 enteric pathogens. These
pathogens can be transmitted by food, the environment, animals and humans. The number of persons who are ill and who die from the infections is expressed in DALYs (Disability Adjusted Life Years), a measure of the disease burden in the population. Furthermore, the cost-of-illness (COI) related to the 14 food-related pathogens were estimated and expressed in euros. The total disease burden caused by the 14 pathogens decreased from 14,500 DALY in 2012 to 13,200 DALY in 2013. The share of foodborne transmission in this burden decreased from 6,600 to 5,800 DALY, reaching the lowest estimated level since 2009. The COI increased by 6 M€ compared to 2012, reaching a total of 424 million euro. The share of foodborne transmission was 172 million euro. The decrease in disease burden was a result of decreased
incidences for most pathogens, except for rotavirus. The latter incidence increased by 16% compared to 2012, reaching a comparable level to 2011 and a ~30% lower level compared to 2009 and 2010.
The research presented in this report results in more insight in the true incidence of foodborne diseases and the associated disease burden and costs and enables to monitor trend in time for these public health indicators.
Publiekssamenvatting
Ziektelast van via voedsel overdraagbare ziekteverwekkers in Nederland in 2013
Het RIVM onderzoekt jaarlijks hoeveel mensen ziek worden van 14 ziekteverwekkers die via voedsel in het menselijk lichaam terechtkomen (darmpathogenen). Deze ziektelast wordt uitgedrukt in DALY’s
(Disability Adjusted Life Year), een internationaal gehanteerde maat voor het aantal gezonde levensjaren die verloren gaan aan ziekte of overlijden. Het aantal DALY’s als gevolg van de 14 ziekteverwekkers daalde van ongeveer 6.600 in 2012 tot 5.800 DALY’s in 2013.
Daarnaast wordt geschat welke kosten hieraan verbonden zijn (cost of illness). Deze omvatten directe medische kosten, maar ook de kosten voor de patiënt en/of zijn familie, zoals reiskosten, als ook de kosten binnen andere sectoren, bijvoorbeeld door werkverzuim. De
gerelateerde kosten van de 14 ziekteverwekkers die mensen via voedsel opliepen bedroegen in 2013 172 miljoen euro.
De onderzochte ziekteverwekkers kunnen niet alleen via voedsel aan de mens worden overgedragen (circa 40 procent), maar ook via het milieu (bijvoorbeeld via oppervlaktewater), dieren, en van mens op mens. De verhouding verschilt per ziekteverwekker. De totale ziektelast van alle ‘routes’ daalde ook, van 14.000 DALY in 2012 naar 13.200 DALY in 2013. De totale kosten werden geschat op 424 miljoen euro en waren daarmee vergelijkbaar met voorgaande jaren.
VWS is opdrachtgever van dit onderzoek. De resultaten bieden handvaten om meer zicht te krijgen op het daadwerkelijke aantal voedselinfecties dat mensen jaarlijks oplopen en de bijbehorende ziektelast.
Kernwoorden: voedsel-gerelateerde ziekte, ziektelast, DALY, kosten, trend
Contents
1 Introduction — 9 2 Methods — 11 2.1 Trend information — 11 2.2 Model updates — 11 2.3 Disease burden — 12 2.4 Cost of illness — 12 3 Results — 13 3.1 Trend information — 13 3.2 Disease incidence — 143.3 Disease burden by pathogen — 14 3.4 Cost of illness by pathogen — 14 3.5 Attribution — 14
3.6 Model update effects — 15
4 Discussion — 17
References — 19
1
Introduction
Since 2008, RIVM regularly publishes estimates of the incidence, disease burden and costs of food-related disease on its web pages in the
“Nationaal Kompas Volksgezondheid”1. The epidemiological estimates of
the disease burden are expressed in Disability Adjusted Life Years (DALY). The methodology for these estimates is described in detail in a peer-reviewed paper [1]. Data in the latter paper referred to represent estimates for the year 2009, and updates based on data for the years 2010 up until 2012 have followed [2-4]. In this report, trend information from surveillance and demographic information was used to update the information to the year 2013.
The economical estimates of the disease burden, the cost-of-illness (COI) expressed in euros, were finalized for all 14 food-related
pathogens for the year 2011 [5]. The economic models were added to the existing disease burden model. The estimates for 2011 [6] were updated to 2012 in a previous report [3], and the results for 2013 are integrated in this report.
1
2
Methods
2.1 Trend information
Data on the size and age distribution of the Dutch population, as well as mortality risks and the number of live births and stillbirths were
obtained from Statistics Netherlands2.
Trend information on the incidence of gastro-enteritis (GE) by pathogen in the general population and consulting the general practitioner was obtained from the following sources:
Thermophilic Campylobacter spp.: laboratory surveillance Non-typhoidal Salmonella spp.: laboratory surveillance
Norovirus: hospitalisation for viral gastro-enteritis (ICD code 86) Rotavirus: laboratory surveillance
Hepatitis A, and perinatal and acquired listeriosis: mandatory notification and active surveillance
Cryptosporidium spp.: a stable incidence since 2003 was
assumed, based on laboratory surveillance data from 2001 to 2007
Giardia spp.: a continuing decrease with the rate of -1.03% per
year observed between 2001 and 2007 was assumed
No trend information was available for the GE toxin-producing bacteria (Bacillus cereus, Clostridium perfringens and
Staphylococcus aureus), Shiga-toxin producing Escherichia coli
O157 (STEC O157), hepatitis-E and toxoplasmosis.
Trends in hospitalizations for gastro-enteritis as primary cause (ICD codes 20-93; 558.9) were obtained from the National Medical Register up until 2010. From 2011 onwards these data were obtained from Dutch Hospital Data (DHD). Data for 2013 were not available in time due to changes in procedures at DHD and change in coding from ICD9 to ICD10. Therefore estimates for the number of hospitalized patients were obtained by extrapolation, using the 10-year relationship of the number of hospitalized patients and time series from the laboratory surveillance (primarily tested faeces, but in part (<18 years) rotavirus). Using this method on data for earlier years showed similar estimates for the number and age-distribution of hospitalized GE-patients.
Excess mortality risks from campylobacteriosis and salmonellosis were assumed constant. Fatalities due to listeriosis and STEC O157 were obtained from active surveillance. Age-specific case fatality ratios for norovirus and rotavirus, originally obtained from German surveillance data, and for protozoan pathogens, originally obtained from the international literature, were assumed constant.
2.2 Model updates
The estimation of excess mortality due to Campylobacter spp. and
Salmonella spp. was updated. The initial model was based on a fixed
number of reported cases, which was not updated annually. The updated model attributes the actual number of reported cases in the updating year over 5-year age classes. The proportions for attribution are estimates as five-year averages (2009-2013) from the age
distribution in the surveillance data.
The effects of the updates on the burden estimation are shown by re-estimating the relevant results for all years from 2009-2012, as reported in Table 7. The interpretation of trends in this report are based on the results from the updated model.
2.3 Disease burden
The DALY calculations were not changed compared to previous years; hence all differences in the results for 2013 compared to 2011 and 2012 will reflect the impact of trends in the underlying information on
demographics and pathogen incidence, and the aforementioned model updates. As described above, the impact of the latter is shown in Table 7.
2.4 Cost of illness
Cost-of-illness calculations were not changed compared to previous years (i.e. 2012 and 2011), only the cost prices used for the different resources had to be updated to 2013 euros by multiplying all prices with the consumer price index for 2013 provided by Statistics Netherlands3.
In order to allow comparison with earlier results we also updated the earlier cost-of-illness estimates (i.e, 2011 and 2012) to 2013 euros; hence all differences in the results for the year 2013 compared to 2011 and 2012 will reflect the impact of trends in the underlying information on demographics and pathogen incidence.
3
http://statline.cbs.nl/Statweb/publication/?DM=SLNL&PA=71311NED&D1=0&D2=0&D3=142,155,168,181,194, 219,232,245&HDR=T&STB=G1,G2&VW=T, accessed November 12th, 2014
3
Results
3.1 Trend information
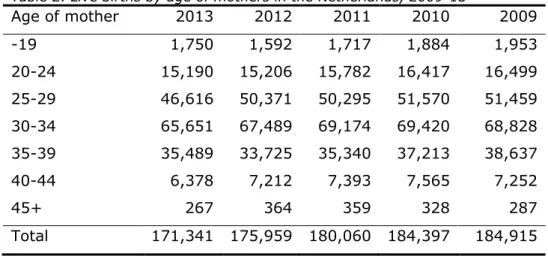
The number of inhabitants in the Netherlands slightly increased with 50,000 inhabitants in 2013 (Table 1). There was a decrease in all age classes except the ages 12-17 and 65+. The number of live births decreased by approximately 4,500 to 171,000 in 2013 (Table 2). A decrease was observed in all age classes (of mothers) except for
mothers aged up to 19 years and aged between 35-39; both categories showed a slight increase. The number of stillbirths (24 weeks or more gestational age) in 2013 was 510, lower than the 594 cases reported for 2012. The number of hospitalizations for gastroenteritis remained fairly stable at 22,000.
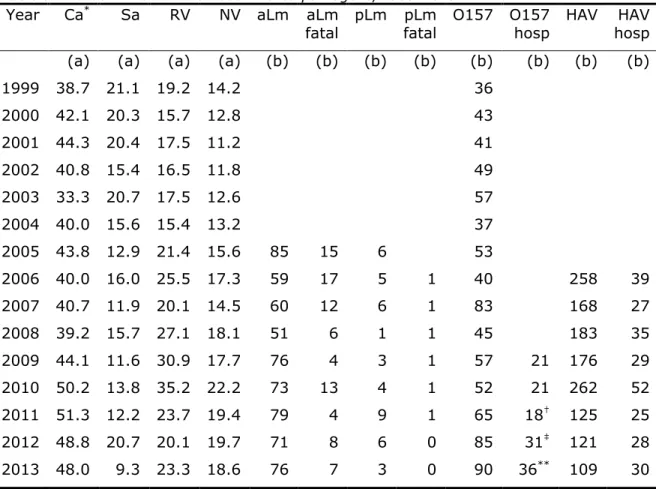
Trend information for specific pathogens is presented in Table 3. A summary of trends (in comparison with 2012) is discussed below:
The incidence of campylobacteriosis (laboratory confirmed cases) decreased by 1% from 48.8 to 48.0 cases per 100,000 inhabitants.
The incidence of salmonellosis (laboratory confirmed cases)
decreased by 55% from 20.7 to 9.3 per 100,000 inhabitants,
reaching the lowest reported incidence rate since 1999 (the former lowest reported incidence rate was 11.6 per 100,000 in 2009).
The incidence of gastroenteritis by rotavirus (laboratory
confirmed cases) increased further by 16% from 20.1 to 23.3 cases per 100,000 inhabitants, reaching a comparable level to 2011 and a ~30% lower level compared to 2009 and 2010. The incidence of hospitalizations for viral gastroenteritis (a proxy
for the incidence of gastroenteritis by norovirus) decreased from 19.7 to 18.6 cases per 100,000 inhabitants; the apparent increasing trend from 2001 onwards has levelled off in 2013. The incidence of acquired listeriosis (active surveillance)
increased from 71 cases in 2012 to 76 cases in 2013. There
were 7 fatalities, similar to the 8 fatalities in 2012, but
considerably more than the 4 fatalities in 2011. The statistical
life expectancy of fatal cases was 13.7 years; in the DALY model half of this life expectancy is used for calculating years of life lost to correct for comorbidity. Including new data from 2013, the probability of developing meningitis as a consequence of acquired listeriosis was updated from 25% to 23% (95% confidence interval 20-27%).
The incidence of perinatal listeriosis (active surveillance) was 3 cases with no fatalities. The number of perinatal cases and
mortality were similar to previous years.
The incidence of diseases caused by STEC O157 (active surveillance) was 90 with 36 hospitalizations (of 84 cases for which this information is known). The number of STEC O157 cases, including the number of hospitalized cases, was higher
The incidence of HUS cases was 7, the highest reported number since 2009.
The incidence of hepatitis A (notified cases) decreased compared to the previous two years; the incidence was the lowest among the recorded incidences for the years 2006-2013. The number of hospitalizations, however, increased, with the proportion of hospitalized patients showing a continuous increase from 16.5% in 2009 to 27.5% in 2013. We have currently no explanation for this finding.
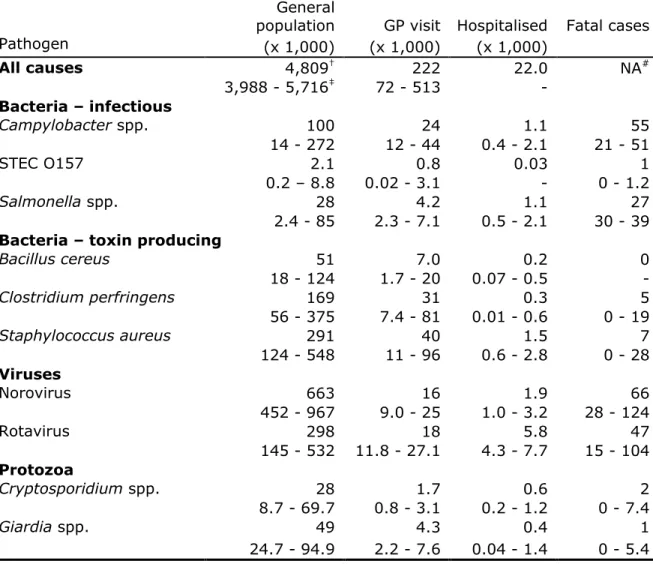
3.2 Disease incidence
The incidence of gastroenteritis by pathogen, of disease by non-gastrointestinal pathogens and of sequelae by pathogen in 2013 is presented in Tables 4-7, and Figure 1. There were increases in the incidence of E. coli O157, acquired listeriosis and rotavirus in the general population while the incidence of campylobacteriosis, salmonellosis, perinatal listeriosis, giardiasis, rotavirus and HAV decreased in comparison to 2012. The estimated incidence of the remaining pathogens was unchanged, mostly because no trend information was available. The estimated total number of foodborne cases due to the 14 pathogens decreased by approximately 40,000 to 1,680,000 in 2013 compared to 2012 and was at the lowest level since 2009. The total number of deaths for 2013 was 236 (in 2012 this was 265 as estimated with the updated model). Compared to 2012, the incidence of sequelae was similar (Table 6).
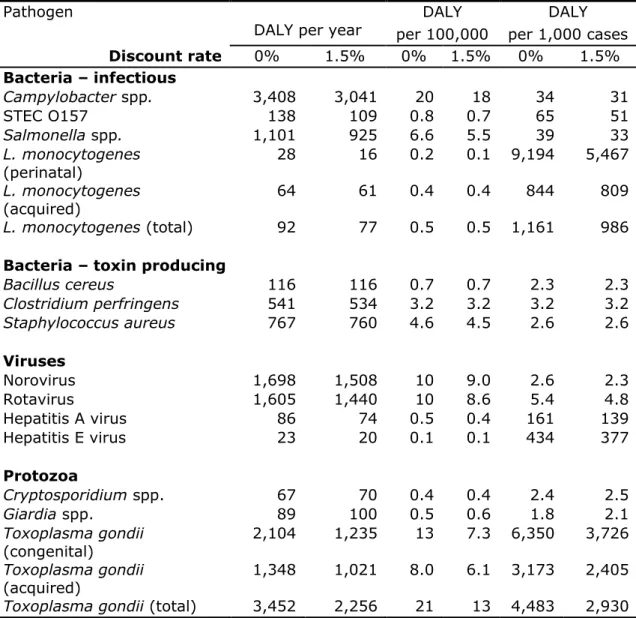
3.3 Disease burden by pathogen
The burden by pathogen is presented in Table 8 and Figure 2. The total burden of the 14 pathogens decreased by 800 DALY: from 14,000 DALY in 2012 to 13,200 DALY in 2013. The largest burden at population level was caused by Toxoplasma gondii and Campylobacter (both ~3,400 DALY), followed by norovirus and rotavirus (both ~1,600 DALY).
Salmonella spp. ranked 5th with approximately 1,100 DALY. In general, estimates for 2013 were similar to the estimates for 2012, except for salmonellosis and listeriosis (both were lower in 2013). Perinatal listeriosis was the disease outcome with the highest individual burden among all pathogens (9.2 DALY per case), followed by congenital toxoplasmosis (6.3 DALY per case).
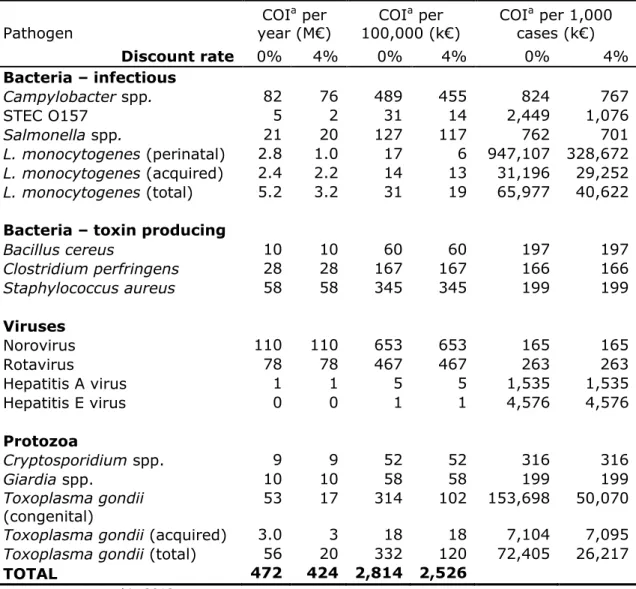
3.4 Cost of illness by pathogen
The total COI decreased with 10 M€ compared to 2012 and was
estimated at 428 M€ (discounted at 4%) (Table 9). The three pathogens causing the largest discounted COI are norovirus (110 M€), rotavirus (78 M€) and Campylobacter spp. (76 M€). The lowest contribution to the COI was by hepatitis E-virus (0.2 M€). The average cost per case were largest for perinatal Listeria (0.3 M€, discounted), followed by congenital
Toxoplasma gondii infections (0.05 M€, discounted). The trends in COI
compared to 2012 followed the trends in DALYs.
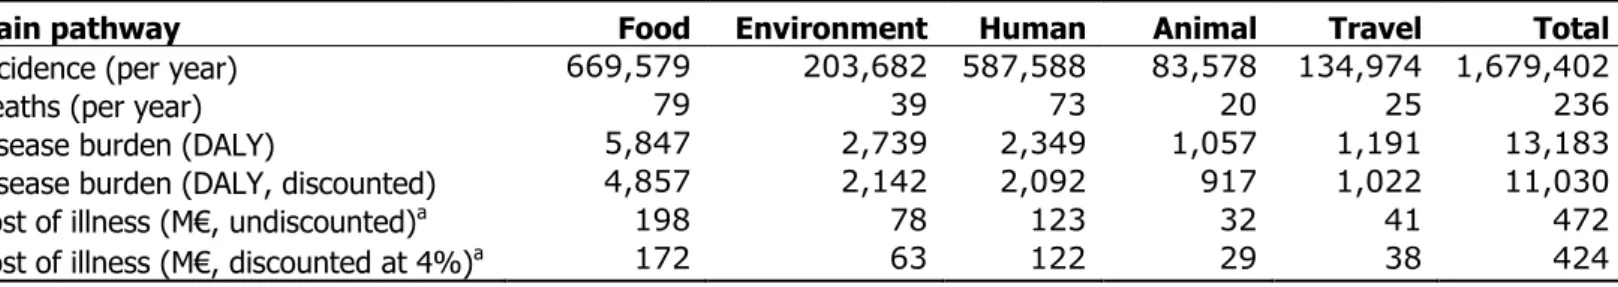
3.5 Attribution
The attribution results for DALYs and COI are presented in Tables 10 and 11. The foodborne disease burden decreased by 11% from 6,600 DALY to 5,900 DALY. All non-food routes decreased by 3-4% in DALYs
compared to 2012. Among the food pathway, all estimated DALYs decreased with 2-4% compared to 2012. Fifty-five percent of the foodborne burden was associated with meat (pork 21%, poultry 18% and beef & lamb 16%). These foods caused 30% of all food-related cases, indicating that the pathogens associated with these foods tend to cause more severe infections than pathogens associated with other foods.
The total food-related COI decreased by 4% from 181 M€ to 174 M€. Approximately 40% of the COI was associated with meat and 50% with foods of animal origin. The COI for the other pathways similarly
decreased except for the transmission among humans. The latter increased due to the increased rotavirus incidence.
3.6 Model update effects
Table 7 shows the effects of the model updates on the estimates for 2009-2012. The number of excess deaths due to campylobacteriosis increased by about 20 cases annually. The number of deaths due to salmonellosis fluctuated more compared to campylobacteriosis, with a peak in 2012 due to the Salmonella Thompson outbreak.
The overall DALY estimates increased by 300-500 DALY per year and the portion attributed to food by about 100-300 DALY per year. The
4
Discussion
The disease burden of 14 enteric pathogens decreased in 2013 by 1,300 DALY from 14,500 DALY in 2012 to 13,200 DALY. The share of
foodborne transmission in this burden decreased by 700 DALY from 6,600 to 5,900 DALY. These estimates are the lowest since 2009, the first year in which the burden for all 14 pathogens was estimated. The overall COI estimates decreased by 10 M€ to 428 (discounted at 4%), and the foodborne COI decreased by approximately 6 M€ to ~174 M€ compared to 2012. The decrease was a result of lower incidences for
Campylobacter spp., Salmonella spp. and norovirus in 2013 compared to
2012.
The incidence of campylobacteriosis decreased in 2012 compared to 2011, after a continuously increasing trend from 2003 onwards, leading to a trend break. In 2013, the incidence decreased further. This trend break is possibly associated with the use of proton-pump-inhibitors [7, 8]. The refund policies of healthcare insurance companies for proton-pump inhibitors changed in 2012, possibly leading to lower intake and a lower proportion of individuals with an increased risk for
campylobacteriosis in the population.
From August 2012 onwards, an increase in Cryptosporidium infections was observed in several EU countries, including the Netherlands, without a clear cause [9]. This increase in Cryptosporidium was not taken into account in the current disease burden estimates, as a constant incidence of cryptosporidiosis in the Netherlands is assumed for the model (based on laboratory surveillance data from 2001-2007). A rough estimate suggests that the disease burden for Cryptosporidium might have increased by a factor of 1.2, because a five-fold increase in cases was observed in 12 of 52 weeks (thus: 524/104×12/52=1.2). The data from the eight medical microbiological laboratories (available from at least 2010) might be useful for the annual trend update for Cryptosporidium and will be further examined for usability in future updates.
Other important aspects for interpreting results include the absence of trend information for bacterial toxins, toxoplasmosis and STEC O157, while trends for Cryptosporidium spp. and Giardia spp. are extrapolated from trends until 2007, when systematic surveillance was discontinued. Furthermore, attribution data used in this report are based on an expert elicitation study, conducted in 2006 [10]. No time-trends in the expert estimates are available. As a consequence, the changes in incidence and burden as presented in this report for these pathogens need to be interpreted with appropriate care. For 2013 and 2014, laboratory surveillance data on Cryptosporidium have been collected by RIVM. The use of these data for trend updating will be explored further, and if appropriate, applied to the updated estimates over subsequent years. Initial explorations suggest that the incidence estimates based on laboratory surveillance are twice as high as extrapolated from surveillance data until 2007.
References
1. Havelaar AH, Haagsma JA, Mangen MJJ, Kemmeren JM, Verhoef LP, Vijgen SM, et al. Disease burden of foodborne pathogens in the Netherlands, 2009. Int J Food Microbiol. 2012;156(3):231-8. 2. Bouwknegt M, Friesema IHM, Van Pelt W, Havelaar AH. Disease
burden of food-related pathogens in the Netherlands, 2011.
Bilthoven, the Netherlands: National Institute for Public Health and the Environment, 2013 Contract No.: 330331006/2013.
3. Bouwknegt M, Mangen MJJ, Friesema IHM, Van Pelt W, Havelaar AH. Disease burden of food-related pathogens in the Netherlands, 2012. Bilthoven, the Netherlands: National Institute for Public Health and the Environment, 2014 Contract No.: 2014-0069. 4. Havelaar AH, Friesema IHM, Van Pelt W. Disease burden of
food-related pathogens in the Netherlands, 2010. Bilthoven, the Netherlands: National Institute for Public Health and the Environment, 2012 Contract No.: 330331004/2012.
5. Mangen MJJ, Bouwknegt M, Friesema IHM, Kortbeek LM, Van Pelt W, Havelaar AH. Disease burden and cost-of-illness of food-related pathogens in the Netherlands. Bilthoven: National Institute for Public Health and the Environment, 2013 330331007 Contract No.: 330331007/2013.
6. Mangen MJJ, Bouwknegt M, Friesema IHM, Haagsma JA, Kortbeek LM, Tariq L, et al. Cost-of-illness and disease burden of food-related pathogens in the Netherlands, 2011. International Journal of Food Microbiology. 2014;Epub, ahead of print.
7. Bouwknegt M, Van Pelt W, Kubbinga M, Weda M, Havelaar AH. Recent increase in campylobacteriosis incidence in the Netherlands associated with proton-pump inhibitor use. Submitted to
Eurosurveillance. 2013.
8. Bouwknegt M, Van Pelt W, Kubbinga M, Weda M, Havelaar AH. Recent increase in campylobacteriosis incidence in the Netherlands potentially related to proton-pump inhibitor use. Lancet.
2013;381:S22.
9. Fournet N, Deege MP, Urbanus AT, Nichols G, Rosner BM, Chalmers RM, et al. Simultaneous increase of Cryptosporidium infections in the Netherlands, the United Kingdom and Germany in late summer season, 2012. Euro surveillance : bulletin Europeen sur les maladies transmissibles = European communicable disease bulletin. 2013;18(2).
10. Havelaar AH, Galindo AV, Kurowicka D, Cooke RM. Attribution of foodborne pathogens using structured expert elicitation. Foodborne pathogens and disease. 2008;5(5):649-59.
Table 1. Population in the Netherlands by age group, 2009-13 Age group 2013 2012 2011 2010 2009 0 175,587 179,653 184,007 184,586 184,408 1-4 736,615 739,083 739,099 740,295 747,148 5-11 1,354,657 1,378,914 1,394,007 1,405,533 1,405,232 12-17 1,196,634 1,189,120 1,184,970 1,184,064 1,191,453 18-64 10,491,737 10,527,210 10,558,770 10,522,183 10,485,731 65+ 2,824,345 2,716,368 2,594,946 2,538,328 2,471,815 Total 16,779,575 16,730,348 16,655,799 16,574,989 16,485,787
Table 2. Live births by age of mothers in the Netherlands, 2009-13
Age of mother 2013 2012 2011 2010 2009 -19 1,750 1,592 1,717 1,884 1,953 20-24 15,190 15,206 15,782 16,417 16,499 25-29 46,616 50,371 50,295 51,570 51,459 30-34 65,651 67,489 69,174 69,420 68,828 35-39 35,489 33,725 35,340 37,213 38,637 40-44 6,378 7,212 7,393 7,565 7,252 45+ 267 364 359 328 287 Total 171,341 175,959 180,060 184,397 184,915
Table 3. Trends in incidence of food-related pathogens, 1999-2013
Year Ca* Sa RV NV aLm aLm
fatal pLm pLm fatal O157 O157 hosp HAV HAV hosp (a) (a) (a) (a) (b) (b) (b) (b) (b) (b) (b) (b)
1999 38.7 21.1 19.2 14.2 36 2000 42.1 20.3 15.7 12.8 43 2001 44.3 20.4 17.5 11.2 41 2002 40.8 15.4 16.5 11.8 49 2003 33.3 20.7 17.5 12.6 57 2004 40.0 15.6 15.4 13.2 37 2005 43.8 12.9 21.4 15.6 85 15 6 53 2006 40.0 16.0 25.5 17.3 59 17 5 1 40 258 39 2007 40.7 11.9 20.1 14.5 60 12 6 1 83 168 27 2008 39.2 15.7 27.1 18.1 51 6 1 1 45 183 35 2009 44.1 11.6 30.9 17.7 76 4 3 1 57 21 176 29 2010 50.2 13.8 35.2 22.2 73 13 4 1 52 21 262 52 2011 51.3 12.2 23.7 19.4 79 4 9 1 65 18† 125 25 2012 48.8 20.7 20.1 19.7 71 8 6 0 85 31‡ 121 28 2013 48.0 9.3 23.3 18.6 76 7 3 0 90 36** 109 30 Data sources: see text; * Ca: Campylobacter spp.; Sa: Salmonella spp.; RV: rotavirus;
NV: norovirus; aLm: acquired listeriosis; pLm: perinatal listeriosis; O157: STEC O157; HAV: hepatitis A-virus; hosp: hospitalized; † known for 57 of the 65 cases; ‡ known for 77 of the 85 cases; ** known for 84 of the 90 cases; (a) per 100,000 inhabitants; (b) reported cases
Table 4. Incidence of gastroenteritis by pathogen in the Netherlands, 2013 (population 16.8 million)
Pathogen
General
population GP visit Hospitalised Fatal cases (x 1,000) (x 1,000) (x 1,000) All causes 4,809† 222 22.0 NA# 3,988 - 5,716‡ 72 - 513 - Bacteria – infectious Campylobacter spp. 100 24 1.1 55 14 - 272 12 - 44 0.4 - 2.1 21 - 51 STEC O157 2.1 0.8 0.03 1 0.2 – 8.8 0.02 - 3.1 - 0 - 1.2 Salmonella spp. 28 4.2 1.1 27 2.4 - 85 2.3 - 7.1 0.5 - 2.1 30 - 39
Bacteria – toxin producing
Bacillus cereus 51 7.0 0.2 0 18 - 124 1.7 - 20 0.07 - 0.5 - Clostridium perfringens 169 31 0.3 5 56 - 375 7.4 - 81 0.01 - 0.6 0 - 19 Staphylococcus aureus 291 40 1.5 7 124 - 548 11 - 96 0.6 - 2.8 0 - 28 Viruses Norovirus 663 16 1.9 66 452 - 967 9.0 - 25 1.0 - 3.2 28 - 124 Rotavirus 298 18 5.8 47 145 - 532 11.8 - 27.1 4.3 - 7.7 15 - 104 Protozoa Cryptosporidium spp. 28 1.7 0.6 2 8.7 - 69.7 0.8 - 3.1 0.2 - 1.2 0 - 7.4 Giardia spp. 49 4.3 0.4 1 24.7 - 94.9 2.2 - 7.6 0.04 - 1.4 0 - 5.4
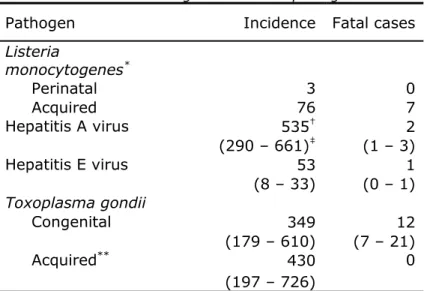
Table 5. Incidence of non-gastrointestinal pathogens in the Netherlands, 2013
Pathogen Incidence Fatal cases
Listeria monocytogenes* Perinatal 3 0 Acquired 76 7 Hepatitis A virus 535† 2 (290 – 661)‡ (1 – 3) Hepatitis E virus 53 1 (8 – 33) (0 – 1) Toxoplasma gondii Congenital 349 12 (179 – 610) (7 – 21) Acquired** 430 0 (197 – 726)
* No uncertainty because Listeria cases were acquired through active surveillance; † mean; ‡ 2.5-97.5 percentile; ** chorioretinitis only
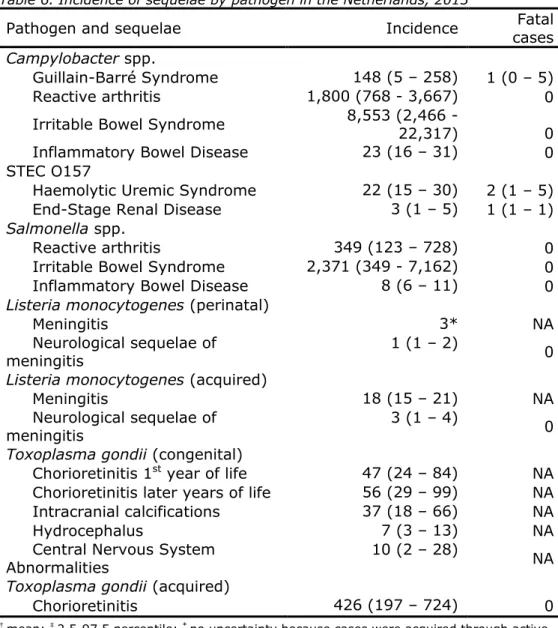
Table 6. Incidence of sequelae by pathogen in the Netherlands, 2013
Pathogen and sequelae Incidence cases Fatal
Campylobacter spp.
Guillain-Barré Syndrome 148 (5 – 258) 1 (0 – 5) Reactive arthritis 1,800 (768 - 3,667) 0 Irritable Bowel Syndrome 8,553 (2,466 - 22,317) 0 Inflammatory Bowel Disease 23 (16 – 31) 0 STEC O157
Haemolytic Uremic Syndrome 22 (15 – 30) 2 (1 – 5) End-Stage Renal Disease 3 (1 – 5) 1 (1 – 1)
Salmonella spp.
Reactive arthritis 349 (123 – 728) 0
Irritable Bowel Syndrome 2,371 (349 - 7,162) 0 Inflammatory Bowel Disease 8 (6 – 11) 0
Listeria monocytogenes (perinatal)
Meningitis 3* NA
Neurological sequelae of
meningitis 1 (1 – 2) 0
Listeria monocytogenes (acquired)
Meningitis 18 (15 – 21) NA
Neurological sequelae of meningitis
3 (1 – 4)
0
Toxoplasma gondii (congenital)
Chorioretinitis 1st year of life 47 (24 – 84) NA Chorioretinitis later years of life 56 (29 – 99) NA Intracranial calcifications 37 (18 – 66) NA
Hydrocephalus 7 (3 – 13) NA
Central Nervous System Abnormalities
10 (2 – 28)
NA
Toxoplasma gondii (acquired)
Chorioretinitis 426 (197 – 724) 0
† mean; ‡ 2.5-97.5 percentile; * no uncertainty because cases were acquired through active surveillance; NA: not applicable (fatal cases are reported in Table 2)
Table 7. Comparison of results from the original and updated model. Year Model 2009 2010 2011 2012 2013 Deaths Campylobacter spp. Original 38 39 34 34 Update 56 64 57 54 55 Salmonella spp. Original 40 40 35 34 Update 38 45 35 59 27
Total number Original 233 269 219 218
Update 250 300 240 270 240 DALYs Campylobacter spp. Original 3,250 3,620 3,633 3,472 Update 3,434 3,926 3,922 3,720 3,408 Salmonella spp. Original 1,270 1,410 1,294 1,796 Update 1,203 1,423 1,226 2,040 1,101 Total Original 13,500 14,900 13,900 14,000 Update 13,900 15,400 14,200 14,500 13,300 Food Original 5,800 6,400 6,200 6,500 Update 6,100 6,600 6,300 6,600 5,900 COI (M€ discounted at 4%)
Campylobacter spp. Original n.a. n.a. 76 73
Update n.a. n.a. 77 76 76
Salmonella spp. Original n.a. n.a. 22 32
Update n.a. n.a. 22 34 19
Total Original n.a. n.a. 416 412
Update n.a. n.a. 417 417 424
Food Original n.a. n.a. 168 175
Table 8. Estimated total DALY, DALY per 100,000 inhabitants and mean DALY per case of illness in the Netherlands, 2013
Pathogen
DALY per year per 100,000 per 1,000 cases DALY DALY
Discount rate 0% 1.5% 0% 1.5% 0% 1.5% Bacteria – infectious Campylobacter spp. 3,408 3,041 20 18 34 31 STEC O157 138 109 0.8 0.7 65 51 Salmonella spp. 1,101 925 6.6 5.5 39 33 L. monocytogenes (perinatal) 28 16 0.2 0.1 9,194 5,467 L. monocytogenes (acquired) 64 61 0.4 0.4 844 809 L. monocytogenes (total) 92 77 0.5 0.5 1,161 986
Bacteria – toxin producing
Bacillus cereus 116 116 0.7 0.7 2.3 2.3 Clostridium perfringens 541 534 3.2 3.2 3.2 3.2 Staphylococcus aureus 767 760 4.6 4.5 2.6 2.6 Viruses Norovirus 1,698 1,508 10 9.0 2.6 2.3 Rotavirus 1,605 1,440 10 8.6 5.4 4.8 Hepatitis A virus 86 74 0.5 0.4 161 139 Hepatitis E virus 23 20 0.1 0.1 434 377 Protozoa Cryptosporidium spp. 67 70 0.4 0.4 2.4 2.5 Giardia spp. 89 100 0.5 0.6 1.8 2.1 Toxoplasma gondii (congenital) 2,104 1,235 13 7.3 6,350 3,726 Toxoplasma gondii (acquired) 1,348 1,021 8.0 6.1 3,173 2,405
Table 9. Estimated total costs of illness (COI), COI per 100,000 inhabitants and mean COI per case of illness in the Netherlands, 2013
Pathogen COI a per year (M€) COI a per 100,000 (k€) COI a per 1,000 cases (k€) Discount rate 0% 4% 0% 4% 0% 4% Bacteria – infectious Campylobacter spp. 82 76 489 455 824 767 STEC O157 5 2 31 14 2,449 1,076 Salmonella spp. 21 20 127 117 762 701 L. monocytogenes (perinatal) 2.8 1.0 17 6 947,107 328,672 L. monocytogenes (acquired) 2.4 2.2 14 13 31,196 29,252 L. monocytogenes (total) 5.2 3.2 31 19 65,977 40,622
Bacteria – toxin producing
Bacillus cereus 10 10 60 60 197 197 Clostridium perfringens 28 28 167 167 166 166 Staphylococcus aureus 58 58 345 345 199 199 Viruses Norovirus 110 110 653 653 165 165 Rotavirus 78 78 467 467 263 263 Hepatitis A virus 1 1 5 5 1,535 1,535 Hepatitis E virus 0 0 1 1 4,576 4,576 Protozoa Cryptosporidium spp. 9 9 52 52 316 316 Giardia spp. 10 10 58 58 199 199 Toxoplasma gondii (congenital) 53 17 314 102 153,698 50,070
Toxoplasma gondii (acquired) 3.0 3 18 18 7,104 7,095
Toxoplasma gondii (total) 56 20 332 120 72,405 26,217
TOTAL 472 424 2,814 2,526
Table 10. Attribution of the incidence, fatalities, disease burden and Cost-of-Illness* to the major transmission pathways in the Netherlands, 2013
Main pathway Food Environment Human Animal Travel Total
Incidence (per year) 669,579 203,682 587,588 83,578 134,974 1,679,402
Deaths (per year) 79 39 73 20 25 236
Disease burden (DALY) 5,847 2,739 2,349 1,057 1,191 13,183
Disease burden (DALY, discounted) 4,857 2,142 2,092 917 1,022 11,030
Cost of illness (M€, undiscounted)a 198 78 123 32 41 472
Cost of illness (M€, discounted at 4%)a 172 63 122 29 38 424
* due to the 14 pathogens included in this study a costs are expressed in 2013 euros
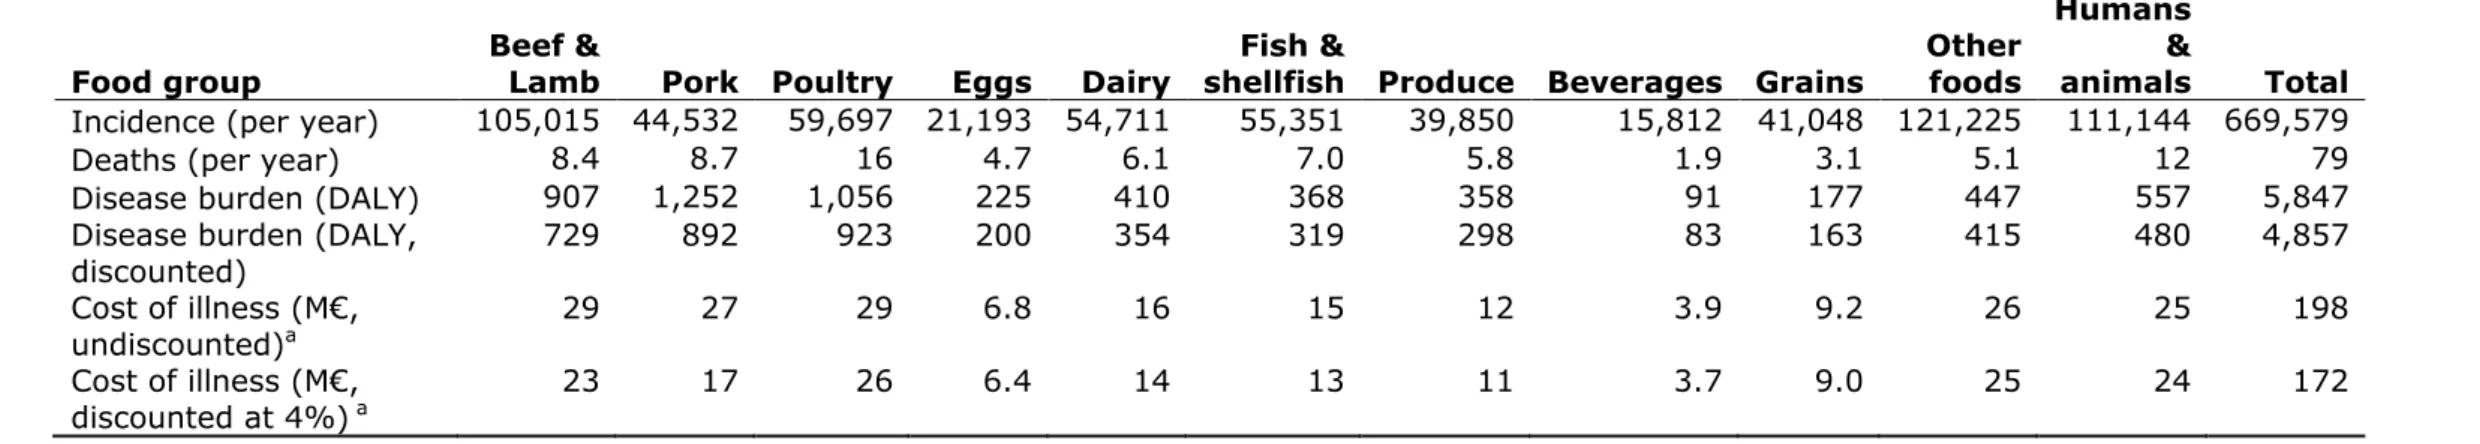
Table 11. Attribution of the incidence, fatalities, disease burden and Cost-of-Illness of foodborne disease* to food groups in the Netherlands, 2013
Food group Beef & Lamb Pork Poultry Eggs Dairy shellfish Produce Beverages Grains Fish & Other foods
Humans &
animals Total
Incidence (per year) 105,015 44,532 59,697 21,193 54,711 55,351 39,850 15,812 41,048 121,225 111,144 669,579
Deaths (per year) 8.4 8.7 16 4.7 6.1 7.0 5.8 1.9 3.1 5.1 12 79
Disease burden (DALY) 907 1,252 1,056 225 410 368 358 91 177 447 557 5,847
Disease burden (DALY,
discounted) 729 892 923 200 354 319 298 83 163 415 480 4,857
Cost of illness (M€,
undiscounted)a 29 27 29 6.8 16 15 12 3.9 9.2 26 25 198
Cost of illness (M€,
discounted at 4%) a 23 17 26 6.4 14 13 11 3.7 9.0 25 24 172
* due to the 14 pathogens included in this study a costs are expressed in 2013 euros
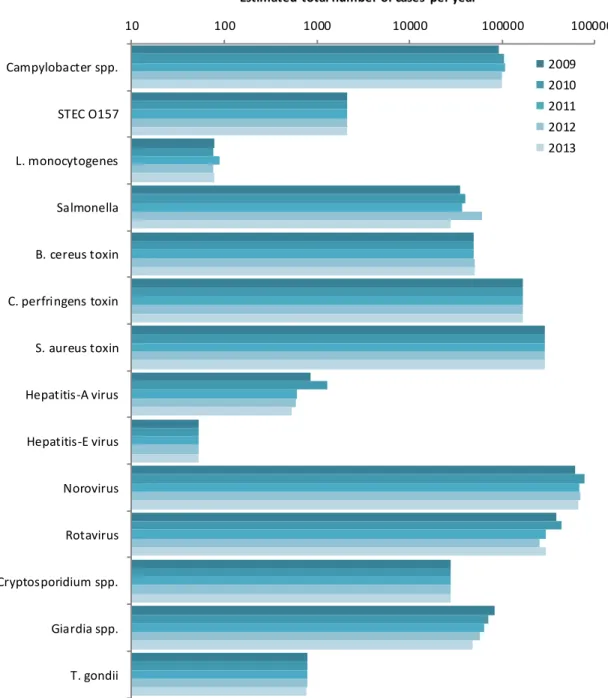
Figure 1. Comparison of incidence of food-related pathogens in 2009 through 2013. 10 100 1000 10000 100000 1000000 Campylobacter spp. STEC O157 L. monocytogenes Salmonella B. cereus toxin C. perfringens toxin S. aureus toxin Hepatitis-A virus Hepatitis-E virus Norovirus Rotavirus Cryptosporidium spp. Giardia spp. T. gondii
Estimated total number of cases per year
2009 2010 2011 2012 2013
Figure 2. Comparison of disease burden of food-related pathogens in 2009 through 2013. 0 1000 2000 3000 4000 5000 Campylobacter STEC O157 L. monocytogenes Salmonella B. cereus toxine C. perfringens toxine S. aureus toxine Hepatitis-A virus Hepatitis-E virus Norovirus Rotavirus C. parvum G. lamblia T. gondii
Estimated total DALYs per year
2009 2010 2011 2012 2013
Annex. Detailed results
Summary of results
Pathogen Incidence (per
year) Deaths (per year) DALY (undisc.) Costs ( M€ per year)* Undisc. Disc. 4% Campylobacter spp. 99,501 55 3,408 83 76 STEC O157 2,141 4 138 5 2 L. monocytogenes 79 7 92 5 3 Salmonella spp. 28,019 27 1,101 20 19 B. cereus toxine 51,329 0 116 10 10 C. perfringens toxine 168,703 5 541 28 28 S. aureus toxine 291,077 7 767 58 58 Hepatitis-A virus 534 2 86 1 1 Hepatitis-E virus 53 1 23 0.2 0.2 Norovirus 663,274 66 1,698 110 110 Rotavirus 297,538 47 1,605 78 78 C. parvum 27,689 2 67 9 9 G. lamblia 48,695 1 89 10 10 T. gondii 770 12 3,452 56 20 Totaal 1,679,402 236 13,183 472 424
Attribution of incidence by pathogen to main pathways
Pathogen Food Environment Human Animal Travel Total
Campylobacter spp. 41,789 20,498 6,269 19,005 11,940 99,501 STEC O157 865 368 218 439 250 2,141 L. monocytogenes 55 5 4 4 11 79 Salmonella spp. 15,270 3,614 2,606 2,578 3,951 28,019 B. cereus toxine 45,836 565 616 565 3,747 51,329 C. perfringens toxine 152,508 3,711 3,543 3,543 5,398 168,703 S. aureus toxine 253,819 10,479 9,314 6,404 11,061 291,077 Hepatitis-A virus 62 59 97 0 316 534 Hepatitis-E virus 7 13 4 6 23 53 Norovirus 110,595 94,214 367,568 33,174 57,723 663,274 Rotavirus 38,681 50,581 172,869 8,926 26,481 297,538 C. parvum 3,330 7,659 7,576 3,705 5,419 27,689 G. lamblia 6,331 11,638 16,897 5,210 8,619 48,695 T. gondii 431 278 7 19 35 770 Total 669,579 203,682 587,588 83,578 134,974 1,679,402
Attribution of deaths by pathogen to main pathways
Pathogen Food Environment Human Animal Travel Totaal
Campylobacter spp. 23.2 11.4 3.5 10.5 6.6 55.2 STEC O157 1.6 0.7 0.4 0.8 0.5 4.0 L. monocytogenes 4.8 0.5 0.4 0.4 0.9 7.0 Salmonella spp. 14.5 3.4 2.5 2.5 3.8 26.6 B. cereus toxine 0.0 0.0 0.0 0.0 0.0 0.0 C. perfringens toxine 4.1 0.1 0.1 0.1 0.1 4.5 S. aureus toxine 6.3 0.3 0.2 0.2 0.3 7.2 Hepatitis-A virus 0.2 0.2 0.3 0.0 1.0 1.7 Hepatitis-E virus 0.1 0.2 0.0 0.1 0.3 0.6 Norovirus 11.1 9.4 36.9 3.3 5.8 66.5 Rotavirus 6.1 8.0 27.4 1.4 4.2 47.1 C. parvum 0.2 0.5 0.5 0.2 0.3 1.7 G. lamblia 0.2 0.3 0.5 0.1 0.2 1.4 T. gondii 6.8 4.4 0.1 0.3 0.6 12.2 Total 79.1 39.3 72.7 19.9 24.6 235.6
Attribution of disease burden (DALY per year, undiscounted) to main pathways
Pathogen Food Environment Human Animal Travel Total
Campylobacter spp. 1,431 702 215 651 409 3,408 STEC O157 56 24 14 28 16 138 L. monocytogenes 64 6 5 5 12 92 Salmonella spp. 601 142 102 101 155 1,101 B. cereus toxine 104 1 1 1 9 116 C. perfringens toxine 490 12 11 11 17 541 S. aureus toxine 668 28 25 17 29 767 Hepatitis-A virus 8 10 16 0 52 86 Hepatitis-E virus 2 6 2 3 10 23 Norovirus 284 241 940 85 148 1,698 Rotavirus 209 273 932 48 143 1,605 C. parvum 3 20 20 10 14 67 G. lamblia 1 24 35 11 18 89 T. gondii 1,926 1,250 31 86 159 3,452 Total 5,847 2,739 2,349 1,057 1,191 13,183
Attribution of cost-of-illness (k€ per year, undiscounted and expressed in 2013 euros) to main pathways
Pathogen Food Environment Human Animal Travel Total
Campylobacter spp. 34,662 17,001 5,199 15,763 9,903 82,528 STEC O157 2,118 902 535 1,075 613 5,243 L. monocytogenes 3,607 349 276 281 698 5,212 Salmonella spp. 10,909 2,582 1,862 1,842 2,822 20,017 B. cereus toxine 9,045 111 122 111 739 10,129 C. perfringens toxine 25,290 615 587 587 895 27,976 S. aureus toxine 50,515 2,085 1,854 1,274 2,201 57,930 Hepatitis-A virus 93 91 149 0 486 820 Hepatitis-E virus 33 60 18 26 104 243 Norovirus 18,294 15,555 60,687 5,477 9,530 109,543 Rotavirus 10,182 13,315 45,508 2,350 6,971 78,326 C. parvum 1,040 2,420 2,394 1,171 1,712 8,737 G. lamblia 1,258 2,313 3,358 1,035 1,713 9,676 T. gondii 31,109 20,182 502 1,394 2,565 55,752 Total 198,156 77,583 123,050 32,387 40,955 472,131
Attribution of cost-of-illness (k€ per year, discounted at 4% and expressed in 2013 euros) to main pathways
Pathogen Food Environment Human Animal Travel Total
Campylobacter spp. 31,946 15,669 4,792 14,528 9,127 76,061 STEC O157 930 396 235 472 269 2,303 L. monocytogenes 2,219 215 170 173 430 3,207 Salmonella 10,220 2,419 1,744 1,725 2,644 18,753 B. cereus toxine 9,045 111 122 111 739 10,129 C. perfringens toxine 25,290 615 587 587 895 27,976 S. aureus toxine 50,515 2,085 1,854 1,274 2,201 57,930 Hepatitis-A virus 93 91 149 0 486 820 Hepatitis-E virus 33 60 18 26 104 243 Norovirus 18,294 15,555 60,687 5,477 9,530 109,543 Rotavirus 10,182 13,315 45,508 2,350 6,971 78,326 C. parvum 1,040 2,420 2,394 1,171 1,712 8,737 G. lamblia 1,258 2,313 3,358 1,035 1,713 9,676 T. gondii 11,264 7,308 182 505 929 20,187 Total 172,331 62,573 121,799 29,435 37,752 423,890
Attribution of incidence by pathogen to food groups
Pathogen Beef & Lamb Pork Poultry Eggs Dairy shellfish Produce Beverages Grains Fish & Other foods
Humans & animals Total Campylobacter spp. 1713 2131 22526 1296 3719 2925 2215 710 961 1379 2215 41789 STEC O157 381 55 27 18 64 25 61 31 25 30 146 865 L. monocytogenes 6 5 4 2 14 10 4 1 3 3 3 55 Salmonella spp. 1924 2184 2260 3390 1008 626 962 473 657 916 870 15270 B. cereus toxine 3300 1604 733 1650 2659 917 917 779 7746 24431 1100 45836 C. perfringens toxine 72899 12811 10828 4270 6253 9913 10523 3813 3965 11743 5490 152508 S. aureus toxine 19036 20559 19798 8376 37311 14722 5076 4569 19036 75131 30205 253819 Hepatitis-A virus 0 0 0 0 0 8 8 3 3 2 38 62 Hepatitis-E virus 0 5 0 0 0 0 1 0 0 0 1 7 Norovirus 3539 3428 3207 2101 2212 17142 8074 3428 5751 5530 56183 110595 Rotavirus 0 1083 0 0 658 7504 9206 1702 2901 1741 13886 38681 C. parvum 872 147 97 90 306 726 689 100 0 100 203 3330 G. lamblia 1247 304 196 0 487 817 2089 203 0 209 779 6331 T. gondii 98 216 21 0 20 16 25 0 0 10 25 431 Total 105015 44532 59697 21193 54711 55351 39850 15812 41048 121225 111144 669579
Attribution of deaths by pathogen to food groups
Pathogen Beef & Lamb Pork Poultry Eggs Dairy shellfish Produce Beverages Grains Fish & Other foods
Humans & animals Total Campylobacter spp. 1.0 1.2 12.5 0.7 2.1 1.6 1.2 0.4 0.5 0.8 1.2 23.2 STEC O157 0.7 0.1 0.1 0.0 0.1 0.0 0.1 0.1 0.0 0.1 0.3 1.6 L. monocytogenes 0.5 0.5 0.3 0.2 1.2 0.9 0.4 0.1 0.3 0.3 0.2 4.8 Salmonella spp. 1.8 2.1 2.1 3.2 1.0 0.6 0.9 0.5 0.6 0.9 0.8 14.5 B. cereus toxine 0.0 0.0 0.0 0.0 0.0 0.0 0.0 0.0 0.0 0.0 0.0 0.0 C. perfringens toxine 1.9 0.3 0.3 0.1 0.2 0.3 0.3 0.1 0.1 0.3 0.1 4.1 S. aureus toxine 0.5 0.5 0.5 0.2 0.9 0.4 0.1 0.1 0.5 1.9 0.7 6.3 Hepatitis-A virus 0.0 0.0 0.0 0.0 0.0 0.0 0.0 0.0 0.0 0.0 0.1 0.2 Hepatitis-E virus 0.0 0.1 0.0 0.0 0.0 0.0 0.0 0.0 0.0 0.0 0.0 0.1 Norovirus 0.4 0.3 0.3 0.2 0.2 1.7 0.8 0.3 0.6 0.6 5.6 11.1 Rotavirus 0.0 0.2 0.0 0.0 0.1 1.2 1.5 0.3 0.5 0.3 2.2 6.1 C. parvum 0.1 0.0 0.0 0.0 0.0 0.0 0.0 0.0 0.0 0.0 0.0 0.2 G. lamblia 0.0 0.0 0.0 0.0 0.0 0.0 0.1 0.0 0.0 0.0 0.0 0.2 T. gondii 1.6 3.4 0.3 0.0 0.3 0.3 0.4 0.0 0.0 0.2 0.4 6.8 Total 8.4 8.7 16.5 4.7 6.1 7.0 5.8 1.9 3.1 5.1 11.8 79.1
Attribution of disease burden (DALY per year, undiscounted) to food groups
Pathogen Beef & Lamb Pork Poultry Eggs Dairy shellfish Produce Beverages Grains Fish & Other foods
Humans & animals Total Campylobacter spp. 59 73 772 44 127 100 76 24 33 47 76 1,431 STEC O157 25 4 2 1 4 2 4 2 2 2 9 56 L. monocytogenes 7 6 4 2 16 11 5 2 4 4 3 64 Salmonella spp. 75 86 89 133 40 25 38 19 26 36 34 601 B. cereus toxine 7 4 2 4 6 2 2 2 18 55 2 104 C. perfringens toxine 233 41 35 14 20 32 34 12 13 38 18 490 S. aureus toxine 50 54 52 22 98 39 13 12 50 198 80 668 Hepatitis-A virus 0 0 0 0 0 1 1 0 0 0 6 8 Hepatitis-E virus 0 2 0 0 0 0 0 0 0 0 0 2 Norovirus 9 9 8 5 6 44 21 9 15 14 144 284 Rotavirus 0 6 0 0 4 40 50 9 16 9 75 209 C. parvum 1 0 0 0 0 1 1 0 0 0 0 3 G. lamblia 0 0 0 0 0 0 1 0 0 0 0 1 T. gondii 441 967 92 0 89 71 112 0 0 44 110 1,926 Total 907 1252 1056 225 410 368 358 91 177 447 557 5847
Attribution of cost-of-illness (k€ per year, undiscounted and expressed in 2013 euros) to food groups
Pathogen Beef & Lamb Pork Poultry Eggs Dairy shellfish Produce Beverages Grains Fish & Other foods
Humans & animals Total Campylobacter spp. 1,421 1,768 18,683 1,075 3,085 2,426 1,837 589 797 1,144 1,837 34,662 STEC O157 934 136 66 44 157 61 150 76 61 74 358 2,118 L. monocytogenes 404 335 238 137 891 642 274 94 213 202 177 3,607 Salmonella spp. 1,375 1,560 1,615 2,422 720 447 687 338 469 655 622 10,909 B. cereus toxine 651 317 145 326 525 181 181 154 1,529 4,821 217 9,045 C. perfringens toxine 12,089 2,124 1,796 708 1,037 1,644 1,745 632 658 1,947 910 25,290 S. aureus toxine 3,789 4,092 3,940 1,667 7,426 2,930 1,010 909 3,789 14,952 6,011 50,515 Hepatitis-A virus 0 0 0 0 0 12 12 4.1 4.1 2.9 59 93 Hepatitis-E virus 0 25 0 0 0 2 2 1 0 0 3 33 Norovirus 585 567 531 348 366 2,836 1,335 567 951 915 9,293 18,294 Rotavirus 0 285 0 0 173 1,975 2,423 448 764 458 3,655 10,182 C. parvum 272 46 30 28 96 227 215 31 0 31 63 1,040 G. lamblia 248 60 39 0 97 162 415 40 0 42 155 1,258 T. gondii 7,124 15,617 1,493 0 1,431 1,151 1,804 0 0 716 1,773 31,109 Total 28,892 26,931 28,574 6,754 16,002 14,696 12,093 3,885 9,234 25,959 25,135 198,156
Attribution of cost-of-illness (k€ per year, discounted at 4% and expressed in 2013 euros) to food groups
Pathogen Beef & Lamb Pork Poultry Eggs Dairy shellfish Produce Beverages Grains Fish & Other foods
Humans & animals Total Campylobacter spp. 1,310 1,629 17,219 990 2,843 2,236 1,693 543 735 1,054 1,693 31,946 STEC O157 410 60 29 20 69 27 66 33 27 33 157 930 L. monocytogenes 249 206 146 84 548 395 169 58 131 124 109 2,219 Salmonella spp. 1,288 1,461 1,513 2,269 675 419 644 317 439 613 583 10,220 B. cereus toxine 651 317 145 326 525 181 181 154 1,529 4,821 217 9,045 C. perfringens toxine 12,089 2,124 1,796 708 1,037 1,644 1,745 632 658 1,947 910 25,290 S. aureus toxine 3,789 4,092 3,940 1,667 7,426 2,930 1,010 909 3,789 14,952 6,011 50,515 Hepatitis-A virus 0 0 0 0 0 12 12 4.1 4.1 2.9 59 93 Hepatitis-E virus 0 25 0 0 0 1.6 2.5 1.2 0.0 0.0 3.4 33 Norovirus 585 567 531 348 366 2,836 1,335 567 951 915 9,293 18,294 Rotavirus 0 285 0 0 173 1,975 2,423 448 764 458 3,655 10,182 C. parvum 272 46 30 28 96 227 215 31 0 31 63 1,040 G. lamblia 248 60 39 0 97 162 415 40 0 42 155 1,258 T. gondii 2,580 5,655 541 0 518 417 653 0 0 259 642 11,264 Total 23,470 16,527 25,927 6,439 14,372 13,462 10,565 3,738 9,026 25,253 23,551 172,331