Cost-effective abatement options for improving air quality in the Netherlands Winand Smeetsa, Wim Bloma, Anco Hoena, Benno Jimminka, Robert Koelemeijera, Jeroen Petersa, Wilco de Vriesa
aMNP Netherlands Environmental Assessment Agency, PO Box 303, 3720 AH Bilthoven, The Netherlands, e-mail: winand.smeets@mnp.nl, tel: +31 30 274 3779, fax: +31 30 274 4433
ABSTRACT
MNP has evaluated the cost-effectiveness of policy options to improve the air quality in the Netherlands. This paper considers further abatement options in different sectors and looks at the emissions of primary and secondary precursors for fine particulate matter (PM10). The evaluation shows that there are two ways to consider the cost-effectiveness of further policy actions. The first is to focus on the progress towards the legally binding EU air quality limit values for fine particulate matter (PM10) and nitrogen dioxide (NO2), i.e. to minimize the concentration along traffic-related hot-spots at least costs. The second is to focus on health benefits, i.e. to minimize the population exposure to PM10 at least costs. Cost-effectiveness of abatement options has been quantified for both policy objectives. Results show that optimizing air quality limit values in the Netherlands will, in general, also deliver cost-optimal solutions for the reduction of exposure to PM10. The introduction of road use pricing schemes is the most cost-effective, followed by technical measures directed at the reduction of primary PM10 emissions from storage and handling, shipping, industry and agriculture. The implementation of ‘de-NOx’ equipment on inland ships is also cost-effective. Other assessed abatement options are less cost-effective. These are measures to reduce the emissions of secondary precursors i.e. measures to reduce NH3 emissions from agriculture, SO2/NOx emissions from industry and NOx emissions from small combustion sources. Cleaner heavy duty vehicles (particle filters and advanced ‘de-NOx’ technology) form a special case. Results indicate that cleaner heavy duty vehicles are cost-effective (compared to other measures) to bring down the concentration of PM10 and NO2 at traffic-related hot-spots, but are relatively costly (compared to other measures) for improving the exposure of the general population to PM10. Note that estimates for the effect of particle filters on population exposure are preliminary. Exposure modelling at high resolution is needed to confirm calculated effects of particle filters for exposure.
Key words: cost-effectiveness, PM10, measures, particulates, nitrogen dioxide, health, hot spots, road pricing, exposure
1. INTRODUCTION
MNP has evaluated the cost-effectiveness of abatement options in achieving air quality improvements in the Netherlands in the long-term (2020). Two policy objectives are important in this respect (Watkiss, 2004). At the one hand, policy makers want to achieve progress towards the legally binding EU air quality limit values for fine particulate matter (PM10) and nitrogen dioxide (NO2), i.e. to minimize the number of exceedances along traffic-related hot-spots at least costs, while on the other, they also want to maximize health benefits, i.e. to minimize the exposure to fine particulates in the general population at least costs. Effects of abatement options have been evaluated in terms of:
• The decline in concentrations of fine particulates (PM10) and nitrogen dioxide (NO2) along motorways in view of the progress towards meeting the legally binding EU air quality limit values;
• The exposure of the Dutch population to anthropogenic PM10 in view of the associated mortality and health effects.
A more comprehensive analysis and further details are given in the final report (Smeets et al, 2007).
The Netherlands has problems to comply with EU limit values for PM10 and NO2. Current limit values for PM10 have been in force since 2005. Limit values for NO2 will come into force in 2010. Exceedances of these limit values are most persistent along motorways and
busy streets in large cities. Additional emission control options are needed to reduce the number of exceedances in the short term (2000-2015) and to ultimately comply with standards in the long term (2015-2020). Problems with the exceedance of the limit value for NO2 are primarily related to the emissions of road transport. On the other hand, problems associated with PM10 (exceedances of the limit value and health effects) are caused by different sources i.e. road transport, shipping, mobile machinery, agriculture, industry, storage and handling of goods, and small combustion sources. Furthermore, many pollutants contribute to the problem of pollution due to particulates i.e. emissions of directly emitted or ‘primary’ particulates (PM10 or PM2.5), as well as emissions of sulphur dioxide (SO2), nitrogen oxides (NOx) and ammonia (NH3). In the atmosphere these give rise to the formation of so-called ‘secondary’ particulates.
This paper considers abatement options in all relevant sectors for all precursors of PM10 (primary PM10, SO2, NOx, NH3), focusing principally on technical options. The road pricing scheme currently under discussion in the Netherlands is also considered here. Local road transport measures and climate options have not been evaluated.
2. METHODOLOGY General
The study first assessed the likely emissions and air quality in the year 2020, given the current legislation. This is referred to as the baseline scenario for 2020. The study then evaluated the cost-effectiveness of additional abatement measures against this baseline scenario in terms of: • The national emission reductions achieved for ‘primary’ PM10 emissions and for the
‘secondary’ precursors SO2, NOx and NH3;
• The reduction in PM10 and NO2 concentrations along motorways; • The exposure of the Dutch population to PM10.
Results in terms of changes in concentration and exposure are presented as marginal cost curves. Marginal cost curves relate to the year 2020 and show the extra yearly costs (compared to the baseline) that have to be made to achieve an extra change in concentration or exposure.
The information on costs and emission reductions of various abatement options is taken from a large Dutch study reported in 2006 (Daniëls and Farla, 2006). Cost estimates for advanced NOx technology for road vehicles are preliminary (Wesselink et al., 2006, Beck et al., 2004). The assumed cost-effectiveness in terms of emissions for this measure amounts to 10 per kg reduction in NOx emissions. Information on costs and benefits of road pricing schemes is taken from a Dutch study performed by the CPB, Netherlands Bureau for Economic Policy Analysis (Besseling et al, 2005). Changes in rural and urban background concentrations were calculated on a 5 x 5 km grid using the OPS model (van Jaarsveld, 2004). The CAR model was used for the quantification of the additional concentration changes on the local scale, looking at the increments in PM10 and NO2 concentrations along motorways caused by local transport (Jonkers and Teeuwisse, 2006).
Note that given concentration and exposure changes are calculated relative to the projected baseline for the year 2020, rather than relative to the current situation in 2006. Thus, reported concentration and exposure changes show the difference between the projected 2020 output ‘without extra measures’ and the estimated 2020 output ‘with additional measures’. Reported concentration and exposure changes relate only to emission reductions on the Dutch territory.
Baseline scenario
In this study, the Global Economy was used as the baseline scenario (Velders et al, 2006). The economic development and mobility trends in this scenario are consistent with the Dutch baseline scenario currently used in the revision process of the National Emission Ceilings
(NEC) Directive. This scenario incorporates the continued effect of legislation in place up to 2020 such as the Euro5 emission limits for passenger cars (particle filters for diesel cars) along with further SO2 abatement in Dutch refineries (with side-effects on PM10) and the energy sector. Euro5, which will enter into force in September 2009, makes the introduction of particle filters for new diesel cars obligatory. Euro5 will cut the emission limit for particulates by 80% compared to today’s Euro4 emission limit. For NOx, the cut is much smaller i.e. 20%.
Note that the baseline scenario used for this paper does not yet incorporate the Euro6 emission limits for passenger cars that has been recently decided on within the EU. Thus Euro6 for passenger cars is dealt with in this report as an additional measure. Euro6 will set significantly lower emission limits for NOx emissions from new diesel cars (68% cut compared to Euro4). Euro6 for passenger cars will enter into force in 2014. Euro6 for heavy duty vehicles has not yet been settled within the EU. This study assumes a strict version of the Euro6 emission limits for heavy duty vehicles (80% reduction in emission limits compared to Euro5 for PM and NOx) that are in line with best available technologies i.e. particle filters and ‘de-NOx’ technology (Selective Catalytic Reduction).
Projections of emissions and air quality are yearly updated by MNP according to best scientific knowledge. The assessment reported in this study is based on the baseline scenario reported by MNP at the beginning of 2006. In March 2007 new projections will become available. The updated 2007 projection will include among other things improved insights into the emissions of road transport and storage and handling (Velders et al., 2007). This will lead to changes in the projected number of exceedances and the calculated effects of measures. However, note that the general findings reported in this paper are certain and will not change.
Concentration along motorways
The PM10 and NO2 concentration along motorways and thus the effect of abatement measures differ from one motorway to another. Calculations (with and without measures) have been performed for 164 stretches of motorway with a total road length of 505 km. Effects of measures on concentration along motorways have been calculated at a distance of 25 metres from the road axis. Cost curves show the average concentration change along the most polluted stretches of motorway for which the baseline scenario projects an exceedance of the air quality limit values in 2020. According to the baseline, the limit value for PM10 in 2020 is expected to be exceeded on 11 road stretches with a total road length of 27 km. For NO2, exceedances are projected for 54 road stretches with a total road length of 140 km. These figures represent the most likely estimates.
The cost-effectiveness in terms of the average concentration change for the 11 (in the case of PM10) and 54 (in the case of NO2) selected stretches of motorway may be considered as an indicator for the cost-effectiveness of measures towards meeting the air quality limit values i.e. for the reduction of the road length where limit values are exceeded.
Exposure to anthropogenic PM10
This study calculates the changes in exposure to anthropogenic PM10 that can be related to changes in anthropogenic precursor emissions (primary PM10, SO2, NOx, NH3). This focus on anthropogenic particles (originating from primary anthropogenic PM emissions and from secondary inorganic secondary aerosols) is in line with the method adopted in the RAINS model for quantifying the loss in life expectancy due to exposure to particulates. On the advice of the joint World Health Organization/UNECE Task Force on Health, the RAINS model uses a linear concentration–response function and associates all changes in the identified anthropogenic fraction of PM2.5 in a linear way with mortality (Amann et al, 2004, Amann et al, 2005). It is noteworthy that this method, which was adopted by the European Commission for the revision of the NEC directive, is based on some important assumptions.
First, the method does not distinguish different PM fractions: i.e. the study ignores potential differences in particles for health effects according to their chemical composition, size distribution and number counts of particles. Second, due to the inability of current models to calculate the fate of secondary organic aerosols, their contribution to health effects is ignored. Third, it is assumed that particulates originating from natural sources do not cause health effects. Under these assumptions, and ignoring the fact that this cost-effectiveness study focuses on PM10 instead of PM2.5, the calculated relative change in exposure to anthropogenic PM10 is a good indicator of the success of measures in terms of the relative change in population mortality and health impacts.
The population-weighted concentration decline is used as the indicator for changes in exposure to particulates. The (regional and urban) concentration decline over the Dutch area, calculated on a grid of 5 to 5 km, is multiplied by the number of inhabitants per grid. The result is summed over all grids and divided by the total population. This means that the concentration change in populated urban areas weighs, proportionally more than a similar concentration change in sparsely populated rural areas. In fact, this exposure indicator represents the PM10 concentration to which an average resident of the Netherlands is exposed. Bear in mind that subgrid (smaller than 5 to 5 km) variations in concentration and population density have not been taken into account in the estimate of population exposure. For road vehicles this could lead to an underestimation of the benefits from a particle filter. This is because of the local increment in PM10 concentration (and thus larger effects) near to road sides, combined with the fact that most people live next to roadsides. It is assumed that this effect could be important for particle filters from passenger cars. For particle filters on heavy duty trucks, the underestimation is probably of less importance because people on average do not live near motorways and roads with heavy duty traffic. More detailed modelling at higher resolution is needed to get a more accurate estimate of population exposure to particles from passenger cars and heavy duty vehicles. Such calculations should model the complete road network combined with high resolution distribution maps of population.
Selected measures in industry
Note that the Dutch industry has already implemented many advanced techniques to reduce primary PM emissions. This restricts the technical potential for further emission reductions of primary PM. Recently, a new measure has been decided on in the Netherlands that comprises a switch from oil- to gas-firing in petrol refineries. This measure, which has a substantial effect on SO2 and PM10 emissions, is already included in the baseline.
For industry, a selection has been made of the measures contained in the Dutch study reported in 2006 by MNP and ECN (Daniëls and Farla, 2006). For measures that are directed at reducing primary PM emissions, only those measures are selected that have a cost-effectiveness in emission terms up to 50 per kg reduction in PM10 emissions. This includes further measures in the food, chemical, and iron and steel industries. The largest reduction potential for primary PM10 emissions can be found in the food industry. Measures in the aluminium industry have not been incorporated because costs amount to about 100-200 per kg PM10. For NOx emitted by large industries (> 50 MWth) there is an NOx trading system operational in the Netherlands. This trading system sets an average performance standard of 40 grams of NOx per Gigajoule energy use (for combustion emissions) for achievement in 2010. In this study this performance standard is assumed to have been sharpened to 20 grams of NOx per Gigajoule. The cost-effectiveness of this measure amounts to 2,1 per kg NOx. For small combustion plants in industry best available technologies have been assumed ; these include the installation of Selective Catalytic Reduction ‘de-NOx’ equipment on all stationary gas motors. The potential for further SO2 emission reduction in the Netherlands is limited. Many advanced techniques are already implemented or will be implemented in the coming years up to 2010. This paper considers further emission measures in aluminium industry,
carbon black production, iron and steel industry and other industry. The largest reduction potential can be found in the aluminium industry. The cost-effectiveness of additional SO2 measures in industry range from 0,5 to 2,3 per kg SO2.
3. RESULTS AND DISCUSSION Baseline scenario
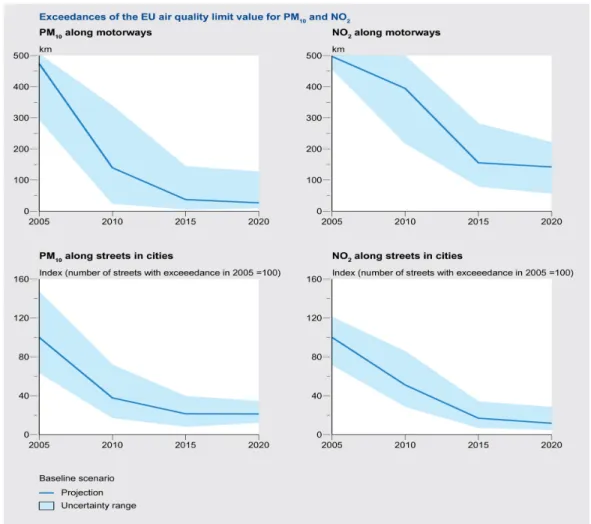
It is expected that the number of exceedances of the PM10 limit value along motorways in the Netherlands in 2015/2020 will be sharply reduced, but the problem will not be fully solved (Velders et al., 2006). Figure 1 shows that the road length of motorways revealing an exceedance of the PM limit value will sharply decrease by about 90% from 2005 up to 2015, given the legislation in place (Velders et al., 2006)). After 2015 the number of exceedances will more-or-less stabilize. Exceedances in 2015 and 2020 are expected to occur only at the most polluted stretches of motorway near large cities, such as Amsterdam and Rotterdam. In 2015 and 2020 this amounts to 37 and 27 km motorway, respectively, i.e. 16 and 11 road sections, respectively. The average PM10 concentration on the 11 selected road sections with an exceedance in 2020 declines from about 38 µg/m3 in 2005 to about 34 µg/m3 in 2015/2020. Results show that additional policy actions will be needed to reduce the number of exceedances in the short term (2000-2015), and to fully solve the problem in the long term (2015-2020).
Figure 1. Number of exceedances of the European limit values for PM10 and NO2 according
to the baseline scenario of February 2006 (Velders, 2006). The assessment of exceedance excludes the contribution of sea salt that is in line with the Dutch Decree on air quality from 2005.
The same conclusions can be drawn for the future exceedance of the NO2 limit value (Figure 1, Velders et al. 2006). For NO2, exceedances in 2015 and 2020 are expected to occur at 61 and 54 road sections, respectively, i.e. 155 and 140 km motorway, respectively. The average NO2-concentration on the 54 selected road sections with exceedances in the year 2020 declines from about 52 µg/m3 in 2005 to about 43 µg/m3 in 2015/2020.
Cost-effectiveness of measures to reduce the PM10 concentration along motorways
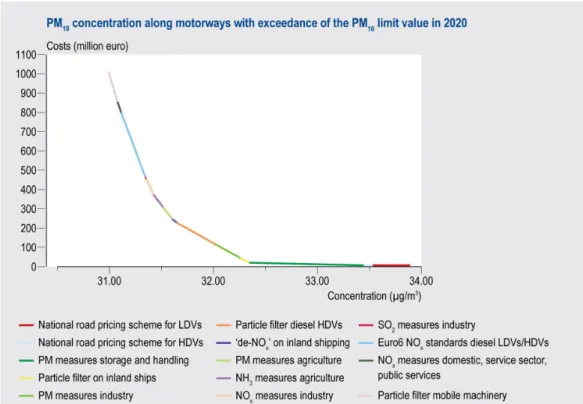
The marginal cost curves for the change in average PM10 concentration for the selected set of the 11 most polluted stretches of motorways are presented in Figure 2. Results show the most cost-effective measure to reduce the PM10 concentration along motorways to be the introduction of road pricing schemes (1). Well-designed road pricing schemes will reduce both congestion and traffic volume. This has positive effects, not only on air quality, but also on traffic flow and thus travel time, road safety and noise nuisance. Technical abatement options do not have such benefits and therefore are less cost-effective. Introduction of a well-defined pricing scheme for passenger cars may lead to net benefits as high as 600 million euro (excluding benefits explained by improved air quality) and 1100 million euro (including benefits explained by improved air quality) (Besseling et al., 2005). Note that the benefits of road use pricing schemes are not shown in the cost curves because these high benefits would hinder the detailed presentation of cost figures for other measures. For road pricing schemes the cost curves thus only show the calculated effects.
Various technical measures directed at reducing primary aerosols are also cost-effective for achieving progress towards the PM10 air quality limit value. These involve measures to reduce diffuse emissions from the storage and handling of bulk goods (2), particle filters on heavy duty vehicles (3), particle filters on inland ships (4), advanced PM abatement technologies in industry (5) and air scrubbers for large pig and poultry houses (6). The implementation of ‘de-NOx’ technology (Selective Catalytic Reduction) on inland ships is also cost-effective (7). The cost-effectiveness of these measures range from approximately 0.5 to 7 M per 0.01 µg/m3 change in PM10 concentration.
Other assessed abatement options are less cost-effective. These involve different measures that are geared to the reduction of secondary aerosols. We are talking about further measures to reduce the NOx emissions from road vehicles (8), NH3 emissions from agriculture (9), SO2/NOx emissions from industry (9), and NOx emissions from small combustion sources in the domestic sector, agriculture, public services and service sector (10). The cost-effectiveness of these measures range from approximately 8 to 15 M per 0.01 µg/m3 change in PM10 concentration.
Figure 2. Cost-effectiveness of abatement options in 2020 in terms of the average decline in PM10 concentration along 11 stretches of motorway (27 km) for which the baseline scenario
projects an exceedance of the PM10 limit value in 2020.
Figure 3. Cost-effectiveness of abatement options in 2020 in terms of the average decline in NO2 concentration along 54 stretches of motorway (140 km) for which the baseline scenario
Cost-effectiveness of measures to reduce the NO2 concentration along motorways
The marginal cost curve for the change in average NO2 concentration for the selected set of 54 most polluted stretches of motorways is presented in Figure 3. The emissions of nitrogen oxides (NOx) by local transport dominate the problem of non-compliance with the NO2 limit value. Results show that cost-effective abatement options are predominantly found in the road transport sector (introduction of road pricing schemes and advanced ‘de-NOx’ technology). The introduction of ‘de-NOx’ technology (Selective Catalytic Reduction) for ships is also cost-effective. Measures to control the NOx emissions in other sectors such as industry, small combustion sources and mobile machinery have a fairly small effect on relative high costs.
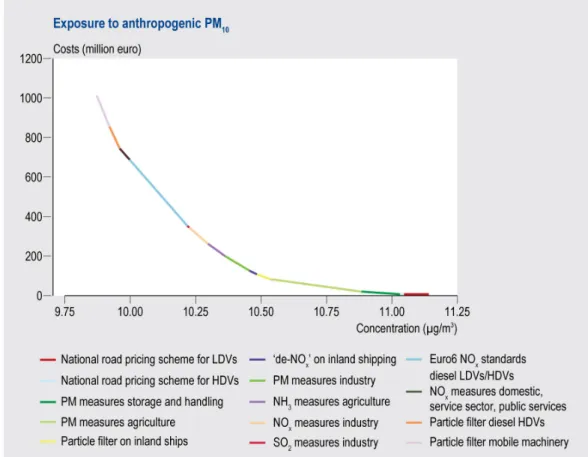
Cost-effectiveness of measures to reduce population exposure to anthropogenic PM10 The marginal cost curve for the change in population exposure to fine particulates (PM10) is presented in Figure 4. If the interest is in cost-optimizing exposure, a comparison of this figure with Figures 2 and 3 shows a ranking of measures similar to the ranking of abatement options in the case of cost-optimizing the number of exceedances of EU limit values. However, there is one exception. Cleaner heavy duty vehicles (particle filters, advanced ‘de-NOx technology) form a special case. Results indicate cleaner heavy duty vehicles to be cost-effective (compared to other measures) in the progress to achieving PM10 and NO2 limit values, but to be costly (compared to other measures) for improving the urban/rural background PM10 concentration, which in this study is assumed to be representative for the PM10 exposure of the general population.
For particle filters on heavy duty vehicles, the observed inconsistency in results is explained by the local increment in PM10 concentrations along motorways, which is explained by the emissions of local transport. This increment causes a particle filter to have a much larger impact on the concentration near motorways (within about 100 m from the road axis) than on the calculated general urban/rural exposure across the country (as calculated on a 5 to 5 km grid). Note the observed inconsistency in results is only valid if the calculated decline in PM10 exposure on a 5 x 5 km grid is representative for the real decline in exposure of the Dutch population. For particle filters on heavy duty vehicles, this is likely the case. This is because most people do not live along roads and motorways with heavy duty traffic, which makes the calculated 5 x 5 km exposure probably a good indicator. More detailed modelling at higher resolution is needed to get a more accurate estimate of population exposure to particles from heavy duty vehicles and to draw firmer conclusions on the cost-effectiveness of particle filters on trucks for reducing general population exposure. Such calculations should model the complete road network combined with high resolution distribution maps for population. For the implementation of advanced ‘de-NOx’ technology on heavy duty vehicles, reservations with regard to the used exposure indicator used are not made. NOx emissions from local transport do not lead to local increments in PM10 concentrations near road sites. This makes the calculated decline in PM10 exposure on a 5 x 5 km grid representative for the decline in population exposure.
Figure 4. Cost-effectiveness of abatement options in 2020 in terms of the reduction in exposure to fine particulates of anthropogenic origin (PM10). The population-weighted
concentration is used as indicator for population exposure. 4. CONCLUSIONS
Looking at the Netherlands, cost-optimal strategies for achieving progress towards air quality limit values will, in general, also deliver cost-optimal strategies for a reduction of PM10 exposure.
The introduction of road use pricing schemes is most cost-effective followed by abatement options directed at reducing primary PM10 emissions from shipping (installation of a particle filter), industry (implementation of advanced PM abatement techniques), storage and handling (various measures to prevent diffuse emissions) and agriculture (air scrubbers on large pig and poultry houses). The introduction of Selective Catalytic Reduction ‘de-NOx’ equipment on ships is also cost-effective. Other assessed abatement options are less cost-effective. These are measures to reduce the emissions of secondary precursors, i.e. measures to reduce NH3 emissions from agriculture, SO2/NOx emissions from industry and NOx emissions from small combustion sources.
Cleaner heavy duty vehicles (installation of particle filters and advanced ‘de-NOx’ technology) form a special case. Results indicate that cleaner heavy duty vehicles are cost-effective (compared to other measures) to bring down the concentration of PM10 and NO2 at traffic related hot-spots, but are relative costly (compared to other measures) for improving the exposure of the general population to PM10. Note that estimates for the effect of particle filters on population exposure are preliminary. Exposure modelling at a higher resolution than 5 x 5 km is needed to confirm calculated effects of particle filters for exposure.
This paper shows that cost-effective strategies for improving air quality should consider road use pricing schemes as well as technical measures geared to the reduction of primary aerosols originating from storage and handling, shipping, industry and agriculture. Such measures are cost-effective for bringing down the number of exceedances of the PM10 limit value as well as for reducing the exposure of the Dutch population to PM10.
5. REFERENCES
Amann, M., Cabala, R., Cofala, J., Heyes, C., Klimont, Z., Schöpp, W., Tarrason, L., Simpson, D., Wind, P., Jonson, J. (2004). The Current Legislation and the Maxiumu Technically Feasible Reduction cases for the CAFE baseline emission projections. IIASA, Vienna
Amann, M., Bertok, I., Cabala, R., Cofala, J., Heyes, C., Gyarfas, F., Klimont, Z., Schöpp, W., Wagner, F. (2005). Target setting approaches for cost-effective Reductions of Population Exposure to Fine Particulate Matter in Europe. CAFÉ Scenario Analyis Report N4. 4. IIASA, Vienna.
Beck J.B., Folkert R.J.M., Smeets W.L.M. (2004). Beoordeling van de Uitvoeringsnotitie Emissieplafonds verzuring en grootschalige luchtverontreiniging 2003. Report 500037003/2004, MNP Netherlands Environmental Assessment Agency, Bilthoven, The Netherlands
Besseling, P., Groot, W., Lebouille, R. (2005). Economische analyses van verschillende vormen van prijsbeleid voor het wegverkeer. ISBN 90-5833-222-5. CPB Netherlands Bureau for Economic Policy Analysis, The Hague
Daniëls, B.W., Farla, J.C.M. (2006). Potentieelverkenning klimaatdoelstellingen en energiebesparing tot 2020 Analyses met the optiedocument energie en emissies 2010/2020. Report ECN-C-05-106, ECN Energy Research Centre for the Netherlands, Petten, The Netherlands. Report MNP-773001039, MNP Netherlands Environmental Assessment Agency, Bilthoven, The Netherlands
http://www.ecn.nl/nl/ps/onderzoeksprogramma/nationaal-klimaatbeleid/optiedocument-20102020/
Jaarsveld van, J.A. (2004) .The Operational Priority Substances model. Report MNP-500045001, MNP Netherlands Environmental Assessment Agency, Bilthoven, The Netherlands
Jonkers S., Teeuwisse S. (2006). Handleiding CAR II, version 5.1. Report 2006-A-R0078/B version 2. TNO, Apeldoorn, The Netherlands
Smeets W., Blom W., Hoen A., Jimmink B., Koelemeijer R., Peters J., de Vries W. (2007). Effecten en kosten van nationale en Europese maatregelen voor een schone lucht. Report MNP-500091001/2007, MNP Netherlands Environmental Assessment Agency, Bilthoven, The Netherlands
Velders, G.J.M., Aben, J.M.M., Beck, J.P., Blom. W.F., Hoen, A., Jimmink, B.A., Matthijsen, J., de Ruiter, J.F., Smeets, W.L.M., van Velze, K., Visser, H., de Vries, W.J., Wieringa, K. (2006). Grootschalige concentratiekaarten voor luchtverontreiniging in Nederland – levering 2006. Report 500093002, MNP Netherlands Environmental Assessment Agency, Bilthoven, The Netherlands.
Velders, G.J.M., Aben, J.M.M., Beck, J.P., Blom., J.D. van Dam, H.E. Elzenga, G.P. Geilenkirchen, W.F., Hoen, A., Jimmink, B.A., Matthijsen, J., C.J. Peek, van Velze, K., Visser, H., de Vries, W.J. (2007). Concentratiekaarten voor grootschalige luchtverontreiniging in Nederland - Rapportage 2007. Report 500088001, MNP Netherlands Environmental Assessment Agency, Bilthoven, The Netherlands.
Watkiss, P.(2004). An evaluation of the Air Quality Strategy. Report ED50232 Issue 4, AEA Technology Environment, UK
Wesselink L.G., Buijsman E., Annema J.A. (2006). The impact of Euro5: facts and figures. Report 500043002, MNP Netherlands Environmental Assessment Agency, Bilthoven, The Netherlands