Greenhouse gas mitigation scenarios
for major emitting countries
Analysis of current climate policies and mitigation commitments:
2017 update
Takeshi Kuramochi, Hanna Fekete, Frederic Hans, Lisa Luna, Sofia Gonzales-Zuñiga,
Sebastian Sterl, Markus Hagemann, Niklas Höhne (NewClimate Institute)
Heleen van Soest, Michel den Elzen, Kendall Esmeijer, Mark Roelfsema (PBL Netherlands
Environmental Assessment Agency)
Greenhouse gas mitigation
scenarios for major emitting
countries
Analysis of current climate policies and mitigation
commitments: 2017 update
Project number 15032 © NewClimate Institute 2017 AuthorsTakeshi Kuramochi, Hanna Fekete, Frederic Hans, Lisa Luna, Sofia Gonzales-Zuñiga, Sebastian Sterl, Markus Hagemann, Niklas Höhne (NewClimate Institute)
Heleen van Soest, Michel den Elzen, Kendall Esmeijer, Mark Roelfsema (PBL Netherlands Environmental Assessment Agency)
Nicklas Forsell, Olga Turkovska (International Institute for Applied Systems Analysis) Contributors
Petr Havlik, Michael Obersteiner (International Institute for Applied Systems Analysis) This update report builds on Kuramochi et al. (2016). This report has been prepared by PBL/NewClimate Institute/IIASA under contract to DG CLIMA (EC service contract N° 340201/2015/717962/SERJCLIMA.A4) started in December 2015.
This project is funded by the EU:
Note (30 April, 2018)
A few typographical errors have been corrected since its original release on 1 November, 2017. Disclaimer
The views and assumptions expressed in this report represent the views of the authors and not necessarily those of the client.
Cover picture: Patrick Tomasso Download the report
Executive Summary
This report provides an overview of projected greenhouse gas (GHG) emissions in 25 emitting countries/regions (Argentina, Australia, Brazil, Canada, Chile, China, Colombia, Democratic Republic of the Congo (DRC), Ethiopia, the European Union, India, Indonesia, Japan, Kazakhstan, Mexico, Morocco, the Philippines, Republic of Korea, the Russian Federation, Republic of South Africa, Saudi Arabia, Thailand, Turkey, Ukraine, and the United States) up to 2030, based on current policies and the implementation of (intended) nationally determined contributions ((I)NDCs).
The main updates and methodological changes made in this report compared to our 2016 report (Kuramochi et al. 2016) include the following:
Policy developments since the last report (e.g. the changes in U.S. climate policy) have been taken into account in the emissions projections (cut-off date: 1 July 2017).
GHG emissions projections under current policies took into account reviews from in-country experts involved in the European CD-LINKS project (CD-LINKS 2017) to identify policies, not limited to those focused on energy and climate, expected to deliver significant impact.
Historical GHG emissions data was taken from latest inventories, many of which have been submitted to the UNFCCC in 2017.
GHG emissions projections under current policies were harmonised to the latest historical emissions data described above. The harmonisation year was changed to 2015 for Annex I countries and 2010 for non-Annex I countries, with exceptions of China (2012) and Brazil (2015) (previously 2010 for all 25 countries).
2020 pledges and NDCs were consistently quantified in terms of 100-year global warming potentials (GWP) from the Second Assessment Report (SAR) of the Intergovernmental Panel on Climate Change (IPCC).
The findings of the current study are:
The degree to which countries/regions are likely to achieve their INDCs/NDCs under current policies was found to vary (Figure ES-1):
o Countries likely or roughly on track to achieve or even overachieve their self-determined unconditional 2025/2030 targets with currently implemented policies: Brazil, China, Colombia (new), India, Japan (new), Mexico (new), the Russian Federation, Turkey and Ukraine. o Countries that require additional measures to achieve their 2030 targets are: Argentina,
Australia, Canada, Chile (new), DRC, Ethiopia, the EU, Indonesia, Kazakhstan, Morocco, Republic of Korea, Saudi Arabia, South Africa, Thailand, the Philippines and the United States.
o Colombia is now assessed to as achieving its INDC, because recent emissions, in particular from forestry, were lower than assumed in the business-as-usual (BAU) projections provided in Colombia's INDC.
o Mexico is now assessed to as achieving its NDC with currently implemented measures, mainly because of the historical emissions data update and an updated and lower baseline projections.
o Chile is now assessed to as requiring additional measures to achieve its 2030 targets, mainly because of the change in the baseline projections used for the assessment.
Currently implemented policies are projected to influence greenhouse gas emissions, but do not prevent emissions from increasing up to 2030 (above 2010 levels). This is the case, not only in
projected to remain stable, approximately at current levels, with currently implemented policies. In Japan and the EU, greenhouse gas emissions are projected to decrease further, under current policies.
Figure ES-1: Progress of countries to achieve their self-chosen 2030 targets under current policies. Note: current policies do not include implementation measures that are under development at the time of publication.
It should be noted that a country likely to meet its NDC/INDC not necessarily is undertaking more stringent action on mitigation than a country that is not on track due to mainly two reasons. First, the targets differ in their ambition levels across countries because they are nationally determined and heterogeneous by nature. Second, it has only been around two years since the countries formulated their NDCs/INDCs. It is not surprising to see a gap between the mitigation targets and current policy trajectories if countries pledged something above what they would have achieved anyway.
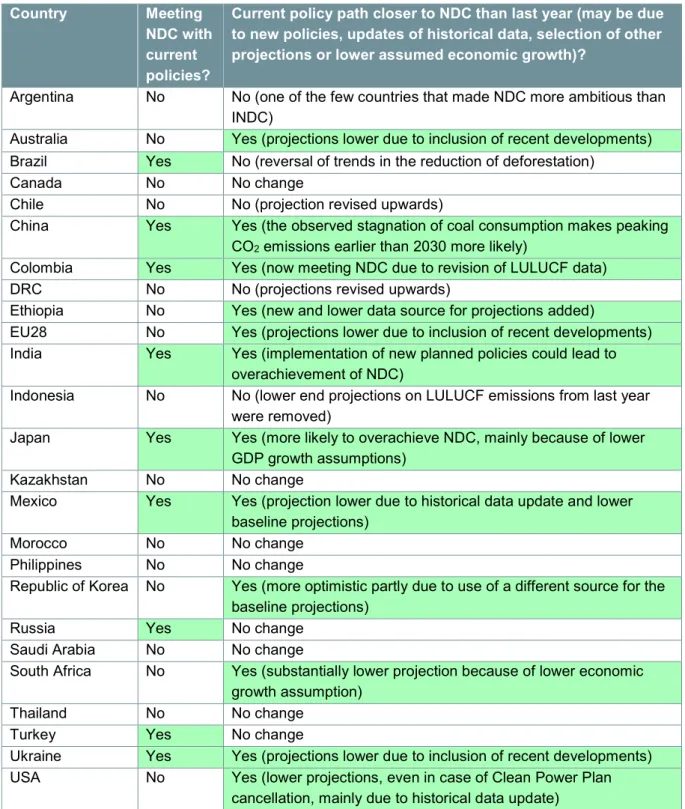
Nevertheless, as countries are adopting implementation measures, it is essential that the gaps between mitigation targets and current policy trajectories begin to close, in the years to come. Most of the countries analysed in this report show progress towards meeting their NDC; some through additional policies and new market developments, some through revision of the underlying data. A few countries risk reversal of the trends (Table ES-1). For this reason, it is essential that this report and similar efforts are updated in the coming years. We also believe that this study provides useful information for the 2018 facilitative dialogue.
Table ES-1: Progress of countries in meeting their NDCs Country Meeting
NDC with current policies?
Current policy path closer to NDC than last year (may be due to new policies, updates of historical data, selection of other projections or lower assumed economic growth)?
Argentina No No (one of the few countries that made NDC more ambitious than INDC)
Australia No Yes (projections lower due to inclusion of recent developments) Brazil Yes No (reversal of trends in the reduction of deforestation)
Canada No No change
Chile No No (projection revised upwards)
China Yes Yes (the observed stagnation of coal consumption makes peaking CO2 emissions earlier than 2030 more likely)
Colombia Yes Yes (now meeting NDC due to revision of LULUCF data)
DRC No No (projections revised upwards)
Ethiopia No Yes (new and lower data source for projections added)
EU28 No Yes (projections lower due to inclusion of recent developments) India Yes Yes (implementation of new planned policies could lead to
overachievement of NDC)
Indonesia No No (lower end projections on LULUCF emissions from last year were removed)
Japan Yes Yes (more likely to overachieve NDC, mainly because of lower GDP growth assumptions)
Kazakhstan No No change
Mexico Yes Yes (projection lower due to historical data update and lower baseline projections)
Morocco No No change
Philippines No No change
Republic of Korea No Yes (more optimistic partly due to use of a different source for the baseline projections)
Russia Yes No change
Saudi Arabia No No change
South Africa No Yes (substantially lower projection because of lower economic growth assumption)
Thailand No No change
Turkey Yes No change
Ukraine Yes Yes (projections lower due to inclusion of recent developments) USA No Yes (lower projections, even in case of Clean Power Plan
Uncertainty around future estimates remains high:
In the United States, the Trump administration officially communicated to the United Nations its intent to abandon the Paris Agreement and cease implementation of the NDC (The Representative of the United States of America to the United Nations 2017). At the same time, there are several sub-national and non-state initiatives emerging, including the “America’s Pledge” recently launched by California Governor Jerry Brown and Former Mayor of New York Michael Bloomberg to move forward with the “country’s commitments under the Paris Agreement — with or without Washington” (America's Pledge 2017). The potential mitigation impact of these actions was not quantified in this study.
Canada is currently expected to apply the net-net accounting rule for the LULUCF sector, but there is still some uncertainty on the treatment of the LULUCF sector and it is possible that a different accounting approach for the LULUCF sector will be applied.
In Japan, decisions on the future of nuclear power will strongly influence the development of emissions in the power sector.
In the Republic of Korea, it remains to be seen if the long-term phase-out of nuclear and coal-fired power announced by the new President would be supported by policies and laws. In Australia, the effect of policies replacing the carbon pricing mechanism is difficult to assess. China and India have pledges indexed to economic growth, implying that the absolute emission
target level is very uncertain.
Emissions projections for Turkey and other developing countries are subject to considerable uncertainty related to economic growth.
In Argentina, Colombia, DRC, Ethiopia, Indonesia and the Philippines, emissions from land use, land use change, and forestry (LULUCF), which are very uncertain, strongly determine total emissions projections. Our evaluation on Colombia’s progress has been revised from the 2016 report largely due to the downward revision of the GHG inventory data for the LULUCF sector.
Table of Contents
Acronyms ... vii Acknowledgements ... ix 1 Introduction ... 1 Background ... 1 Objectives ... 1 Summary of methods ... 2Limitations of this report ... 3
2 Main findings ... 4
3 Results per country ... 7
Argentina ... 10 Australia ... 13 Brazil ... 16 Canada ... 19 Chile ... 22 China ... 25 Colombia ... 29
Democratic Republic of the Congo (DRC) ... 32
Ethiopia ... 35 European Union ... 38 India ... 41 Indonesia ... 44 Japan ... 47 Kazakhstan ... 50 Mexico ... 53 Morocco ... 56 Philippines ... 59 Republic of Korea ... 62 Russian Federation ... 65 Saudi Arabia ... 68 South Africa ... 71 Thailand ... 74 Turkey ... 77 Ukraine ... 80
Table of Contents (continued)
Appendix ... I A1: Harmonisation of GHG emissions projections under current policies to the historical emissions data ... I A2: Quantification of 2020 pledges and (I)NDCs ... I A3: NewClimate Institute calculations (based on the Climate Action Tracker analysis) ... IV A4: The IMAGE model ... VI A5: The GLOBIOM and G4M models ... VIII
Acronyms
AFOLU agriculture, forestry and other land use BAU
CAFE
business-as-usual
Corporate Average Fuel Economy Standards CAT Climate Action Tracker
CH4 methane
CNG compressed natural gas CO2 carbon dioxide
CO2e carbon dioxide equivalent
COP21 UNFCCC Conference of the Parties 21st session (Paris)
CPP United States of America’s Clean Power Plan CSP
DESA
concentrated solar power
UN Department of Economic and Social Affairs EDGAR Emissions Database for Global Atmospheric Research EEA European Energy Agency
EPA United States Environmental Protection Agency ERF Emissions Reduction Fund
ETS emissions trading system
FAIR PBL’s Framework to Assess International Regimes for differentiation of commitments NF3 nitrogen trifluoride
F-gas fluorinated gas
G4M IIASA’s Global Forest Model GCF Green Climate Fund
GDP gross domestic product GHG greenhouse gas
GLOBIOM IIASA's Global Biosphere Management Model Gt gigatonne (billion tonnes)
GW gigawatt (billion watts)
GWh gigawatt-hour (billionwatts per hour) GWP
H2
Global Warming Potential hydrogen
Ha HWP
hectare
harvested wood products
HEPS High Energy Performance Standards HFC
ICCT
hydrofluorocarbon
International Council on Clean Transportation IEA International Energy Agency
IIASA International Institute for Applied Systems Analysis IMAGE PBL’s Integrated Model to Assess the Global Environment INDC intended nationally determined contribution
IPCC Intergovernmental Panel on Climate Change IPPU Industrial Processes and Product Use km/l kilometre per litre
ktoe thousand tonnes of oil equivalent kWh kilowatt-hour (thousand watts-hour) LPG liquefied petroleum gas
Acronyms (continued)
mpg miles per gallon
Mt megatonne (million tonnes) Mtoe million tonnes of oil equivalent MW megawatt (million watts) N2O nitrous oxide
N/A not available
NAMA Nationally Appropriate Mitigation Actions NC6 Sixth National Communication
NDC nationally determined contribution NOX nitrogen oxides
NRE New and Renewable Energies
OECD Organisation for Economic Co-operation and Development PBL PBL Netherlands Environmental Assessment Agency PES Payments for Ecosystem Services
PFC PIK pkm
perfluorocarbon
Potsdam institute for climate impact and research passenger-kilometre
PV photovoltaic
RE renewable energy
REC Renewable Energy Certificate
REDD+ Reducing Emissions from Deforestation and Forest Degradation and the role of conservation, sustainable management of forests and enhancement of forest carbon stocks in developing countries
REDD-PAC REDD+ Policy Assessment Centre RPS renewable portfolio standards SF6 sulphur hexafluoride
SSP2 Shared Socio-economic Pathways middle scenario t tonne (thousand kilograms)
tce tonne coal equivalent (29.288 GJ) TIMER
tkm
PBL’s Targets IMage Energy Regional Model tonne-kilometre
TPES total primary energy supply TWh terawatt-hour
SAR UN
IPCC’s Second Assessment Report United Nations
UNEP United Nations Environment Programme UNFCCC
WEO
United Nations Framework Convention on Climate Change IEA’s World Energy Outlook report
Acknowledgements
The project was financed by the European Commission, Directorate General Climate Action (DG CLIMA). The report and the calculations have benefited from comments by Tom van Ierland and Miles Perry (DG CLIMA). We also thank all colleagues involved, in particular Pieter Boot, Detlef van Vuuren, Mathijs Harmsen and Harmen Sytze de Boer (PBL), Eva Arnold, Boris Duval, Harry Fearnehough, Ritika Tewari, and Philippe Nguyen-Xuan (NewClimate Institute) with a special thanks to Marian Abels (PBL) for the graphic design work and Cindy Baxter for her editorial work.
This update builds on Kuramochi et al. (2016). The calculations by NewClimate Institute are largely based on its analyses for and informed by the Climate Action Tracker project jointly carried out with Ecofys and Climate Analytics.
This report has been prepared by PBL/NewClimate Institute/IIASA under contract to DG CLIMA (EC Service contract N° 340201/2015/717962/SERJCLIMA.A4) started in December 2015.
1 Introduction
Background
The 21st session of the Conference of the Parties (COP21) to the United Nations Framework Convention
on Climate Change (UNFCCC) held in 2015, adopted the Paris Agreement as the new international climate policy agreement for the post-2020 period (UNFCCC 2015a). In the lead-up to COP21, governments were asked to put forward offers on how - and by how much - they were willing to reduce their greenhouse gas (GHG) emissions after 2020; these are so-called “intended nationally determined contributions” (INDCs). Nearly 200 countries submitted their INDCs before the COP21 (UNFCCC 2015c). As of 8 September 2017, 160 Parties covering more than 65% (JRC/PBL 2014, WRI 2017) of global GHG emissions have ratified the Paris Agreement, and with each ratification their INDCs became “nationally determined contributions” (NDCs).
Objectives
This report prepared by NewClimate Institute, IIASA and PBL presents an up-to-date assessment of progress by 25 countries on the achievement of the mitigation part of the 2030 targets (NDCs and INDCs) presented in the context of the Paris Agreement as well as on their 2020 pledges in the UNFCCC Cancún Agreements. More specifically, the report provides an overview of projected GHG emissions up to 2030, taking into account the emissions trajectories under existing and in some cases planned climate and energy policies, as well as under the full implementation of NDCs and INDCs.
The 25 countries assessed in this report are: Argentina, Australia, Brazil, Canada, Chile, China, Colombia, Democratic Republic of the Congo (DRC), Ethiopia, the European Union (EU), India, Indonesia, Japan, Kazakhstan, Mexico, Morocco, the Philippines, Republic of Korea, the Russian Federation, South Africa, Saudi Arabia, Thailand, Turkey, Ukraine, and the United States. These 25 countries cover all of G20 countries (excluding the four individual EU member states) and comprised 79% of total global GHG emissions in 2012 (JRC/PBL 2014).1
Hereafter we will use the term NDC throughout the report, given the many countries with NDCs. From our 25 countries, Colombia, Democratic Republic of the Congo, Russia and Turkey have not ratified the Paris Agreement, and for those we still refer to INDCs.
In this report, emissions projections under the current policies scenario assume that no additional mitigation action is taken beyond currently implemented climate policies, even if it results in 2020 pledges and 2030 targets not being achieved or being overachieved. Whenever possible, current policy trajectories reflect all adopted and implemented policies, which are defined here as legislative decisions, executive orders, or their equivalent. This excludes publicly announced plans or strategies, while policy instruments to implement such plans or strategies would qualify. Ultimately, however, these definitions could be interpreted differently, and therefore this assessment is bound by the interpretations that our research group uses. This definition of current policies scenario is consistent with that applied in the UNEP Emissions Gap Report (UNEP, 2015).
1 The emissions data from the EDGAR database excludes short-cycle biomass burning (e.g. agricultural waste
Summary of methods
NewClimate Institute, IIASA and PBL have estimated the impact of the most effective current policies on future GHG emissions. The main updates and methodological changes made in this report from our 2016 report (Kuramochi et al. 2016) include the following:
Policy developments since the last report (e.g. the changes in U.S. climate policy) have been taken into account in the emissions projections (cut-off date: 1 July 2017).
GHG emissions projections under current policies took into account reviews from in-country experts involved in the European CD-LINKS project (CD-LINKS 2017) to identify policies, not limited to those focused on energy and climate, that are expected to deliver significant impact on GHG emissions.
Historical GHG emissions data was taken from latest inventories, many of which have been submitted to the UNFCCC in 2017.
GHG emissions projections under current policies were harmonised to the latest historical emissions data described above. The harmonisation year was changed to 2015 for Annex I countries and 2010 for non-Annex I countries, with exceptions of China (2012) and Brazil (2015) (previously 2010 for all 25 countries).
2020 pledges and NDCs were consistently quantified in terms of 100-year global warming potentials (GWP) from the Second Assessment Report (SAR) of the Intergovernmental Panel on Climate Change (IPCC).
With regard to the fourth point, the harmonisation step is applied to reconcile the common historical emissions data used for this report (i.e. from latest national GHG inventories) and the estimates of historical emissions used in the tools that generate this report’s emissions projections. The use of a more recent inventory data year for harmonisation allows for better accounting of the GHG emissions trends in recent years.
The calculations by NewClimate Institute are largely based on its analyses for, and informed by, the Climate Action Tracker project jointly carried out with Ecofys and Climate Analytics (CAT 2017), and used existing scenarios from national and international studies (e.g. IEA's World Energy Outlook 2016) as well as their own calculations of the impact of individual policies in different subsectors.
PBL has updated their calculations of the impact of individual policies in different subsectors using the IMAGE integrated assessment modelling framework (Stehfest et al. 2014), including a global climate policy model (FAIR), a detailed energy-system model (TIMER), and a land-use model (IMAGE land) (www.pbl.nl/ndc). The starting point for the calculations of the impact of climate policies is the latest SSP2 (no climate policy) baseline as implemented in the IMAGE model (van Vuuren et al. 2017). Current climate and energy policies in G20 countries, as identified in the CD-LINKS project (NewClimate Institute 2016, CD-LINKS 2017), were added to that baseline. For countries that are part of a larger IMAGE region (Australia, Kazakhstan, Republic of Korea, and Ukraine), emission projections were downscaled using the country’s share in the region’s 2010 emissions as a constant scaling factor.
Both NewClimate and PBL scenario calculations were supplemented with those on land-use and agricultural policies using IIASA's global land-use model GLOBIOM (www.iiasa.ac.at/GLOBIOM) and global forest model G4M (www.iiasa.ac.at/G4M). For PBL, IIASA’s LULUCF CO2 projections were
added to the IMAGE GHG emission projections excluding LULUCF CO2. Although only emissions
projections excluding LULUCF CO2 were used, the IMAGE framework was applied fully, including the
Limitations of this report
It should be noted that a country being likely to meet its NDC does not necessarily mean that it undertakes more stringent action on mitigation than a country that is not on track for a number of reasons. First, the targets differ in their ambition levels across countries because they are nationally determined and heterogeneous by nature. Second, it has only been around two years since the countries formulated their NDCs. It is not surprising to see a gap between the mitigation targets and current policy trajectories if countries pledged something above what they would have achieved anyway. Third, countries have different policy-making approaches. Some countries use their pledges or targets as a device to drive more ambitious policies, while others use them merely to formalise the expected effect of existing measures.
Nevertheless, gaps between the mitigation targets and current policy trajectories may close in the years to come as countries adopt implementation measures. For this reason, it is essential that this report, and similar efforts, is updated in the years to come.
There are a number of methodological limitations related to the current assessment, which are largely attributable to the differences in the nature and characteristics of NDCs and climate policies across countries.
First, this report considers a wide range of effective national climate and energy policies, but does not provide a complete assessment of all policies. This has the risk of underestimating or overestimating the total impact of a country’s policies on GHG emissions.
Second, existing policies may change and/or be abandoned for a variety of reasons, and new policies may be implemented. This implies that all numbers are subject to change; this study provides the current state of play.
Third, countries are implementing policies in various areas to a varying degree. Many countries have set renewable energy targets, which are to be achieved by national support policies. For some countries, in particular the non-OECD countries, there is not enough information about the implementation status. For some countries, we have assumed a full implementation of those targets without sufficient evidence of concrete support policies, in some cases by considering other factors (e.g. historical trends and projections from other studies), but this has the risk of overestimating the reductions.
Fourth, for bottom-up calculations performed by NewClimate Institute using external emissions scenarios from various sources, it is not always fully clear how the impacts of existing policy measures were quantified.
The main findings of this study are presented in the next Chapter and in fact sheets below, followed by an Appendix with a brief description of the datasets used in this study as well as an overview table of GHG emissions under NDCs and current policies. Detailed descriptions of the quantification of future GHG emissions under NDCs and current policies are provided as supporting information document for each country on the NewClimate Institute website.2
2
2 Main findings
The findings of the current study are:
The degree to which countries/regions are likely to achieve their INDCs/NDCs under current policies was found to vary (Figure ES-1):
o Countries likely or roughly on track to achieve or even overachieve their self-determined unconditional 2025/2030 targets with currently implemented policies: Brazil, China, Colombia (new), India, Japan (new), Mexico (new), the Russian Federation, Turkey and Ukraine. o Countries that require additional measures to achieve their 2030 targets are: Argentina,
Australia, Canada, Chile (new), DRC, Ethiopia, the EU, Indonesia, Kazakhstan, Morocco, Republic of Korea, Saudi Arabia, South Africa, Thailand, the Philippines and the United States.
o Colombia is now assessed to as achieving its INDC, because recent emissions, in particular from forestry, were lower than assumed in the business-as-usual (BAU) projections provided in Colombia's INDC.
o Mexico is now assessed to as achieving its NDC with currently implemented measures, mainly because of the historical emissions data update and an updated and lower baseline projections.
o Chile is now assessed to as requiring additional measures to achieve its 2030 targets, mainly because of the change in the baseline projections used for the assessment.
Currently implemented policies are projected to influence greenhouse gas emissions, but do not prevent emissions from increasing up to 2030 (above 2010 levels). This is the case, not only in developing countries (Argentina, China, DRC, Ethiopia, India, Indonesia, Kazakhstan, Morocco, the Philippines, Saudi Arabia, South Africa, and Thailand) but also in OECD countries (Australia, Chile, Mexico, Republic of Korea, and Turkey) up to 2030, compared to 2010 levels. Greenhouse gas emissions in Brazil, Canada, Colombia, the Russian Federation, and the Ukraine are projected to remain stable, approximately at current levels, with currently implemented policies. In Japan and the EU, greenhouse gas emissions are projected to decrease further, under current policies.
It should be noted that a country likely to meet its NDC/INDC not necessarily is undertaking more stringent action on mitigation than a country that is not on track due to mainly two reasons. First, the targets differ in their ambition levels across countries because they are nationally determined and heterogeneous by nature. Second, it has only been around two years since the countries formulated their NDCs/INDCs. It is not surprising to see a gap between the mitigation targets and current policy trajectories if countries pledged something above what they would have achieved anyway.
Nevertheless, as countries are adopting implementation measures, it is essential that the gaps between mitigation targets and current policy trajectories begin to close, in the years to come. Most of the countries analysed in this report show progress towards meeting their NDC; some through additional policies and new market developments, some through revision of the underlying data. A few countries risk reversal of the trends (Table 1). For this reason, it is essential that this report and similar efforts are updated in the coming years. We also believe that this study provides useful information for the 2018 facilitative dialogue.
Table 1: Progress of countries in meeting their NDCs Country Meeting
NDC with current policies?
Current policy path closer to NDC than last year (may be due to new policies, updates of historical data, selection of other projections or lower assumed economic growth)?
Argentina No No (one of the few countries that made NDC more ambitious than INDC)
Australia No Yes (projections lower due to inclusion of recent developments) Brazil Yes No (reversal of trends in the reduction of deforestation)
Canada No No change
Chile No No (projection revised upwards)
China Yes Yes (the observed stagnation of coal consumption makes peaking CO2 emissions earlier than 2030 more likely)
Colombia Yes Yes (now meeting NDC due to revision of LULUCF data)
DRC No No (projections revised upwards)
Ethiopia No Yes (new and lower data source for projections added)
EU28 No Yes (projections lower due to inclusion of recent developments) India Yes Yes (implementation of new planned policies could lead to
overachievement of NDC)
Indonesia No No (lower end projections on LULUCF emissions from last year were removed)
Japan Yes Yes (more likely to overachieve NDC, mainly because of lower GDP growth assumptions)
Kazakhstan No No change
Mexico Yes Yes (projection lower due to historical data update and lower baseline projections)
Morocco No No change
Philippines No No change
Republic of Korea No Yes (more optimistic partly due to use of a different source for the baseline projections)
Russia Yes No change
Saudi Arabia No No change
South Africa No Yes (substantially lower projection because of lower economic growth assumption)
Thailand No No change
Turkey Yes No change
Ukraine Yes Yes (projections lower due to inclusion of recent developments) USA No Yes (lower projections, even in case of Clean Power Plan
cancellation, mainly due to historical data update)
Uncertainty around future estimates remains high:
In the United States, the Trump administration officially communicated to the United Nations its intent to abandon the Paris Agreement and cease implementation of the NDC (The Representative of the United States of America to the United Nations 2017). At the same time, there are several sub-national and non-state initiatives emerging, including the “America’s Pledge” recently launched by California Governor Jerry Brown and Former Mayor of New York Michael Bloomberg to move forward with the “country’s commitments under the Paris
Agreement — with or without Washington” (America's Pledge 2017). The potential mitigation impact of these actions was not quantified in this study.
Canada is currently expected to apply the net-net accounting rule for the LULUCF sector, but there is still some uncertainty on the treatment of the LULUCF sector and it is possible that a different accounting approach for the LULUCF sector will be applied.
In Japan, decisions on the future of nuclear power will strongly influence the development of emissions in the power sector.
In the Republic of Korea, it remains to be seen if the long-term phase-out of nuclear and coal-fired power announced by the new President would be supported by policies and laws. In Australia, the effect of policies replacing the carbon pricing mechanism is difficult to assess. China and India have pledges indexed to economic growth, implying that the absolute emission
target level is very uncertain.
Emissions projections for Turkey and other developing countries are subject to considerable uncertainty related to economic growth.
In Argentina, Colombia, DRC, Ethiopia, Indonesia and the Philippines, emissions from land use, land use change, and forestry (LULUCF), which are very uncertain, strongly determine total emissions projections. Our evaluation on Colombia’s progress has been revised from the 2016 report largely due to the downward revision of the GHG inventory data for the LULUCF sector.
3 Results per country
This section summarises the results per country for current policies, 2020 pledges, and 2030 targets (NDCs). For each country section, the following are presented:
Description of 2020 pledge and NDC;
Overview of key climate change mitigation policies;
Impact of climate policies on greenhouse gas emissions (absolute, relative to 2010 levels, and per capita).
Regarding LULUCF emissions, the GHG emissions under current policies are presented including or excluding LULUCF, depending on the sector coverage of the NDCs. The term “land use” used in the figures refers to LULUCF emissions and removals.
For the calculation of per capita emissions, population projections (median variant) were taken from the UN population statistics (UN DESA 2015). Historical GHG emissions data sources are described below. The Appendix provides explanations on the harmonisation of GHG emissions projections to the historical data (A1), 2020 pledge and NDC quantification (A2), general description of calculation methods used by NewClimate Institute, PBL and IIASA to quantify emissions projections under current policies (A3 – A5). Country-specific details on emissions projections under current policies are described in the Supporting Information.
Historical GHG Emissions data sources
For Annex I countries (Australia, Canada, the European Union, Japan, Kazakhstan, the Russian Federation, Turkey, the United States of America and Ukraine), the GHG emissions data submitted via the Common Reporting Format 2017 (2016 inventory for the USA and Canada) to the UNFCCC (2017b) was used after converting global warming potential (GWP) values from those in the IPCC Fourth Assessment Report (AR4) to those in the IPCC Second Assessment Report (SAR). The GWP conversion was conducted by the Potsdam Institute for Climate Impact Research (PIK) for the Climate Action Tracker project.
For historical emissions in non-Annex I Parties, Table 2 presents an overview of data sources. For many countries the data was taken from the UNFCCC GHG database (UNFCCC 2017a), in which the GHG inventory data reported in most recent Biennial Update Reports (BURs) submitted to the UNFCCC (2017c) are compiled. For some countries the emissions data were directly taken from BURs, used as it is or after conversion from AR4 GWPs to SAR GWPs. When national data were not available, EDGAR database (JRC/PBL 2014) were used for non-energy-related CO2 emissions and anthropogenic
non-CO2 GHG emissions and FAO (2014) were used for LULUCF emissions. For Brazil, the emissions
inventory from Sistema de Estimativa de Emissões de Gases de Efeito Estufa (SEEG 2017) was used. With regard to the magnitude of uncertainty related to the choice of GWPs, global total GHG emissions for 2014 are reported to be 3% higher when AR4 GWPs are used compared to when SAR GWPs are used (Gütschow et al. 2017). At a country level, the dataset provided by PIK to the Climate Action Tracker project shows that for the inventory submitted in 2017 by Annex I countries, the emission values become smaller by 1-5% excluding LULUCF and 1-7% including LULUCF when they are covered from AR4 GWPs to SAR GWPs (data years: 1990-2015).
In the following country fact sheets, we report in the first table of each country the latest GHG inventory submitted to the UNFCCC and its latest reported year when it differs from the dataset presented in Table 2.
Table 2: Data sources for historical GHG emissions in non-Annex I countries (UNFCCC 2017c, UNFCCC 2017d, UNFCCC 2017e) .
Country GHG emissions excluding LULUCF LULUCF emissions
Source Last reported year Source Last reported year
Argentina BUR1 2010 BUR1 2010
Brazil SEEG (2017) 2015 SEEG (2017) 2015
Chile BUR 2013 BUR 2013
China BUR1, UNFCCC
database
2012 BUR1, UNFCCC database 2012
Colombia BUR1 2012 BUR1 2012
D.R. Congo
EDGAR 2010 UNFCCC database 2010
Ethiopia UNFCCC database 2013 UNFCCC database 2013
India UNFCCC database 2010 UNFCCC database 2010
Indonesia BUR1, UNFCCC database
2012 BUR1, UNFCCC database 2012 Republic
of Korea
UNFCCC database 2012 UNFCCC database 2012
Mexico UNFCCC database 2012 UNFCCC database 2012
Morocco UNFCCC database 2012 UNFCCC database 2012
Saudi Arabia
UNFCCC database 2010 UNFCCC database 2010
South Africa
UNFCCC database, BUR1
2010 UNFCCC database, BUR1 2010 The
Philippines
EDGAR 2010 FAO 2015
Thailand UNFCCC database, BUR1
Table 3: Sources for the official estimates of the emissions in 2020 and 2030 under pledge and NDC case and current policy trajectory cases for the 25 countries.
Country 2020 pledge case NDC case Current policy trajectory
Argentina No pledgea NDC (Government of
Argentina 2016) Ministry of the Environment and Sustainable Development Argentina (Government of Argentina 2016)
Australia Australian Government (2016) N/A Australian Government (2016)
Brazil Government of Brazil (2010) (Federative Republic of Brazil 2015)
N/A
Canada Government of Canada (2016) NDC Government of Canada
(2016) China The People’s Republic of China
(2012)
N/A N/A
Chile No pledgea N/A N/A
Colombia No pledgea NDC N/A
D.R. Congo No pledgea NDC N/A
Ethiopia No pledgea NDC N/A
EU28 EEA (2016) N/A EEA (2016)
India Planning Commission
Government of India (2011, 2014)
N/A N/A
Indonesia BAPPENAS (2015) (BAPPENAS 2015) N/A
Japan Government of Japan (2016) (UNFCCC 2015b) N/A
Kazakhstan N/A N/A (Ministry of Energy of the
Republic of Kazakhstan 2016)
Mexico NCCS (2013) N/A (Government of Mexico
2012, NCCS 2013)
Morocco No pledge a) NDC N/A
The
Philippines
No pledge a) NDC N/A
Republic of Korea
Republic of Korea (2016) (Republic of Korea 2015)
N/A Russian
Federation
Government of Russia (2014) N/A Government of Russia (2015)
Saudi Arabia No pledge a) N/A N/A
South Africa Department of Environmental Affairs Republic of South Africa (2011a; 2011b)
NDC N/A
Thailand N/A N/A N/A
Turkey No pledge a) (Republic of Turkey,
2016)
Republic of Turkey Ministry of Environment and Urbanization (2016)
Ukraine N/A N/A (Government of Ukraine
2013) USA U.S. Department of State (2016) U.S. Department of
State (2016)
U.S. Department of State (2016)
a)Argentina, Saudi Arabia and Turkey have not proposed GHG reduction pledges, and here we assume current
Argentina
Argentina pledged to limit its GHG emissions to 483 MtCO2e/year in 2030 unconditionally and to 369
MtCO2e/year in 2030 conditionally to various elements (both numbers incl. LULUCF) (see Table 1). With
these targets, Argentina revised its earlier INDC of a reduction of 15% below BAU, moving to absolute emission levels rather than a relative target and decreasing the resulting level of emissions in 2030. Argentina has not proposed a GHG reduction pledge for 2020.
The emissions projections for Argentina under current policies consider its biofuels law and renewable energy law. As a result, GHG emissions in 2030 including LULUCF are projected to be about 610 MtCO2e or 36% above 2010 levels. Argentina is, therefore, not yet on track to meet its unconditional
NDC.
Table 4: Description of Argentina’s NDC
Indicator NDC (updated NDC submitted on 17 November 2016)
Target: unconditional Limit GHG emissions to 483 MtCO2e in 2030
Target: conditional Limit GHG emissions to 369 MtCO2e in 2030,
subject to international financing, support for transfer, innovation and technology development, and capacity building
Sectoral coverage Energy, agriculture, waste, industrial processes, LULUCF
General Accounting method IPCC 2006 guidelines; 100-year GWPs from the 2nd Assessment Report
GHGs covered CO2, CH4, N2O, HFCs, PFCs and SF6
Consideration of LULUCF Land use sector is included in the target
Accounting approaches and methodologies are not specified
Other sector-level targets N/A
Use of bilateral, regional and international credits
N/A
Availability of reference scenarios in the latest UNFCCC submissions
Yes, NDC also includes a BAU scenario Last available year for GHG inventory
reporting
2012 (Government of Argentina 2015).
Table 5: Overview of key climate change mitigation policies in Argentina. Source: (Ministry of the Environment and Sustainable Development 2015)
Sector Policies (marked with “(+)” when mentioned in the NDC document)
Description
Economy-wide
National Program for Rational and Efficient Use of Energy
(PRONUREE) (2007)
10-12% of energy savings by 2016 in residential, public/private services Decrease electricity consumption by
6% compared to baseline scenario and energy savings of 1500 MW by 2016 Energy
supply
Renewable Energy Programme in Rural Markets (2000)
Reduce GHG emissions by replacing small-diesel electricity generation with renewable energy systems
Renewable Energy Law 27191. National Development Scheme for the Use of Renewable Energy Sources (RenovAr) (2016)
Total individual electric consumption to be substituted with renewable sources given the following schedule: 8% by 2017, 18% by 2023 and 20% by 2025
1)
PROBIOMASA: promotion of biomass energy (2013)
Additional biomass capacity: each 200 MW electric and thermal by 2018, each 1325 MW electric and thermal by 20301)
Energy Efficiency Project (2009) USD 99.44 million to reduce 10.7 MtCO2e by the end of 2016 are the
global benefits of the Energy Efficiency Project
Transport Biofuels Law (updated 2016) 12% requirement of biodiesel or ethanol blend in the gasoline from 2016 1)
Industry N/A N/A
Buildings Program for Rational and Efficient use of Energy in Public Buildings (2007)
Various measures in line with the 10% energy savings by 2016
F-gases N/A N/A
Forestry & Agriculture
Minimum Budgets for Environmental Protection of Native Forest
(Presupuestos Minimos de Proteccion) (2007) (+)
Regulatory frame to control the reduction of native forest surface and achieve lasting surface over time 1)
National Forest Management Plan with Integrated Livestock (Plan Nacional de Manejo de Bosques con Ganadería Integrada) (2015)
To improve and maintain ecological and cultural processes in native forest and promote activities for a
sustainable management of native forest 2)
Contributes to sustainable use of native forests through incorporating livestock activities in native forest area in a sustainable manner 2)
1) No information available on implementation status. For the current analysis, we have assumed full
implementation.
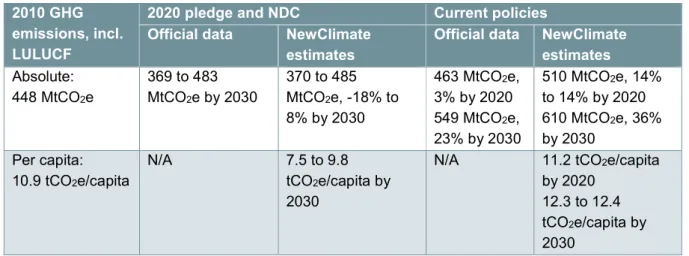
Table 6: Impact of climate policies on greenhouse gas emissions (including LULUCF) in Argentina. Absolute emission levels and emission levels relative to 2010 levels are presented. References for official emission data are provided in Table 3.
2010 GHG emissions, incl. LULUCF
2020 pledge and NDC Current policies Official data NewClimate
estimates
Official data NewClimate estimates Absolute: 448 MtCO2e 369 to 483 MtCO2e by 2030 370 to 485 MtCO2e, -18% to 8% by 2030 463 MtCO2e, 3% by 2020 549 MtCO2e, 23% by 2030 510 MtCO2e, 14% to 14% by 2020 610 MtCO2e, 36% by 2030 Per capita: 10.9 tCO2e/capita N/A 7.5 to 9.8 tCO2e/capita by 2030
N/A 11.2 tCO2e/capita
by 2020 12.3 to 12.4 tCO2e/capita by
2030
Figure 1: Impact of climate policies on greenhouse gas emissions in Argentina (including land use, i.e. LULUCF). Source: NewClimate Institute calculations excluding LULUCF based on its analysis for Climate Action Tracker (CAT 2017) and IIASA calculations on LULUCF emissions and removals.
Australia
The Australian government states that it is “on track” to meet its target of 5% below 2000 levels by 2020 (Australian Government 2015a), and that the Emissions Reduction Fund (ERF) plays a major role in lowering the abatement task. However, our current policies scenario that include the abatements of the ERF projects emissions above the pledge level (2 to 4% below 2010 levels by 2020). This contrasting conclusion drawn from our assessment is partly due to the accounting approach for the emissions reductions purchased through ERF. The Australian Government (2015a) counts all emissions reductions purchased in 2015 (92 MtCO2e) in the 2015/16 emissions reporting, although they occur over
many years. In our analysis, we distributed the expected emissions reductions over the average contract period of 9 years. The Australian government further considers that it will meet its unconditional 2020 target using surplus (‘carryover’) of the first commitment period of the Kyoto Protocol (Australian Government 2015b, Australian Government 2016, Loynes 2016).
Australia has stated that it will also meet the 2030 targets (26 to 28% GHG reduction by 2030 from 2005 level) through policies that provide positive incentives to reduce emissions (Australian Government 2016). At the core of Australia’s climate change policies is the Emissions Reduction Fund and linked safeguard mechanisms. Our current policies scenario (9 below to 5% above 2010 levels in 2030) shows a significant difference with the NDC trajectory in 2030 (21 to 23% below 2010 levels).
Table 7: Description of Australia’s 2020 pledge and NDC
Indicator 2020 pledge NDC (submitted 9
November 2016)
Target: unconditional 5% GHG reduction by 2020 from 2000 level
Kyoto target: 108% of 1990 levels 2013-2020
26 to 28% GHG reduction by 2030 from 2005 level
Target: conditional 15% and 25% GHG reduction by 2020 from 2000 level
Not specified
Sectoral coverage All GHG emissions, including emissions from afforestation, reforestation and deforestation
Economy wide
General Accounting method
IPCC guidelines; 100-year GWPs from the Fourth Assessment Report
IPCC guidelines; 100-year GWPs from the Fourth Assessment Report GHGs covered CO2, CH4, N2O, HFCs, PFCs,
SF6 and NF3
CO2, CH4, N2O, HFCs,
PFCs, SF6 and NF3
Consideration of LULUCF Land use sector is included Accounting approach is
specified as Kyoto Protocol accounting rules (Article 3.7) 1)
Land use credits: 27 MtCO2e by
2020 (den Elzen et al. 2015)
Land use sector is included in the target Net-net approach will be
used for emission accounting
Use of bilateral, regional and international credits
N/A N/A
Availability of reference scenarios in the latest UNFCCC submissions
Yes Yes
Table 8: Overview of key climate change mitigation policies in Australia (Australian Government 2015a). See Supporting Information for details.
Sector Policies (marked with “(+)” when mentioned in the NDC document) Description Economy-wide Emissions Reduction Fund (ERF) (2014) (+)
Auctions are set up to purchase emissions reductions at the lowest available cost, thereby contracting successful bidders1)
Energy supply Renewable Energy Target (RET) (2010) (+)
23.5% of electricity should come from renewable sources by 2020, compared to 13% in 2014. The new target2) for large-scale generation of 33,000 GWh in
2020 would double the amount of large-scale renewable energy being delivered by the scheme compared to current levels
Transport Fuel tax (2015) Fuel tax for diesel and gasoline is set at AUD 0.3814 per litre3)
Forestry & Agriculture, Waste
The Carbon Farming Initiative 4) (2014)
(Now integrated into ERF)
Encourages sustainable farming and thereby
increase carbon storage or reducing GHG emissions from land use. Expected 4.2 MtCO2e reduction of net
LULUCF emissions and 1.9 MtCO2e reduction of net
agriculture emissions by 2020, relative to 2010. 20 Million Trees
Programme (2014)
Plant 20 million trees by 2020 (20,000 ha) to re-establish green corridors and urban forests. The Carbon Farming
Futures (2011) (Now integrated into ERF) (+)
Ensures that advances in land management
technologies and techniques for emissions reduction and adaptation will lead to enhanced productivity and sustainable land use under a changing climate.5)
Other HFC emissions
reduction under the Montreal Protocol (2016)
Reduce HFC emissions by 55% by 2030, relative to 2010 (85% by 2036)
1) Not quantified in PBL IMAGE framework
2) The target was reduced in 2015 from its original 41,000 GWh (Scott 2015)
3) OECD (2013). Policy instrument not quantified separately by NewClimate Institute and PBL. 4) Australian Government (2015c)
Table 9: Impact of climate policies on greenhouse gas emissions (including LULUCF) in Australia. Absolute emission levels and emission levels relative to 2010 levels are presented. Note that the official values for 2020 and 2030 are based on GWP values from the IPCC 4th Assessment Report. References
for official emission data are provided in Table 3.
Figure 2: Impact of climate policies on greenhouse gas emissions in Australia (left panel: all gases and sectors, middle panel: excluding land use (i.e. LULUCF) and right panel: only land use). Source: PBL calculations and NewClimate Institute calculations based on Climate Action Tracker (CAT 2017) excluding LULUCF, and IIASA calculations on LULUCF emissions and removals. The LULUCF projections excludes removals from non-anthropogenic natural disturbances in line with Australia’s 2017 GHG Inventory Submission to the UNFCCC (Government of Australia 2017).
2010 GHG emissions, incl. LULUCF
2020 pledge and NDC Current policies Official data PBL and
NewClimate estimates
Official data PBL and NewClimate estimates Absolute: 544 MtCO2e 530 MtCO2e by 2020 400 to 505 MtCO2e, -27% to -7% by 2020 415 to 430 MtCO2e, -23% to -21% by 2030 577 to 656 Mt CO2e by 2020 724 MtCO2e by 2030 520 to 535 MtCO2e, -4% to -2% by 2020 495 to 570 MtCO2e, -9% to 5% by 2030 Per capita: 24.6 tCO2e/capita N/A 15.7 to 19.9 tCO2e/capita by 2020 14.8 to 15.2 tCO2e/capita by 2030 N/A 20.5 to 21 tCO2e/capita by 2020 17.4 to 20.2 tCO2e/capita by 2030
Brazil
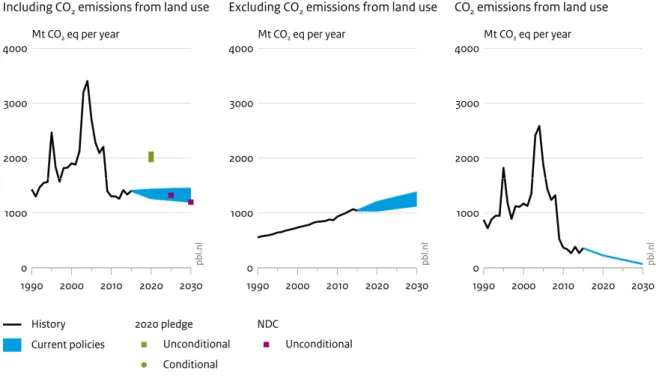
The main GHG mitigation policies in Brazil include the policies in the LULUCF sector, i.e. the enforcement of the Brazilian Forest Code and efforts to reduce deforestation in the Amazon and Cerrado regions. Even though the annual deforestation rate in the Legal Amazon has risen during the last two years (PRODES 2016), it is expected that successful implementation and enforcement of the proposed measures can lead to long-term reduction of net GHG emissions. Other updates with respect to Kuramochi et al. (2016) include biofuel policy updates and power capacity targets only including capacity that is currently under construction. If all implemented policies are successful, emissions (including those from LULUCF) may reach about 8% below to 11% above 2010 levels by 2030. Our analysis shows that Brazil is likely on track to meet its NDC with currently implemented policies. In its NDC Brazil announced a 45% share of renewables in the energy mix by 2030, and a 75% share of renewables in its electricity supply by 2030, but we don’t include these planned policies in our analysis.
Table 10: Description of Brazil’s 2020 pledge and NDC
Indicator 2020 pledge NDC (21 September 2016)
Target: unconditional Between 36.1 and 38.9% reduction by 2020 from a baseline scenario
37% GHG reduction by 2025 from 2005 level and indicative contribution of 43% GHG reduction by 2030 from 2005 level (equivalent to 4% to 8% below 2010 levels by 2030)
Target: conditional N/A N/A
Sectoral coverage Economy wide Economy wide General Accounting
method
100-year GWPs from the IPCC Second Assessment Report
IPCC guidelines; 100-year GWPs from the Fifth Assessment Report
GHGs covered CO2, CH4, N2O, HFCs,
PFCs, and SF6
CO2, CH4, N2O, HFCs, PFCs, and SF6
Consideration of LULUCF
Land use sector is included in the target Accounting
approaches and methodologies are not specified
Land use sector is included in the target Accounting approaches and
methodologies are not specified
Use of bilateral, regional and
international credits
N/A Possible use of market mechanisms that may be established under the Paris Agreement
Other sector-level targets
N/A 45% share of renewables in total energy mix by 2030
Availability of
reference scenarios in the latest UNFCCC submissions
No No
Last available year for GHG inventory
reporting
2012 (national inventory) 2015 (2017)
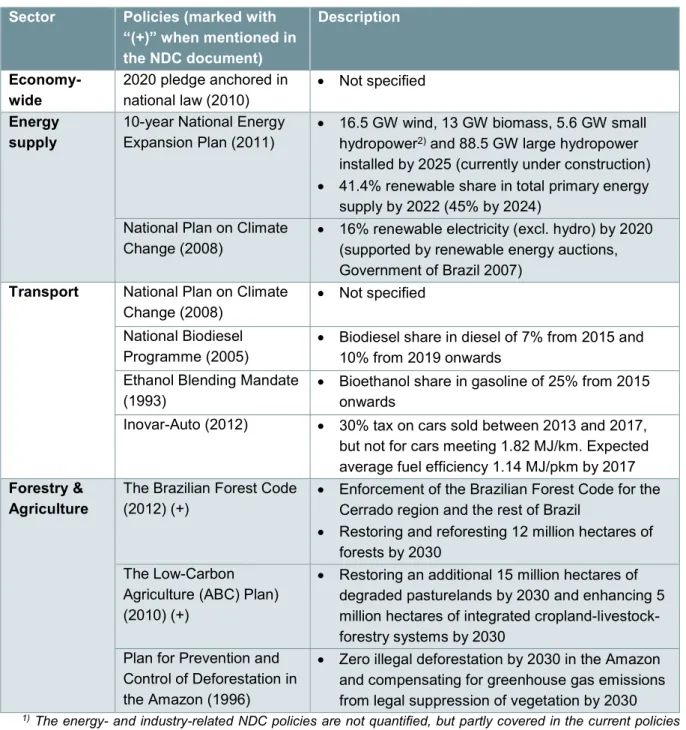
Table 11: Overview of key climate change mitigation policies in Brazil. Source: (Ministry of Mines and Energy 2012); (Government of Brazil 2008)
Sector Policies (marked with “(+)” when mentioned in the NDC document) Description Economy-wide 2020 pledge anchored in national law (2010) Not specified Energy supply
10-year National Energy Expansion Plan (2011)
16.5 GW wind, 13 GW biomass, 5.6 GW small hydropower2) and 88.5 GW large hydropower
installed by 2025 (currently under construction) 41.4% renewable share in total primary energy
supply by 2022 (45% by 2024) National Plan on Climate
Change (2008)
16% renewable electricity (excl. hydro) by 2020 (supported by renewable energy auctions, Government of Brazil 2007)
Transport National Plan on Climate Change (2008)
Not specified
National Biodiesel Programme (2005)
Biodiesel share in diesel of 7% from 2015 and 10% from 2019 onwards
Ethanol Blending Mandate (1993)
Bioethanol share in gasoline of 25% from 2015 onwards
Inovar-Auto (2012) 30% tax on cars sold between 2013 and 2017, but not for cars meeting 1.82 MJ/km. Expected average fuel efficiency 1.14 MJ/pkm by 2017 Forestry &
Agriculture
The Brazilian Forest Code (2012) (+)
Enforcement of the Brazilian Forest Code for the Cerrado region and the rest of Brazil
Restoring and reforesting 12 million hectares of forests by 2030
The Low-Carbon Agriculture (ABC) Plan) (2010) (+)
Restoring an additional 15 million hectares of degraded pasturelands by 2030 and enhancing 5 million hectares of integrated cropland-livestock-forestry systems by 2030
Plan for Prevention and Control of Deforestation in the Amazon (1996)
Zero illegal deforestation by 2030 in the Amazon and compensating for greenhouse gas emissions from legal suppression of vegetation by 2030
1) The energy- and industry-related NDC policies are not quantified, but partly covered in the current policies
projection
Table 12: Impact of climate policies on greenhouse gas emissions (including LULUCF) in Brazil. Absolute emission levels and emission levels relative to 2010 levels are presented. References for official emission data are provided in Table 3.
2010 GHG emissions, incl. LULUCF
2020 pledge and NDC Current policies Official data PBL and NewClimate estimates Official data PBL and NewClimate estimates Absolute: 1,301 MtCO2e 2,070 MtCO2e by 2020 1,975 to 2,070 MtCO2e, 52% to 59% by 2020 1,195 MtCO2e, -8% by 2030 1,300 MtCO2e by 2025 1,200 MtCO2e by 2030 1,270 to 1,425 MtCO2e, -3% to 10% by 2020 1,205 to 1,445 MtCO2e, -8% to 11% by 2030 Per capita: 6.6 tCO2e/capita N/A 9.2 to 9.7 tCO2e/capita by 2020 5.3 tCO2e/capita by 2030 N/A 5.9 to 6.7 tCO2e/capita by 2020 5.3 to 6.4 tCO2e/capita by 2030
Figure 3: Impact of climate policies on greenhouse gas emissions in Brazil (left panel: all gases and sectors, middle panel: excluding land use (i.e. LULUCF) and right panel: only land use). Source: NewClimate Institute calculations based on Climate Action Tracker (CAT 2017) and PBL calculations excluding LULUCF, and IIASA calculations on LULUCF emissions and removals (REDD-PAC Brazil 2015).
Canada
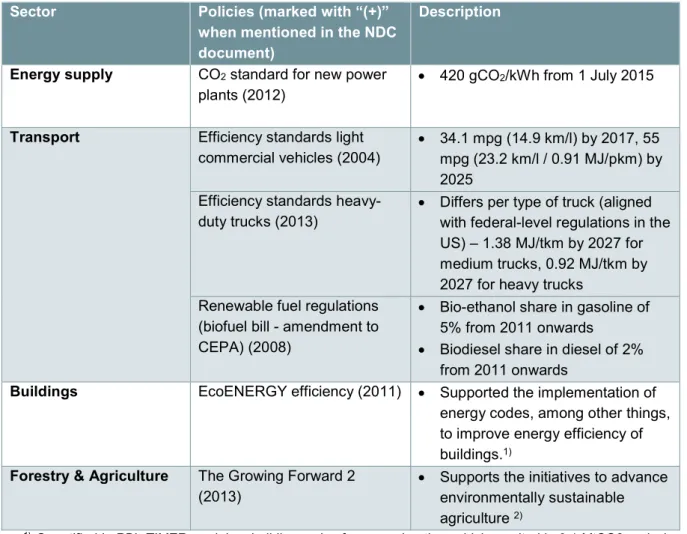
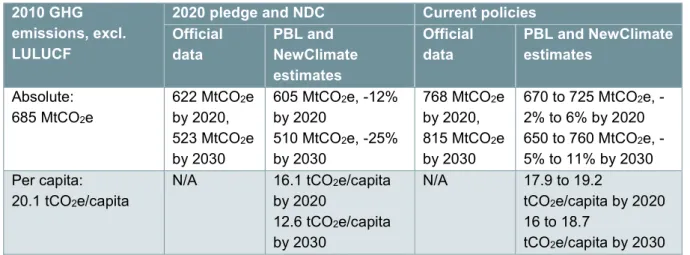
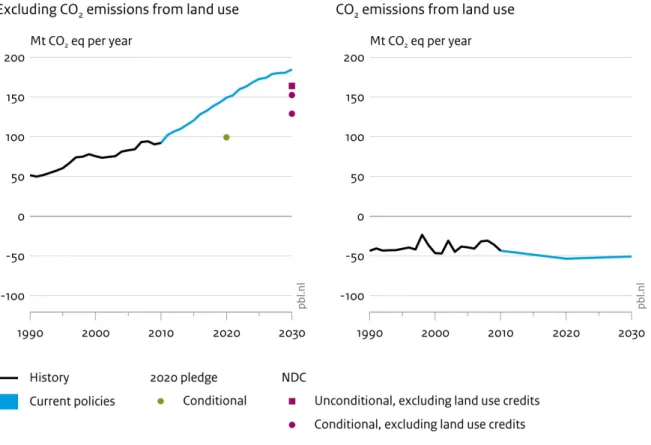
Canada’s fuel efficiency standard for passenger vehicles has the largest projected effect on GHG emissions of any policy, and is harmonised with US standards. Another policy is the carbon standard for newly built coal-fired power plants, but its impact on future GHG emissions may be limited as it does not apply to existing power plants. Under current policies, Canada is projected to emit about 650 to 760 MtCO2e by 2030 excluding LULUCF (5% below to 11% above 2010 levels) and therefore not meet its
NDC (17% below 2005 level). Canada has recently proposed a plan to price carbon pollution that would require individual provinces to either place a direct price on carbon pollution or adopt a cap and trade system. This planned policy was not included in our analysis. Four provinces already have carbon pricing systems in place (considered as current policies).
Historical net LULUCF emissions comes from the GHG inventory data presented in the National Inventory report which excludes emissions and removals from natural disturbances. The current policy projections for the LULUCF sector have thereby been revised downwards compared to our earlier assessment to be consistent with the NDC target which excludes emissions from natural disturbances. Table 13: Description of Canada’s 2020 pledge and NDC
Indicator 2020 pledge NDC (5 October 2016)
Target: unconditional 17% GHG reduction by 2030 from 2005 level
30% GHG reduction by 2030 from 2005 level
Target: conditional N/A N/A
Sectoral coverage Economy-wide Economy-wide
General Accounting method
IPCC guidelines; 100-year GWPs from the Fourth Assessment Report
IPCC guidelines; 100-year GWPs from the Fourth Assessment Report GHGs covered CO2, CH4, N2O, HFCs, PFCs, SF6 and NF3 CO2, CH4, N2O, HFCs, PFCs, SF6 and NF3 Consideration of LULUCF
Land use sector is included in the target
Net-net approach will be used for emission accounting 1)
Excludes emissions from natural disturbances LULUCF accounting could
produce 19 MtCO2e to 28
MtCO2e of credits per year
(Government of Canada 2014, CAT 2015) 2)
Land use sector is included in the target
Accounting approach not specified, approach being used to account for the LULUCF sector being examined 1)
Excludes emissions from natural disturbances and only account for anthropogenic emissions and removals Use of bilateral,
regional and
international credits
N/A International mechanisms may
be used Availability of
reference scenarios in the latest UNFCCC submissions
Yes Yes
1) Canada does though specify that it intends to use the production approach for accounting for harvested wood
products (HWP) consistent with IPCC guidance (Iversen et al. 2014, Government of Canada 2017)
2) Credits are not accounted for in the NDC. For consistency reasons the credits mentioned in the 2020 pledge
Table 14: Overview of key climate change mitigation policies in Canada. Source: Government of Canada (2014, 2015)
Sector Policies (marked with “(+)” when mentioned in the NDC document)
Description
Energy supply CO2 standard for new power
plants (2012)
420 gCO2/kWh from 1 July 2015
Transport Efficiency standards light commercial vehicles (2004)
34.1 mpg (14.9 km/l) by 2017, 55 mpg (23.2 km/l / 0.91 MJ/pkm) by 2025
Efficiency standards heavy-duty trucks (2013)
Differs per type of truck (aligned with federal-level regulations in the US) – 1.38 MJ/tkm by 2027 for medium trucks, 0.92 MJ/tkm by 2027 for heavy trucks
Renewable fuel regulations (biofuel bill - amendment to CEPA) (2008)
Bio-ethanol share in gasoline of 5% from 2011 onwards
Biodiesel share in diesel of 2% from 2011 onwards
Buildings EcoENERGY efficiency (2011) Supported the implementation of energy codes, among other things, to improve energy efficiency of buildings.1)
Forestry & Agriculture The Growing Forward 2 (2013)
Supports the initiatives to advance environmentally sustainable agriculture 2)
1) Quantified in PBL TIMER model as building codes for space heating, which resulted in 0.1 MtCO2 emission
reduction by 2020, relative to the SSP2 baseline. The second biennial report estimated the mitigation impact of this policy to be 6.5 MtCO2 by 2020, relative to their baseline (Government of Canada 2015).
Table 15: Impact of climate policies on greenhouse gas emissions (excluding LULUCF) in Canada. Absolute emission levels and emission levels relative to 2010 levels are presented. Note that the official values are based on GWP values from the IPCC 4th Assessment Report. References for official emission
data are provided in Table 3. 2010 GHG
emissions, excl. LULUCF
2020 pledge and NDC Current policies Official data PBL and NewClimate estimates Official data PBL and NewClimate estimates Absolute: 685 MtCO2e 622 MtCO2e by 2020, 523 MtCO2e by 2030 605 MtCO2e, -12% by 2020 510 MtCO2e, -25% by 2030 768 MtCO2e by 2020, 815 MtCO2e by 2030 670 to 725 MtCO2e, -2% to 6% by 2020 650 to 760 MtCO2e, -5% to 11% by 2030 Per capita: 20.1 tCO2e/capita
N/A 16.1 tCO2e/capita
by 2020 12.6 tCO2e/capita by 2030 N/A 17.9 to 19.2 tCO2e/capita by 2020 16 to 18.7 tCO2e/capita by 2030 Figure 4: Impact of climate policies on greenhouse gas emissions in Canada (left panel: including land use (i.e. LULUCF) and right panel: only land use). Source: NewClimate Institute calculations adapted from Climate Action Tracker (CAT 2017) and PBL calculations excluding LULUCF, and IIASA calculations on LULUCF emissions and removals.
Chile
By 2030 Chile aims to reduce its GHG emissions intensity per unit GDP by 30% from 2007 levels under unconditional NDC and 35% to 45% under conditional NDC, which is subject international support. Chile is estimated to emit 163 MtCO2e/year by 2030 and 128-151 MtCO2e/year under its unconditional
conditional NDC, respectively. Some of its most relevant current policies are the Non-Conventional Renewable Energy Law (NCRE) Law 20698 (20% renewable energy target for 2025) and the Energy Efficiency Action Plan (12% reduction of the final energy demand below BAU by 2020).
Under current policies, GHG emissions in 2030 are projected to be around 185 MtCO2e excluding
LULUCF. We conclude that Chile is not on track to achieve its unconditional NDC target. Table 16: Description of Chile’s 2020 pledge and NDC
Indicator 2020 pledge NDC (submitted 10 February 2017)
Target: unconditional
N/A 30% GHG reduction per unit GDP by
2030, from 2007 levels Target: conditional 20% reduction compared to
BAU emission growth trajectory (as projected from year 2007) in 2020;
conditional to a relevant level of international support
Until 35% to 45% GHG reduction per unit GDP by 2030 from 2007 levels subject to a grant of international monetary funds
Sectoral coverage Energy, agriculture, livestock and forestry, transport, mining, fishing
Energy, industrial processes, use of solvents and other products, agriculture and waste. Excluding LULUCF sector
General Accounting method
N/A IPCC guidelines; 100-year GWPs
from the Fourth Assessment Report GHGs covered N/A CO2, CH4, N2O, SF6, HFCs and PFCs
Consideration of LULUCF
Land use is included in the target
Accounting approaches and methodologies not specified
LULUCF sector is excluded from NDC 2030 intensity target A reduction of net LULUCF
emissions is expected in the order of 0.6 MtCO2e/year related to increased
sequestration from native forest management, and 0.9 – 1.2 MtCO2e/year related to increased
sequestration from afforestation Accounting approaches and
methodologies not specified Use of bilateral,
regional and international credits
N/A To be considered (“Chile does not
rule out using international GHG emission transaction markets to comply with its commitments”) Other sector-level
targets
N/A N/A
Table 17: Overview of key climate change mitigation policies in Chile. Source: (National Environmental Commission 2010, National Forest Corporation and Ministry of Agriculture 2012, Government of Chile 2013, Ministry of Energy 2014, FAO 2015, Government of Chile 2015, Ministry of Environment 2015, IEA/IRENA 2016, Ministry of Environment 2016)
Sector Policies (marked with “(+)” when mentioned in the NDC document) Description Economy-wide Energy Efficiency Action Plan (2012)
12% reduction of final energy demand below business-as-usual (BAU) by 2020 (as projected from 2010) Energy supply Law 20698: Non-Conventional Renewable Energy Law (NCRE) (2013) (+)
Utilities larger than 200MW to generate 5% of electricity from renewable sources in 2013 with continued increase to 12% in 2020, 18% in 2024 and 20% in 2025. The non-conventional renewable energy sources do not include hydro larger than 40MW. Law 20698:
Non-Conventional Renewable Energy Law (NCRE) (2013) (+)
Utilities larger than 200MW to generate 5% of
electricity from non-conventional renewable sources in 2013 with continued increase to 12% in 2020, 18% in 2024 and 20% in 2025. The non-conventional
renewable energy sources do not include hydro larger than 40MW.
Energy Plan 2050 (2016)
Target to generate 60% of electricity from renewable sources (incl. large hydro) in 2035 and 70% in 2050 Transport Law 20780: “Green
tax” second stage1)2)
(+) 2016
The second stage of the “green tax” mandates: 50% tax increase of NOx emissions by 2016, this is: 10% tax increase for gasoline-based vehicles and 40% increase for diesel-based vehicles. By 2017, there will be another 50% tax increase for NOx emissions Energy Efficiency
Action Plan (2012)
Vehicle labelling system and setting of minimum energy efficiency standards for vehicles to achieve a 12% of energy saving below BAU by 2020
Industry Energy Efficiency Action Plan (2012)
Promote energy management systems, energy efficient technologies, and cogeneration to reduce energy consumption
Buildings Energy efficiency in public buildings (2012)
20% of energy savings below BAU by 2020
F-gases N/A N/A
Forestry National Forest and Climate Change Strategy (+) (2013)
Recovery of 100,000 hectares of forest land, mainly native species
Forestation program Reforestation of 100,000 hectares of forest
1) Exemption for public transportation for over 10 seats and cargo vans for over 2,000 kg load and closed vans
of lower capacity
2) No information available on implementation status. For the current analysis, we have assumed full
Table 18: Impact of climate policies on greenhouse gas emissions (excluding LULUCF) in Chile. Absolute emission levels and emission levels relative to 2010 levels are presented. References for official emission data are provided in Table 3.
2010 GHG emissions, excl. LULUCF
2020 pledge and NDC Current policies Official data NewClimate
estimates
Official data NewClimate estimates Absolute: 92 MtCO2e N/A 100 MtCO2e, 8% by 2020 130 to 165 MtCO2e, 40% to 78% by 2030 N/A 150 MtCO2e, 62% by 2020 185 MtCO2e, 100% by 2030 Per capita: 5.4 tCO2e/capita
N/A 5.4 tCO2e/capita by
2020 6.6 to 8.3 tCO2e/capita by
2030
N/A 8.1 tCO2e/capita by
2020
9.4 tCO2e/capita by
2030
Figure 5: Impact of climate policies on greenhouse gas emissions in Chile (left: excluding land use (i.e. LULUCF), right: only land use). Source: NewClimate Institute calculations based on its analysis for Climate Action Tracker (CAT 2017) excluding LULUCF, and IIASA calculations on LULUCF emissions