CHARACTERIZATION OF AN
ENRICHED HYDROGEN-OXIDIZING
COMMUNITY BY AXENIC CULTURES
FOR MICROBIAL PROTEIN
PRODUCTION
Kilyan Verhaest
Student number: 01502061
Promotor: Prof. dr. ir. Nico Boon
Tutor: Xiaona Hu
Master’s Dissertation submitted to Ghent University in partial fulfilment of the requirements for the degree of Master of Science in Bioscience Engineering: Cell and Gene Biotechnology
Universiteitsbibliotheek Gent, 2021.
This page is not available because it contains personal information.
Ghent University, Library, 2021.
”Great things are not done by one person. They are done by a team of people” -Steve Jobs
As my career at University of Ghent comes to an end, I look back at the five wonderful and educational years I have had. My thesis year has been a one of a kind with lots of ups and a few downs. But in the end I am pleased with the the final results.
A thesis is never written alone and this became clear when I started my thesis at the Center for Microbial Ecology and Technology (CMET).
Without my tutor Xiaona Hu I wouldn’t even have been able to begin writing this thesis. I would like to thank her for making such an incredible effort in helping me throughout the whole year with questions, lab work and so much more. You have helped in making my last thesis year an incredible experience. I would also like to thank my promotor, Prof. dr. ir. Nico Boon for guiding me throughout this whole process and giving me helpful feedback whenever needed. In addition I would like to thank everybody at CMET for their helpfulness and positive mentality, which made it an amazing atmosphere to work in.
Due to the outbreak of a pandemic called ”COVID-19”, all lab work was halted from the 16th of March until the end of the semester. This had an influence on the amount of experiments I was able to perform over the course of my thesis year, reduced the amount hypothesis I could test and reduced the amount of further research I was able to do after obtaining certain results. This thesis was written based on the results obtained before the outbreak of COVID-19. This preamble was drawn up after consultation between the student and the supervisor and is approved by both.
With the ever expanding food demand and notable agricultural inefficiencies, an increase in research is done in alternative ways to produce high-quality proteins. This has led to the pro-duction of microbial proteins (MP) with hydrogen oxidizing bacteria (HOB). These bacteria can produce high-quality proteins and have obtained an increase in attention over the last years due to their ability to grow with CO2 as their only carbon source, H2 as electron donor and O2as their electron acceptor and the possibility to use renewable energy as energy source.
Nitrogen-fixing HOBs have the additional property of being able to fix N2, present in the at-mosphere, apart from using H2as an energy source and can convert this into ammonium. This ammonium could in turn be used as nitrogen fertiliser when removed from these bacteria and substitute the energy demanding Haber-Bosch process or could be converted into high-quality MP by the organisms itself. In order to make this a viable food source, improvements need to be made in the production efficiency of these MPs. This requires a better understanding of the optimal growth conditions and possible mechanisms involved in growth promoting effects.
The nitrogen-fixing HOBs used in this thesis were isolates from the Xanthobacter genus. These were selected based on samples, without reactive nitrogen, analysed by Hu et al. Growth of different strains was characterised under different oxygen and biotin concentrations in nitro-gen free mineral medium. This showed that a variety of growth patterns within this nitro-genus exists for different oxygen concentrations and that growth increases under lower biotin con-centrations.
To test whether addition of multiple Xanthobacter strains or other heterotrophs could enhance the growth, synthetic communities were created. These communities showed promoting and inhibiting effects on growth depending on their composition. This indicated possible metabolic interactions that were further examined by incubating monocultures of these Xanthobacter strains and heterotrophs in supernatant, obtained from the same cultures and combinations of these cultures. Most isolates showed no difference in growth except for one Xanthobacter strain.
Keywords: Nitrogen-fixing HOB, microbial protein, synthetic community, N2, microbial interactions, Xanthobacter, heterotroph
MP Microbial protein
HOB Hydrogen-oxidizing bacteria OD600 Optical density at 600nm
CDW Cell dry weight
DGGE Denaturing gradient gel electrophoresis
1.1 Flow diagram for the multiple-step Haber-Bosh production process (Wang et al., 2018). . . 2 1.2 The soil/plant nitrogen cycle (Cameron et al., 2013). . . 3 1.3 Categorization of agricultural(left)/industrial(right) wastes applicable for
cul-tivation of MP producing microorganisms (K. Spalvins et al., 2018)(Kriss Spalvins et al., 2018). . . 7 1.4 Schematic representation of lithoautotrophic metabolism and bio-product
for-mation in Cupravidus necator (Matassa, 2016). . . 8 1.5 Setup for MP production with a renewable energy source from hydrogen,
pro-duced by electrolysis (Sillman et al., 2019). . . 11 1.6 Different mechanisms used by N2-fixing organisms to protect their nitrogenase
enzyme from inactivation by oxygen (Gallon, 1981). . . 12 1.7 Melissa loop (Hendrickx et al., 2006). . . 13 1.8 Overview of culture dependent and independent techniques to analyse
micro-bial communities. . . 15 1.9 Flow chart of how to create and analyse synthetic communities by a bottom-up
approach (De Roy, 2014). . . 17 1.10 Summary of possible interactions between microorganisms in nature. Each
interaction can have a positive (+), negative (-) or neutral (0) influence on one organism or both (Tshikantwa et al., 2018). . . 18
4.1 Growth of 12 isolates of Xanthobacter at four different O2 concentrations (0.50%, 1%, 2% and 5%) after 48 h. Control only contains nitrogen free min-eral medium. Values given are the average of biological triplicates subtracted with the control and error bars show the standard deviation. . . 30 4.2 Growth of 12 isolates of Xanthobacter at four different O2 concentrations
(0.50%, 1%, 2% and 5%) after 112 h. Control only contains nitrogen free min-eral medium. Values given are the average of biological triplicates subtracted
4.3 OD600 measurements of 25 pure cultures (Table 3.1) and a control (only ni-trogen free mineral medium without culture) grown in mineral medium with different concentrations of biotin (5 µg/l, 10 µg/l, 20 µg/l, 50 µg/l and 100 µg/l) at 112 h. Values given are the average increases of biological triplicates and error bars show the standard deviation. . . 32 4.4 Barplot of OD600 measurements at 112 h of four different cultures grown in
synthetic communities of combinations of two, three and four strains at differ-ent oxygen concdiffer-entrations (0.5%, 1% and 5%). Values given are the average of biological triplicates subtracted with the control and error bars show the standard deviation. . . 33 4.5 Barplot of CFU (106/ml) of combinations of Xanthobacter sp. R-75741
(or-ange) with Rhizobiaceae sp. R-75756 or Shinella sp. R-75758 and pure cultures of these strains grown on R2A plates with and without rifampicin. Values given are the average CFU after 48 h of biological triplicates subtracted with CFU values of 0 h and error bars show the standard deviation. . . 34 4.6 Barplot of CFU (106/ml) of combinations of Xanthobacter sp. R-75748
(or-ange) with Rhizobiaceae sp. R-75756 or Shinella sp. R-75758 and pure cultures of these strains grown on R2A plates with and without rifampicin. Values given are the average CFU after 48 h of biological triplicates subtracted with CFU values of 0 h and error bars show the standard deviation. . . 35 4.7 Difference in OD600 measurements between four cultures grown in pure
super-natant and control (cultures grown in only nitrogen free mineral medium) at different time points. Number after S stands for the culture that produced the supernatant and number after the comma indicates the culture that grows in that supernatant. For clarity in interpreting the results of this study, the strains used were assigned a number: 1 = Xanthobacter sp. R-75741, 2 = Xanthobacter sp. R-75748, 3 = Rhizobiaceae sp. R-75756 and 4 = Shinella sp. R-75758. Values given are the average of biological triplicates subtracted with the control and error bars show the standard deviation. . . 36 4.8 Difference in OD600measurements between four cultures grown in a mixture of
supernatants and control (cultures grown in only nitrogen free mineral medium) at different time points. Numbers after S stand for the cultures that produced the supernatant and number after the comma indicates the culture that grows in that supernatant mixture. For clarity in interpreting the results of this study, the strains used were assigned a number: 1 = Xanthobacter sp. R-75741, 2 = Xanthobacter sp. R-75748, 3 = Rhizobiaceae sp. R-75756 and 4 = Shinella sp. R-75758. Values given are the average of biological triplicates subtracted with the control and error bars show the standard deviation. . . 37
5.1 Average OD600 of every group (Table 4.1) at different oxygen concentrations (0.5%, 1%, 2% and 5%) after 112 h. A clearer dot indicates the highest OD600 value of a group. . . 39
1.1 Comparison of MP production from different microorganisms (Ugbogu, 2016)(Ri-tala et al., 2017)(Upadhyaya et al., 2016). . . 5 1.2 Calculation example for land use efficiency of the production of MP compared
to the production of soybean in the US (Linder, 2019). . . 6 1.3 Comparison of amino acid composition between 3 types of HOB, yeast, algae
and casein (Volova et al., 2010). . . 9 1.4 Comparison of fractional composition of proteins from meat, wheat grain and
HOB (Volova et al., 2010). . . 10 1.5 In vitro availability of protein from HOB, meat and wheat grain for proteolytic
enzymes (Volova et al., 2010). . . 10
3.1 Classification of different bacteria used in this thesis. . . 21 3.2 Recipe for 1l nitrogen free mineral medium. . . 23 3.3 Representation of the strains added (first column) to pure cultures (first row) in
96 well plate to examine the influence of the addition of a different Xanthobacter strain. . . 25 3.4 Combinations of cultures in penicillin glass bottles. . . 27 3.5 Combinations of culture and supernatant in 96 well plate number 1 and 2.
First column shows the supernatants used and the first row shows the cultures used in that plate. Control contains no supernatant, only nitrogen free mineral medium and stock culture. . . 28
4.1 Distribution of 12 Xanthobacter strains in four groups with similar growth characteristics in different oxygen concentrations. . . 31
5.1 Effect on growth of addition of different isolates. First column shows the added isolate that causes the effect. First row shows the isolates that experienced an effect. ”-” = possible growth inhibiting effect, ”n” = no effect, ”+” = growth promoting effect, ”/” = no results obtained. . . 43
Influence of COVID-19 v
Summary vi
Notation index viii
List of figures ix
List of tables xii
1 Literature study 1
1.1 Microbial protein for food/feed production . . . 1
1.1.1 Current challenges . . . 1
Population growth, dietary and climate change . . . 1
Agriculture inefficiency . . . 2
1.1.2 Microbial protein . . . 4
Definition . . . 4
Advantages over agriculture . . . 5
Disadvantages over agriculture . . . 6
1.2 Hydrogen-oxidizing bacteria for microbial protein production . . . 6
1.2.1 Definition . . . 6
1.2.2 Protein and quality . . . 9
1.2.3 Application . . . 11
Renewable energy exploitation . . . 11
Fertiliser production . . . 11
Food production in MELiSSA loop from the European Space Agency 13 1.3 Role of synthetic communities in Microbial Resource Management . . . 14
1.3.1 Microbial Resource Management . . . 14
1.3.2 Analysing microbial communities . . . 14
1.3.3 Use of synthetic communities . . . 16
Microbial interactions . . . 17
3 Materials and methods 20
3.1 Influence of oxygen level in headspace on growth of Xanthobacter isolates . . 20
3.1.1 Experimental setup . . . 21
3.2 Influence of biotin on growth of isolates . . . 22
3.2.1 Experimental setup . . . 22
3.3 Microbial interactions between different Xanthobacter strains . . . 24
3.3.1 Experimental setup . . . 24
3.4 Comparison of growth of mixed and pure cultures . . . 25
3.4.1 Experimental setup . . . 25
3.5 Influence of secreted metabolites on growth of pure cultures . . . 26
3.5.1 Experimental setup . . . 26
4 Results 29 4.1 Influence of oxygen level in headspace on growth of Xanthobacter isolates . . 29
4.2 Influence of biotin on growth of isolates . . . 32
4.3 Microbial interactions between different Xanthobacter strains . . . 32
4.4 Comparison of growth of mixed and pure cultures . . . 33
4.5 Influence of secreted metabolites on growth of pure cultures . . . 35
5 Discussion 38 5.1 Influence of oxygen level in headspace on growth of Xanthobacter isolates . . 38
5.2 Influence of biotin on growth of isolates . . . 41
5.3 Microbial interactions between different Xanthobacter strains and heterotrophs 42 5.4 Influence of secreted metabolites on growth of pure cultures . . . 45
6 Conclusion and future perspectives 47
1.1
Microbial protein for food/feed production
1.1.1 Current challengesPopulation growth, dietary and climate change
Population growth, changing food consumption patterns and a warming climate are all putting pressure on the global food production. The global human population has been increasing exponentially and it has more than quadrupled over the last 100 years (Upadhyaya et al., 2016). The current agriculture methods are constantly put under pressure by the ever in-creasing food demand that comes with this population increase. Although the agricultural sector has strengthened in most of the developed countries, developing and some of the devel-oped countries still struggle with problems like malnutrition, hunger and food related diseases (Gabriel et al., 2014). The World Health Organisation has estimated that up to 12.000.000 individuals lose their life every day due to these causes (Israelidis, 2015).
The livestock sector currently uses about 70% of the global land available for agricultural purposes, either as pasture or to produce feeding crops (Zanten et al., 2016). A dietary tran-sition towards mostly plant-based foods could release some of the pressure the environment is currently under. Even though a large number of policy efforts were made to affect this transition, the current global trend on the consumption of animal protein per capita is still increasing (Gerbens-Leenes et al., 2010).
Climate change puts further pressure on the current agricultural sector and can even influence the national economics of a country. An increase of 1◦C to 2◦C in global mean temperature can have significant negative effects on the yield of different crops. This compels the produc-ers to intensify production and/or expand cultivated areas, which increases the cost of the production process (Stevanovi´c et al., 2016).
Agriculture inefficiency
More than 70% of freshwater used around the world is used for agricultural purpose (Bacon, 2004). Unfortunately only a small amount is converted to biomass and most of it ends up as groundwater. Due to the use of pesticides and fertilisers this groundwater, on which about 60% of the European citizens rely for drinking purpose, can be threatened.
Pesticides are used to tackle the main loses of yield in the agricultural sector, e.g. insect pests, weeds, fungicides and bactericides. However some are intrinsically toxic and could have a destructive effect on humans, wildlife, aquatic ecosystem and even agricultural crops (Perez Lucas et al., 2018).
Fertilisers are nutrients, essential for the growth of plants, added to the soil to make it more fertile. Most of these products supply nitrogen, phosphorus and potassium, which are the elements that have to be the most present and are often depleted in soils. The other elements are only required in a small amount and are generally still available (Science Learning Hub – Pokap¯u Akoranga P¯utaiao, 2012).
Over the years a fair amount of discoveries where made on how to add nitrogen to the soil, but the one discovery that stands out the most is the Haber-Bosch process. This process allowed the human race to grow to the number we are today and was patented by Fritz Haber in 1908 (Pikaar et al., 2017). It currently produces more than 90 % of the total ammonia, which is used so frequent that nearly 80% of the nitrogen found in human tissue originates from the Haber-Bosch process (Wang et al., 2018).
This complicated process (Figure 1.1) is normally powered by fossil fuel and operates at ex-tremely high temperatures (400-500◦C) and pressure (100-200 atm). To reach these high conditions the Haber-Bosch process accounts for approximately 1-2% of the annual energy consumption and has a carbon footprint that represents around 1.5% of all greenhouse gas emissions. Even though the process itself is optimised and reaches near thermodynamic process efficiencies, subsequent use of the produced nitrogen suffers from many losses in agri-culture. As a consequence only 4-14% of the nitrogen used ends up as consumable protein (Wang et al., 2018). Most losses are due to volatilisation, leaching or denitrification (Figure 1.2)(Cameron et al., 2013).
Figure 1.2 The soil/plant nitrogen cycle (Cameron et al., 2013).
Another inconvenient occurring is the restriction to available land for either cropland or pasture. Agriculture uses the most fertile and suitable land available, which accounts for approximately 38% of the total land surface. These lands lay in different environments which subsequently makes many countries dependent on import of certain crops/protein sources for feed or food industry (Pikaar et al., 2017).
1.1.2 Microbial protein
It is clearly visible that we are at a critical juncture in human history. Alternatives for the production of high-quality proteins, that mitigate the environmental impact caused by current agricultural practice, need to be considered. A promising solution is making use of microbial cells for the production of high-quality proteins, also known as microbial proteins (MP) (Matassa, 2016). The discovery and use of MPs is not only characteristic to the last decade. It goes back to ancient times, when fermented yeast was recovered as a leaving agent for bread (2500 B.C.) and lactic acid bacteria were used for the production of milk and cheese (Upadhyaya et al., 2016). Nowadays multiple applications can be found for the use of MPs, e.g. Quorn. Quorn is the most successful application of the mycoproteins. It is produced by fungi and used as a meat replacement because it can mimic the taste and structure (Matassa, 2016).
Definition
Microbial proteins, sometimes referred to as single cell proteins, are dehydrated biomass or purified proteins derived from a microbial cell culture such as yeast, algae, bacteria or some types of fungi. Every microorganism has its own characteristics and dependent on the ap-plication a different microorganism could be used (Table 1.1). Because of their high protein concentration, low fat and high vitamin content they can be used as a source of protein in food and feed (Ugbogu, 2016). Typically, the MP is produced in a reactor, which enables the production and harvesting of the protein to be highly efficient. The only necessary com-pounds for the growth of the microorganisms is the supply of nitrogen, an electron donor, a carbon source and an electron acceptor (Pikaar et al., 2017). The microorganisms used for the production of MP should have at least the following properties: nonpathogenic to plants, human and animals, usable as food or feed, good nutritional value and absence of toxic compounds (Upadhyaya et al., 2016).
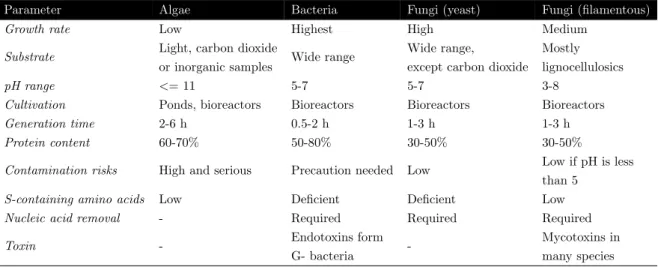
Algae are mostly cultivated in ponds an reactors with addition of CO2 and sunlight. Their protein content is relatively high (60-70%) and except for the low amount of S-containing amino acids, the amino acid composition has a good quality. They have a relatively long generation time (2-6 h). Bacteria are cultivated in reactors with a wide variety of substrates. Their protein content is comparable to the one of algae (50-80%) and the amount of nucleic acid present is high. Therefore processing prior to usage as feed or food is necessary. The generation time is the shortest compared to the other microorganisms (0.5-2 h). Fungi are cultivated in reactors with a wide variety of substrates. Their protein content is relatively low (30-50%) and processing prior to usage is necessary as well because the nucleic acid concentration is too high. Their generation time is relatively short (1-3 h) (Table 1.1)(Ugbogu, 2016)(Singh et al., 2020).
Table 1.1 Comparison of MP production from different microorganisms (Ugbogu, 2016)(Ritala et al., 2017)(Upadhyaya et al., 2016).
Parameter Algae Bacteria Fungi (yeast) Fungi (filamentous)
Growth rate Low Highest High Medium Substrate Light, carbon dioxide
or inorganic samples Wide range
Wide range,
except carbon dioxide
Mostly lignocellulosics pH range <= 11 5-7 5-7 3-8
Cultivation Ponds, bioreactors Bioreactors Bioreactors Bioreactors Generation time 2-6 h 0.5-2 h 1-3 h 1-3 h Protein content 60-70% 50-80% 30-50% 30-50%
Contamination risks High and serious Precaution needed Low Low if pH is less than 5
S-containing amino acids Low Deficient Deficient Low Nucleic acid removal - Required Required Required Toxin - Endotoxins form
G- bacteria
-Mycotoxins in many species
Advantages over agriculture
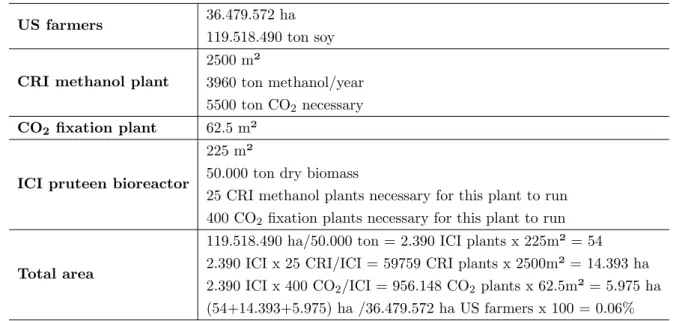
Due to the possibility to grow the microorganisms in large 3D containers, the amount of land needed for the production of certain proteins could be lowered tremendously. To confirm this Linder made a calculation based on data he obtained in the US in 2017. In table 1.2 the area needed for the production of 119.518.490 ton of soybean dry matter in the US is compared to the area needed for the production of the same amount of dry biomass but produced in the form of a microbial protein, called pruteen. For the production of this MP with an ICI reactor, a certain amount of methanol is necessary. The methanol is produced by the CRI plant which needs carbon dioxide for its production. They conclude that less than 1% of the original area will be necessary to produce the same amount of dry biomass (Linder, 2019). Because of the growth in reactors, the growth is not dependent on climate. The production of MP could in theory be done in the most extreme environments, where no crop could ever grow and no animal could ever survive. The water losses could be minimised in a reactor and the generation times compared to the conventional crops (average 1-3 months), used as feed or food, is tremendously lower (Table 1.1).
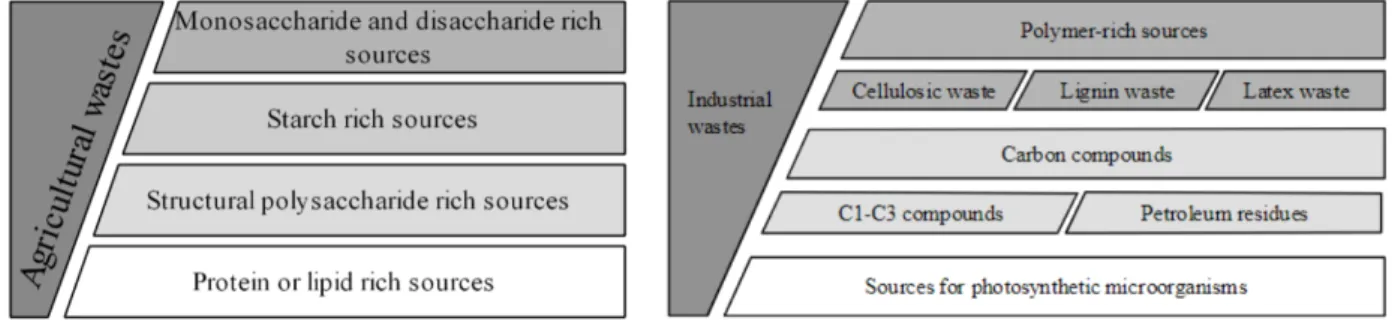
Another advantage is the possibility to easily genetically modify the organisms to desired properties, e.g. a correct composition of amino acids that it produces. This is more time consuming and labor intensive when trying to apply on crops. When considering the protein content in the dry mass, these microorganisms have the edge over crops or dairy products (Table 1.1). They can use a wide spectrum of original raw materials to produce MP, which includes waste products from various sources (Figure 1.3) and compounds produced by re-newable energy (Upadhyaya et al., 2016).
Table 1.2 Calculation example for land use efficiency of the production of MP compared to the production of soybean in the US (Linder, 2019).
US farmers 36.479.572 ha
119.518.490 ton soy
CRI methanol plant
2500 m²
3960 ton methanol/year 5500 ton CO2necessary CO2 fixation plant 62.5 m²
ICI pruteen bioreactor
225 m²
50.000 ton dry biomass
25 CRI methanol plants necessary for this plant to run 400 CO2 fixation plants necessary for this plant to run
Total area
119.518.490 ha/50.000 ton = 2.390 ICI plants x 225m² = 54 2.390 ICI x 25 CRI/ICI = 59759 CRI plants x 2500m² = 14.393 ha 2.390 ICI x 400 CO2/ICI = 956.148 CO2plants x 62.5m² = 5.975 ha (54+14.393+5.975) ha /36.479.572 ha US farmers x 100 = 0.06%
Disadvantages over agriculture
Despite the numerous striking properties for the use of microorganisms to produce MP, some disadvantages need to be acknowledged. First the risk of contamination of the medium with undesired strains during the production process. This could have a major influence on the pro-ductivity of the cells. Secondly the relative high nucleic acid concentration compared to other protein sources. Which has the possibility to cause health disorders and should therefore be minimised as much as possible. Age-related degenerative disorders, cancer, acute and chronic inflammatory conditions and autoimmune disorders have been reported with reference to high nucleic acid blood levels (Mittra et al., 2012). Thirdly there is a possibility that the cell wall may be indigestible and the protein needs to be extracted out of the cells, which increases the production cost and time. Fourthly the cells may produce some intolerable flavours or colours which could have an influence on human health. Lastly there is a possibility that the cells produce unwanted toxins (Upadhyaya et al., 2016)(A.T et al., 2011).
1.2
Hydrogen-oxidizing bacteria for microbial protein
produc-tion
1.2.1 Definition
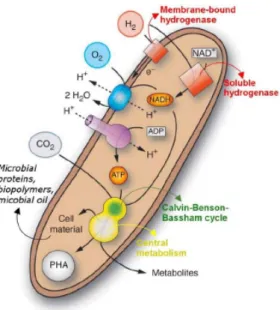
Hydrogen-oxidizing bacteria (HOB) (Figure 1.4) are a physiologically defined group that is facultative autotroph. It is their ability to grow chemolithoautotrophically that makes them
Figure 1.3 Categorization of agricultural(left)/industrial(right) wastes applicable for cultivation of MP pro-ducing microorganisms (K. Spalvins et al., 2018)(Kriss Spalvins et al., 2018).
so interesting to use. HOB consist out of bacteria from different taxonomic units, that are defined by the ability to utilize hydrogen as electron donor, oxygen as an electron acceptor and CO2 as a carbon source for the production of biomass. This makes the group biologically unique in the world of microorganisms. (Aragno and Schlegel, 1981).
2H2+ O2−→ 2H2O (1.1)
2H2+ CO2 −→ CH2O + H2O (1.2)
6H2+ 2O2+ CO2−→ CH2O + 5H2O (1.3)
Hydrogen is used in reaction with O2 to produce energy (Equation 1.1), which in another reaction with CO2is consumed for the fixation of CO2 (Equation 1.2) into new cellular mate-rial by the ribulose biphosphate or reverse tricarboxylic cycle. Equation 1.3 gives the overall reaction (Bongers, 1970).
For the production of energy out of hydrogen, two types of hydrogenases can be involved depending on which strain observed (Figure 1.4). These catalyze the oxidation of hydrogen shown in equation 1.3. The first is a cytoplasmatic NAD-specific hydrogenase which is called ’hydrogen dehydrogenase’. The second is a membrane-bound hydrogenase that does not re-duce pyridine nucleotides (Aragno and Schlegel, 1981). These hydrogenases are known to be sensitive to O2 and lose functionality when the oxygen concentration rises above a certain level (Vignais et al., 2007).
Figure 1.4 Schematic representation of lithoautotrophic metabolism and bio-product formation in Cupravidus necator (Matassa, 2016).
Reaction 1.4 described by Ishizaki et al., represents the stoichiometry for the autotrophic cell growth of an HOB (Alcaligenes eutrophus). Depending on the strain and condition of growth, the molar ratio of H2, O2 or CO2 can vary from the ones presented in equation 1.4.
21.36H2+ 6.21O2+ 4.09CO2+ 0.76N H3 −→ C4.09H7.13O1.89N0.76+ 18.70H2O (1.4)
The fact that most of them are facultative autotrophs, growing on either organic or inorganic substrate, makes it possible to occupy certain niches and explains why they can be found in lots of places around the world (Aragno and Schlegel, 1981). HOBs normally occur in habitats where both hydrogen and oxygen are available. Due to the negative influence of high concentrations of oxygen on the hydrogenase and nitrogenase enzymes, most habitats are characterised by an oxygen concentration that fluctuates around hypoxic conditions. Here anaerobic microorganisms release hydrogen that can be useful for the HOB without them being affected by high oxygen concentration. Examples of habitats are lower parts of the soil and swamps (Aragno, 1992).
1.2.2 Protein and quality
The CDW of an HOB is on average 70% (Volova et al., 2010). This is fairly high compared to other microorganisms (Table 1.1). Matassa, Verstraete, et al. did some research around the quality of MP produced from 3 different HOBs. When comparing the total essential amino acids with other proteins they concluded that they are comparable to these of animal proteins and that the total is more than 10% higher than in crops. They compared the amino acid content with a full-value animal protein (casein) (Table 1.3) and concluded that both amino acid contents were very similar (Matassa, Verstraete, et al., 2016).
Table 1.3 Comparison of amino acid composition between 3 types of HOB, yeast, algae and casein (Volova et al., 2010).
Amino acid, % from the dry substance of a cell HOB: Z1 HOB: Z106 HOB:
B5786 Yeast Algae Casein
Lysine 7.02 8.61 9.20 7.02 5.98 7.33 Histidine 1.96 2.48 1.40 1.96 1.81 2.20 Arginine 7.30 8.00 7.50 7.30 7.74 3.19 Asparaginic 10.08 9.57 9.10 10.08 9.49 7.11 Threonine 5.29 4.52 5.20 5.29 4.88 4.22 Serine 4.02 3.47 4.80 4.02 4.86 5.72 Glutamic 12.56 11.17 9.30 12.56 13.12 22.20 Proline 4.58 3.46 0.80 4.58 5.74 10.41 Glycine 6.05 5.47 10.20 6.05 6.34 1.88 Alanine 9.07 8.80 13.40 9.07 9.18 2.96 Cystine 0.56 - 0.30 0.56 1.37 0.42 Valine 6.38 7.13 7.50 6.38 5.41 5.72 Methionine 2.63 2.69 0.40 2.63 2.16 2.47 Isoleucine 4.47 4.58 4.50 4.47 3.55 4.10 Leucine 8.60 8.52 8.70 8.60 8.91 9.39 Tyrosine 3.62 3.26 2.40 3.62 3.13 4.75 Phenylalanine 4.42 3.96 3.60 4.42 4.41 4.62 Tryptophan 1.40 1.24 1.16 1.40 1.58 1.32
Regarding the fractioning of the different proteins in salt and alkaline solutions, a certain difference is observed between the MP and animal proteins (Table 1.4). The higher the fraction number, the more the structural proteins are extracted by alkaline and therefore less available to proteases. This means lower digestibility. Only 50% of the total protein content from HOB is present in the first 2 fractions, compared to meat which has 80% in the first 2 and wheat grain which has 35%. This means the digestibility lays between meat and wheat (Volova et al., 2010).
Table 1.4 Comparison of fractional composition of proteins from meat, wheat grain and HOB (Volova et al., 2010).
Fractional composition of proteins, % form total protein content Protein type Total content,
% from CDW I II III IV Meat 76.1 ± 3.2 30.5 ± 0.7 52.2 ± 0.7 16.6 ± 0.8 0.6 ± 0.1 Wheat grain 15.2 ± 0.8 25.9 ± 0.9 16.1 ± 0.9 39.0 ± 3.4 19.0 ± 0.4 HOB strains: Z1 69.4 ± 1.2 28.0 ± 0.8 24.8 ± 0.8 32.8 ± 1.4 4.4 ± 0.1 Z1062 64.0 ± 1.4 29.0 ± 0.2 23.0 ± 0.2 33.0 ± 2.8 6.0 ± 0.9 B5786 68.0 ± 0.3 30.0 ± 2.2 31.0 ± 3.4 30.0 ± 2.7 7.0 ± 1.0
Another important characteristic is the availability of the proteins to proteolytic enzymes. This gives a better view of the amount of assimilation possible in the gastrointestinal tract. The assimilation of these MPs is situated between casein and wheat grain (Figure 1.5). The protein proteolysis of MP is about 1.4 times the proteins originating from wheat grain and is 0.8 times that of casein (Matassa, Boon, et al., 2014).
Table 1.5 In vitro availability of protein from HOB, meat and wheat grain for proteolytic enzymes (Volova et al., 2010). Protein proteolysis, % Pepsin Trypsin Protein 1 h 2 h 3 h 5 h 6 h Strains: Z1 21.8 36.6 39.6 43.0 44.0 Z1062 20.9 35.9 40.1 40.6 41.2 B5786 22.5 37.0 37.9 42.8 43.1 Casein 23.0 43.5 44.0 54.1 55.0 Wheat grain 19.9 23.3 25.0 32.0 32.3
1.2.3 Application
Renewable energy exploitation
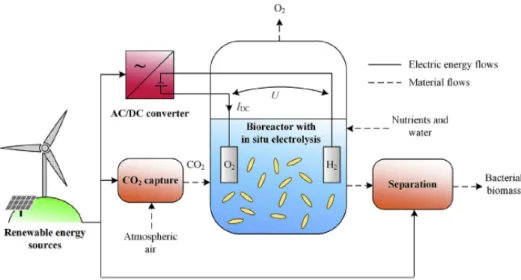
The production of MP with HOBs gains a major increase of interest because of the possibility to use renewable energy as energy source (Sillman et al., 2019) and the significantly higher solar-to-biomass efficiencies (up to 10%) compared to that of different crops (Liu, Col´on, et al., 2016). The most promising process line is renewable energy-to-hydrogen-line. This line produces oxygen and hydrogen needed for the MP production through electrolysis. The electrolysis can be powered by different renewable energy sources, e.g. solar, wind, etc. It could even be powered by off-peak electricity (Matassa, Boon, et al., 2014). Figure 1.5 shows a simplified setup on how to incorporate renewable energy in the production process of MPs. Here the electrolysis of water occurs internally in the reactor but this could also be done externally. A direct air capture device is used to capture CO2 from the surrounding air and add it to the reactor (Sillman et al., 2019).
Figure 1.5 Setup for MP production with a renewable energy source from hydrogen, produced by electrolysis (Sillman et al., 2019).
Fertiliser production
For centuries ammonium obtained from waste streams or the Haber-Bosch process is used as a fertiliser to supply crops with the necessary amount of nitrogen (Matassa, Batstone, et al., 2015). Recent studies have pointed out a new alternative based on the discovery of a new species (Wiegel, 2006) that is able to grow chemolithoautotrophically and fix nitrogen gas: N2-fixing HOBs (Liu, Sakimoto, et al., 2017). The N2-fixing HOBs have an extra enzyme called nitrogenase. This enzyme is responsible for the reduction of N2 into ammonium and
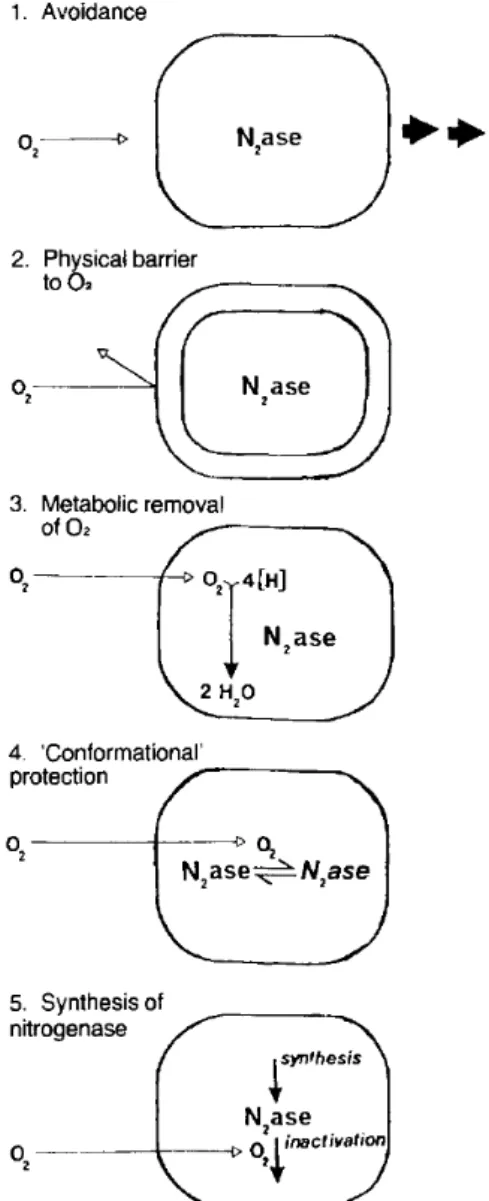
oxidation, the hydrogen produced could be used for energy production. This oxidation can in turn provide the O2-sensitive nitrogenase some additive protections by lowering the in situ oxygen and hydrogen concentration (Arp, 1989). N2-fixing organisms have found numerous other ways to protect its nitrogenase from being inhibited by oxygen, e.g. growing in anaerobic conditions, having a physical barrier to keep the oxygen away from the enzyme, conformational changes to the enzyme, synthesis of new nitrogenase (Figure 1.6)(Gallon, 1981). The residual ammonium produced by the nitrogenase enzyme can in turn be removed and utilised as a nitrogen fertiliser. Another option is the conversion of ammonium into microbial biomass in the microorganism itself (Equation 1.4)(Matassa, 2016).
Figure 1.6 Different mechanisms used by N2-fixing organisms to protect their nitrogenase enzyme from
Food production in MELiSSA loop from the European Space Agency
The micro-ecological life support system alternative or MELISSA, is a bioregenerative life support system designed by the European Space Agency (ESA) for long term space missions (Figure 1.7). It describes an artificially closed ecosystem in which all liquid, gas and solid wastes are recovered. The only necessary input to drive this complete process is energy. Wherefore the sunlight could be used as source (Lasseur et al., 1996). It is made out of 4 compartments with the crew member at the center. HOBs could be used in the first compart-ment (the liquefying compartcompart-ment), in which all mission waste is collected and anaerobically digested to NH4, H2, CO2, volatile fatty acids and minerals. The reason nitrogen fixation could be used here is because of the occurrence of nitrogen losses in this compartment. These losses could be biologically fixed by HOBs to reduce the problem (Clauwaert et al., 2017).
1.3
Role of synthetic communities in Microbial Resource
Man-agement
1.3.1 Microbial Resource Management
We are surrounded by a vast variety of microorganisms that inhabit almost every niche in the biosphere. They can even be found in extreme conditions, e.g. hot spring and arctic environment. In all these habitats they play integral and unique roles and are involved in an enormous amount of processes, e.g. nitrogen cycle, which can be executed by a single microorganism or in joint effort. A microbial community consist of multiple microorganisms that fulfill different functional roles and interact with each other. This can occur in different forms, such as cross signaling, cross feeding, aggregation, etc (De Roy, 2014).
These genetically and physiologically diverse microbial communities create a major metagenome of knowledge that could offer possible solutions to current challenges, e.g. climate change due to the increasing emission of greenhouse gasses (Verstraete et al., 2007). Microbial resource management tries to preserve and understand all this knowledge. This could be used to manipulate microbial communities and processes in different environments to improve these environments, human health and biotechnological applications in the most sustainable way (Read et al., 2011).
1.3.2 Analysing microbial communities
In order to understand and steer these communities, different questions need to be asked and answered: Who is present? Amount present? What is the abundance? How do they interact and with whom? What is their function?, etc. Only when the normal of a certain environment is known MRM can be used to predict the reaction of that environment to certain changes. To be able to answer these questions and compare results from different experimental settings, Marzorati et al. developed a set of tools that was based on the interpretation of a 16S rRNA gene molecular DGGE fingerprint.
Recent developments provide high-throughput sequencing technologies that are more sensitive than the used DGGE and have the possibility to offer a solution to the analysis of unknown or unculturable microbial communities (Ku et al., 2013). These new technologies come hand in hand with an exponentially increasing pool of data that can be analysed with newer re-engineerded tools (Read et al., 2011).
In order to be able to use certain parameters of MRM. A number of techniques need to be used on microbial communities to obtain more information about their current conditions. These techniques can be split up in culture-dependent and culture-independent (Figure 1.8)(De Roy, 2014).
Figure 1.8 Overview of culture dependent and independent techniques to analyse microbial communities.
Cultivation on general or selective media is the only culture-dependent method. This is an easy to use and cheap method that is based on differential physiologic, cellular, metabolic and morphological traits. The pitfalls of this method are the long incubation times and possibility to culture only 1% of the microorganisms (Varjani et al., 2018). To solve this problem culture independent methods were developed, without the need to cultivate or isolate the microor-ganisms. These methods are subdivided into indirect and direct methods. Indirect methods require a preparation step before analysing the PCR- or extraction product with e.g. DGGE, microarray, hybridisation, sequencing, etc. A problem occurring when using RNA or DNA fingerprint techniques is the need for isolation of the DNA or RNA, which is most of the time followed by PCR. Each step introduces a bias in the analysis and is time-consuming. Direct methods do not require a preparation step and were introduced to minimise the bias and duration of previous methods. With direct methods, e.g. flow cytometry and microscopy, the sample itself can be analysed without the previously required isolation. If necessary specific cells can be labelled with probes (fluorescent in situ hybridization) or fluorescently stained (De Roy, 2014).
1.3.3 Use of synthetic communities
While the metagenomic data obtained from previously mentioned methods is ever increas-ing, fundamental ecological and evolutionary questions concerning the microbial communities surrounding us still cannot be answered fully. In nature communities get influenced and shaped by different factors that cannot be controlled. These factors are: spatial organisation (e.g. biofilm), resiliency, biotic and abiotic factors (e.g. predation and temperature change), diversity, interaction and communication between microorganisms. As a result of these nu-merous interactions it is almost impossible to achieve answers to the fundamental questions (Tshikantwa et al., 2018). A promising strategy to overcome this is to create synthetic com-munities. These are simplified representations of natural systems, where two or more species are cultured together under a well-defined and controlled media. This ecosystem with lower complexity, higher controllability and higher reproducibility allow us to gain insight in the structural, functional and evolutional properties of microbial communities by varying one specific factor and keeping all the others constant (De Roy, 2014).
According to Großkopf et al. synthetic communities can be utilised in two general ways. The first is the top-down approach which tries to determine the function. With this in mind the community structure and dynamics can be characterised later on by comparing different communities with the same function.
The second method, the one relevant for this thesis, is called the bottom-up approach (Figure 1.9). Bottom-up approach starts with the isolation of the desired microorganisms from their natural environment and growing them on liquid medium. Subsequently they get diluted to the wanted cell numbers and added to a community one by one in the correct proportion. For every addition the parameters of interest can be analysed (De Roy, 2014).
Figure 1.9 Flow chart of how to create and analyse synthetic communities by a bottom-up approach (De Roy, 2014).
Microbial interactions
Interactions between 2 species can be described by 6 basal interaction patterns (Figure 1.10). The net effect of these interactions on both species can be positive, negative or no effect at all (Tshikantwa et al., 2018).
The possibility to influence the productivity of a strain by interactions with other strains is emphasized by Ho et al. They proved that an increase in methane oxidation of a methanotroph (for growth and reproduction) was positively correlated with the diversity of heterotrophs. These heterotrophs were selected on the basis of their growth-promoting or neutral effect on the methanotroph in a methanotroph-heterotroph coculture and comparable growth condi-tions.
Figure 1.10 Summary of possible interactions between microorganisms in nature. Each interaction can have a positive (+), negative (-) or neutral (0) influence on one organism or both (Tshikantwa et al., 2018).
As previously described in the literature study the production of MP could aid in overcoming certain problems the world is currently struggling with. A few examples of these problems are agriculture inefficiency, increasing food demand, soil contamination, etc. These MP are produced by certain microorganisms which require specific conditions for optimal growth. Based on the paper of Hu et al., N2-fixing HOBs from the Xanthobacter genus, capable of producing MPs, and other heterotrophs were selected to use in this thesis. These strains were cultivated in pure cultures and synthetic communities under certain conditions to obtain a comprehensive overview of the characteristics and conditions for optimal growth of these strains. More specifically, the aim was to answer the following research questions:
1. What is the influence of different oxygen levels on the growth of Xanthobacter isolates?
2. Does biotin have an influence on the growth of isolates?
3. What influence does the addition of other Xanthobacter strains have on the growth of a synthetic community?
4. What is the difference in growth between pure and mixed cultures of Xanthobacter strains and other heterotrophs?
5. Why are certain strains/genera present in the analysed samples of Hu et al., 2020?
6. Does the secretion of metabolites from other strains have an influence on the growth of pure cultures?
The experiments in this thesis require the use of a number of different bacteria in pure or synthetic cultures. These strains were selected based on the paper of Hu et al., where the most abundant strains obtained from a community analysis of different samples were selected. Table 3.1 gives more information about the bacteria provided by colleagues at the Center for Microbial Ecology and Technology (CMET, UGent).
3.1
Influence of oxygen level in headspace on growth of
Xan-thobacter isolates
Based on research from Hu et al. Xanthobacter strains were selected. This due to the fact that this genus was dominant and active in the samples analysed. Strains capable and inca-pable of fixing N2 were selected to characterise their growth in pure cultures with a gas phase composed of different oxygen concentrations.
Table 3.1 Classification of different bacteria used in this thesis.
Genus Strain Nitrogen fixing HOB Heterotroph
Xanthobacter sp. R-75739 No Yes
Xanthobacter sp. R-75740 No Yes
Xanthobacter sp. R-75741 Yes Yes
Xanthobacter sp. R-75742 Yes Yes
Xanthobacter sp. R-75743 Yes Yes
Xanthobacter sp. R-75744 Yes Yes
Xanthobacter sp. R-75745 Yes Yes
Xanthobacter sp. R-75746 Yes Yes
Xanthobacter sp. R-75747 Yes Yes
Xanthobacter sp. R-75748 Yes Yes
Xanthobacter sp. R-75749 Yes Yes
Xanthobacter sp. R-75750 Yes Yes
Chryseobacterium sp. R-75752 No Yes Rhizobiaceae sp. R-75753 No Yes Rhizobiaceae sp. R-75754 No Yes Rhizobiaceae sp. R-75755 No Yes Rhizobiaceae sp. R-75756 No Yes Rhizobiaceae sp. R-75757 No Yes Shinella sp. R-75758 No Yes Shinella sp. R-75759 No Yes Microbacterium sp. R-75760 No Yes Microbacterium sp. R-75761 No Yes Hydrogenophaga sp. R-75762 No Yes Sphingopyxis sp. R-75763 No Yes Pseudacidavorax sp. R-75764 No Yes 3.1.1 Experimental setup
Twelve Xanthobacter strains (Table 3.1) were revived from a -80◦C glycerol stock with R2A plates (3 g/l R2A broth, 0.5 g/l MgSO4 x H2O, 10 g/l gellan gum). These were incubated separately in 15 ml R2A broth (3 g/l R2A broth) for 2 days at 28◦C, shaking at 120 rpm. After washing the cells with phosphate-buffered saline (PBS) by centrifugation (5000 rcf, 5 min) for three times to remove all the remaining R2A broth, the cell density of the stock culture was normalised to an OD600 of 0.1 with the addition of nitrogen free mineral medium. 96 well plates were identically inoculated with biological triplicates of a 10x dilution (20µl stock culture and 180 µl nitrogen free mineral medium (Table 3.2)) of each Xanthobacter
mineral medium is made by autoclaving solutions A, B, C and D separately for 15 min at 121◦C and mixing these solutions aseptically, after cooled down to 50 ◦C, with 5.0 ml filter-sterilized standard vitamin solution. Each plate was placed in a jar with a different headspace composition, more precisely a different oxygen level. First the jars were flushed with N2 for 30 min to replace the air and afterwards the correct amount of CO2 (10%), H2 (10%) and O2 (0.5%, 1%, 2% and 5%) was added. Higher oxygen concentrations could lead to total in-hibition of nitrogen fixing or hydrogen-oxidizing mechanisms and terminate all growth of the isolates. At last the jars were placed in an 28 ◦C static incubator and OD600 measurements were performed after 48 h and 112 h. The headspace was refreshed as previously described after taking measurements at 48 h.
3.2
Influence of biotin on growth of isolates
In previous experiments a concentration of 5µg/l biotin was used when making nitrogen free mineral medium (Table 3.2). To look at the influence of a different concentration of biotin on the growth of pure isolates, pure cultures were grown in nitrogen free mineral medium containing different concentrations of biotin.
3.2.1 Experimental setup
All cultures from table 3.1 were revived from a -80◦C glycerol stock with R2A plates. For growth and washing the same procedure was used as in section 3.1. Afterwards a stock so-lution was normalised for each pure culture to an OD600 of 0.1 with the addition of nitrogen free mineral medium. Next, five nitrogen free mineral media were made with a different biotin concentration (5, 10, 20, 50 and 100 µg/l). 96 well plates were inoculated with 20 µl pure culture and 180µl nitrogen free mineral medium per well (in biological triplicates). This was done for the different nitrogen free mineral media and for every culture. A control was added containing only nitrogen free mineral medium. All the plates were placed in a jar. The jar was flushed with N2 for 30 min to replace the air and afterwards the correct amount of CO2 (10%), H2 (10%) and O2 (2%) was added. At last the jar was placed in an 28 ◦C static incubator and OD600measurements were performed after 48 h and 112 h. The headspace was refreshed as previously described after taking measurements at 48 h.
Table 3.2 Recipe for 1l nitrogen free mineral medium.
Solutions Chemicals Quantities
Solution A KH2PO4 2.3 g Na2HPO4 2.9 g Distilled water 50 ml Solution B MgSO4 · 7 H2O 0.5 g CaCl2 · 2 H2O 10 mg MnCl2 · 4 H2O 5 mg NaVO3 · H2O 5 mg
Trace element sol. SL-6 5 ml
Distilled water 915 ml Solution C FeSO4 · 7H2O 53.06 mg Na2EDTA 61.75 mg Distilled water 20 ml Solution D NaHCO3 0.5 g Distilled water 10 ml
Solution E Standard vitamin solution 5 ml
Standard vitamin solution Riboflavin 10 mg
Thiamine-HCl · 2 H2O 50 mg Nicotinic acid 50 mg Pyridoxine-HCl 50 mg Ca-pantothenate 50 mg Biotin 0.1 mg Folic acid 0.2 mg Vitamin B12 1 mg Distilled water 100 ml
3.3
Microbial interactions between different Xanthobacter strains
In nature growth of microorganisms can be influenced by numerous interactions in many dif-ferent ways (see 1.3.3). Each interaction can lead to a difdif-ferent outcome. Some promote the growth, others reduce it and sometimes no influence is seen. These interactions can be so complex that a good understanding of all these interactions can become almost impossible. With the use of synthetic communities and the change of only one variable, the influence on growth of addition of another strain can be characterised.3.3.1 Experimental setup
In order to quantify these different possibilities, four different Xanthobacter strains (R-75739, R-75741, R-75743 and R-75748) were selected based on the groups produced in section 3.1 (Table 4.4). From every group 1 strain was selected for further experiments. For growth and washing the same procedure was used as in section 3.1. Afterwards a stock solution was normalised for each pure culture to an OD600 of 0.1 with the addition of nitrogen free mineral medium. Next, three 96 well plates were inoculated with the combinations present in table 3.3 in biological triplicates. Each well contains 20 µl of each culture in a specific combination and the residual volume to obtain 200 µl is filled with nitrogen free mineral medium (Table 3.2). A control was added containing only nitrogen free mineral medium. Each plate was placed in a jar with a different headspace composition, more precisely a different oxygen level. First the jars were flushed with N2 for 30 min to replace the air and afterwards the correct amount of CO2(10%), H2 (10%) and O2 (0.5%, 1% and 5%) was added. At last the jars were placed in an 28 ◦C static incubator and OD600 measurements were performed after 112 h.
Table 3.3 Representation of the strains added (first column) to pure cultures (first row) in 96 well plate to examine the influence of the addition of a different Xanthobacter strain.
R-75739 R-75741 R-75743 R-75748 R-75739 x x x R-75741 x x x R-75743 x x x R-75748 x x x R-75739 + R-75741 x x R-75739 + R-75743 x R-75739 + R-75748 x x R-75741 + R-75743 x x R-75741 + R-75748 x x R-75743 + R-75748 x x R-75739 + R-75741 + R-75743 x R-75739 + R-75741 + R-75748 x R-75739 + R-75743 + R-75748 x R-75741 + R-75743 + R-75748 x
3.4
Comparison of growth of mixed and pure cultures
Hu et al. analysed the microbial composition of samples and found a widespread of differ-ent genera in coexistence with earlier mdiffer-entioned Xanthobacter. In the following experimdiffer-ent a deeper insight will be gained on the exact growth of certain coculture composed of a N2-fixing Xanthobacter strain and another heterotroph strain.
3.4.1 Experimental setup
For this experiment the two most abundant nitrogen fixing HOBs and heterotrophs were chosen based on results from Hu et al., 2020. Xanthobacter sp. R-75741 and R-75748, Rhizo-biaceae sp. R-75756 and Shinella sp. R-75758 (Table 3.1) were revived from a -80◦C glycerol stock with R2A plates. For growth and washing the same procedure was used as in section 3.1. Afterwards a stock solution was normalised for each pure culture to an OD600 of 0.1 with the addition of nitrogen free mineral medium. Two 96 well plates were filled for every time point of measurement (0 h and 48 h). The first plate contained 20 µl stock and 180 µl nitrogen free mineral medium in biological triplicates for every strain. The second plate con-tained two strains per well (20 µl stock per strain) and 160 µl nitrogen free mineral medium in biological triplicates. The combinations of two strains added together were: R-75741 +
for 48 h measurements were put in a jars. This was flushed for 30 min with N2 to remove the remaining air and filled with the correct headspace composition (10% CO2, 10% H2 and 2% O2). Afterwards the jar was placed in a 28◦C static incubator. For the two plates of 0 h a 10x dilution series was made for every well and 10 µl droplets of dilution 103, 104 and 105 were pipetted on a R2A plate and a R2A plate containing rifampicin (100 mg/l). Rifampicin is toxic for the Xanthobacter strains, but this is not the case for the other strains who have an induced resistance for rifampicin due to mutations. Afterwards these plates were put in a 28◦C static incubator and CFU were counted when possible. Only the dilutions with a CFU between 10-50 were counted. After 48 h incubation, the jar was opened and the same procedure was performed as previously described on the first two plates.
3.5
Influence of secreted metabolites on growth of pure
cul-tures
To react to certain environmental changes occurring in a microbial community or to interact with other species, bacteria usually use different metabolic exchange mechanisms. In order to look at the effect on growth of possible produced metabolites, the supernatant of bacteria, monoculture or coculture, was collected and added to certain pure cultures.
3.5.1 Experimental setup
Xanthobacter sp. R-75741 and R-75748, Rhizobiaceae sp. R-75756 and Shinella sp. R-75758 (Table 3.1), the same isolates used in previous experiment (Section 3.4) , were revived from a -80 ◦C glycerol stock with R2A plates. These were incubated separately in 15 ml R2A broth (3 g/l R2A broth) for 2 days at 28 ◦C, shaking at 120 rpm. After washing the cells with phosphate-buffered saline (PBS) by centrifugation (5000 g, 5 min) for three times to remove all the remaining R2A broth, the cell density of the stock culture was normalised to an OD600 of 0.1 with the addition of nitrogen free mineral medium. Next 240 ml penicillin glass bottles were filled with 18 ml nitrogen free mineral medium and 2 ml culture (pure or mixture). Bottles with one culture contained 2 ml of that culture and the ones containing a mixture of two cultures contained 1 ml per culture. The bottles were filled according to table 3.4. A control bottle containing only 20 ml nitrogen free mineral medium was added. Afterwards the bottles were flushed with N2 for 20 min to replace the air and the correct amount of CO2 (10%), H2 (10%) and O2 (2%) was added. These bottles were placed in an 28◦C static incubator for 72 h.
Table 3.4 Combinations of cultures in penicillin glass bottles. Bottle Culture 1 R-75741 2 R-75748 3 R-75756 4 R-75758 5 R-75741 + R-75756 6 R-75741 + R-75758 7 R-75748 + R-75756 8 R-75748 + R-75758 9 control
After 72 h incubation the content of the bottles was centrifuged (5 min, 5000 rcf) seperately. The resulting supernatants were filter sterilized (0.21µm hydrophilic sterile filter) and poured in separate falcon tubes. The pellets of bottle 1,2,3,4 and 9, containing only one culture, were further washed and centrifuged with PBS (3x 5 min at 5000 rcf). Afterwards a stock solution was normalised for each pellet to an OD600 of 0.1 by adding the necessary amount of nitrogen free mineral medium. Next, 96 well plates were inoculated with different combinations of culture and supernatant (Table 3.5), in biological triplicates. 100µl supernatant, 20 µl stock and 80 µl nitrogen free mineral medium was added. An additional control (180 µl nitrogen free mineral medium + 20 µl stock) was added for every stock solution, also in biological triplicates. These plates were put in a jar, that was flushed for 30 min to replace the air. Afterwards the correct amount of CO2 (10%), H2 (10%) and O2 (2%) was added. OD600 measurements were performed at the start of the experiment and after 72 h and 144 h. The headspace was refreshed as previously described after taking measurements at 72 h.
Table 3.5 Combinations of culture and supernatant in 96 well plate number 1 and 2. First column shows the supernatants used and the first row shows the cultures used in that plate. Control contains no supernatant, only nitrogen free mineral medium and stock culture.
Supernatant Culture R-75741 R-75748 R-75756 R-75758 R-75741 1 1 1 1 R-75748 1 1 1 1 R-75756 1 1 1 1 R-75758 1 1 1 1 R-75741 + R-75756 2 2 2 2 R-75741 + R-75758 2 2 2 2 R-75748 + R-75756 2 2 2 2 R-75748 + R-75758 2 2 2 2 Control 1 1 1 1
4.1
Influence of oxygen level in headspace on growth of
Xan-thobacter isolates
In the production process of MP possible fluctuations can occur of certain parameters. One of these parameters is the oxygen concentration in the gas phase. Different species, even strains could grow differently under a change in oxygen level, due to differences in affinity and therefore change the relative composition of a microbial community used for MP production and the MP itself. To analyse the affinity of each strain for oxygen and whether or not a change can be observed in growth with a change in oxygen concentration, the growth of different Xanthobacter strains was measured under different oxygen levels. The OD600 measurements were taken after 48 h (Figure 4.1) and 112 h (Figure 4.2). Every point indicates the average OD600 value of a biological triplicate of a certain strain at an oxygen concentration present in the headspace of each jar (0.5%, 1%, 2% and 5%) subtracted with the average value of a control well (biological triplicate) containing solely 200 µl nitrogen free mineral medium.
Figure 4.1 Growth of 12 isolates of Xanthobacter at four different O2 concentrations (0.50%, 1%, 2% and
5%) after 48 h. Control only contains nitrogen free mineral medium. Values given are the average of biological triplicates subtracted with the control and error bars show the standard deviation.
Figure 4.2 Growth of 12 isolates of Xanthobacter at four different O2concentrations (0.50%, 1%, 2% and 5%)
after 112 h. Control only contains nitrogen free mineral medium. Values given are the average of biological triplicates subtracted with the control and error bars show the standard deviation.
After 48 h (Figure 4.1) a difference in growth can be seen between the OD600 measurements of a 5% oxygen concentration and the ones with a lower concentration. Exceptions to this are Xanthobacter sp. R-75739, R-75740, R-75742 and R-75748. Xanthobacter sp. R-75739 and R-75740 have no difference in growth when the oxygen concentrations changes, due to the fact that these strains cannot fix N2. Xanthobacter sp. R-75742 and R-75748 have a slight increase in growth. After 112 h (Figure 4.2) these differences increase even more, which makes the 12 Xanthobacter strains more distinguishable in regard to their reaction on a change in gas composition. When comparing the different time points (48 h and 112 h) an increase in optical density is seen for every strain with the increase of time. This shows that regardless of the oxygen level, all strains are able to grow a certain amount. For certain strains this could for the most part be due to background growth (Xanthobacter sp. R-75739 and R-75740). The OD600 values of the different strains over the different oxygen levels at 112 h (Figure 4.2) make it possible to divide the 12 strains into different groups, each containing strains with similar characteristics concerning growth under different oxygen concentrations. Table 4.1 shows the different groups. Xanthobacter sp. R-75739 and R-75740 have no strong differ-ence between there values at different oxygen concentrations. When looking at Xanthobacter sp. R-757341, R-75745, R-75747 and R-757549 a clear increase is visible with the increase in oxygen. Xanthobacter sp. R-75742 and R-75748 have no difference between the 1, 2 and 5% and only grow slower when the concentration of oxygen is lower than 1%. Xanthobacter sp. R-75743, R-75744, R-75746 and R-75750 have 2 different growth patterns. For 0.5 and 1% they grew slow and for 2 and 5% they grew faster as indicated by the higher OD600values.
Table 4.1 Distribution of 12 Xanthobacter strains in four groups with similar growth characteristics in different oxygen concentrations.
Group Culture Characteristics
1 R-75739 R-75740 no growth 2 R-75741 R-75745 R-75747 R-75749
increase in growth with increase in oxygen concentration highest growth at 5% of all groups
3 R-75742
R-75748
higher similar growth at 1%, 2% and 5% less growth at 0.5% 4 R-75743 R-75744 R-75746 R-75750
higher similar growth at 2% and 5% less and similar growth at 0.5% and 1%
4.2
Influence of biotin on growth of isolates
Biotin is know to have an influence on growth for some microorganisms, e.g. Xanthobacter species (Aragno and Schlegel, 1981), but whether an increase in biotin concentration in the incubation medium can increase bacterial growth is still unknown. Nitrogen free mineral medium used in all the experiments in this thesis contains 5 µg/l biotin. By changing the concentration of this vitamin within the medium (5 µg/l, 10 µg/l, 20 µg/l, 50µg/l and 100 µg/l), different reaction can be characterised from all isolates (Table 3.1). Figure 4.3 shows the OD600measurements after 112 h subtracted with the results obtained at 0 h at different biotin concentrations for all isolates and a control containing only nitrogen free mineral medium. Figure 4.3 shows an increase for those strains capable of fixing nitrogen which is expected because isolates are grown in nitrogen free medium. A higher similar increase in growth is seen for those cultures grown in medium containing a biotin concentration of 5µg/l. Those grown in the highest biotin concentration show smaller increase. Some other strains have a small increase but this is mainly due to background growth.
Figure 4.3 OD600 measurements of 25 pure cultures (Table 3.1) and a control (only nitrogen free mineral
medium without culture) grown in mineral medium with different concentrations of biotin (5 µg/l, 10 µg/l, 20 µg/l, 50 µg/l and 100 µg/l) at 112 h. Values given are the average increases of biological triplicates and error bars show the standard deviation.
4.3
Microbial interactions between different Xanthobacter strains
Interactions between different strains can have a diverse effect on growth. Because interaction between different Xanthobacter strains might promote each others growth more or less than expected, OD600 measurements were taken of combinations of 4 different strains in a 96 well
plate under different oxygen concentrations after 112 h (Figure 4.4).
Synthetic communities without Xanthobacter sp. R-75739 (see R-75741 + R-75748, R-75743 + R-75748, R-75741 + R75743, R-75741 + R-75743 + R-75748) show a clear increase in growth when R-75739 is added to the community. This shows that Xanthobacter sp. R-75739 has a strong influence on promoting the growth of the cultures used in this experiment even though this bacteria has almost no growth after 112 h in any oxygen concentration (Section 4.1). When Xanthobacter sp. R-75741, R-75743 and R-75748 are all present in one culture this has a negative effect on the measured growth of a community, this can be seen by the low OD600 values for the community with only these strains. Addition of one of these strains to a community has no pronounced influence on the growth.
Figure 4.4 Barplot of OD600measurements at 112 h of four different cultures grown in synthetic communities
of combinations of two, three and four strains at different oxygen concentrations (0.5%, 1% and 5%). Values given are the average of biological triplicates subtracted with the control and error bars show the standard deviation.
4.4
Comparison of growth of mixed and pure cultures
When growing cultures in mixed or pure cultures often differences can be seen in growth due to possible metabolic interactions occurring in mixed cultures. Some Xanthobacter strains could possibly interact with other heterotrophs and vice versa and influence growth in a cer-tain way. This was analysed in the following results. Because the Xanthobacter strains show no resistance against rifampicin, these strains will not be able to grow on medium containing this antibiotic. This makes it possible to calculate the CFU present in a coculture coming
total CFU (combination of both strains) can be obtained. Counting the CFU of cocultures grown on R2A agar plates with rifampicin gives the CFU for the other heterotrophs. By sub-tracting the heterotroph CFU from the total CFU the CFU of Xanthobacter can be obtained. Figure 4.5 gives the CFU (106/ml) increase or decrease after 48 h of Xanthobacter sp. R-75741 (nitrogen fixing HOB), Rhizobiaceae sp. R-75756 and Shinella sp. R-75758 in pure and cocultures. Figure 4.6 shows similar results but with another Xanthobacter strain: Xan-thobacter sp. R-75748. In both figures a high promotion is seen in the growth of the nitrogen fixing HOBs in coculture with Rhizobiaceae sp. R-75756 when compared to the growth of pure Xanthobacter strains (270 CFU vs 42 CFU for Xanthobacter sp. R-75741 and 549 CFU vs 47 CFU for Xanthobacter sp. R-75748). This is not the case for cocultures with Shinella sp. R-75758 (38 CFU vs 43 CFU for Xanthobacter sp. R-75741 and 40 CFU vs 47 CFU for Xanthobacter sp. R-75748).
Rhizobiaceae sp. R-75756 has also an increase in CFU when growing in coculture with Xan-thobacter sp. R-75741 (20 CFU vs -8 CFU) and XanXan-thobacter sp. R-75748 (21 CFU vs -8 CFU), but this is not the case for Shinella sp. R-75758 (17 CFU vs 10 CFU and 11 CFU vs 10 CFU).
Figure 4.5 Barplot of CFU (106/ml) of combinations of Xanthobacter sp. R-75741 (orange) with Rhizobiaceae
sp. R-75756 or Shinella sp. R-75758 and pure cultures of these strains grown on R2A plates with and without rifampicin. Values given are the average CFU after 48 h of biological triplicates subtracted with CFU values of 0 h and error bars show the standard deviation.
Figure 4.6 Barplot of CFU (106/ml) of combinations of Xanthobacter sp. R-75748 (orange) with Rhizobiaceae
sp. R-75756 or Shinella sp. R-75758 and pure cultures of these strains grown on R2A plates with and without rifampicin. Values given are the average CFU after 48 h of biological triplicates subtracted with CFU values of 0 h and error bars show the standard deviation.
4.5
Influence of secreted metabolites on growth of pure
cul-tures
Microorganisms have various mechanisms to interact with their surrounding. One mechanism is by excreting metabolites that could have a possible influence on other species present in the bacterial community. Whether these isolates secrete certain growth influencing metabolites and if so under which conditions, needs to be tested. By collecting the superantants of pure cultures and cocultures of Xanthobacter sp. R-75741, Xanthobacter sp. R-75748, Rhizobi-aceae sp. R-75756 and Shinella sp. R-75758 and growing monocultures of these strains in the different collected supernatants a deeper understanding of the influence of these metabo-lites was possible. Figures 4.7 and 4.8 represent the differences between the average OD600 measurements of biological triplicates of cultures grown in supernatant and control (cultures grown in pure nitrogen free mineral medium) after 0 h, 72 h and 144 h.
Figure 4.7 shows the results of pure cultures growing in supernatant coming from a single culture and 4.8 shows the results of the same cultures but grown in supernatant coming from
Xanthobacter sp. R-75741 showed a decrease in growth after 72 h compared to the control, when grown in supernatant coming from a monoculture. With a higher decrease when incu-bated in supernatant of Xanthobacter sp. R-75748 compared to the other values. After 144 h most differences became negligible except for the culture with the supernatant of Xanthobac-ter sp. R-75748.
Xanthobacter sp. R-75741 showed similar decrease in growth after 72 h, when incubated with supernatants from cocultures. Here these differences all became negligible after 144 h. Other cultures showed no observable effect on growth growing in medium containing super-natant from a monoculture or coculture.
Figure 4.7 Difference in OD600 measurements between four cultures grown in pure supernatant and control
(cultures grown in only nitrogen free mineral medium) at different time points. Number after S stands for the culture that produced the supernatant and number after the comma indicates the culture that grows in that supernatant. For clarity in interpreting the results of this study, the strains used were assigned a number: 1 = Xanthobacter sp. 75741, 2 = Xanthobacter sp. R-75748, 3 = Rhizobiaceae sp. R-75756 and 4 = Shinella sp. R-75758. Values given are the average of biological triplicates subtracted with the control and error bars show the standard deviation.
Figure 4.8 Difference in OD600 measurements between four cultures grown in a mixture of supernatants and
control (cultures grown in only nitrogen free mineral medium) at different time points. Numbers after S stand for the cultures that produced the supernatant and number after the comma indicates the culture that grows in that supernatant mixture. For clarity in interpreting the results of this study, the strains used were assigned a number: 1 = Xanthobacter sp. R-75741, 2 = Xanthobacter sp. R-75748, 3 = Rhizobiaceae sp. R-75756 and 4 = Shinella sp. R-75758. Values given are the average of biological triplicates subtracted with the control and error bars show the standard deviation.