State of
Infectious
Diseases
in the Netherlands,
2016
State of Infectious
Diseases in the
Netherlands, 2016
B. de Gier
D.R.E. Nijsten
J.W. Duijster
S.J.M. Hahné
Colophon
© RIVM 2017
Parts of this publication may be reproduced, provided acknowledgement is given to the ‘National Institute for Public Health and the Environment’, along with the title and year of publication.
Editors: B. de Gier, D.R.E. Nijsten, J.W. Duijster, S.J.M. Hahné.
Centre for Infectious Disease control, Epidemiology and Surveillance, RIVM, Bilthoven Contact: brechje.de.gier@rivm.nl
RIVM Report 2017-0029 / 2017
Synopsis
State of infectious diseases in the Netherlands, 2016
The most notable infectious disease outbreak in 2016 was the large Zika virus outbreak in Latin America. During this outbreak it was discovered that the Zika virus can cause Guillain-Barré syndrome, and that infection during pregnancy can lead to severe congenital disorders. In the Caribbean Netherlands, the Zika virus is mainly spread by mosquitoes, while in the European Netherlands sexual transmission of the virus occurs via infected travellers. In 2016, Zika virus infection during pregnancy and severe cases of Zika virus disease became notifiable.The first two cases of tick-borne encephalitis (TBE) infected in the Netherlands occurred in 2016. The virus causing this condition is spread by ticks and infection can lead to (meningo) encephalitis. The main infectious disease outbreaks in the Netherlands in 2016 were caused by
Salmonella, hepatitis A virus and Neisseria meningitidis (meningococcal disease). In addition, relatively many Legionella infections occurred. From August 2015 to July 2016 low numbers of rotavirus diagnoses were reported in the virological surveillance, similar to the 2013/14 season. A normal season was observed n 2014/15 and 2016/17. These observations might indicate a transition from an annual rotavirus pattern to a biennial pattern in the Netherlands. With regard to international outbreaks, aside from the aforementioned Zika virus epidemic, the yellow fever outbreak in Angola and measles epidemics in several European countries were monitored in order to assess possible risks to the Netherlands.
These are some of the highlights of the annual State of Infectious Diseases in the Netherlands report by the Dutch National Institute for Public Health and the Environment (RIVM). This report provides insight into infectious disease developments for policy makers at the Ministry of Health, Welfare and Sports (VWS) and in municipal health services (GGD).
The thematic Chapter of the 2016 report reviews vaccination and the immune system during the life course. Certain populations, specifically young children, the elderly, pregnant women and people with a weakened immune system, become infected more easily and, if infected, they can experience a more severe disease course. Vaccination may be less effective for these groups. To protect vulnerable groups, maintaining herd protection through high
vaccination coverage in the general population is essential.
Publiekssamenvatting
Staat van Infectieziekten in Nederland, 2016
In 2016 was de grote uitbraak van het zikavirus in Latijns Amerika de meest in het oog springende infectieziekte. Tijdens deze uitbraak werd ontdekt dat het zikavirus infectie Guillain-Barré syndroom kan veroorzaken en dat na een infectie tijdens de zwangerschap ernstige aangeboren afwijkingen kunnen ontstaan. In Caribisch Nederland wordt het zikavirus vooral verspreid via muggen. In Europees Nederland kan zikavirus verspreid worden door seksuele contacten met geïnfecteerde reizigers. In 2016 is een meldingsplicht ingesteld voor zwangeren met een zikavirusinfectie of als de ziekte ernstig verloopt. Verder kwamen in 2016 de eerste twee gevallen van tekenencefalitis (TBE) aan het licht die in Nederland zijn opgelopen. Het virus dat deze aandoening veroorzaakt wordt via teken verspreid en kan hersen(vlies)ontsteking veroorzaken. De belangrijkste uitbraken van infectieziekten in Nederland in 2016 werden veroorzaakt door Salmonella, hepatitis A virus en Neisseria meningitidis (meningokokken). Daarnaast kwamen relatief veel Legionella-infecties voor. Van augustus 2015 tot juli 2016 werden lage aantallen rotavirus diagnosen gemeld in de virologische weekstaten. In 2013/14 werden eveneens lage aantallen gemeld, terwijl de gemelde aantallen in 2014/15 en 2016/17 normaal waren. Deze waarnemingen wijzen op een mogelijke verschuiving van een jaarlijks rotaviruspatroon naar een tweejaarlijks patroon in Nederland. Wat betreft buitenlandse signalen, zijn behalve de genoemde zikavirusepidemie, vooral de gele koorts-uitbraak in Angola en de mazelenepidemieën in verschillende Europese landen in de gaten gehouden om eventuele risico’s voor Nederland te kunnen inschatten. Dit blijkt uit de ‘Staat van Infectieziekten’ van het RIVM. Deze jaarlijkse rapportage geeft beleidsmakers bij het ministerie van VWS en GGD-en inzicht in ontwikkelingen van infectieziekten in Nederland en in het buitenland. Het verdiepende thema is dit keer vaccinatie en het immuunsysteem in de verschillende fasen van een mensenleven. Sommige bevolkingsgroepen, te weten (jonge) kinderen, ouderen, zwangeren en mensen met een verzwakt immuunsysteem, lopen vaker infecties op. Ook kan het zijn dat bij hen infectieziekten ernstiger verlopen of dat vaccinaties minder goed werken. Om kwetsbare groepen te beschermen, is het van groot belang dat de groepsimmuniteit in de bevolking door een hoge vaccinatiegraad gehandhaafd blijft.Contents
Publiekssamenvatting 5 Summary 5
1 Introduction 9 2 Notifications and signals 11
2.1 Introduction 11
2.2 Group B1 diseases 14
2.3 Group B2 diseases 14
2.4 Group C diseases 15
2.5 Key signals related to non-notifiable infectious diseases 19
2.6 International key signals 19
3 Virological surveillance in the Netherlands – Virological weekly reports 21
3.1 Introduction 21
3.2 Signals based on data from the virological weekly reports in 2016 23
4 Surveillance of infectious diseases based on electronic medical records in primary care in 2016 25
4.1 Introduction 25
4.2 NIVEL Primary Care Database 25
4.3 Privacy 26
4.4 Output and data use in 2016 26
4.5 Overview of results in 2016 27
4.6 Concluding remarks 30
5 Notifiable infectious diseases in asylum-seekers in the Netherlands 31
5.1 Introduction 31
5.2 Methods 31
5.3 Overview of notifiable infectious diseases in residents of COA-centres 33
5.4 Concluding remarks 37
6 Burden of infectious diseases in the Netherlands, 2012–2016 39
6.1 Introduction 39
6.2 Methods 39
6.3 Results 40
6.4 Discussion 40
7 Vaccination and immune status throughout life: a public health perspective 47
7.1 Immune status and vaccination: the young, the old, the pregnant and the immunocompromised 47 7.2 Surveillance of vaccine-preventable diseases in people with impaired immunity 53
7.3 Concluding remarks 54
1
Introduction
This report is the 11th edition of the State of InfectiousDiseases in the Netherlands. This annual publication is primarily intended to inform policy makers at the Ministry of Health, Welfare and Sports (VWS), at municipal health services, and at the Centre for Infectious Disease Control at the RIVM. It provides an overarching summary of relevant alerts and (changing) trends in infectious diseases in the Netherlands. Detailed annual reports are available for specific fields (including respiratory infections, sexually transmitted infections, antimicrobial resistance, zoonoses and vaccine-preventable diseases).
This report starts with a chapter on the main national and international infectious disease events that occurred in 2016 (Chapter 2). This chapter includes the annual reported numbers of cases of notifiable diseases in the Netherlands up to 2016.
In Chapter 3, the results of virological surveillance in the Netherlands in 2016 are presented. These results are based on weekly reports of pathogen detections from sentinel laboratories across the Netherlands.
In Chapter 4, surveillance by general practitioners (GPs) in the Netherlands, as coordinated by NIVEL, is described. This chapter gives an overview of the type of data included in the GP surveillance system, the method of data collection, findings and the use and dissemination of the reported data.
In Chapter 5, we provide an overview of notifiable infectious diseases reported in asylum-seekers in the Netherlands in 2016. Numbers of notifications and the incidences of hepatitis B, tuberculosis and malaria in asylum-seekers residing in asylum-seeker centres are presented. Chapter 6 contains updated estimates of the burden of infectious diseases in the Netherlands for the period 2012–2016. Estimates of disease burden can be informative for public health policy decisions regarding the
prioritisation of interventions and preventive measures. This year, our theme chapter (Chapter 7) reviews specific issues around vaccine-preventable diseases in four
vulnerable groups: the young, the old, the pregnant and the immunocompromised (‘YOPI’). People with a weakened immune system are at particular risk of infectious disease, but may also respond less well to vaccination. Challenges and opportunities for vaccination of the YOPI are discussed.
2
Notifications
and signals
2.1 Introduction
In this chapter, we provide an overview of the reported number of cases of notifiable diseases and key infectious disease alerts (e.g. outbreaks and changing trends) in 2016, previously reported in the weekly reports by the
Netherlands Early Warning Committee (http://signalen. rivm.nl/). These include both national and international signals.
Table 2.1 shows the number of notifications of all notifiable infectious diseases in the Netherlands by year of disease onset in the period 2009–2016. In Sections 2.2 to 2.4, we describe the most important signals concerning mandatory notifiable diseases under the Dutch Public Health Act [1]. No group A events were reported in 2016. Section 2.5 deals with signals regarding non-notifiable infectious diseases for the Netherlands. In Section 2.6, we discuss international signals that were included at least five times in the weekly reports of the Netherlands Early Warning Committee, as these constituted long-term outbreaks or were deemed to be of greater public health relevance. We have included information from the year 2017 only when the events started in 2016 and continued into 2017.
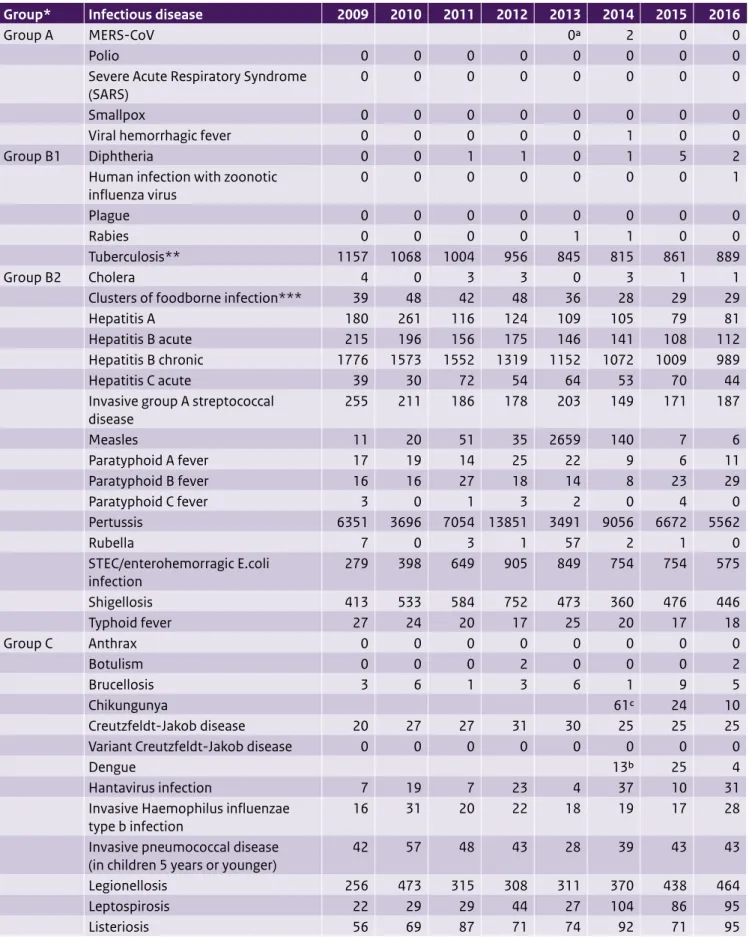
Table 2.1 Number of notifications of infectious diseases by year of disease onset, the Netherlands, 2009–20161
Group* Infectious disease 2009 2010 2011 2012 2013 2014 2015 2016
Group A MERS-CoV 0a 2 0 0
Polio 0 0 0 0 0 0 0 0
Severe Acute Respiratory Syndrome
(SARS) 0 0 0 0 0 0 0 0
Smallpox 0 0 0 0 0 0 0 0
Viral hemorrhagic fever 0 0 0 0 0 1 0 0
Group B1 Diphtheria 0 0 1 1 0 1 5 2
Human infection with zoonotic
influenza virus 0 0 0 0 0 0 0 1
Plague 0 0 0 0 0 0 0 0
Rabies 0 0 0 0 1 1 0 0
Tuberculosis** 1157 1068 1004 956 845 815 861 889
Group B2 Cholera 4 0 3 3 0 3 1 1
Clusters of foodborne infection*** 39 48 42 48 36 28 29 29
Hepatitis A 180 261 116 124 109 105 79 81
Hepatitis B acute 215 196 156 175 146 141 108 112
Hepatitis B chronic 1776 1573 1552 1319 1152 1072 1009 989
Hepatitis C acute 39 30 72 54 64 53 70 44
Invasive group A streptococcal
disease 255 211 186 178 203 149 171 187 Measles 11 20 51 35 2659 140 7 6 Paratyphoid A fever 17 19 14 25 22 9 6 11 Paratyphoid B fever 16 16 27 18 14 8 23 29 Paratyphoid C fever 3 0 1 3 2 0 4 0 Pertussis 6351 3696 7054 13851 3491 9056 6672 5562 Rubella 7 0 3 1 57 2 1 0 STEC/enterohemorragic E.coli infection 279 398 649 905 849 754 754 575 Shigellosis 413 533 584 752 473 360 476 446 Typhoid fever 27 24 20 17 25 20 17 18 Group C Anthrax 0 0 0 0 0 0 0 0 Botulism 0 0 0 2 0 0 0 2 Brucellosis 3 6 1 3 6 1 9 5 Chikungunya 61c 24 10 Creutzfeldt-Jakob disease 20 27 27 31 30 25 25 25
Variant Creutzfeldt-Jakob disease 0 0 0 0 0 0 0 0
Dengue 13b 25 4
Hantavirus infection 7 19 7 23 4 37 10 31
Invasive Haemophilus influenzae
type b infection 16 31 20 22 18 19 17 28
Invasive pneumococcal disease
(in children 5 years or younger) 42 57 48 43 28 39 43 43
Legionellosis 256 473 315 308 311 370 438 464
Table 2.1 (continued) Number of notifications of infectious diseases by year of disease onset, The Netherlands, 2008-20151.
Group* Infectious disease 2009 2010 2011 2012 2013 2014 2015 2016
MRSA-infection (clusters outside
hospitals) 16 14 6 2 11 3 12 5 Malaria 235 244 242 199 166 285 344 250 Meningococcal disease 158 143 99 106 109 81 95 153 Mumps 80 563 609 397 205 40 87 71 Psittacosis 81 73 70 45 53 41 47 60 Q fever 2424 411 77 63 20 26 20 14 Tetanus 1 2 5 2 1 0 1 1 Trichinosis 1 0 1 0 0 0 0 0 Tularemia 3d
West Nile virus infection 0 0 0 0 0 0 0 3
Yellow fever 0 1 1 0 0 0 0 1
Zika virus 8d
1 Until the year 2012, the allocation of a case to a specific year was based on the date of notification to the public health authorities. From 2012 onwards, the allocation of a case to a specific year is based on the date of disease onset or, if unknown, the date of diagnosis or, if unknown, the date of notification. As a result, the numbers presented in this table differ from the numbers presented for the same years in previous State of Infectious Diseases reports. The table was sourced from the Dutch notifiable infectious diseases database Osiris on 17 April 2017. The number of reported cases is subject to change as cases may be entered at a later date or retracted upon further investigation. The longer the time between the period of interest and the date this table is sourced, the more likely it is that the data are complete and the less likely they are to change.
* Notifiable infectious diseases in the Netherlands are grouped according to the legal measures that may be imposed. See http://www.rivm.nl/
Onderwerpen/M/Meldingsplicht_infectieziekten for further information.
** The TB numbers presented in this table differ from the numbers presented for the same years in previous State of Infectious Diseases reports. This is due to the fact that TB notifications diagnosed abroad for which treatment in the Netherlands is continued, notifications of Mycobacterium Bovis BCG, and infections caused by non-TB mycobacteria are excluded.
*** Number of clusters, not number of cases. a Not notifiable until 3 July 2013.
b Not notifiable until 1 July 2014. c Not notifiable until 1 September 2014. d Not notifiable until 1 November 2016.
2.2 Group B1 diseases
Human infection with zoonotic influenza virus
A school-aged patient with a history of mild eczema developed a respiratory tract infection in October 2016, a couple of days after visiting a pig farm [2]. The child had entered the pigsty but had not been in direct contact with pigs. The patient’s condition deteriorated rapidly and the child required life support through extracorporeal membrane oxygenation. After the start of oseltamivir treatment and removal of mucus plugs, the patient recovered fully. The patient was diagnosed with swine influenza A(H1N1) virus of the Eurasian avian lineage. Pigs at the farm visited by the patient tested positive for the same swine influenza virus. In order to detect human-to-human transmission at an early stage, it was decided to contact all individuals that had been in close contact with the patient without wearing personal protective equipment, and monitor them for symptoms of possible swine influenza infection (cough, fever or conjunctivitis) for 10 days after exposure. In total, more than 80 contacts were monitored. Six contacts developed mild respiratory symptoms including cough, coryza and conjunctivitis during the monitoring period but all tested negative for influenza A virus. Sporadic cases of human infection with swine influenza have been reported worldwide since the late 1950s. Most of these were in individuals exposed to pigs.
2.3 Group B2 diseases
Hepatitis A
On 19 September 2016, an outbreak investigation was initiated after the notification of two cases of hepatitis A in males, in their 30s and 40s, who fell ill in mid-September [3]. Both cases identified themselves as men who have sex with men (MSM) and reported having had anonymous sexual contact during the EuroPride, which took place in Amsterdam in July/August 2016. Sequencing showed that strains from both cases were identical. Given the
international character of the EuroPride, alerts were placed on the Early Warning and Response System and on the ECDC’s Epidemic Intelligence Information System for Food- and Waterborne Diseases to inform other European countries. Between 4 July 2016 and 10 May 2017, 124 cases of hepatitis A in males were reported nationally. Of these, 54 identified themselves as MSM. In 2013, 2014 and 2015, 56, 58 and 45 male cases of hepatitis A were reported each year in the Netherlands, respectively. Of these, none were classified as MSM.
Currently, three different hepatitis A strains co-circulate among MSM in the Netherlands and in other European countries. As of 28 April 2017, 13 countries (Austria, Belgium, Denmark, Finland, France, Germany, Ireland, Italy, the Netherlands, Portugal, Spain, Sweden and the United Kingdom (England, Scotland)) had reported 674 confirmed
Figure 2.1: Annual number of Legionnaires’ disease notifications, 2007-2016
2007 2008 2009 2010 2011 2012 2013 2014 2015 2016
Annual number of legionnaires 'disease notifications
50 100 150 200 250 300 350 0
hepatitis A cases since the beginning of June 2016. Of the 665 cases with available information on gender, 531 were male. Among cases with available information on sexual orientation (n=425), the majority were MSM (n=353). Most cases were infected with a strain linked to the United Kingdom/Spain (n=336), followed by the strain linked to the EuroPride and Taiwan (n=286) and a strain first reported by Germany (n=70). The outbreak in Europe is currently still ongoing and Hepatitis A vaccination has been recommended to MSM as the main prevention measure (4).
STEC
In 2007, surveillance of Shiga toxin-producing Escherichia coli (STEC) O157 was expanded to non-O157 serotypes. This led to a steep increase in STEC notifications. Monitoring of these notifications showed that laboratory findings of STEC were not always associated with acute gastrointestinal disease. A study was undertaken to gain more insight into the relation between positive stool and gastrointestinal disease. Simultaneously, the first steps to optimise STEC surveillance were taken, decreasing the number of notifications. This process was finalised with new
notification criteria in July 2016. The most important change in the criteria is that only laboratory-confirmed cases with acute onset of gastrointestinal disease should be notified (not more than 21 days between onset and laboratory test). As a result of these changes in notification criteria, a sharp decrease of cases was observed in 2016 compared with previous years.
2.4 Group C diseases
Zika virus
Zika virus (ZIKV) is a mosquito-borne flavivirus, which caused an extensive outbreak in Latin America with a large number of human infections. Between the start of the outbreak in Brazil in 2015 and March 2017, 61 countries and territories reported the emergence of autochthonous ZIKV cases due to vector-borne transmission. In addition, there were 18 countries with active transmission where the virus already had circulated before 2015, such as Indonesia and Thailand [1]. In the three Dutch Caribbean municipalities: Bonaire, St Eustatius and Saba, the first autochthonous cases were reported in January, June and May 2016, respectively. In 2016, Bonaire reported over 400 confirmed ZIKV infections, whereas St Eustatius and Saba reported a few dozen infections (imported and autochthonous). Curacao, St Martin and Aruba, which are Dutch constituent countries, also reported large numbers of infections. In continental Netherlands, over a hundred import cases of ZIKV infection have been reported, but this is a
considerable underestimation since no routine surveillance system is in place for uncomplicated ZIKV infections.
ZIKV received much international attention due to its association with congenital anomalies, including
microcephaly, and neurological complications. This led to the declaration of ZIKV as a Public Health Emergency of International Concern (PHEIC) by the World Health Organization (WHO) in February 2016. The PHEIC stressed the importance of enhanced ZIKV surveillance and timely reporting of neurological disorders, in order to gain knowledge on the mechanisms of ZIKV infection and to guide international control efforts [2]. In order to monitor the burden of complicated ZIKV infections in the Dutch Caribbean and continental Netherlands, selected ZIKV infections became notifiable (group C diseases) from 1 November 2016. These include probable and confirmed ZIKV infections in pregnant women, women who have had a (spontaneous) abortion, newborns with congenital anomalies, hospitalised persons, persons with Guillain-Barré syndrome (GBS) and cases who died within four weeks of infection.
Worldwide until March 2017, 31 countries had reported newborns with birth defects including microcephaly and other malformations of the central nervous system, potentially associated with (congenital) ZIKV infection [3]. (Preliminary) results from various Zika pregnancy registries are being published to disseminate the current knowledge with regard to the mechanisms of ZIKV infection during pregnancy and to guide clinicians in the diagnosis and monitoring of these cases [4, 5]. In the Netherlands (both continental and the Caribbean), several ZIKV infections during pregnancy have been reported since the start of the notification requirement. Most of the pregnant cases in continental Netherlands contracted the infection while travelling in a ZIKV-epidemic area in the first trimester of pregnancy. One case of congenital microcephaly has been reported in continental Netherlands, likely due to ZIKV infection. In addition, two cases of GBS likely caused by ZIKV infection were notified in the Netherlands [6]. Twenty-three other countries have reported GBS cases associated with ZIKV infection [3].
Sexual transmission of ZIKV is possible and is of particular concern during pregnancy or the periconceptional period. For countries outside the ZIKV-epidemic areas (i.e. where the main mode of transmission via Aedes mosquitoes is absent), comprehensive recommendations have been made for the prevention of sexual transmission of ZIKV in the context of (planned) pregnancy [7]. Since February 2016, 13 countries have reported person-to-person transmission, suspected to be sexual [2]. As well as transmission from male to female, male-to-male and female-to-male transmission have been described [8, 9]. Sexual transmission is not limited to persons having symptoms of ZIKV, given that three cases of sexual transmission originated from asymptomatic men. Although detection of ZIKV-RNA in semen for up to a year
after infection has been described, the longest serial interval between the onset of the disease in one partner and onset in the other in cases of probable sexual transmission is 44 days [10]. In the Netherlands, one case of male-to-female sexual transmission has been reported. Therefore, men who return to the Netherlands from a ZIKV-epidemic area are advised to use a condom for a period of two months to prevent sexual transmission to the (pregnant) partner [5].
Tularemia
After being absent for decades, tularemia has re-emerged in the Netherlands in both hares and humans. Tularemia is a bacterial zoonosis caused by the bacterium Francisella
tularensis. Tularemia is primarily a disease of rodents and hares, but the bacterium has been detected in more than 300 animal species, including other mammals, birds, amphibians, reptiles, fish and invertebrates. Humans can become infected through several routes, including tick and deer fly bites, skin contact with infected animals, ingestion of contaminated water or meat, and inhalation of
contaminated aerosols or agricultural dust. The signs and symptoms of tularemia vary depending on the entry point of the bacteria.
Since 2011, 14 human cases of tularemia have been reported in the Netherlands, the majority (n=8) in 2016. Before that, the last reported human case was in 1953. Most cases were associated with direct contact with infected hares, or possible exposure to hares, mosquitoes or surface water. Tularemia became notifiable in November 2016 in order to allow source tracing in cases when e.g. hares are suspected to be involved as potential source of infection in order to prevent further cases and to gain more insight into transmission routes, potential reservoirs and vectors of
F. tularensis in the Netherlands.
Legionellosis
From 2014 to 2016, there was an increasing trend in domestically acquired legionellosis (Legionnaires’ disease) in the Netherlands. In 2016, a total of 468 notifications of legionellosis were received, of which 454 were cases of Legionella-pneumonia in Dutch residents. The increase in 2016 was observed only in domestic cases (infection acquired in the Netherlands). With 324 domestic cases in 2016, 273 cases in 2015 and 214 cases in 2014, the number of domestic cases in 2016 was the highest ever reported (Figure 1). The increase was spread over multiple Municipal Health Regions. No large outbreaks were detected that could explain the rise in domestic cases. Several small
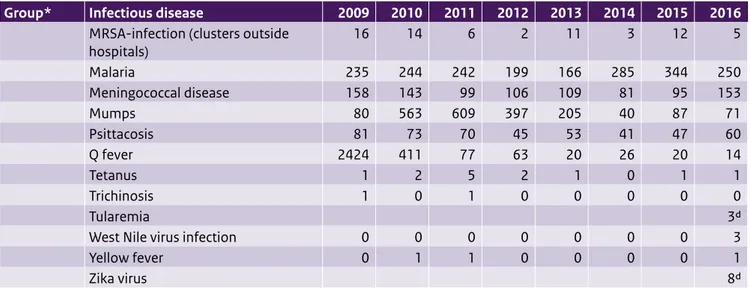
Figure 2.2: Annual number of invasive meningococcal disease notifications by serogroup, 2011-2016
0 20 40 60 80 100 120 140 160 2011 2012 2013 2014 2015 2016 other Y W C B
number of patients
geographic clusters were observed in different regions, for which no source of infection was found. In May and June 2016, an increase in cases and clusters was associated with heavy rainfall in the area in the preceding weeks. However, other clusters could not be explained through an association with warm and wet weather. In addition to the increase in May and June, more cases than usual were observed during the winter months (January–February and November–December 2016). Part of the increase may be attributed to improved case detection, since the proportion of PCR-identified cases increased slightly. However, improved diagnostics can explain only a small part of the increase. In 29% of all cases, Legionella-pneumonia was acquired abroad, the most frequently reported country of infection being Italy.
Meningococcal disease
In 2016, 151 patients with invasive meningococcal disease (IMD) were reported in the Netherlands (Figure 2). This is a 50% increase over the average of the past five years (83-117 patients per year). This increase is mainly attributable to an increase in meningococcal serogroup W (MenW) cases. Over the past years, meningococcal serogroup B (MenB) has been responsible for the majority of cases. MenW has been a rare cause of IMD in the Netherlands, responsible for a few cases each year. In 2016, MenW cases increased, with a total of 50 cases reported. MenW was therefore responsible for 33% of all IMD cases in the Netherlands in 2016. Of the MenW cases in 2016, 42% were persons 65 years or older. A similar increase has been reported in the UK, where the number of cases has risen each year since 2009: in 2008/9 MenW accounted for only 1-2% of meningococcal cases; in 2014/15 MenW caused 24% of meningococcal cases in the UK.
In the Netherlands, in 91% of the MenW patients the strain causing disease was identified as W:P1.5,2:F1–1:cc11. In the UK, the clonal complex (cc) 11 strain is associated with severe illness, which often requires treatment in intensive care and a higher death rate than other strains of meningococcal disease (13% case fatality compared with 5-10%) (http://www.meningitis.org/menw). MenW is also associated with different clinical presentations from other serogroups. Rather than meningitis or septicaemia, patients with MenW infection more often present with septic arthritis or a severe respiratory tract infection, such as pneumonia, epiglottitis or supraglottitis. Several adolescents with MenW septicaemia have presented with mainly gastrointestinal symptoms, without the characteristic non-blanching rash, and progressed rapidly to death [6]
Botulism
Botulism is a rare disease in the Netherlands, with occasional reports every few years. In 2016 two unrelated cases of botulism were reported. The first case was a Polish
man who presented at the emergency department with mydriasis and impaired swallowing. After being
hospitalised, the patient showed progressive deterioration of his motor functions and developed potential
life-threatening respiratory failure. Diagnosis, conducted by the Wageningen Bioveterinary Research, showed botulism caused by neurotoxin type B, after which antitoxin was administered. The man recovered fully. Although several products were tested, the source was not identified. The second case was an elderly woman who was
hospitalised due to dysphagia, visual impairment, vomiting and diarrhoea. The woman primarily ate natural products, had no refrigerator and preserved food by canning. On suspicion of botulism, antitoxin was administered. Faecal samples showed Clostridium botulinum-type E, which is known to occur in fish. She remembered eating salmon, but nothing was left to test. The woman recovered and was discharged from the hospital with mild dysphagia.
Botulinum toxins are neurotoxic and therefore affect the nervous system. Foodborne botulism is characterised by descending, flaccid paralysis that can cause respiratory failure. Early symptoms include marked fatigue, weakness and vertigo, usually followed by blurred vision, dry mouth and difficulty in swallowing and speaking. Vomiting, diarrhoea, constipation and abdominal swelling may also occur. The disease can progress to weakness in the neck and arms, after which the respiratory muscles and muscles of the lower body are affected. There is no fever and no loss of consciousness. The symptoms are not caused by the bacterium itself, but by the toxin produced by the bacterium. Incidence of botulism is low, but the mortality rate is high in the absence of prompt diagnosis and treatment. The disease is fatal in 5 to 10% of cases.
West Nile virus infection
In 2016, one case of West Nile virus infection was reported in a patient returning from Ontario, Canada.
A week after returning to the Netherlands, the patient was hospitalised with fever, confusion and meningitis. Based on IgM-positive ELISA, the patient was diagnosed with West Nile virus. During her stay in Canada, she had many mosquito bites. West Nile virus has been endemic to Canada since the beginning of the 21st century, with an average of 149 annual cases (range 21–428) in 2012–2016. Autochthonous West Nile virus infections have never been detected in the Netherlands, though sporadic import cases have been reported in recent years. However, the virus is seasonally present in some southeastern European countries, including Italy, Greece and Hungary. West Nile virus is transmitted to humans by mosquitoes. Most people who become infected with West Nile virus do not develop symptoms. About 1 in 5 people who are infected develop a
fever with other symptoms such as headache, body aches, joint pains, vomiting, diarrhoea or rash. Less than 1% of people who are infected develop a serious neurologic illness such as encephalitis or meningitis.
Hantavirus infection
In 2016, the first case of autochthonous Seoul hantavirus infection in the Netherlands was reported. The patient showed clinical symptoms of vomiting, diarrhoea, lower back pain, malaise and elevated liver enzyme levels. The patient had not travelled abroad; he did, however, have extensive contact with rats. After leptospirosis testing was negative, he was tested for hantavirus. The patient showed high IgG and IgM levels against viruses from the Seoul serogroup. He kept feeder rats, of which six out of ten tested PCR-positive for Seoul hantavirus. The rats came from a rat-breeding farm, which was investigated by the Netherlands Food and Consumer Product Safety Authority (NVWA) and the RIVM for the Seoul hantavirus. The majority of the adult rats that were tested were
PCR-positive for Seoul hantavirus. Preventive measures to ensure the safety of the employees of and visitors to the rat-breeding farm were undertaken.
Seoul hantavirus is carried and spread by the brown rat (Rattus norvegicus) or the black rat (Rattus rattus) and the virus has been found in both pet rats and wild rat populations
around the world. Most infected humans do not develop symptoms or have very mild symptoms. In rare cases, infection can lead to a type of acute renal disease called haemorrhagic fever with renal syndrome (HFRS), which can include low blood pressure, acute shock and acute kidney failure. The mortality is low but complete recovery can take weeks or months.
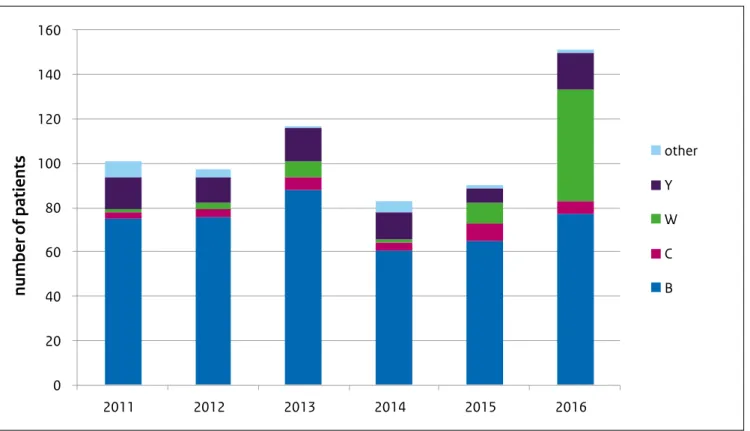
Invasive Haemophilus influenzae type b
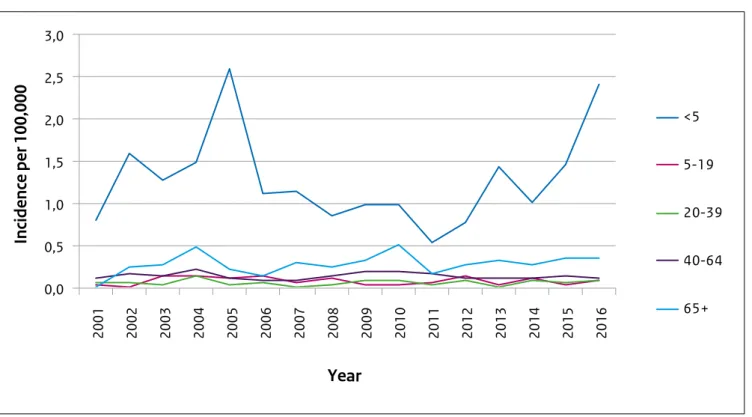
With 44 reported invasive Haemophilus influenzae type b (Hib) infections in 2016, the total number of cases was higher than in the past five years, when on average 29 cases were reported. The incidence of Hib infections was highest among children under the age of 5 years (Figure 3). In this age group the total number of Hib infections increased from 7 in 2012 (incidence 0.8/100,000) to 21 in 2016 (incidence 2.4/100,000). Hib vaccination was added to the National Immunisation Programme (NIP) in 1993 and vaccinations are scheduled at 2, 3, 4 and 11 months of age. Of the 21 Hib patients under the age of 5 years, three were too young to be vaccinated, nine were unvaccinated and nine were vaccinated with at least three doses.
The percentage of cases vaccinated and the estimated vaccine effectiveness (96%) are comparable to previous years. The cause of the increase in Hib infections is unknown. In 2005, a similar increase in Hib infections with an
unknown cause was observed.
Figure 2.3: incidence of invasive Haemophilus influenzae type b infections by age group 2001-2016
0,0 0,5 1,0 1,5 2,0 2,5 3,0 2001 2002 2003 2004 2005 2006 2007 2008 2009 2010 2011 2012 2013 2014 2015 2016
Year
<5 5-19 20-39 40-64 65+Incidence per 100,000
2.5 Key signals related to non-notifiable
infectious diseases
Tick-borne encephalitis virus
Until recently, tick-borne encephalitis virus (TBEV) was thought to be absent in the Netherlands and all cases of tick-borne encephalitis (TBE) were considered imported from endemic regions. However, on 30 June 2016, the RIVM reported that Dutch Ixodes ricinus ticks were RT-PCR positive for TBEV-Eu, without any autochthonous cases having been reported at that point. Subsequently, a person in their 60s without recent travel history suffered from neurological symptoms after a tick bite. TBEV serology was positive and the tick was PCR-positive for TBEV [7]. A few weeks later, a second case of TBEV was reported in a patient who lived near the Sallandse Heuvelrug and had no recent travel history either [8].
TBE is a viral infectious disease that attacks the central nervous system and can result in long-term neurological symptoms and even death. Approximately two-thirds of human TBEV infections are asymptomatic. The European subtype is associated with milder disease than the Far Eastern subtype, with mortality rates of 0.5–2%, and severe neurological sequels in up to 10% of patients. Ticks, specifically hard ticks of the family Ixodidae, act as both the vector and reservoir for TBEV. The main hosts are small rodents, with humans being accidental hosts. Large animals serve as feeding hosts for the ticks, but do not play a role in maintaining the transmission cycle of the virus [9].
Salmonella Enteritidis
Between May 2015 and March 2017, a large international outbreak of Salmonella Enteritidis with uncommon Multiple Locus Variable number tandem repeat Analysis (MLVA) profiles 2-9-7-3-2 and 2-9-6-3-2 was ongoing in multiple European countries. Two distinct clusters were identified using Whole Genome Sequencing (WGS), with similar MLVA profiles in both clusters. A total of 565 cases were notified, of which 202 (36%) were in the Netherlands. The majority of cases were reported in 2016 (n=174), with a sharp increase from May and a peak in September. A case-control study was conducted in the Netherlands to identify the source of the outbreak. Food questionnaires administered by municipal health services (GGD) showed that patients were more likely to have eaten in a restaurant or other food establishment than controls. No specific food item was identified from the questionnaires. Food trace-back investigations were performed by the Netherlands Food and Consumer Product Safety Authority (NVWA) in collaboration with the Netherlands Controlling Authority Eggs (NCAE) among cases who ate in food establishments, which led to the identification of eggs imported from Poland as the vehicle of infection. WGS confirmed that the strains isolated from the eggs were identical to those in
both outbreak clusters. After control measures were implemented at farm and distribution level, the number of outbreak-related cases drastically decreased.
The collaboration between MHS, laboratories, the NVWA, NCAE and the RIVM was crucial in identifying the source of the outbreak, and highlighted the importance of the rapid exchange of information in stopping international outbreaks.
2.6 International key signals
Measles
In 2016, measles outbreaks were seen in a number of EU/EEA countries; and an increase in the number of cases continues to be observed in 2017. Since February 2016, a measles outbreak has been ongoing in Romania and cases continue to be reported despite implemented and ongoing reinforced vaccination activities. As of 17 February 2017, 3071 cases have been reported to the National Institute of Public Health in Romania. According to data reported to ECDC, in the 12-month period from 1 February 2016 to 31 January 2017, eight EU/EEA countries (Austria, the Czech Republic, France, Germany, Ireland, Italy, Spain and the United Kingdom) reported a total of 34 measles cases whose probable country of infection was Romania. Thirty of the cases were reported between September 2016 and 31 January 2017.
Yellow fever
In 2016, multiple yellow fever outbreaks have been ongoing globally. On 21 January 2016, the International Health Regulation (IHR) focal point in Angola notified the WHO about an ongoing yellow fever outbreak. Until 23 December 2016, when the end of the outbreak was declared, the Angolan Ministry of Health notified 4306 yellow fever cases, 884 of which were laboratory confirmed and 376 were fatal. The case–fatality ratio among confirmed cases was 13.7% (121 of 884). All provinces in Angola reported cases during the outbreak. Since April 2017, the number of new cases has declined.
Between 1 January 2016 and 26 October 2016, the Democratic Republic of Congo reported 2909 suspected cases of yellow fever and 78 confirmed cases, of which the majority had a recent history of travel to Angola. Of the 78 confirmed cases, 16 have died since the beginning of the outbreak in 2016. More than 30 million people were vaccinated in the two countries in emergency vaccination campaigns. This key part of the response included immunisation campaigns and preventive campaigns in remote areas up until the end of the year to ensure vaccine protection for as many people in all areas of risk as possible [10].
References:
1. van Vliet JA, Haringhuizen GB, Timen A, Bijkerk P. Changes in the duty of notification of infectious diseases via the Dutch Public Health Act. Nederlands tijdschrift voor geneeskunde. 2009;153.
2. Fraaij PLA, Wildschut ED, Houmes RJ, Swaan CM, Hoebe CJ, de Jonge HCC, et al. Severe acute respiratory infection caused by swine influenza virus in a child necessitating extracorporeal membrane oxygenation (ECMO), the Netherlands, October 2016.
Eurosurveillance. 2016;21(48):30416.
3. Freidl GS, Sonder GJ, Bovee LP, Friesema IH,
van Rijckevorsel GG, Ruijs WL, et al. Hepatitis A outbreak among men who have sex with men (MSM) predominantly linked with the EuroPride, the Netherlands, July 2016 to February 2017. Euro surveillance: bulletin Européen sur les maladies transmissibles = European communicable disease bulletin. 2017;22(8):2-6.
4. ECDC. Hepatitis A outbreaks in the EU/EEA mostly affecting men who have sex with men. Stockholm: ECDC; 2017 Feb. 23.
5. RIVM. LCI-richtlijn Zikavirusinfectie: RIVM; 2017 [Available from: http://www.rivm.nl/dsresource? objectid=52ab4bb0-ba27-4328-9dac-5b94b7cd3eae&ty pe=pdf&disposition=inline].
6. Campbell H, Saliba V, Borrow R, Ramsay M, Ladhani SN. Targeted vaccination of teenagers following continued rapid endemic expansion of a single meningococcal group W clone (sequence type 11 clonal complex), United Kingdom 2015. Euro surveillance: bulletin Européen sur les maladies transmissibles = European communicable disease bulletin. 2015;20(28).
7. de Graaf JA, Reimerink JH, Voorn GP, Bij de Vaate EA, de Vries A, Rockx B, et al. First human case of tick-borne encephalitis virus infection acquired in the Netherlands, July 2016. Euro surveillance: bulletin Européen sur les maladies transmissibles = European communicable disease bulletin. 2016;21(33):2-4.
8. Weststrate ACG, Knapen D, Laverman GD, Schot B, Prick JJW, Spit SA, et al. Increasing evidence of tick-borne encephalitis (TBE) virus transmission, the Netherlands, June 2016. Eurosurveillance. 2017;22(11):6-9.
9. ECDC. Annual epidemiological report 2014 – emerging and vector-borne diseases. Stockholm: ECDC; 2014. 10. WHO. Situation report – Yellow fever. WHO; 2016 Oct 28.
3
Virological surveillance
in the Netherlands –
Virological weekly
reports
3.1 Introduction
In this chapter we provide an overview of the laboratory diagnosis of pathogens, mainly viruses, reported in the virological weekly reports. Up to 21 medical microbiological laboratories, located throughout the country, provide data for this surveillance system (Figure 3.1). The weekly voluntary reporting of these data makes the surveillance system valuable for the early detection of outbreaks and monitoring of trends in viral infections [1]. Since 2016, partly in response to the Zika virus epidemic, considerable effort has been made to include virological laboratories in the Caribbean municipalities and the overseas territories of the Netherlands in the virological surveillance. We anticipate that the virological weekly reports will be a valuable tool for gaining insight into the circulation of viruses in that part of the Caribbean. However, to date, data from these
laboratories are not yet available in the weekly reports. Table 3.1 shows the number of positive diagnoses reported in the virological weekly reports in 2016, as well as for the seven previous years. In addition, Figure 3.2 shows the stacked numbers of positive diagnoses of the most frequently reported pathogens potentially causing
respiratory (a) or gastrointestinal (b) complaints. In Section 3.2 we provide a short explanation of noteworthy events and observed trends in 2016.
Figure 3.1: The location of laboratories submitting data to the virological weekly reports (n=21)
••
•
••
••
••
•
•
•
•
•
•
•
•
•
•
••
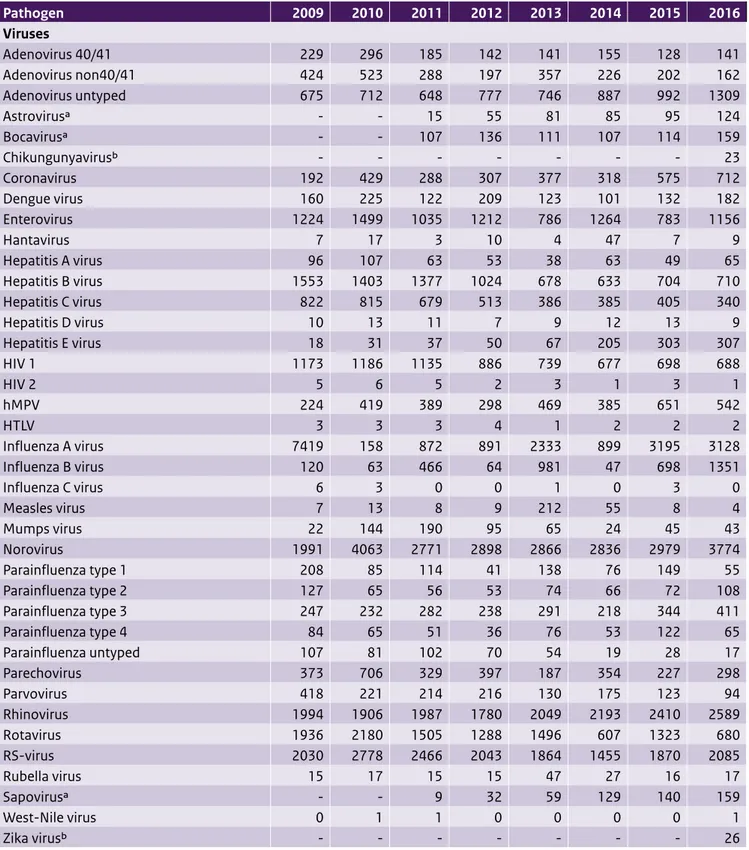
Table 3.1 Number of positive laboratory diagnoses reported in the virological weekly reports, summed by year Pathogen 2009 2010 2011 2012 2013 2014 2015 2016 Viruses Adenovirus 40/41 229 296 185 142 141 155 128 141 Adenovirus non40/41 424 523 288 197 357 226 202 162 Adenovirus untyped 675 712 648 777 746 887 992 1309 Astrovirusa - - 15 55 81 85 95 124 Bocavirusa - - 107 136 111 107 114 159 Chikungunyavirusb - - - 23 Coronavirus 192 429 288 307 377 318 575 712 Dengue virus 160 225 122 209 123 101 132 182 Enterovirus 1224 1499 1035 1212 786 1264 783 1156 Hantavirus 7 17 3 10 4 47 7 9 Hepatitis A virus 96 107 63 53 38 63 49 65 Hepatitis B virus 1553 1403 1377 1024 678 633 704 710 Hepatitis C virus 822 815 679 513 386 385 405 340 Hepatitis D virus 10 13 11 7 9 12 13 9 Hepatitis E virus 18 31 37 50 67 205 303 307 HIV 1 1173 1186 1135 886 739 677 698 688 HIV 2 5 6 5 2 3 1 3 1 hMPV 224 419 389 298 469 385 651 542 HTLV 3 3 3 4 1 2 2 2 Influenza A virus 7419 158 872 891 2333 899 3195 3128 Influenza B virus 120 63 466 64 981 47 698 1351 Influenza C virus 6 3 0 0 1 0 3 0 Measles virus 7 13 8 9 212 55 8 4 Mumps virus 22 144 190 95 65 24 45 43 Norovirus 1991 4063 2771 2898 2866 2836 2979 3774 Parainfluenza type 1 208 85 114 41 138 76 149 55 Parainfluenza type 2 127 65 56 53 74 66 72 108 Parainfluenza type 3 247 232 282 238 291 218 344 411 Parainfluenza type 4 84 65 51 36 76 53 122 65 Parainfluenza untyped 107 81 102 70 54 19 28 17 Parechovirus 373 706 329 397 187 354 227 298 Parvovirus 418 221 214 216 130 175 123 94 Rhinovirus 1994 1906 1987 1780 2049 2193 2410 2589 Rotavirus 1936 2180 1505 1288 1496 607 1323 680 RS-virus 2030 2778 2466 2043 1864 1455 1870 2085 Rubella virus 15 17 15 15 47 27 16 17 Sapovirusa - - 9 32 59 129 140 159 West-Nile virus 0 1 1 0 0 0 0 1 Zika virusb - - - 26
Table 3.1 (continued) Number of positive laboratory diagnoses reported in the virological weekly reports, summed by year Pathogen 2009 2010 2011 2012 2013 2014 2015 2016 Bacteria Chlamydia psittaci 30 29 37 23 23 16 18 32 Chlamydia pneumoniae 64 35 43 60 27 20 31 57 Chlamydia trachomatis 16,486 18,454 19,108 21,234 20,908 24,191 25,017 27,111 Chlamydia untyped 5 10 3 5 9 8 28 36 Coxiella burnetii 786 417 136 83 89 130 125 89 Mycoplasma pneumoniae 414 541 917 775 325 436 525 610 Rickettsiae 36 10 23 14 7 12 17 10
Total virological weekly reports annually 1096 1087 1082 1038 987 993 1068 1020 Annual number of laboratories which
reported ≥50 weeks 20 21 20 18 16 16 20 17
Abbreviations: HIV = human immunodeficiency virus; hMPV = human metapneumovirus; HTLV = human T-cell lymphotropic virus; RS-virus = respiratory syncytial virus.
a Included in the virological weekly reports since 2011. b Included in the virological weekly reports since 2016.
3.2 Signals based on data from the
virological weekly reports in 2016
Gastrointestinal pathogens
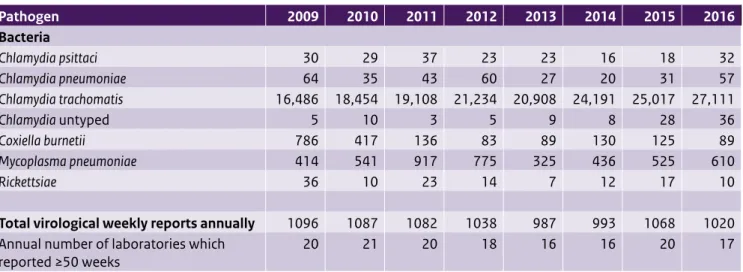
A substantial increase in reported diagnoses of norovirus was observed starting in week 38 of 2016 (Figure 3.2b). The total number of reported diagnoses of norovirus in 2016 was 3774. Taking into account the slight annual fluctuation of reporting laboratories (see bottom of Table 3.1), this corresponds to an average of 3.7 positive norovirus diagnoses per laboratory per week. In 2015 and 2014, an average of 2.8 and 2.9 norovirus diagnoses were reported per laboratory per week, respectively. These numbers suggest that the norovirus season in 2016 had a higher incidence than in previous years. This observation from the virological weekly reports was confirmed by data on all-cause gastroenteritis consultations in children under 5 years of age from the Dutch sentinel general practice network (see Chapter 4).
In the 2013/14 rotavirus epidemiologic year (August 2013 to July 2014) the number of reported rotavirus diagnoses was unexpectedly low (Table 3.1) [1]. A total of 551 rotavirus diagnoses were reported, compared with an average of 1440 (range 1237–1577) in the three previous rotavirus seasons (August 2010–July 2013). In the next epidemiologic year, 2014/15, a fairly normal rotavirus season was observed in the virological data, with 1383 reported positive
diagnoses [2]. In 2015/16, the number of reported diagnoses was again low (n=673). The current (2016/17) season follows the usual rotavirus season pattern. These observations
might indicate a transition from an annual rotavirus pattern to a biennial pattern in the Netherlands.
Respiratory pathogens
Figure 3.2a clearly shows the seasonal variation in the prevalence of respiratory pathogens, mainly of influenza A and B virus and RS-virus, whereas the other respiratory pathogens display a more constant distribution over the year. In 2016, high numbers of influenza B virus (n=1351) were reported compared with previous years (Table 3.1, Figure 3.2a). This was also observed in the NIVEL influenza surveillance, where the Victoria lineage of influenza B virus appeared to be the main circulating lineage. This lineage was not included in the trivalent influenza vaccine in 2015–2016 [3].
References:
1. Hahné S, Hooiveld M, Vennema H, van Ginkel A, de Melker H, Wallinga J, van Pelt W, & Bruijning-Verhagen P. Exceptionally low rotavirus incidence in the Netherlands in 2013/14 in the absence of rotavirus vaccination. Euro Surveillance. 2014;19(43):20945. 2. Bijkerk P, de Gier B, Nijsten DRE, Duijster JW, Soetens LC,
Hahné SJM. Chapter 4.2 Virological surveillance in the Netherlands – Virological weekly reports. State of infectious diseases in the Netherlands, 2015. 2016; RIVM Report 2016-0069.
3. Teirlinck AC et al., Annual report surveillance of influenza and other respiratory infections in the Netherlands: winter 2015/2016. 2016;RIVM Report 2016-0071.
Figure 3.2: Weekly number of positive diagnoses of the eight most frequently reported pathogens potentially causing respiratory complaints (A) and the five most frequently reported pathogens potentially causing gastrointestinal complaints (B) in the period 2015 week 27 till 2016 week 52 (hMPV = human metapneumovirus, RS-virus = respiratory syncytial virus)
2015-28 2015-32 2015-36 2015-40 2015-44 2015-48 2015-52 2016-4 2016-8 2016-12 2016-16 2016-20 2016-24 2016-28 2016-32 2016-36 2016-40 2016-44 2016-48 2016-52 2015-28 2015-32 2015-36 2015-40 2015-44 2015-48 2015-52 2016-4 2016-8 2016-12 2016-16 2016-20 2016-24 2016-28 2016-32 2016-36 2016-40 2016-44 2016-48 2016-52 0 100 200 300 400 500 600 700
Number of positive diagnoses
A
B
Year_week
Year_week
Influenza A virus RS-virus Rhinovirus Influenza B virus
hMPV Coronavirus Parainfluenza virus Mycoplasma pneumoniae
0 50 100 150 200 250 N um be r o f p o si ti ve d ia gn o se s
4
Surveillance of
infectious diseases
based on electronic
medical records in
primary care in 2016
4.1 Introduction
In the Netherlands, several sources of information are being used for the surveillance of infectious diseases, ranging from self-reported symptoms of respiratory infections (www.degrotegriepmeting.nl) to mandatory disease notifications by physicians and laboratories. A comprehensive overview of infectious disease surveillance systems in the Netherlands was published in the 2015 edition of the State of Infectious Diseases [1].
Electronic medical records (EMR) kept by general
practitioners (GPs) provide a fairly complete picture of the population’s health, since every Dutch citizen is required to be enlisted in a general practice and GPs act as gatekeepers for specialised, secondary health care. Clinical diagnoses, recorded as part of the routine care process, can be used for the surveillance of communicable and other diseases [2]. This kind of information is referred to as ‘syndromic surveillance’ [3].
4.2 NIVEL Primary Care Database
The NIVEL Primary Care Database comprises a near real-time (weekly) collection of longitudinal data from the EMR of a large sample of general practices and other primary health care providers in the Netherlands.About 300 of the 500 participating general practices use an information system that allows automatic weekly data extraction from medical records. They do not actively report patients and do not take laboratory samples for surveillance purposes, but make their EMR available for automatic, pseudonymised data extraction.
A subset of 38 general practices, the sentinel practices, actively report on patients who consult them for an acute influenza-like illness (ILI), defined according to the ‘Pel criteria’ [4]. The GP is asked to take a nose and throat swab from two ILI patients per week. The National Institute for Public Health and the Environment (RIVM) (Infectious Diseases Diagnostics and Screening Laboratory) tests the specimens for influenza and a selection of other respiratory viruses.
EMR data are extracted overnight every Monday/Tuesday and are processed at NIVEL on Tuesday mornings. After data quality checks and checks on deviations from normal patterns, results are published in the weekly ‘NIVEL Surveillance Bulletin’ on the NIVEL website on Tuesday afternoons: www.nivel.nl/surveillance. This bulletin
summarises the most important results. An update with the results from the respiratory virus diagnostics on ILI patient specimens is published on Wednesday afternoons. About 80 professionals in infectious disease control and other interested parties have signed up to receive an email on the publication of a new bulletin.
Dutch GPs use the International Classification of Primary Care (ICPC, version 1) [5] to record symptoms and diagnoses of consulting patients. Weekly rates for specific diagnoses, as well as clusters of diagnoses, are calculated as the number of patients with one or more records for the health problem concerned, using the total number of patients enlisted in the practice as denominator (weekly prevalence rate). Stratified rates are calculated for each gender, various age groups, and the different geographic regions. In addition, age-standardised prevalence ratios are calculated for the geographic regions using the age distribution of the Dutch population (direct standardisation).
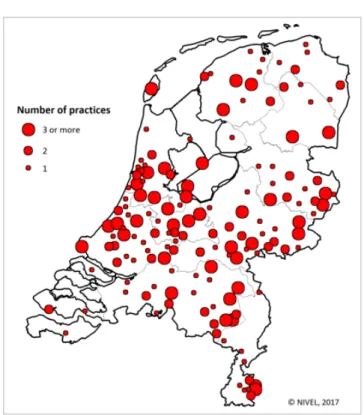
Figure 4.1: Geographical distribution of general practices contributing to the NIVEL Primary Care Database, 2016
Data from a general practice are included only if the practice is defined as ‘active’ during the week. This status is granted when the number of recorded diagnoses is at least 0.45% of the total number of enlisted patients during at least three days of the reported week, running from Monday to Sunday.
Weekly rates are visually inspected for unusual patterns of disease, while CUSUM (cumulative sum) algorithms are calculated for aberration detection [6]. Deviations from normal disease patterns, ‘signals’, are reported to the RIVM Early Warning Committee (‘Signaleringsoverleg’, see Chapter 2). Regional signals are notified to the municipal health services (GGD). Weekly numbers on ILI (sentinel practices) and ARI (EMR data) are submitted to the database hosted by the European Surveillance System (TESSy), jointly coordinated by the European Centre for Disease Prevention and Control (ECDC) and the WHO Regional Office for Europe, for the European influenza surveillance.
4.3 Privacy
Taking into account the privacy regulations in the Netherlands, a trusted third party (TTP) removes directly and indirectly identifying patient information and assigns each patient a pseudonym, before transferring data to NIVEL. Thus, NIVEL is never in the possession of personally traceable information. At NIVEL, the data are stored in a secured, NEN7510-certified database, from which weekly data extracts are generated after applying a second pseudonymisation step (two-way pseudonymisation) [7]. Dutch law allows the use of electronic health records for research purposes under certain conditions. According to this legislation, neither obtaining informed consent from patients nor obtaining approval from a medical ethics committee is obligatory for this type of observational study containing no directly identifiable data (Dutch Civil Law, Article 7:458) [8]. The privacy protocol and all agreements are laid down in a governance structure, providing stakeholders with control over the use of the data and its results.
4.4 Output and data use in 2016
In 2016, the mean number of reporting general practices was 303 (range 265–317) and the mean denominator population in these practices was 1.2 million (range 1.0–1.2, which accounts for 6–7% of the total Dutch population). The participating practices are well spread over the country, although the number of participants is limited in the South and South-West of the Netherlands (Figure 4.1). The age distribution of the enlisted population was representative
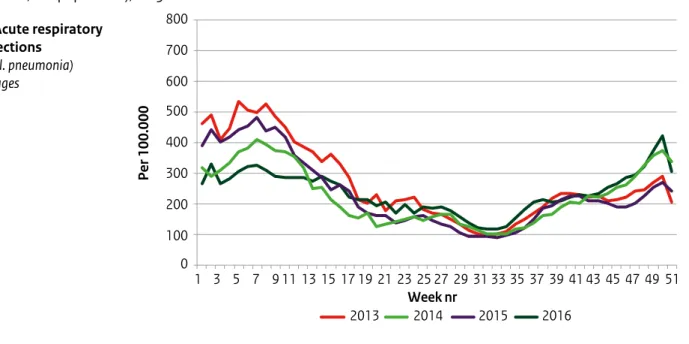
In 2016, the NIVEL weekly surveillance bulletin reported on the following symptoms and diseases: influenza-like illness (reported by the sentinel practices), the diagnostic cluster |of acute respiratory infections, pneumonia, the cluster ‘vomiting, diarrhoea or presumed gastrointestinal infection’, fever, measles, viral exanthema, mumps, conjunctivitis, acute otitis media, whooping cough, strep throat/scarlet fever, and hay fever/allergic rhinitis. In addition, patterns of some other infectious diseases were explored ad hoc, based on a reported signal from other sources reporting to the Weekly Early Warning Committee (e.g. hepatitis, scabies).
4.5 Overview of results in 2016
• Respiratory diseases: GP consultation rates for acute respiratory infections followed the expected seasonal patterns (Figure 2a). During the last weeks of 2016, relatively high rates were observed for acute otitis media (data not shown) and pneumonia among children below the age of 5 years (Figure 2d). This was in line with relatively high incidences of ILI during these weeks (Figure 2b). Whooping cough and strep throat/scarlet fever consultations were comparable to previous years (not shown).
• Gastrointestinal diseases: consultation rates were highest for young children (0–4 yrs), as usual (Figure 2e). Rates were relatively low during the first weeks and relatively high during the last weeks of 2016 compared with previous years. A study on associations with rotavirus infections is in progress.
• MMR: Consultation rates for measles, mumps or rubella among 0–4-year-olds were low throughout the year (data not shown).
• Fever: From week 6, 2016, the consultation rate for fever started was statistically significantly higher (p<0.01 based on CUSUM rates) than the average rates in 2012–2015 among children aged 5 to 14 years (Figure 2f). The peak was reached in week 8, after which rates started to decline and remained at normal levels from week 15. The signal was not confirmed by other surveillance sources at the RIVM and the increased rates remained unexplained. Other surveillance sources at the RIVM could not verify this signal and the increased rates remained unexplained.
Figure 4.2: Selected results from NIVEL Primary Care Database – surveillance: weekly consultation rates (per 100,000 population), 2013–2016 a. Acute respiratory infections (excl. pneumonia) all ages 800 700 600 500 400 300 200 100 0 1 3 5 7 9 11 13 15 17 19 21 23 25 27 29 31 33 35 37 39 41 43 45 47 49 51 Per 100.000 2014 2013 2015 2016 Week nr Figure 4.2:
ALT text: In the last weeks of 2016, consultation rates for acute respiratory infections, influenza-like illness and pneumonia were relatively high compared with other years. In the first 15 weeks of 2016, consultation rates for fever in children aged 5 to 14 were relatively high.
Figure 4.2: (continued) Selected results from NIVEL Primary Care Database – surveillance: weekly consultation rates (per 100,000 population), 2013–2016 b. Influenza-like illness (ILI) all ages 200 180 160 140 120 100 80 60 40 20 0 1 3 5 7 9 11 13 15 17 19 21 23 25 27 29 31 33 35 37 39 41 43 45 47 49 51 2014 2013 2015 2016 Week nr Per 100.000 epidemic threshold c. Pneumonia all ages 100 90 80 70 60 50 40 30 20 10 0 1 3 5 7 9 11 13 15 17 19 21 23 25 27 29 31 33 35 37 39 41 43 45 47 49 51 Per 100.000 2014 2013 2015 2016 Week nr
Figure 4.2: (continued) Selected results from NIVEL Primary Care Database – surveillance: weekly consultation rates (per 100,000 population), 2013–2016 d. Pneumonia age 0–4 years 200 180 160 140 120 100 80 60 40 20 0 1 3 5 7 9 11 13 15 17 19 21 23 25 27 29 31 33 35 37 39 41 43 45 47 49 51 Week nr Per 100.000 2014 2013 2015 2016 e. Vomiting, diarrhoea or gastro-intestinal infection age 0–4 years 800 700 600 500 400 300 200 100 0 1 3 5 7 9 11 13 15 17 19 21 23 25 27 29 31 33 35 37 39 41 43 45 47 49 51 Per 100.000 2014 2013 2015 2016 Week nr
Figure 4.2: (continued) Selected results from NIVEL Primary Care Database – surveillance: weekly consultation rates (per 100,000 population), 2013–2016 f. Fever age 5–14 years 200 180 160 140 120 100 80 60 40 20 0 1 3 5 7 9 11 13 15 17 19 21 23 25 27 29 31 33 35 37 39 41 43 45 47 49 51 Week nr Per 100.000 2014 2013 2015 2016
4.6 Concluding remarks
The NIVEL Primary Care Database uses data from the electronic medical records of general practices for surveillance purposes. The strengths of this system are the professional basis of the clinical diagnoses, the use of routinely recorded information without additional burden for GPs, and the continuous, fully automated data extraction. The coverage of the surveillance system is substantial, with more than 1 million patients spread over most of the country. Although the focus of the NIVEL surveillance system is mainly on infectious diseases, all GP-recorded symptoms and diagnoses can be monitored on a weekly basis. However, local outbreaks may remain unnoticed due to relatively small numbers. Although the surveillance of clinical diagnoses by GPs may identify potential outbreaks earlier than laboratory surveillance, the lack of laboratory test information may hamper the interpretation of signals in symptoms like fever or cough or in broadly defined diagnoses like acute respiratory infections.
A strength of the Dutch infectious disease surveillance overall is the combination of different data sources. By combining information from different data sources, epidemiologists at the RIVM can gain a comprehensive view of the state of infectious diseases in the Netherlands.
References:
1. Bijkerk P, de Gier B, Nijsten DRE, Duijster JW, Soetens LC, Hahné SJM. State of Infectious Diseases in the
Netherlands, 2015. Bilthoven: National Institute for Public Health and the Environment. 2016;Report 2016-0069. 2. Fleming DM, Schellevis FG, Paget WJ. Health monitoring
in sentinel practice networks: the contribution of primary care. Eur J Public Health. 2003;13(3 Suppl):80–4. 3. Triple S Project. Assessment of syndromic surveillance in
Europe. Lancet. 2011;378(9806):1833–4.
4. Donker GA. NIVEL Primary Care Database – Sentinel Practices 2015. Utrecht: NIVEL; 2016.
5. Lamberts H, Wood M. ICPC. International Classification of
Primary Care. Oxford: Oxford University Press; 1987. 6. Rogerson PA. Spatial surveillance and cumulative sum
methods. In: Lawson AB, Kleinman K (eds). Spatial & Syndromic Surveillance for public health. West Sussex, England: John Wiley & Sons; 2005. p. 269.
7. Kuchinke W, Ohmann C, Verheij RA, van Veen EB, Delaney B. Development towards a learning health system – experiences with the privacy protection model of the TRANSFoRm project. In: Gutwirth S et al. (eds). Data protection on the move. Dordrecht: Springer; 2016. 8. Dutch Civil Law. Article 7:458 Data for scientific research,
5
Notifiable infectious
diseases in
asylum-seekers in the
Netherlands
5.1 Introduction
In the Netherlands, the number of people applying for asylum nearly halved in 2016 compared with 2015. In 2016, the Netherlands received approximately 35,000 asylum applications compared with 60,000 in 2015 (Figure 5.1). In 2016, the majority of asylum-seekers originated from Syria; this is comparable to 2015. There was, however, a shift in the most reported countries of origin. In 2015, Iraq and Iran were in the top five countries of origin. In 2016, we see more people coming from Albania and former Yugoslavia. Since 2012, notifiable infectious diseases among asylum-seekers in the Netherlands have been monitored using Osiris, the Dutch notifiable infectious diseases surveillance system. Data on notifiable infectious diseases are collected by the municipal health services. The monitoring of tuberculosis in asylum-seekers using Osiris started in 2014 by adding a question whether or not the patient resides in an asylum centre. In this chapter, we provide an overview of notifiable infectious diseases reported in asylum-seekers residing in asylum centres in the Netherlands.
5.2 Methods
The surveillance of notifiable infectious diseases in asylum-seekers is based on disease notifications in asylum-asylum-seekers living in asylum centres and collective reception centres of the Central Agency for the Reception of Asylum-Seekers (COA). Infectious diseases in asylum-seekers not living in COA-centres (but in, e.g., municipal emergency shelters) and refugees with a residence permit living in the community (including family reunification) cannot be identified from this surveillance.
In this chapter, we have used the occupancy at COA-centres to calculate the prevalence of a disease. For the occupancy per year, we calculated the mean of the occupancy on the first day of each month from January of the given year until January of the year after. Even though fewer asylum-seekers were coming into the Netherlands in 2016, the mean occupancy at COA-centres was higher in 2016 than in 2015 (Figure 5.2). Due to the high influx in the second half of 2015, occupancy at COA-centres was high at the beginning of 2016. It decreased slowly during the course of the year.
Figure 5.1: Asylum applications in the Netherlands 2012–2016 by country of origin [1, 2] 0 10000 20000 30000 40000 50000 60000 70000 2012 2013 2014 2015 2016 Total Syria Eritrea/Ethiopia Albania Former Yugoslavia Afghanistan
Figure 5.2: Occupancy at COA-centres January 2015–December 2016
Jan-15 Feb-15 Mar-15 Apr-15 May-15 Jun-15 Jul-15 Aug-15 Sep-15 Oct-15 Nov-15 Dec-15 Jan-16 Feb-16 Mar-16 Apr-16 May-16 Jun-16 Jul-16 Aug-16 Sep-16 Oct-16 Nov-16 Dec-16
0 5000 10000 15000 20000 25000 30000 35000 40000 45000 50000
5.3 Overview of notifiable infectious
diseases in residents of COA-centres
Table 5.1 shows the number of notifications of infectious diseases reported in asylum-seekers living in asylum centres in the Netherlands by year of disease onset in the period 2013–2016. In this section, we discuss the most frequently reported infectious diseases in asylum-seekers: tuberculosis, chronic hepatitis B and malaria.Table 5.1 Number of notifications of notifiable infectious diseases in asylum-seekers by year of disease onset and as percentage of total notifications in the Netherlands, 2013–2016*
Group** 2013 (%) 2014 (%) 2015 (%) 2016 (%)
Group A1 0 0 0 0
Group B12 Tuberculosis5 n.a. 79 (9.7) 104 (12.1) 95 (10.7)
Group B23 Hepatitis A 2 (<1.0) 2 (1.9) 9 (11.4) 4 (4.9)
Hepatitis B Acute 3 (2.1) 2 (1.4) 1 (<1.0) 1 (<1.0)
Hepatitis B Chronic 70 (6.1) 91 (8.5) 106 (10.6) 107 (10.8)
Invasive group A streptococcal disease 0 2 (1.3) 1 (<1.0) 0
Measles 1 (<1.0) 0 1 (14.3) 0
Paratyphi C 0 0 1 (25.0) 0
Pertussis 8 (<1.0) 19 (<1.0) 8 (<1.0) 6 (<1.0)
STEC/enterohemorrhagic E.coli infection 0 1 (<1.0) 1 (<1.0) 2 (<1.0)
Shigellosis 0 3 (<1.0) 4 (<1.0) 2 (<1.0)
Typhoid fever 0 0 2 (11.8) 1 (5.6)
Group C4 Brucellosis 0 0 1 (11.1) 0
Hantavirus infection 0 1 (2.7) 0 0
Invasive pneumococcal disease
(in children 5 years or younger) 0 0 1 (2.3) 0
Legionellosis 0 0 1 (<1.0) 0
Malaria 6 (4.2) 106 (37.2) 126 (36.3) 42 (16.8)
Meningococcal disease 0 1 (1.2) 0 2 (1.3)
Mumps 0 0 1 (1.1) 0
Psittacosis 0 1 (2.4) 0 0
* The table was sourced from the Dutch notifiable infectious diseases database Osiris on 24 April 2017. The number of reported cases is subject to change as cases may be entered at a later date or retracted on further investigation. The longer the time between the period of interest and the date this table is sourced, the more likely it is that the data are complete and the less likely they are to change.
** Notifiable infectious diseases in the Netherlands are grouped in accordance with the legal measures that may be imposed. 1 0 cases for MERS-CoV, polio, SARS, smallpox and viral haemorrhagic fever.
2 0 cases for diphtheria, human infection with zoonotic influenza virus, plague and rabies.
3 0 cases for cholera, clusters of foodborne infection, hepatitis C acute, paratyphi A, paratyphi B and rubella.
4 0 cases for anthrax, botulism, chikungunya, Creutzfeldt-Jakob disease, Variant Creutzfeldt-Jakob disease, dengue, invasive haemophilus influenza type b infection, leptospirosis, listeriosis, MRSA infection (clusters outside hospitals), q fever, tetanus, trichinosis, West Nile virus and yellow fever. 5 It was not until 2014 that the question ‘whether or not the patient is living in an asylum centre’ was added to the tuberculosis questionnaire. N.a. = not available