research for man and environment
RIJKSINSTITUUT VOOR VOLKSGEZONDHEID EN MILIEU
NATIONAL INSTITUTE OF PUBLIC HEALTH AND THE ENVIRONMENT
RIVM report 481505014
Technical Report on Acidification,
Eutrophication and Tropospheric Ozone in
Europe: an integrated economic and
environmental assessment
J. Cofala, C. Heyes, Z. Klimont, M. Amann,
D.W. Pearce, A. Howarth
March 2001
This Report has been prepared by RIVM, EFTEC, NTUA and IIASA in association with
TME and TNO under contract with the Environment Directorate-General of the European
Commission.
Abstract
The economic assessment of priorities for a European environmental policy plan focuses on twelve identified Prominent European Environmental Problems such as climate change, chemical risks and biodiversity. The study, commissioned by the European Commission (DG Environment) to a European consortium led by RIVM, provides a basis for priority setting for European environmental policy planning in support of the sixth Environmental Action Programme as follow-up of the current fifth Environmental Action Plan called ‘Towards Sustainability’. The analysis is based on an examination of the cost of avoided damage, environmental expenditures, risk assessment, public opinion, social incidence and sustainability. The study incorporates information on targets, scenario results, and policy options and measures including their costs and benefits. Main findings of the study are the following. Current trends show that if all existing policies are fully implemented and enforced, the European Union will be successful in reducing pressures on the environment. However, damage to human health and ecosystems can be substantially reduced with accelerated policies. The implementation costs of these additional policies will not exceed the environmental benefits and the impact on the economy is manageable. This requires future policies to focus on least-cost solutions and follow an integrated approach. Nevertheless, these policies will not be adequate for achieving all policy objectives. Remaining major problems are the excess load of nitrogen in the ecosystem, exceedance of air quality guidelines (especially particulate matter), noise nuisance and biodiversity loss.
This report is one of a series supporting the main report: European Environmental Priorities: an Integrated
Economic and Environmental Assessment. The areas discussed in the main report are fully documented in the
various Technical reports. A background report is presented for each environmental issue giving an outline of the problem and its relationship to economic sectors and other issues; the benefits and the cost-benefit analysis; and the policy responses. Additional reports outline the benefits methodology, the EU enlargement issue and the macro-economic consequences of the scenarios.
Technical Report on Acidification, Eutrophication and Tropospheric Ozone
This Report has been prepared by RIVM, EFTEC, NTUA and IIASA in association with TME and TNO under contract with the Environment Directorate-General of the European Commission. This report is one of a series supporting the main report: European Environmental Priorities: an Integrated Economic and Environmental
Assessment.
Reports in this series have been subject to limited peer review.
The report consists of three parts: Section 1:
Environmental assessment
Prepared by Janusz Cofala, Chris Heyes, Zbigniew Klimont, and Markus Amann (IIASA)
This section informs on work of the International Institute for Applied Systems Analysis. Views or opinions expressed herein do not necessarily represent those of IIASA, its National Member Organizations or any other organizations sponsoring the work.
Section 2:
Benefit assessment
Prepared by D.W. Pearce, A. Howarth (EFTEC) Section 3:
Policy assessment
Prepared by D.W. Pearce, A. Howarth (EFTEC) References
All references made in the sections on benefit and policy assessment have been brought together in the Technical Report on Benefit Assessment Methodology. The references made in the section on environmental assessment follows at the end of section 1.
The findings, conclusions, recommendations and views expressed in this report represent those of the authors and do not necessarily coincide with those of the European Commission services.
Contents
1.
ENVIRONMENTAL ASSESSMENT
7
1.1 Introduction 7
1.2 Method 8
1.3 Environmental Indicators Used in the Assessment 10
1.4 Scenarios of Emission Generating Anthropogenic Activities 11
1.4.1 Energy Projections 11
1.4.2 Forecast of Activity Levels used in the VOC Module for Stationary Sources 16
1.4.3 Projections of Agricultural Livestock 16
1.5 Baseline (BL) and Technology Driven (TD) scenarios 19
1.5.1 Emission Control Measures Assumed in the Baseline Scenario 19
1.5.2 Measures in the Technology Driven Scenario 23
1.5.3 Emissions and Emission Control Costs 24
1.5.4 Impacts on Acidification and Eutrophication 28
1.5.5 Impacts on Tropospheric Ozone 33
1.6 Accelerated Policy (AP) Scenarios 38
1.6.1 Environmental Targets for the AP Scenarios 38
1.6.2 Emissions and Emission Control Costs 40
1.6.3 Impacts on Acidification and Eutrophication 42
1.6.4 Impacts on Tropospheric Ozone 46
1.7 Robustness of Results and Key Policy Actions 53
Summary and Conclusions 55
REFERENCES
57
LIST OF ABBREVIATIONS
60
2.
BENEFIT ASSESSMENT
61
2.1 Benefit assessment regarding acidification and eutrophication 61
2.1.1 Public opinion 61
2.1.2 Expert opinion 61
2.1.3 Benefit estimation 61
2.2 Benefit assessment regarding tropospheric ozone 70
2.2.1 Public opinion 70
2.2.2 Expert opinion 70
2.2.3 Benefit estimation 70
3.
POLICY ASSESSMENT
79
3.1 Policy package regarding acidification and eutrophication 79
3.1.1 Key issues 79
3.1.3 Policy initiatives summary section 84
3.2 Policy assessment regarding acidification and eutrophication 86
3.2.1 Causal criterion 86
3.2.2 Efficiency criterion 87
3.2.3 Administrative complexity 89
3.2.4 Equity criterion 89
3.2.5 Jurisdictional criterion 89
3.3 Policy package regarding tropospheric ozone 89
3.3.1 Key issue 89
3.3.2 Recommended policy initiatives 90
3.4 Policy assessment regarding tropospheric ozone 90
3.4.1 Causal criterion 90
3.4.2 Efficiency criterion 91
3.4.3 Administrative complexity: 93
3.4.4 Equity criterion 93
1. Environmental assessment
1.1 Introduction
Within the study originally called 'Economic Assessment of Priorities for a European Environmental Policy Plan', twelve prominent European environmental problems have been identified. Among them are Acidification, Eutrophication, and Tropospheric Ozone, which are subject of this Technical Report. For these three environmental problems the pressures that affect the quality of the environment are caused by the emissions of gaseous pollutants to the atmosphere, i.e., sulfur dioxide (SO2), nitrogen oxides (NOx), ammonia (NH3) and
non-methane volatile organic compounds (VOC). The major sources of SO2 and NOx emissions are fuel combustion
in power plants, other industry, transport, and in the tertiary (residential and commercial) sectors. Ammonia emissions originate mainly from agricultural activities (livestock, fertilizer use). There are two major sources of emissions of VOC: solvent use (in industry and in the tertiary sector) and vehicles (fuel evaporation and exhaust emissions).
There is substantial concern about the environmental impacts of air pollution on the local, regional and global scale. It has been shown that observed levels of various air pollutants can threaten human health, vegetation, wild life, and cause damage to materials. In order to limit the negative effects of air pollution, measures to reduce emissions from a variety of sources have been initiated. Over the last decade several international agreements have been reached in Europe to reduce emissions in a harmonized way. Protocols under the Convention on Long-range Transboundary Air Pollution focus on reducing emissions of sulfur dioxide, nitrogen oxides, and volatile organic compounds.
The European Union has adopted a dual-track policy with regard to air pollution control. Firstly, several directives have been adopted that prescribe emission standards for all member countries. Such standards are in force, e.g., for large combustion plants and for mobile sources. There are also fuel quality standards that specify the minimum requirements regarding the quality of liquid fuels used by transport sources as well as by stationary combustion facilities. Secondly, in many European countries national standards and other types of regulations (e.g., caps on emissions of specific pollutants) are in force. This national legislation reflects the seriousness of pollution in each individual country as well as national priorities regarding environmental quality. Compared with the EU-wide legislation, national policies pose further limitations on pollution levels.
The ultimate goal of environmental policy in the EU is the achievement of sustainable conditions in all member countries. Thus, in the long-run, pollution loads should be reduced to below the 'no effect' thresholds. In spite of substantial emissions reductions resulting from the implementation of current legislation, already agreed measures do not ensure sustainable conditions. This study simulates the environmental effects of current policies in the Baseline (BL) scenario. Even the Technology Driven (TD) scenario that requires the implementation of the best available control technologies (BAT) does not ensure full sustainability within the next 10 to 15 years. Thus interim targets have been proposed. Targets included in this report are in line with the targets agreed for the development of the National Emission Ceilings Directive (COM (99) 125 final, 1999).
Emissions of pollutants relevant for acidification, eutrophication and tropospheric ozone, and, in particular, emission control costs, depend to a large extent on the development of the energy system in each country. The selection of future energy supply sources has to include targets regarding mitigation of climate change. Thus, acidification, eutrophication and ground-level ozone effects have been calculated for different energy scenarios, reflecting three different strategies for reduction of climate-relevant gases.
The acidification, eutrophication and ozone strategies play also an important role in the assessment of urban stress. Thus the effects of policies aimed at controlling of the above mentioned environmental impacts are included in the assessment of measures for urban stress.
This report compares the emissions of air pollutants and their environmental impacts for five emission scenarios relevant for the study. The scenarios have been created through a combination of assumptions about the development of emitting sectors and about the emission control policies in each of those sectors. Scenarios taken into consideration are:
• the Baseline (BL) scenario,
• the Technology Driven (TD) scenario,
• the Accelerated Policy Scenario (AP), no climate change policies, i.e., mitigation of greenhouse gases emissions (AP_NC),
• the AP scenario with Kyoto targets of reduction of greenhouse gases emissions, no trade in emission rights (AP_NT)
• the AP scenario with Kyoto targets, full trade in emission rights (AP_FT).
The assessment was done with the use of the IIASA integrated assessment model RAINS. The BL scenario assumes the implementation of all control measures that are in line with current legislation (CLE) or are in the pipeline. In particular, this scenario takes into account the enforcement of all emission and fuel quality standards currently in force. It includes Community-wide legislation as well as legislation in force in each individual country in Europe. It also takes into account 'Current Reduction Plans' (CRP), i.e., the national emission ceilings that each country has committed itself to reach by 2010. The CRP values are used in the study to define caps on national emissions if these are stricter than the emissions resulting from the implementation of emission and fuel standards. The simulations include those emission control policies decided, or in the pipeline, as of December 1997. All measures or policies agreed upon after that date are not included in the Baseline. However, the newest policies are included in the calculations done for the AP scenarios.
The TD scenario assumes the adoption of all technically feasible emission control measures in all sectors of the economy. Measures and their costs are taken from the RAINS national emission control cost curves that are available for each pollutant. The cost curves take into account the limits in implementing individual technologies resulting from, e.g., plant sizes or from the turnover of capital stock. No limits on marginal control costs of individual measures were assumed. Thus, the whole feasible reduction potential, irrespective of the costs, is included in the TD scenario.
The AP scenarios are calculated on the assumption that the environmental targets of the National Emission Ceilings Directive (COM(99)125 final, 1999) are met in each EU member country in a cost-optimal way. For non-EU countries, emissions resulting from implementing Current Legislation (i.e., the Baseline values) have been used. The cost-optimal distribution of emissions reductions in individual countries has been determined with the use of the RAINS optimization routine.
Section 2 of this report describes the methodology of integrated assessment of air pollution control strategies. A short description of the RAINS model is given, together with explanations on how the model was used in the study. Section 3 describes the environmental indicators used in the assessment, and Section 4 contains a short characterization of the emission generating activities used. Sections 5 and 6 describe the emission scenarios. The assumptions made for constructing each of the scenarios, as well as the emissions, emission control costs and environmental indicators are discussed and compared. The final section provides a summary of the work done and presents the most important conclusions and recommendations.
1.2 Method
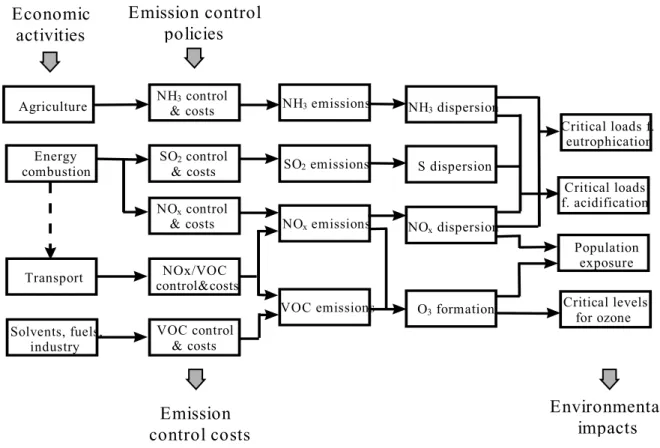
The assessment described in this study has been made with IIASA's integrated assessment model RAINS (Amann et al., 1998). RAINS provides a consistent framework for the analysis of emission reduction strategies in the European context. RAINS focuses on acidification, eutrophication and tropospheric ozone. RAINS comprises modules for emission generation (with databases on current and future economic activities, energy consumption levels, fuel characteristics, etc.), for emission control options and costs, for atmospheric dispersion of pollutants and for environmental sensitivities (i.e., databases on critical loads). In order to create a consistent and comprehensive picture of the options for simultaneously addressing the three above mentioned environmental problems, the model considers emissions of SO2, NOx, NH3, and VOC. A more detailed
description of the conceptual framework of the RAINS model can be found in Alcamo et al., 1990. A schematic diagram of the RAINS model is displayed in figure 1.2.1. A description of the individual modules of RAINS, together with a simplified version of the impact module that enables on-line calculations of the environmental impacts of user-defined emission scenarios is available on the Internet (www.iiasa.ac.at/~rains).
The European implementation of the RAINS model incorporates databases on economic activities relevant for calculations of emission levels. These include forecasts of energy consumption, data on agricultural activities (development of livestock), and other types of aggregated data on future economic development (GDP, industrial
production). Data is stored for 38 regions in Europe and the information is rather detailed. For instance, the energy database of RAINS distinguishes 22 categories of fuel use in six economic sectors (Bertok et al., 1993). The time horizon extends from the year 1990 up to the year 2010. Emissions of SO2, NOx, NH3 and VOC for
1990 are estimated based on information collected by the CORINAIR inventory of the European Environmental Agency (EEA, 1996) and on national information. Options and costs for controlling emissions of the various substances are represented in the model by considering the characteristic technical and economic features of the most important emission reduction options and technologies. Atmospheric dispersion processes over Europe for sulfur and nitrogen compounds are modeled based on results of the European EMEP model developed at the Norwegian Meteorological Institute (Barret and Sandnes, 1996). For tropospheric ozone, source-receptor relationships between the precursor emissions and the regional ozone concentrations are derived from the EMEP photo-oxidants model (Simpson, 1992, 1993). RAINS incorporates databases on critical loads and critical levels compiled at the Coordination Center for Effects (CCE) at the National Institute for Public Health and Environmental Protection (RIVM) in the Netherlands (Posch et al., 1997).
The RAINS model can be operated in the ‘scenario analysis’ mode, i.e., following the pathways of the emissions from emission sources to environmental impacts. In this case the model provides estimates of regional costs and environmental benefits of pre-defined emission control strategies. The simulation mode was used for preparation of the BL and the TD scenarios. Alternatively, an ‘optimization mode’ is available for acidification and tropospheric ozone to identify cost-optimal allocations of emission reductions in order to achieve specified deposition or ambient level targets. The optimization capability of RAINS enables the development of multi-pollutant, multi-effect pollution control strategies. Several strategies have been analyzed within the preparation process of the proposal of the Emission Ceilings Directive for the EU-15, as well as of the revised Nitrogen Protocol to the Convention on the Long-range Transboundary Air Pollution (Amann et al., 1999a, 1999b, UN/ECE, 1999). The AP scenarios presented in this report demonstrate the cost-optimal way of achieving the targets used for preparation of the National Emission Ceilings Directive.
RAINS estimates current and future levels of SO2, NOx, VOC and NH3 emissions based on information provided
by the energy and economic scenario as exogenous input, and on emission factors derived from the CORINAIR emission inventory (EEA, 1996), and national sources. Emission estimates are performed on a disaggregated level that is determined by the details available on economic, energy and agricultural projections. Although there is a large variety of options to control emissions, an integrated assessment model focusing on the pan-European scale has to restrict itself to a manageable number of typical abatement options in order to estimate future emission control potentials and costs. Consequently, RAINS identifies for each emission source category a limited list of characteristic control options and extrapolates the current operating experience to future years, taking into account the most important country- and situation-specific circumstances modifying the applicability and costs of the techniques. A list of emission control technologies included in RAINS, together with a description of the methodology adopted to estimate emission control costs and the parameters of the individual control technologies (efficiencies, unit costs) can be found in Cofala and Syri (1998a,b), Klimont et al.,(1998), Klaassen (1991), and Klimont (1998). Information about the control costs in individual countries and about emission control potentials is combined in RAINS into the national emission control cost curves. Such cost curves are created in the model for each scenario of economic activity.
Energy combustion Solvents, fuels, industry Transport Agriculture SO2emissions NOxemissions VOC emissions NH3emissions SO2 control & costs NOx/VOC control&costs NH3 control & costs NOx control & costs Critical loads f. acidification Critical loads f. eutrophication Critical levels for ozone VOC control & costs O3formation NH3dispersion S dispersion NOxdispersion
Economic
activities
Emission control
policies
Emission
control costs
Environmental
impacts
Population exposureThe RAINS Model of Acidification and Tropospheric Ozone
Figure 1.2.1 Schematic flowchart of the RAINS model framework.
1.3 Environmental Indicators Used in the Assessment
The impacts of scenarios developed within the study are evaluated with a series of indicators that allow quantification of progress towards achieving sustainable conditions. For acidification and eutrophication the indicator used is the area of ecosystems not protected against damage. The unprotected area is calculated for each country in absolute terms (i.e., in thousand hectares), as well as in relative terms (i.e., in percents of total ecosystems' area). The model also calculates gridded deposition for the individual pollutants and gridded exceedances of critical loads for each scenario. Gridded information is available from IIASA upon request. For ozone, two types of indicators (measures of exceedances) have been used. The first one (AOT40) is used for the assessment of damage to vegetation (agricultural crops). The second one (AOT60) is used for human health. Both indicators are calculated using ozone concentrations that are characteristic for rural areas.
The AOT40 is the cumulative exposure index over a threshold of 40 ppb (parts per billion). It is calculated using hourly concentrations during daylight hours over a three-month period (growing season). The critical level for agricultural crops (relating to a five percent crop loss) has been set at an AOT40 of three ppm.hours, averaged over a five-year period. The AOT40 represents the sum of the differences between the hourly ozone concentrations in ppb and 40 ppb for each hour when the concentration exceeds 40 ppb, using daylight hours only. The AOT40 indicator shows excess AOT40 over the threshold of 3 ppm hours. The index is calculated on a grid resolution and considers agricultural lands, natural vegetation and forest areas. Two types of indexes are calculated for each country: the cumulative exposure index (in million hectares.excess ppm hours) and the average index (in excess ppm.hours) that reflects the weighted average excess exposure over the whole grid area. The AOT60 index is used to quantify health-related ozone levels. It represents the cumulative excess exposure over 60 ppb, for practical reasons over a six-month period. A value of that indicator of zero is considered as an
equivalent to the WHO Air Quality Guideline for Europe (WHO, 1997)1. In this case, two different types of indexes have also been calculated. The cumulative index reflects the total exposure of a population in each country and is expressed in person.ppm.hours. This index is the result of the average exposure per person multiplied by the total population. The RAINS model calculates these indices on a grid basis (using gridded data on AOT60 and population). Next, these grid values are aggregated to the country level. The indices presented in this report use the AOT60 concentrations per grid, representing rural ozone concentrations, and the total population per grid, in 1990. Inaccuracies may occur for grids with major urban areas where the rural ozone concentrations used for these analyses present an upper bound for the concentrations in the cities, and are lower than the concentrations occurring in the city plumes. The ‘average’ indicator (in ppm.hours per person) reflects the average exposure of a person in a country, calculated from gridded data. It is important to stress that these indices may not be used to derive estimates of health damage, for which more detailed information is deemed necessary. In the context of this report, these indices provide relative measures to enable a comparison of different scenarios.
Ozone exposure in each grid used for calculation of the indices is a mean of the exposures calculated using the meteorology for the period 1989–1994. In addition, for health-related ozone exposure, maps are presented that indicate the number of days on which the WHO health guideline (60 ppb) levels are exceeded.
1.4 Scenarios of Emission Generating Anthropogenic Activities
1.4.1 Energy Projections
Inputs to the RAINS model are projections of future energy consumption on a national scale up to the year 2010. The model stores this information as energy balances for selected future years, distinguishing fuel production, conversion and final consumption for 22 fuel types in six economic sectors. These energy balances are complemented by additional information relevant for emission projections, such as boiler types (e.g., dry bottom vs. wet bottom boilers, size distribution of plants, age structures, fleet composition of the vehicle stock, etc.). In order to avoid double counting, the RAINS balances do not include fuel consumption by air transport or international marine bunkers. These items are not included in the tables that compare the scenarios.
Energy projections for the 15 EU member states used in this study are based on the work of the National Technical University of Athens for DG-XVII. The Baseline and TD emission scenarios are based on the 'Business as Usual' energy paths (BAU) (Capros et al., 1997). The AP scenarios use the energy pathways developed with the use of the PRIMES model (Capros et al., 1999) as a starting point. The aggregated results by country are presented in Table 1.4.1. Energy use by source category and fuel type is presented in Table 1.4.2.
1 The Position Paper on Ozone prepared by the Commission's Services (EC,1998) proposes a maximum
eight-hour average concentration of 60 ppb (120 µg) as the long-term environmental objective for the EU ozone strategy.
Pa ge 1 2 of 93 R IVM rep ort 48 150 501 4
Table 1
.4.1 Pro
je
ct
ions
of tot
al
pr
ima
ry
en
ergy
con
sumpt
ion for the coun
tri
es
of
the
EU-15 in
Pet
a
Joule
(
P
J)
.
Fuel u
se by
ai
r tr
anspo
rt
not
inc
lude
d.
C oun tr y 1990 2010 C hange 2010 C hange 2010 C hange 2010 C hange GDP BL 1990= 100% AP _N C BL = 100% AP _N T BL = 100% AP _F T BL = 100% [%/ A us tri a 1242 1428 15% 1401 -2% 1361 -5% 1376 -4% 2.21% Bel gi um 1907 2447 28% 2399 -2% 2183 -11% 2345 -4% 2.11% D enm ark 731 916 25% 885 -3% 826 -10% 862 -6% 2.19% F in la nd 1233 1382 12% 1564 13% 1423 3% 1487 8% 1.71% F ran ce 9122 1112 8 22% 1104 5 -1% 1076 5 -3% 1086 6 -2% 1.96% G er m any 1453 4 1517 8 4% 1430 9 -6% 1362 5 -10% 1373 5 -10% 2.28% Greece 923 1399 52% 1489 6% 1326 -5% 1400 0% 2.84% Irel an d 409 575 41% 678 18% 623 8% 661 15% 4.59% It al y 6676 8444 26% 7658 -9% 7118 -16% 7388 -13% 1.91% Lu xe m bou rg 122 129 6% 129 0% 129 0% 129 0% 2.30% Th e Th e Neth erla nd s 2737 3563 30% 3520 -1% 2855 -20% 3417 -4% 2.46% Port ug al 699 1112 59% 1176 6% 1083 -3% 1144 3% 2.97% S pai n 3612 5215 44% 5239 0% 4984 -4% 5088 -2% 2.58% Sw eden 2430 2682 10% 2513 -6% 2417 -10% 2497 -7% 1.94% U K 8544 9868 16% 9862 0% 9301 -6% 9600 -3% 2.31% E U -15 5492 0 6546 6 19% 6386 8 -2% 6002 0 -8% 6199 4 -5% 2.20%R IVM rep ort 48 150 501 4 Pa ge 1 3 of 91
Table 1
.4.2 Ene
rgy
pro
jec
tio
ns by
fu
el an
d sou
rce
cat
egor
y fo
r t
he EU-15
in P
eta
Jou
le (
P
J)
.
Fuel u
se by
ai
r tr
anspo
rt
not
inc
lude
d.
1990 2010 C hange 2010 C hange 2010 C hange 2010 So ur ce categ or y/ fu el BL 1990= 10 0 % AP _N C BL = 100% AP _N T BL = 100% AP _F T St at io na ry so ur ce s: T ot al 4466 8 5178 8 16% 5070 7 -2.1% 4735 8 -8.6% 4900 7 C oal 1156 1 6805 -41% 6747 -0.9% 3753 -44.9% 4885 L iq ui d fu el s 1189 2 1251 8 5% 1180 6 -5.7% 1009 6 -19.3% 1094 1 G as eous fu el s 1060 3 1902 9 79% 1865 8 -1.9% 1866 1 -1.9% 1912 4 O th er 1061 2 1343 7 27% 1349 7 0.4% 1484 8 10.5% 1405 8 Mo bile so ur ces -to tal 1025 1 1367 8 33% 1316 0 -3.8% 1266 1 -7.4% 1298 7 of w hic h electricit y 170 228 35% 363 59.0% 338 48.3% 347 T O T A L 5492 0 6546 6 19% 6386 8 -2.4 % 6002 0 -8.3 % 6199 4For the 15 EU countries the BAU energy scenario projects an increase in total energy consumption of 19 percent between 1990 and 2010. The demand for coal decreases by 41 percent. This decline is compensated for by a rapid increase in the demand for natural gas (79 percent by 2010) and for other fuels (nuclear, hydropower, renewable energy) by 27 percent. The demand for liquid fuels from stationary sources also increases by five percent. The transport sector is expected to grow further, which – in spite of continuing improvement in the fuel economy of new cars and trucks – results in an increase in the demand for transport fuels of 33 percent. Energy demand in the AP_NC scenario (which is a recent update of the BAU scenario and is also called ‘Baseline for Shared Analysis’) is about 2.4 percent lower than the BAU. The main reason for this lower total energy use is lower demand for liquid fuels by stationary sources (-5.7 percent) as well as by mobile sources (-3.8 percent). The other two AP scenarios are even more different from the BAU. In the scenario that assumes meeting the Kyoto target for greenhouse gases without trading (AP_NT), the total primary energy demand decreases by 8.3 percent compared with the Baseline. The demand for coal decreases by 44.9 percent. Consumption of liquid fuels by stationary sources decreases by 19.3 percent. Consumption of hydrocarbon fuels by mobile sources decreases by 7.4 percent. Simultaneously, the use of electricity in the transport sector increases compared with the Baseline. Energy demand for the AP_FT energy scenario (which allows trading in CO2 emission rights) lies between the demand for the AP_NC and the AP_NT
scenarios. Detailed discussions of the energy scenarios used in this study can be found in the references cited above. For the non-EU countries considered in RAINS, energy projections are based on data submitted by the governments to the UN/ECE and published in the UN/ECE Energy Database (UN/ECE, 1996). Recently, data for some countries (e.g., the Czech Republic, Poland, and Norway) have been revised based on inputs obtained from national experts. Where necessary, missing forecast data have been constructed by IIASA using a simple energy projection model. These forecasts (Table 1.4.3 and Table 1.4.4) were also used for the scenario calculations conducted for the negotiations on the Protocol to Abate Acidification, Eutrophication, and Ground-level Ozone under the Convention on Long-range Transboundary Air Pollution (UN/ECE, 1999).
For the non-EU countries, the energy projections imply a four percent drop in total primary energy consumption. This is due to the sharp decrease in primary energy demand that occurred in the period 1990–1995 in the countries of the former Soviet Union and in other central and east European countries with economies in transition. Processes of economic restructuring in those countries will allow further economic development while keeping the total primary energy demand until 2010 below the 1990 level. The consumption of coal and oil by stationary sources is predicted to decrease by 22 and 34 percent, respectively. Consumption of natural gas increases by 12 percent. Similar to the EU countries, the demand for transport fuels will increase by 11 percent over the period 1990–2010. In spite of a fast increase in car ownership, the increase in the demand for motor fuels is modest because of a rapid decrease in material and transport intensities in the former 'planned economy' countries. Thus, until 2010 the demand for goods transport will remain below the 1990 level.
It must be stressed that the selected energy scenario is an exogenous input to the RAINS model and does not specifically change due to constraints on emissions imposed by RAINS calculations.
Table 1.4.3 Projections of total primary energy consumption for the non-EU countries.
Country 1990 2010 Change GDP growth
[PJ] [PJ] 1990-2010 [%/year] Albania 128 143 12% 1.52% Belarus 1762 1553 -12% 0.49% Bosnia-H. 311 297 -5% -0.34% Bulgaria 1310 1276 -3% 1.00% Croatia 413 447 8% 1.44% Czech Republic 1949 1764 -10% 1.58% Estonia 423 366 -13% 0.48% Hungary 1109 1350 22% 1.73% Latvia 399 359 -10% -1.08% Lithuania 677 565 -17% -0.69% Norway 1426 1904 34% 2.00% Poland 4250 5253 24% 3.03% R. of Moldova 392 324 -17% -2.18% Romania 2425 2525 4% 1.16% Russia 18237 16617 -9% -0.37% Slovakia 987 982 0% 1.44% Slovenia 231 234 1% 3.62% Switzerland 1119 1184 6% 1.30% FYR Macedonia 151 138 -9% 0.50% Ukraine 9970 8559 -14% -1.03% Yugoslavia 790 725 -8% 0.61% Non-EU 48458 46567 -4% 0.55%
Table 1.4.4 Energy projections for the non-EU countries.
1990 2010 Change
Source category/fuel [PJ] [PJ] 1990-2010
Stationary combustion sources:
Total 43927 41414 -6%
- Coal 11487 8930 -22%
- Liquid fuels 8545 5673 -34%
- Gaseous fuels 18243 20393 12%
- Other 5652 6418 14%
Mobile sources - total 4621 5153 11%
1.4.2 Forecast of Activity Levels used in the VOC Module for Stationary
Sources
The future rates of volatile organic compounds (VOC) emitting activities, such as industrial production, fuel consumption or transport services, are derived in RAINS by modifying the present activity levels according to exogeneously provided projections for the year 2010. Unfortunately, reliable and consistent projections of future activity rates at the process level are hardly available since most long-term economic forecasts restrict themselves to a rather aggregated level of economic activities and rarely specify even the development of the main economic sectors. Therefore, the temporal changes of the activity rates are derived on the following four concepts:
1. The change of the activity rates for processing, distribution and combustion of fossil fuels is linked to changes in fuel consumption provided by the energy scenario input to RAINS. Internal consistency with the energy scenario used for calculation of SO2 and NOx emissions is maintained.
2. Some other activity rates (dry cleaning, use of solvents in households, vehicle treatment, food and drink industry) arelinked to economic growth and population development.
3. The temporal development of a number of industrial activities (e.g., degreasing, paint use, solvent use in chemical industry, printing, other industrial solvent use), is related to changes in value added generated by individual sectors. These changes are supplied with the energy scenario. In many cases, statistics suggest that these activities grow slower than the GDP. To reflect this trend, sector-specific elasticities derived from statistics have been applied.
4. In the absence of more information the activity rates for less important emission sectors are kept constant. This was typically done:
• for sectors where current emissions estimates are very uncertain (e.g., agriculture, waste treatment); • where it is difficult to identify meaningful relations with other economic activities; and
• for sectors where the increase in activity rates are expected to be offset by emission reductions induced by autonomous technical improvements.
The forecast of all activity rates linked to the assumptions of economic growth is based on the Baseline projections for the EU member countries prepared by Capros et al., 1997. Owing to the difficulty in presenting activity levels for the VOC module in an aggregated way (as for the energy and agricultural sectors) these data (both for the base year and the forecast) are not shown in this report. They are however documented and easily accessible at the web site http://www.iiasa.ac.at/~klimont/main-review.html. In addition, a report (Klimont et al., 1998) that describes the sectoral structure of the VOC module in more detail is also available at this web page.
1.4.3 Projections of Agricultural Livestock
Agricultural activities are a major source of ammonia (NH3) emissions, which in turn make a contribution to the
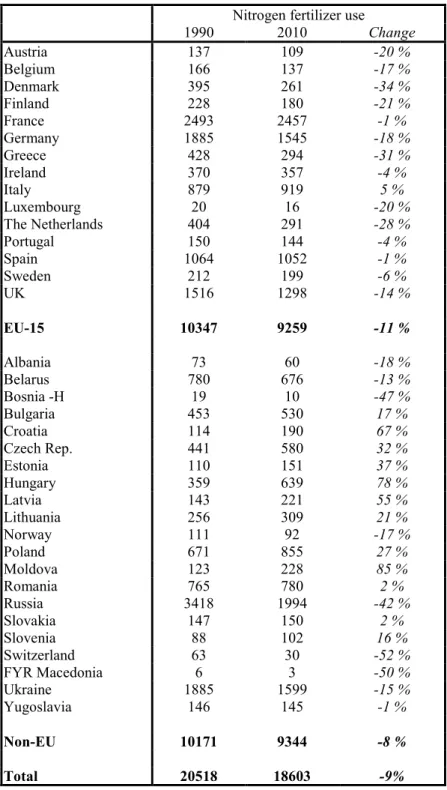
acidification and eutrophication problem. Next to specific measures directed at limiting the emissions from livestock farming, the development of animal stock is an important determinant of future emissions. IIASA has compiled a set of forecasts on European agricultural activities (Table 1.4.5), based on national information as well as on the modeling work for the EU member states done with the ECAM (European Community Agricultural Model) model (Folmer et al., 1995). Forecasts used for the Baseline and TD scenarios are identical with the forecasts used in the work on the EU National Emission Ceilings Directive (compare Amann et al., 1998). The above study also includes forecasts of fertilizer consumption for the EU-15 based on a study by the European Fertilizer Manufacturers Association (EFMA, 1996a,b) (Table 1.4.6). Since consistent alternative livestock forecasts were not available, the Baseline projection was used in all AP scenarios.
Table 1.4.5 Projection of livestock up to the year 2010 (million animals).
Cows Pigs Poultry
1990 2010 1990 2010 1990 2010 Austria 2.6 2.2 -15% 3.7 3.4 -7% 13.1 12.0 -9% Belgium 3.1 2.8 -11% 6.4 7.2 12% 23.6 40.3 71% Denmark 2.2 1.7 -23% 9.3 11.7 26% 16.2 17.4 7% Finland 1.4 0.9 -33% 1.4 1.4 -2% 9.5 8.1 -14% France 21.4 20.9 -3% 12.3 17.4 42% 236.0 279.3 18% Germany 19.5 15.7 -19% 30.8 21.2 -31% 113.9 78.6 -31% Greece 0.7 0.6 -20% 1.0 1.2 21% 27.7 33.0 19% Ireland 7.0 7.4 6% 1.0 2.2 110% 9.0 13.2 46% Italy 8.2 7.0 -15% 8.8 8.2 -7% 160.6 172.5 7% Luxembourg 0.2 0.4 78% 0.08 0.05 -33% 0.07 0.05 -28% The Netherlands 4.9 4.8 -2% 13.9 11.2 -20% 93.8 79.5 -15% Portugal 1.3 1.3 -2% 2.7 2.2 -17% 31.2 33.6 8% Spain 5.1 6.0 17% 16.0 20.3 27% 44.9 83.1 85% Sweden 1.7 1.8 5% 2.3 2.4 4% 12.6 12.6 0% UK 12.1 10.4 -14% 7.5 7.8 5% 136.4 141.0 3% EU-15 91.6 83.9 -8% 117.1 117.8 1% 929 1000 8% Albania 0.6 0.8 21% 0.2 0.3 17% 5.0 8.4 68% Belarus 7.2 4.3 -40% 5.2 4.0 -23% 49.8 43.3 -13% Bosnia -H 0.9 0.7 -22% 0.6 0.6 -10% 9.0 8.0 -11% Bulgaria 1.6 0.9 -41% 4.4 4.3 -2% 36.3 43.6 20% Croatia 0.8 0.6 -27% 1.6 1.3 -17% 15.0 8.4 -44% Czech Rep. 3.4 3.4 3% 4.6 5.8 26% 33.3 49.1 48% Estonia 0.8 0.6 -28% 1.1 1.2 9% 7.0 7.8 11% Hungary 1.6 1.6 -3% 9.7 7.9 -19% 58.6 63.5 8% Latvia 1.5 0.7 -52% 1.6 1.5 -7% 11.0 7.6 -31% Lithuania 2.4 2.2 -7% 2.7 2.8 2% 18.0 19.2 7% Norway 1.0 0.7 -25% 0.7 0.8 10% 5.4 5.3 -2% Poland 10.0 12.9 28% 19.5 23.8 22% 70.0 97.8 40% R. Moldova 1.1 1.0 -13% 2.0 1.5 -27% 25.0 19.0 -24% Romania 6.3 6.2 -2% 11.7 10.3 -12% 119.3 146.8 23% Russia 42.2 27.3 -35% 30.5 30.5 0% 474.3 326.5 -31% Slovakia 1.6 0.8 -44% 2.5 2.6 2% 16.5 22.0 34% Slovenia 0.5 0.4 -22% 0.6 0.7 18% 13.5 12.9 -4% Switzerland 1.9 1.7 -8% 1.8 1.4 -22% 6.5 6.5 0% FYR Macedonia 0.3 0.3 -1% 0.2 0.2 7% 22.0 22.0 0% Ukraine 25.2 20.5 -19% 19.9 23.0 15% 255.1 260.0 2% Yugoslavia 2.2 2.0 -8% 4.3 4.1 -5% 28.0 21.0 -25% Non-EU 113.0 89.6 -21% 125.4 128.3 2% 1279 1199 -6% Total 204.6 173.5 -15% 242.5 246.1 2% 2207 2203 -0%
Table 1.4.6 Projections of nitrogen fertiliser use (in 1000 tons N/year).
Nitrogen fertilizer use
1990 2010 Change Austria 137 109 -20 % Belgium 166 137 -17 % Denmark 395 261 -34 % Finland 228 180 -21 % France 2493 2457 -1 % Germany 1885 1545 -18 % Greece 428 294 -31 % Ireland 370 357 -4 % Italy 879 919 5 % Luxembourg 20 16 -20 % The Netherlands 404 291 -28 % Portugal 150 144 -4 % Spain 1064 1052 -1 % Sweden 212 199 -6 % UK 1516 1298 -14 % EU-15 10347 9259 -11 % Albania 73 60 -18 % Belarus 780 676 -13 % Bosnia -H 19 10 -47 % Bulgaria 453 530 17 % Croatia 114 190 67 % Czech Rep. 441 580 32 % Estonia 110 151 37 % Hungary 359 639 78 % Latvia 143 221 55 % Lithuania 256 309 21 % Norway 111 92 -17 % Poland 671 855 27 % Moldova 123 228 85 % Romania 765 780 2 % Russia 3418 1994 -42 % Slovakia 147 150 2 % Slovenia 88 102 16 % Switzerland 63 30 -52 % FYR Macedonia 6 3 -50 % Ukraine 1885 1599 -15 % Yugoslavia 146 145 -1 % Non-EU 10171 9344 -8 % Total 20518 18603 -9%
1.5 Baseline (BL) and Technology Driven (TD) scenarios
1.5.1 Emission Control Measures Assumed in the Baseline Scenario
The emissions and environmental impacts of the Baseline scenario include emission control policies according to the current legislation in each country. This scenario simulates the likely impacts of current emission abatement policies and regulations for the year 2010. The simulations done for the Baseline include the emission control policies as decided or in the pipeline by December 1997. All measures or policies agreed upon after that date are not included in the Baseline2.
In order to capture the ‘dual-track’ policies in Europe (regulations on emission standards for specific source categories and ceilings for national total emissions), the scenario mimics the implications of these approaches. First, the simulations of the effects of ‘Current Legislation’ (CLE) were performed. The emissions resulting from the implementation of present and (already accepted) future legally binding emission control legislation were calculated for each European country. Next, these emissions were compared with the officially adopted or internationally announced ceilings on national emissions, so-called ‘Current Reduction Plans’ (CRP), (EMEP, 1999). Finally, for further analysis the more stringent value from CLE and CRP was taken for each country. The ceilings for the 'Current Reduction Plans' (CRP) are based on an inventory of the national caps on emissions that each country has committed itself to reach by 2010. Such declarations of envisaged future emissions result from national plans as well as from the various protocols to the Convention on Long-range Transboundary Air Pollution (UN/ECE, 1988, UN/ECE, 1994a, b). The CRPs are collected on a routine basis by the Secretariat of the Convention. The analysis in this study uses the CRP values as of June 1998.
For SO2 and NOx, the scenario is based on a detailed inventory of regulations on emission controls, taking into
account the legislation in the individual European countries, the relevant Directives of the European Union, in particular the Large Combustion Plant Directive – LCPD (OJ, 1988), and the directives on the sulfur content of liquid fuels, i.e., gas oil (Johnson and Corcelle, 1995), heavy fuel oil (COM(97)88), as well as the obligatory clauses regarding emission standards from the protocols under the Convention on Long-range Transboundary Air Pollution. For instance, the Second Sulfur Protocol (UN/ECE, 1994a) requires emission controls according to ‘Best Available Technology’ (BAT) for new plants.
An inventory of national and international emission standards in Europe can be found in Bouscaren & Bouchereau (1996). In addition, information on power plant emission standards has been taken from the survey of the IEA Coal Research (McConville, 1997). For countries of Central and Eastern Europe the environmental standards database developed by the Central European University (CEU, 1996) has also been used.
For the control of NOx and VOC emissions from mobile sources, the scenario considers the implementation of
the current UN/ECE legislation as well as country-specific standards if stricter. For the Member States of the European Union the current EU standards for new cars, light commercial vehicles and heavy duty vehicles (HDV) have been taken into account: the Directives 70/220/EEC as amended by 96/69/EC, and 88/77/EEC as amended by 96/1/EC; see McArragher et al. (1994). Additionally, the scenario assumes for all EU countries after the year 2000 the implementation of the measures outlined in the Communication COM(96) 248 presenting the results and consequences from the Auto/Oil 1 Programme (EC, 1996). The ‘Common Positions’ of the Council on the envisaged legislation referred to by this Communication and the Commission's proposal on emissions from HDV (COM(97) 627) is also taken into account. This includes vehicle-related measures like improved catalytic converters, engine modifications and on-board diagnostic systems. Furthermore, the impacts of the envisaged improved inspection and maintenance practices and the changes in fuel quality are incorporated. The pace of the implementation of the vehicle-related measures depends on the turnover of vehicle stock and has been based on modeling work performed for the Auto/Oil 1 study.
SO2, NOx, and VOC control measures assumed in individual countries or groups of countries are specified in
Tables 1.5.1 to 1.5.6.
Table 1.5.1 Control measures for SO
2emissions in EU countries.
Stationary and mobile sources:
§ Emission standards for new plants from the Large Combustion Plant Directive - LCPD (OJ, 1988) and from the Second Sulfur Protocol (UN/ECE, 1994a).
§ Limits on sulfur content of gas oil for stationary and mobile sources and for heavy fuel oil as in the appropriate directives (compare Johnson and Corcelle, 1995, COM(97)88).
§ National emission standards on stationary sources if stricter than the international standards.
Table 1.5.2 Control measures for SO
2emissions in the non-EU countries.
Stationary and mobile sources:
Signatories of the Second Sulfur Protocol (Bulgaria, Croatia, Czech Republic, Hungary, Norway, Poland, Russian Federation, Slovak Republic, Slovenia, Switzerland, Ukraine) - New plant emission standards and limits on the sulfur content of gas oil for stationary and mobile sources as in the Protocol.
Czech Republic, Croatia, Norway, Poland, Slovak Republic, Slovenia, Switzerland, Romania, Yugoslavia - national emission standards on existing and new plants.
Table 1.5.3 Control measures for NOx emissions in EU countries.
Stationary sources:
§ Emission standards for new plant and emission ceilings for existing plant from the Large Combustion Plant Directive - LCPD (OJ, 1988). These standards require implementation of primary emission measures (combustion modification) on large boilers in the power plant sector and in industry.
§ National emission standards on stationary sources – if stricter than in the LCPD. Mobile sources:
§ EU standards for cars and light commercial vehicles (LCV) (Directive 70/220/EC du Conseil, du 20 mars 1970, concernant le rapprochement des législations des États membres relatives au mesures à prendre contre la pollution de l'air par les gaz provenant des moteurs à allumage commandé équipant les véhicules à moteur, OJ 76, 6.4.70, p. 1, as amended by 96/69/EC, OJ L 282, 1.11.96, p. 1)
§ EU standards for heavy duty vehicles (HDV) according to Council Directive 88/77/EC of 3 December 1987 on the approximation of the laws of the Member States relating to the measures to be taken against the emission of gaseous pollutants from diesel engines for use in vehicles, OJ L 36, 9.2.88, p. 33, as amended by 96/1/EC, OJ L 40, 17.2.96
§ EU standards for non-road machinery engines (Directive 97/68/EC of the European Parliament and the Council of 16 December 1997 on the approximation of laws of the Member States relating to measures against the emissions of gaseous and particulate pollutants from internal combustion engines to be installed in non-road mobile machinery, OJ L 59, 27.2.98, p. 1-85, as well as for mopeds and motorcycles (Directive 97/24/EC of the European Parliament and the Council of 17 June 1997 on certain components and characteristics of tow or three-wheel motor vehicles, OJ L 226, 18.8.97, p. 1)
§ From 2000 - fuel quality and emission standards (for LDV, LCV, HDV) and improved inspection/maintenance, as resulting from the Auto/Oil Programme (Communication from the Commission to the European Parliament and the Council on a future strategy for the control of atmospheric emissions from road transport taking into account the results from the Auto/Oil Programme (COM(96) 248, 18.6.1996- compare EC, 1996), amended by the Common Positions of the Council related to LDV, LCV, fuels and by COM(97) 627, 3.12.97, on HDV-emissions. These standards are assumed to be implemented in the EU-15 as well as in Norway and in Switzerland.
Table 1.5.4 Control measures for NO
xemissions in the non-EU countries.
Stationary sources:
§ Czech Republic, Croatia, Hungary, Norway, Poland, Slovak Republic, Slovenia, Switzerland, Romania, Yugoslavia – controls according to national emission standards on new and existing sources.
§ Other countries in Central and Eastern Europe – no control3.
Mobile sources:
§ Czech Republic, Hungary, Poland, Slovak Republic, Slovenia - National mobile source standards comparable with 1992 and 1996 standards for the EU (requirement for catalytic converters for gasoline engines and combustion modifications on diesel engines).
§ Other CEE countries - pre-1990 UN/ECE standards on mobile sources (no requirement for catalytic converters for gasoline engines and for combustion modifications on diesel engines).
Table 1.5.5 Measures assumed to control VOC emissions for EU countries.
Stationary sources:
§ Emission ceilings and standards from the Solvent Directive (Proposal for a Council Directive on limitation of emissions of volatile organic compounds due to the use of organic solvents in certain industrial activities (COM(96) 538, 6.11.96).
§ Stage I controls on gasoline storage and distribution - European Parliament and Council Directive 94/63/EC of 20 December 1994 on the control of volatile organic compound (VOC) emissions resulting from the storage of petrol and its distribution from terminals to service stations, OJ L 365, 31.12.94, p. 24 (EC, 1994).
§ Stage II according to existing legislation in Austria, Belgium, Denmark, Germany, Italy, Luxembourg, The Netherlands, and Sweden.
Mobile sources:
§ All directives and legislation acts aimed at a reduction of emissions from mobile sources mentioned for NOx also apply to VOC.
§ Passenger cars – small canister according to the Council Directive 91/441/EEC of 26 June 1991 amending directive 70/220/CEE on the approximation of the laws of the Member States relating to measures to be taken against air pollution by emissions from motor vehicles, OJ L 242, 30.8.91, p. 1–6 (EC, 1991).
Table 1.5.6 Measures assumed to control VOC emissions for non-EU countries.
Stationary sources:
§ National legislation for solvent use and gasoline storage and distribution (Stage I and Stage II) in Norway and Switzerland.
Mobile sources:
§ All directives and legislation acts aimed at a reduction of emissions from mobile sources mentioned for NOx also apply to VOC.
§ Introduction of small carbon canisters in Norway and Switzerland consistent with the Council Directive 91/441/EEC, EC, 1991.
§ For Czech Republic, Hungary, Poland, Slovakia and Slovenia it is assumed that in the year 2010 part of the fleet will be equipped with small carbon canisters following the EU Council Directive 91/441/EEC, EC, 1991.
3 Because measures depending on implementation of primary NO
x reduction measures on new power plants are
For VOC, the scenario assumes the implementation of the Solvent Directive of the EU (COM(96)538, 1997) as proposed by the Commission. Furthermore, the obligations of the VOC Protocol of the Convention on Long-range Transboundary Air Pollution (UN/ECE, 1994b) were incorporated. For mobile sources, the measures pertaining to the regulations on carbon canisters of Directive 91/441/EEC complemented by the proposed amendment of Dir. 70/220 in the Auto/Oil 1 package are assumed to be fully implemented. Emissions from non-road mobile machinery engines are subject to Directive 97/68/EC. It was further assumed that VOC emissions from gasoline distribution will be controlled through the Stage-I measures in all the EU countries (reflecting the Directive 94/63/EC, EC, 1999), and in Norway and Switzerland. Some of the European countries also have legislation requesting stage II controls on gasoline stations (compare Table 1.5.5 and Table 1.5.6).
For ammonia, values for the 'No control' scenario (or CRP – if lower) were adopted.
1.5.2 Measures in the Technology Driven Scenario
The Technology Driven (TD) scenario assumes – for the EU countries – the implementation of all possible technical control measures in all sectors. However, this scenario includes the constraints resulting from limited possibilities of retrofitting existing emission sources, and limited applicabilities of available technologies to small plants. Consequently, the emissions from the end points of the RAINS emission abatement cost curves have been taken as the maximum feasible reductions (MFR) values. RAINS cost curves include country-specific conditions, such as the size of the plants, turnover of capital stock in industry as well as in the transport sector, farm size, natural conditions (land shape) etc. Examples of the measures included in the TD scenario for individual pollutants are described below.
Sulfur dioxide (SO2)
1. High efficiency (wet and regenerative, if applicable) flue gases desulfurization (FGD) on existing and new large boilers in the power plant and industrial sectors;
2. Use of low sulfur fuels and simple FGD techniques for smaller combustion sources in industry, in the residential and commercial sectors;
3. High efficiency controls on process emission sources. Nitrogen oxides (NOx)
1. Selective catalytic reduction (SCR) at large plants in industry and in the power sector;
2. Combustion modifications (CM) for smaller sources in industry and in the residential and commercial sectors;
3. High efficiency controls on process emission sources;
4. Post-2005 standards on mobile sources for road and off-road transport; 5. CM and SCR for ships operating in coastal zones.
Ammonia (NH3)
To achieve the maximum feasible reduction levels, the most advanced abatement measures have to be applied for all categories. Although there are differences between countries, depending on the applicability of some of the options in particular regions, the importance and relevance of them might vary. A typical set of controls would include the following options:
Substitution of urea fertilizers;
1. Low emission housing with covered storage of manure and low ammonia application techniques for slurry (dairy cattle, pigs, poultry);
2. Rapid incorporation of solid manure (cattle, pigs, poultry, sheep); 3. Low nitrogen feed and biofiltration (pigs - where applicable); 4. End-of-pipe controls in industry (fertilizer manufacturing). Non-methane volatile organic compounds (VOC)
The VOC module of RAINS includes more emission categories than other parts of RAINS. Also the control options are somewhat less homogeneous across the sectors, i.e., only rarely can the same abatement option be applied in several emission categories. The importance of various categories, as well as the applicability of certain options, also varies significantly from country to country. A typical set of control options, applied in major emission categories, necessary to achieve TD levels is presented below (note that some sectors and options will not appear on this list as they are already part of current legislation):
1. Gasoline distribution – Stage II on gasoline stations;
2. Refineries (process) – regular inspection and maintenance, covers on oil/water separators, flaring and incineration;
3. Chemical industry – regular monitoring, flaring as well as control of the evaporative loses from storage; 4. Solvent use:
• dry cleaning – new closed circuit machines;
• degreasing – water based systems, low temperature plasma process, conveyored degreasers with integrated adsorption (depending on applicability);
• use paints – full use of potential for substitution with low solvent products both in 'do it yourself' and industrial applications, additionally in industry modification of application methods and introduction of solvent management plans; and
• application of glues and adhesives – modification of application techniques as well as substitution.
1.5.3 Emissions and Emission Control Costs
This section discusses the emissions of air pollutants and the emission control costs for the BL and the TD scenarios. The control costs include additional production costs of low sulfur fuels as well as costs of pollution control equipment necessary to reach the assumed emission standards or ceilings. The costs were calculated by the RAINS model in constant 1990 prices using an annual cost method with a four percent real interest rate. For the needs of this study the costs were converted to € 1997 prices using the deflator 27.4 percent.
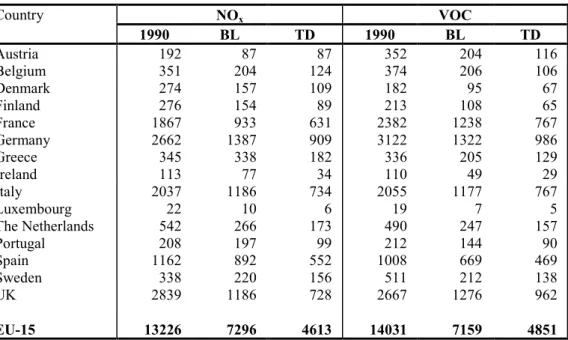
Tables 1.5.7 and 1.5.8 show the emissions of pollutants contributing to acidification, eutrophication and tropospheric ozone for the EU countries. Emission levels for the non-EU countries are shown in Table 1.5.9. The 1990 emission values for all countries are given as calculated by the RAINS model. The implementation of the policies assumed in the Baseline scenario (BL) substantially decreases the emission levels. For EU-15 as a whole, SO2 emissions will be reduced by 71 percent compared to 1990. NOx will decrease by 45 percent and ammonia
by 12 percent. VOC is expected to decline by 49 percent. Lower relative reductions are foreseen for the non-EU countries with SO2 declining by 55 percent, NOx by 36 percent, ammonia by 14 percent, and VOC by 20 percent.
Implementation of TD measures in the EU-15 would cut SO2 emissions in this group of countries by 89 percent,
NOx by 65 percent, ammonia by 40 percent and VOC by 65 percent, compared with 1990. Per definition, changes
to the structure and the levels of economic activities and energy consumption, e.g., as reactions to excessive emission control costs or measures resulting from non-technical instruments to control emissions, are not taken into account in the TD scenario. It should be stressed that for non-EU countries, control policies (and thus the emissions of pollutants) remain the same as in the Baseline.
Table 1.5.7 NOx and VOC emissions in the EU-15 in 1990, and in 2010 for the Baseline (BL) and for the Technology Driven (TD) scenarios (in kilotons).
Country NOx VOC 1990 BL TD 1990 BL TD Austria 192 87 87 352 204 116 Belgium 351 204 124 374 206 106 Denmark 274 157 109 182 95 67 Finland 276 154 89 213 108 65 France 1867 933 631 2382 1238 767 Germany 2662 1387 909 3122 1322 986 Greece 345 338 182 336 205 129 Ireland 113 77 34 110 49 29 Italy 2037 1186 734 2055 1177 767 Luxembourg 22 10 6 19 7 5 The Netherlands 542 266 173 490 247 157 Portugal 208 197 99 212 144 90 Spain 1162 892 552 1008 669 469 Sweden 338 220 156 511 212 138 UK 2839 1186 728 2667 1276 962 EU-15 13226 7296 4613 14031 7159 4851
Table 1.5.8 SO2 and NH3 emissions in the EU-15 for 1990, and in 2010 for the Baseline (BL) and for the Maximum Feasible Reductions (MFR) scenarios (in kilotons).
Country SO2 NH3 1990 BL TD 1990 BL4 TD Austria 93 49 36 77 67 48 Belgium 336 208 77 97 96 57 Denmark 182 90 24 77 72 40 Finland 226 116 57 40 31 23 France 1250 487 171 805 771 541 Germany 5280 740 450 757 571 353 Greece 504 371 54 80 74 59 Ireland 178 94 30 127 126 111 Italy 1679 593 209 462 432 282 Luxembourg 14 4 2 7 7 7 The Netherlands 201 84 49 233 136 105 Portugal 284 145 30 71 67 46 Spain 2189 793 172 352 353 225 Sweden 119 59 53 61 53 44 UK 3805 980 380 329 297 218 EU-15 16339 4813 1795 3576 3153 2156
4 Emissions of ammonia in 2010 include changes in 'Current Reduction Plans' for Italy and France. Because of
that change, the Baseline emissions are by 70 kilotons higher for France and by 16 kilotons higher for Italy compared with estimates done in the earlier phases of the Study.
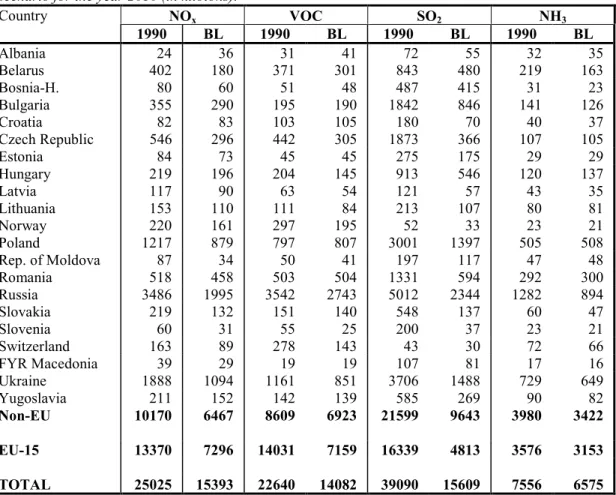
Table 1.5.9 Emissions of atmospheric pollutants in the non-EU countries for 1990, and for the Baseline (BL) scenario for the year 2010 (in kilotons).
Country NOx VOC SO2 NH3 1990 BL 1990 BL 1990 BL 1990 BL Albania 24 36 31 41 72 55 32 35 Belarus 402 180 371 301 843 480 219 163 Bosnia-H. 80 60 51 48 487 415 31 23 Bulgaria 355 290 195 190 1842 846 141 126 Croatia 82 83 103 105 180 70 40 37 Czech Republic 546 296 442 305 1873 366 107 105 Estonia 84 73 45 45 275 175 29 29 Hungary 219 196 204 145 913 546 120 137 Latvia 117 90 63 54 121 57 43 35 Lithuania 153 110 111 84 213 107 80 81 Norway 220 161 297 195 52 33 23 21 Poland 1217 879 797 807 3001 1397 505 508 Rep. of Moldova 87 34 50 41 197 117 47 48 Romania 518 458 503 504 1331 594 292 300 Russia 3486 1995 3542 2743 5012 2344 1282 894 Slovakia 219 132 151 140 548 137 60 47 Slovenia 60 31 55 25 200 37 23 21 Switzerland 163 89 278 143 43 30 72 66 FYR Macedonia 39 29 19 19 107 81 17 16 Ukraine 1888 1094 1161 851 3706 1488 729 649 Yugoslavia 211 152 142 139 585 269 90 82 Non-EU 10170 6467 8609 6923 21599 9643 3980 3422 EU-15 13370 7296 14031 7159 16339 4813 3576 3153 TOTAL 25025 15393 22640 14082 39090 15609 7556 6575 Notes:
1. Russia includes only the European part within the EMEP region. 2. TOTAL also includes emissions from sea regions.
Table 1.5.10 demonstrates the emission control costs for the scenarios. The costs of the ‘Baseline’ measures for the EU-15 are about € 67.3 billion/year. SO2 control costs contribute about 16 percent to total costs. Since there
are currently no emission standards for NH3 emissions from agriculture, the BL cost includes the costs of
achieving the CRP emission level by each country in a cost-optimal way. Costs of NOx and VOC controls
contribute 84 percent to total costs. They have been summed-up since measures in the transport sector reduce the emissions of both pollutants, and an allocation of the costs to NOx and VOC emissions would be arbitrary. These
costs are quite high because current legislation requires strict and expensive controls on transport sources. For the non-EU countries the total costs are about € 12.3 billion/year (compare Table 1.5.11), of which about one third are for SO2 controls and the balance are the costs of NOx and VOC controls.
For the EU-15 the costs of the TD measures (€ 110.5 billion/year) are 64 percent higher than the costs of the BL case. The SO2, NOx and VOC control costs in the TD scenario are only 43 to 44 percent higher than in the BL.
This is because current legislation already requires strict controls on emissions. In the case of ammonia, the situation is different. The very low cost of the BL scenario increases by a factor of 30 if the TD measures are applied to all emission sources in agriculture.
Table 1.5.10 Emission control costs in the EU-15 for 2010 for the Baseline (BL) and for the TD scenarios (in € million/year).
Country NOx + VOC SO2 NH3 Total cost
BL TD BL TD BL TD BL TD Austria 1270 1680 251 279 0 299 1520 2259 Belgium 1649 2441 405 678 0 632 2054 3749 Denmark 755 1051 171 284 0 883 927 2218 Finland 738 1171 251 452 0 180 989 1803 France 8363 12247 1298 1933 0 2824 9661 17005 Germany 13578 18351 2506 3667 0 2314 16084 24330 Greece 954 1852 255 599 0 283 1209 2734 Ireland 310 547 126 218 11 591 447 1356 Italy 9226 12869 2284 2502 0 870 11511 16241 Luxembourg 80 129 11 19 18 19 111 166 The Netherlands 2268 3405 287 357 301 1366 2855 5128 Portugal 1449 2195 194 334 0 476 1642 3005 Spain 6426 8682 865 1477 36 2603 7327 12762 Sweden 1293 1845 278 308 38 293 1610 2446 UK 8041 12292 1305 2049 0 981 9346 15321 EU-15 56401 80754 10488 15154 404 14614 67293 110522
Table 1.5.11 Emission control costs in the non- EU countries for 2010 for the Baseline (BL) scenario (in € million/year).
Country NOx+VOC SO2 NH3 Total
Albania -4 0 0 -4 Belarus 242 4 0 246 Bosnia-H. 1 0 0 1 Bulgaria 1 214 0 215 Croatia 5 66 0 71 Czech Rep. 706 543 4 1252 Estonia 0 0 0 0 Hungary 557 211 0 768 Latvia 42 19 0 61 Lithuania 42 0 0 42 Norway 676 56 0 731 Poland 3140 1089 20 4250 Moldova 57 0 0 57 Romania -3 199 1 196 Russia 1032 899 0 1930 Slovakia 420 120 0 539 Slovenia 147 61 0 208 Switzerland 964 90 0 1055 FYR Macedonia 1 0 0 1 Ukraine 186 423 0 609 Yugoslavia 4 113 0 117 Non-EU 8217 4106 24 12348 EU-15 56401 10488 404 67293 Total 64617 14594 428 79639
1.5.4 Impacts on Acidification and Eutrophication
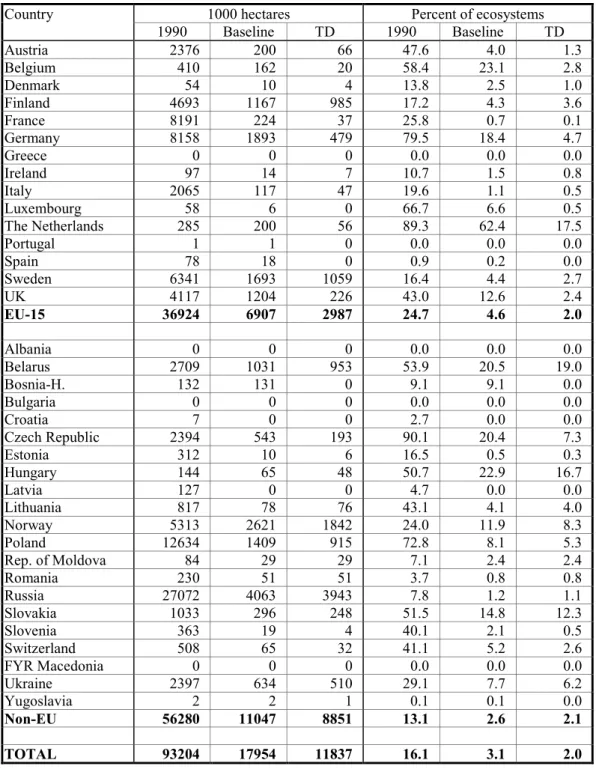
The threat of acidification and eutrophication of the analyzed control strategies can be expressed by a comparison of the areas of ecosystems receiving deposition above their critical loads. The results are shown in Table 1.5.12 and in Table 1.5.13. The tables clearly demonstrate that the emission control measures assumed for the BL scenario would already significantly improve the situation for acidification. The share of unprotected ecosystems decreases in the EU-15 from about 25 percent in 1990 to 4.6 percent in 2010. For the non-EU countries the BL scenario reduces the unprotected ecosystems from about 13 percent to 2.6 percent. For some countries the improvement is even greater: in Germany the area not protected decreases from 80 percent to 18 percent; in the Netherlands from 89 percent to 62 percent.
Improvements also occur in the protection levels of eutrophication. Again, an important change already happens in the BL scenario. For the EU-15 the percentage of unprotected ecosystems decreases from 55 percent in 1990 to 41 percent in 2010. In the non-EU countries unprotected ecosystems shrink from 23 percent to 15 percent. However, for some countries the protection levels remain dramatically low. For instance, in Belgium, Germany, Luxembourg and the Netherlands more than 90 percent of ecosystems remain unprotected. In the non-EU region, low protection levels (more than 70 percent of ecosystems not protected) occur in the Czech Republic, Lithuania, Poland, the Slovak Republic and Switzerland.
The TD scenario would further reduce negative environmental impacts. For the EU countries, those ecosystems not protected against acidification would shrink to two percent, and 24 percent of the ecosystems would remain unprotected against eutrophication. The spatial distribution of the improvement is presented in Figure 1.5.1 and in Figure 1.5.2. The maps show the percentage of ecosystems additionally protected as a result of implementing the TD measures compared to the protection achieved in the BL scenario.
In spite of the fact that emission levels for the non-EU countries in the TD scenario remain the same as in the BL, important side benefits from emission reductions in the EU countries can be identified. For instance, in the Czech Republic 13 percent of ecosystems becomes additionally protected against acidification and 12 percent against eutrophication. In Switzerland the improvement is about three percent (acidification) and 22 percent (eutrophication).
Table 1.5.12 Ecosystems with acid deposition above their critical loads for acidification in 1990 and for the BL and TD scenarios in 2010.
Country 1000 hectares Percent of ecosystems
1990 Baseline TD 1990 Baseline TD Austria 2376 200 66 47.6 4.0 1.3 Belgium 410 162 20 58.4 23.1 2.8 Denmark 54 10 4 13.8 2.5 1.0 Finland 4693 1167 985 17.2 4.3 3.6 France 8191 224 37 25.8 0.7 0.1 Germany 8158 1893 479 79.5 18.4 4.7 Greece 0 0 0 0.0 0.0 0.0 Ireland 97 14 7 10.7 1.5 0.8 Italy 2065 117 47 19.6 1.1 0.5 Luxembourg 58 6 0 66.7 6.6 0.5 The Netherlands 285 200 56 89.3 62.4 17.5 Portugal 1 1 0 0.0 0.0 0.0 Spain 78 18 0 0.9 0.2 0.0 Sweden 6341 1693 1059 16.4 4.4 2.7 UK 4117 1204 226 43.0 12.6 2.4 EU-15 36924 6907 2987 24.7 4.6 2.0 Albania 0 0 0 0.0 0.0 0.0 Belarus 2709 1031 953 53.9 20.5 19.0 Bosnia-H. 132 131 0 9.1 9.1 0.0 Bulgaria 0 0 0 0.0 0.0 0.0 Croatia 7 0 0 2.7 0.0 0.0 Czech Republic 2394 543 193 90.1 20.4 7.3 Estonia 312 10 6 16.5 0.5 0.3 Hungary 144 65 48 50.7 22.9 16.7 Latvia 127 0 0 4.7 0.0 0.0 Lithuania 817 78 76 43.1 4.1 4.0 Norway 5313 2621 1842 24.0 11.9 8.3 Poland 12634 1409 915 72.8 8.1 5.3 Rep. of Moldova 84 29 29 7.1 2.4 2.4 Romania 230 51 51 3.7 0.8 0.8 Russia 27072 4063 3943 7.8 1.2 1.1 Slovakia 1033 296 248 51.5 14.8 12.3 Slovenia 363 19 4 40.1 2.1 0.5 Switzerland 508 65 32 41.1 5.2 2.6 FYR Macedonia 0 0 0 0.0 0.0 0.0 Ukraine 2397 634 510 29.1 7.7 6.2 Yugoslavia 2 2 1 0.1 0.1 0.0 Non-EU 56280 11047 8851 13.1 2.6 2.1 TOTAL 93204 17954 11837 16.1 3.1 2.0
Figure 1.5.1 Ecosystems additionally protected against acidification in 2010 in the TD scenario compared with the BL scenario (in percent of the ecosystems’ area).
5 1 1 7 4 5 1 1 27 4 6 1 2 1 7 2 1 41 7 24 78 13 6 4 9 10 1 24 34 11 20 3 53 17 1 7 27 1 16 3 58 31 1 8 18 1 1 31 100 1 23 21 17 9 26 23 2 20 17 21 11 9 11 1 26 9 9 1 2 3 2 1 22 13 24 6 8 4 5 4 1 15 11 7 6 7 7 4 2 5 1 1 3 3 2 5 7 1 1 8 3 1 3 3 1 1 1 1 6 1 2 1 1 1 1 3 14 16 18 20 22 24 26 28 30 32 34 36 38 1 2 3 4 5 6 7 8 9 10 11 12 13 14 15 16 17 18 19 20 21 22 23 24 25 26 27 28 29 30 31 32