This investigation has been performed for the account of the Ministry of Housing, Spatial Planning and the Environment of the Netherlands, Directorate General for the Environment (DGM), Directorate of Soil, Water and Rural Areas (BWL), within the framework of project 711701, Risk in relation to Soil Quality. This investigation was initiated by the concerted action CLARINET (Contaminated Land Rehabilitation Network), Working Group Human Health.
RIVM, P.O. Box 1, 3720 BA Bilthoven, Phone +31.30.2749111; Fax: +31.30.2742971
Variation in calculated human exposure Comparison of calculations with seven European human exposure models
Abstract
Twenty scenarios, differing with respect to land use, soil type and contaminant, formed the basis for calculating human exposure from soil contaminants with the use of models
contributed by seven European countries (one model per country). Here, the human exposures to children and children calculated by each of the models are compared. All calculations were performed twice: once with a prescribed set of parameters and once with the default data used in the different countries. Exposure via the three major exposure pathways of soil ingestion, crop consumption and indoor air inhalation was calculated in each case. Relevant
concentrations in contact media and the soil compartments were also calculated. Evaluation of variations in the calculated exposure for each major exposure pathway, and factors affecting the variation, have led to the following main conclusions:
• The variation in calculated exposure is large for exposure via indoor air inhalation, substantial for exposure via crop consumption and limited for exposure via soil ingestion. • The variation in calculated exposure is mainly influenced by the choice of exposure model
and, to a lesser extent, by the selection of contaminant and type of input parameter (standardised or default). The variation in calculated exposure is scarcely dependent on soil use and even less on soil type.
• Miscommunication is a source (difficult to avoid) for variation in calculated exposure. Besides the above, characteristics of human exposure models and default values for the input parameters used in different countries have also been overviewed. One recommendation for the long term would be to construct a toolbox for use in the whole or part of Europe that would allow standardised assessment of human exposure, with the possibility of including flexible (country-specific) elements.
Preface
Recognising the value of a comparative study of human exposure models this project was initiated within the concerted actions CLARINET (Contaminated Land Rehabilitation Network), Working Group Human Health. As a result, a number of organisations directly or indirectly involved in the concerted action have begun a collaborative study based on the human exposure models that they have been responsible for developing. They are:
•
the National Institute for Industrial Environment and Risks (INERIS), France;•
the National Environmental Protection Agency (ANPA), Italy;•
the Flemish Institute for Technological Research (VITO), Flanders, Belgium;•
Kemakta Konsult AB, Sweden;•
University of Nottingham, Land Quality Management (LQM), UK;•
DHI Water and Environment and Danish Toxicological Centre, Denmark;•
LABEIN Technological Centre, Basque Country, Spain;•
the National Institute of Public Health and the Environment (RIVM), the Netherlands. Besides the NICOLE (Network on Contaminated Land) exposure factor dataset (ECETOC, 2001) has been included in this study.The calculation were performed by the organisations mentioned above in the period 2000-2001.
Acknowledgement
In 1999 all participants were enthusiastic about the idea of a human exposure model
comparison study. This was found something very useful and everybody agreed to participate, without hesitation. However, adapting the models and performing the calculations (40
scenarios!) was more work than most of us could expect. Moreover, nobody could foresee how many questions they got to answer during the course of the project and on how many chapters, tables and documents it was ask to comment. Realising that most of the work had to be done in between the daily routine (most of the participants did most of the work in time that was not planned or paid for) the author sincerely appreciates the efforts and many useful comments. Therefore, the author would like to thank Ms.dr. Francesca Quercia (the National Environmental Protection Agency (ANPA), Italy), Ms.dr. Roseline Bonnart (the National Institute for Industrial Environment and Risks (INERIS), France), Ms. Christa Cornelis (the Flemish Institute of Technology and Development (VITO), Flanders, Belgium), Ms.dr. Naomi Earl and dr. Paul Nathanail (University of Nottingham, Land Quality Management (LQM), UK), Mr. Mark Elert (Kemakta Konsult AB, Sweden), Mr. Piet Otte (the National Institute of Public Health and the Environment (RIVM), the Netherlands), Ms. Dorte Rasmussen (DHI Water and Environment and Danish Toxicological Centre, Denmark), Ms.dr. Rosemary Zaleski (Exxon Biomedical Sciences, Inc.) and Ms.dr. Arantzazu Urzelai Azkune (LABEIN Technological Centre, Basque Country, Spain).
In the definition stage of the project RIVM colleague Mr. Leo Bouwmans proved to be a motivating sparring-partner. In the later stages of the project RIVM colleague Mr. Johannes Lijzen enriched the developments in the project with intellectual comments. Finally, the efforts of the RIVM colleagues Ms. Gea Stegen and Ms. Susan Sollie (editing data and text) and Mr. Dick de Zwart (reviewing the draft report) are appreciated.
Contents
UITGEBREIDE SAMENVATTING...7 EXTENDED SUMMARY...10 1. INTRODUCTION ...13 1.1 Background ...13 1.2 Purpose ...14 2. PROCEDURE...15 2.1 Collection of information...15 2.2 Participating models ...15 2.3 Activities ...173. GENERAL MODEL INFORMATION ...19
3.1 Dependencies between the models and model applications ...19
3.2 Model layout...21
3.3 Model possibilities...24
3.4 Model use...26
4. OVERVIEWING INPUT PARAMETERS ...31
4.1 Data organisation...31
4.2 Conclusions...40
4.2.1 Human characteristics...40
4.2.2 Input parameters in relation to Exposure via crop consumption...40
4.2.3 Input parameters in relation to Exposure via inhalation of indoor air ...41
4.2.4 Input parameters related to other exposure pathways...41
4.2.5 Contaminant-specific input parameters ...41
5. COMPARISON OF CALCULATED EXPOSURE...43
5.1 Scenarios...43
5.2 Outputs ...44
5.4 Procedure...48
5.4.1 Visual interpretation ...48
5.5 Contribution of separate exposure pathways to total exposure...50
5.6 Results...53
5.6.1 Insight in the variation in calculated human exposure...53
5.6.1.1Total exposure, adult ...53
5.6.1.2 Exposure via separate exposure pathways ...56
5.6.1.3 The influence of site characteristics on exposure via separate exposure pathways...58
5.6.2 Understanding the variation in calculated human exposure...65
5.6.2.1 Exposure via soil ingestion ...66
5.6.2.2 Exposure via crop consumption...67
5.6.2.3 Exposure via indoor air inhalation...73
5.7 Discussion ...78
5.7.1 Acceptance of the variation in calculated exposure...78
5.7.2 Communication ...81
5.7.3 Harmonisation of human exposure calculations ...83
6. CONCLUSIONS AND RECOMMENDATIONS ...85
6.1 Conclusions...85
6.1.1 Exposure models ...85
6.1.2 Input parameters ...86
6.1.3 Variation in exposure ...87
6.1.4 Procedure on calculating human exposure ...90
6.2 Recommendations ...90
REFERENCES ...93
APPENDIX 1: MAILING LIST ...95
APPENDIX 2: DETAILED INFORMATION ON THE EUROPEAN HUMAN EXPOSURE MODELS ...97
CETOX-human (Denmark)...97
CLEA D.D. (United Kingdom) ...100
CSOIL 8.0 (The Netherlands) ...104
LUR (Basque Country, Spain) ...107
NoNameGiven (France) ...110
NoNameGiven (Sweden) ...113
ROME 01 (Italy)...117
Uitgebreide samenvatting
De betrouwbaarheid van berekening van de humane blootstelling aan contaminanten in de bodem is beperkt, als gevolg van onzekerheden in model concepten en input parameters. Het vergelijken van blootstelling berekend met verschillende blootstellingsmodellen en uitgaand van dezelfde uitgangspunten, kan een indruk geven van de mate van onbetrouwbaarheid. Met dit doel is de blootstelling berekend met zeven verschillende Europese modellen vergeleken. Uitwisseling van de benodigde informatie vond plaats op basis van een questionnaire en daaropvolgende email-communicatie. De volgende modellen participeerden in dit project: • CETOX-human (Denemarken);
• CLEA D.D. (Verenigd Koninkrijk); • CSOIL 8.0 (Nederland);
• ROME 01 (Italië);
• Vlier-humaan (Vlaanderen, België); • een naamloos model uit Zweden; • een naamloos model uit Frankrijk.
Er werd van het intensieve communicatienetwerk dat in dit project onstond geprofiteerd door toevoeging van de volgende activiteiten:
• Het geven van een overzicht van algemene karakteristieken van de blootstellingsmodellen. • Het geven van een overzicht van standaard input parameters die in de verschillende
procedures worden gebruikt.
Ten behoeve van beide activiteiten werd tevens het LUR blootstellingsmodel (Baskenland, Spanje) in beschouwing genomen. Voor de tweede activiteit werd de NICOLE dataset in het overzicht opgenomen.
Scenario's
Om de berekening van de humane blootstelling met elk van de zeven Europese modellen mogelijk te maken werden twintig scenario’s gedefinieerd. Deze verschillen voor wat betreft bodemgebruik (woonsituatie en industrieterrein), bodemtype (zand- en kleibodem) en type contaminant. De volgende vijf contaminanten, die verondersteld worden algemeen binnen Europa voor te komen en die verschillen voor wat betreft de blootstellings-karakterstieken, werden beschouwd: benzo(a)pyreen (PAK), cadmium (metalen), atrazine (pesticiden), benzeen (aromatische verbindingen) en trichloroetheen (vluchtige alifatische verbindingen). Alle
blootstellingsberekeningen werden in tweevoud uitgevoerd: eenmaal met een voorgeschreven set van input parameters en eenmaal met de input parameters die worden gebruikt in de
verschillende landen.
In elke berekening werd blootstelling voor kinderen en volwassenen via de drie belangrijkste blootstellingsroutes berekend, namelijk: via grondingestie, via gewasconsumptie en via inhalatie binnenlucht. Bovendien werden de concentraties in de contactmedia en in de
Resultaten
In paragraaf 6.1.1 zijn conclusies getrokken over de karakteristieken van de Europese blootstellingsmodellen. Deze conclusies zijn gericht op de relatie tussen de verschillende Europese modellen onderling en op de opzet, mogelijkheden en wijze van gebruik van deze blootstellingsmodellen.
In paragraaf 4.2 is een overzicht gegeven van de relevante input parameters, welke in de zeven modelbenaderingen worden gebruikt. Bovendien worden in paragraaf 6.1.2 conclusies
getrokken over de variatie in deze input parameters voor wat betreft humane karakteristieken en contaminant-specifieke input parameters, alsmede over de input parameters die specifiek worden gebruikt bij de berekening van de blootstelling via gewasopname, via inhalatie binnenlucht en via de overige blootstellingsroutes.
In paragraaf 6.1.3 zijn de 90% betrouwbaarheidsintervallen gegeven. De variatie in de berekende uitkomsten is als volg samengevat:
Totale
bl.stelling Bl.stellingvia grond-ingestie Bl.stelling via gewas-consumptie Bl.stelling via inhalatie binnenlucht Conc. knol-gewassen Conc. blad-gewassen Conc. binnen-lucht Conc. poriën-water Conc. bodem-lucht Beperkt x x Aanzienlijk x x x Groot x x x x
De volgende (willekeurige) indeling is gebruikt:
• Beperkte variatie: De meerderheid van de uitkomsten ligt binnen een factor 5 hoger en een factor 5 lager dan de
scenario-medianen.
• Aanzienlijke variatie: De meerderheid van de uitkomsten ligt binnen een factor 10 hoger en een factor 10 lager dan de
scenario-medianen
• Grote variatie: De meerderheid van de uitkomsten ligt binnen een factor 100 hoger en een factor 100 lager dan de
scenario-medianen.
Bovendien werden de volgende conclusies getrokken voor wat betreft de variatie in berekende blootstelling:
Inzicht in de variatie in berekende bloostelling:
• Voor Totale blootstelling, Blootstelling via gewasconsumptie en Blootstelling via inhalatie
binnenlucht lijkt de variatie ten gevolge van de verschillen in modelconcepten te
overheersen ten opzichte van verschillen door gebruik van verschillende input parameters. Alleen voor Blootstelling via grondingestie neemt de variatie duidelijk toe wanneer de land-specifieke input parameters in plaats van de gestandaardiseerde input parameters worden gebruikt. Voor alle typen blootstelling werden een aantal extreme waarden
berekend, dat wil zeggen waarden die “sterk afwijken” van de mediane waarden. De meest extreme waarden werden berekend in de volgende afnemende volgorde: Blootstelling via
inhalatie binnenlucht (hoge extremen) > Totale blootstelling (lage extremen) > Blootstelling via gewasconsumptie (hoge en lage extremen) > Blootstelling via grondingestie (lage extremen).
Verklaring van de variatie in berekende bloostelling:
• De meerderheid van de modellen dragen bij aan een grote variatie in de berekende blootstelling. Bovendien is de variatie in berekende blootstelling (Totale blootstelling,
sterk afhankelijk van het type contaminant. Alleen voor Blootstelling via grondingestie is de variatie in de blootstelling nauwelijks afhankelijk van het type contaminant. De variatie in blootstelling is nauwelijks afhankelijk van bodemgebruik en nog minder van
bodemtype.
• Er is een sterke relatie tussen Blootstelling via inhalatie binnenlucht en de variatie in
Concentratie in binnenlucht. Dit suggereert dat de factoren die de variatie in Concentratie in binnenlucht bepalen, namelijk Concentratie in de bodemlucht, Oppervlakte en volume van het huis of gebouw en de Ventilatiefrequentie, tevens de variatie in Blootstelling via inhalatie binnenlucht bepalen.
• Daarentegen is er geen duidelijke relatie tussen de variatie in Blootstelling via
voedingsgewassen en de variatie in Concentratie in voedingsgewassen (wortel- of
bladgewassen). Dit suggereert dat de input parameters Totale (wortel- en
blad-)gewasconsumptie en Fractie van wortel- en bladgewassen uit eigen tuin de variatie
in Blootstelling via gewasconsumptie (mede) beïnvloeden.
• De variatie in Concentratie in poriewater is niet duidelijk gerelateerd aan de variatie in
Blootstelling via gewasconsumptie of aan de variatie in Concentratie in wortel- of bladgewassen.
• De variatie in Concentratie in de bodemlucht is niet duidelijk gerelateerd aan de variatie in
Blootstelling via inhalatie binnenlucht of aan de variatie in Concentratie in de bodemlucht.
Aanbevelingen
• Er dient nader onderzoek te worden verricht naar de variatie in berekende blootstelling. Hierbij zal de aandacht zich onder andere moeten richten op de invloed van de model-algoritmen op de variatie in berekende blootstelling. Om dit doel te verwezenlijken zullen internationale experts op het gebied van berekening van humane blootstelling actief moeten participeren in dit nader onderzoek.
• Op de langere termijn dient een toolbox te worden geconstrueerd voor gebruik op Europees niveau. Deze toolbox moet de volgende elementen bevatten:
• Protocollen voor die elementen die te harmoniseren zijn (“gestandaardiseerde model tools” en “gestandaardiseerde input parameter tools”);
• flexibele elementen (“flexibel model tools” en “optionele parameter tools”), om
tegemoet te kunnen komen aan land-specifieke (geografische, etnologische en politieke) elementen;
• een methodiek die aangeeft hoe de humane blootstelling moet worden bepaald,
inclusief een beschrijving van de gevoeligheden van de berekende blootstelling voor de input parameters en een richtlijn die aangeeft wanneer en hoe de concentraties in de contactmedia moeten worden gemeten.
Extended summary
The reliability of calculated human exposure to contaminants in soil is limited because of uncertainties about model concepts and input parameters. A way to gain insight into the reliability of calculated exposure is to compare calculated exposures using different human exposure models. To this purpose, calculated outputs from seven European models have been compared. Information has been exchanged on the basis of a questionnaire and subsequent email communication. The following models participated in this project:
• CETOX-human (Denmark); • CLEA D.D. (United Kingdom); • CSOIL 8.0 (The Netherlands); • ROME 01 (Italy);
• Vlier-humaan (Flanders, Belgium); • an unnamed model from Sweden; • an unnamed model from France.
Use was made of the intensive communication network that was developed within the project, which resulted in the following additional activities:
• Overviewing general information of human exposure models.
• Overviewing default values for the input parameters used in different approaches.
To these purposes also the LUR exposure model (Basque Country, Spain) has been included. To the second purpose the NICOLE dataset has been included in the overview.
Scenarios
To be able to calculate human exposure with each of the seven European models twenty scenarios have been defined. These scenarios differ in respect to land use (residential and industrial), soil type (sandy soil and clay soil), and type of contaminant. The five following contaminants, which have been assumed to be common throughout Europe and have different exposure characteristics, have been considered: benzo(a)pyrene (PAH), cadmium (metals), atrazine (pesticides), benzene (aromatic compounds) and trichloroethene (volatile aliphatic compounds). All exposure calculations have been performed twice for all twenty scenarios: once with a prescribed set of parameters and once with the data that is used in the different countries. In each calculation exposure to children and adults via the following three major exposure pathways is calculated: via soil ingestion, via crop consumption and via indoor air inhalation. Besides the relevant concentrations in contactmedia and in the soil compartments were calculated.
Results
In section 6.1.1 conclusions have been drawn about the characteristics of the European exposure models. These conclusions have been focused on mutual dependencies between the European exposure models and layout, possibilities and use of the European exposure models. In section 4.2 an overview is given of all relevant input parameters that are used in the seven European model approaches. Conclusions have been drawn about the variation in these input parameters in section 6.1.2 for the human characteristics and contaminant-specific input
parameters, as well as for the input parameters that relate to exposure via crop consumption, exposure via indoor air inhalation and to exposure via other exposure pathways.
In section 6.1.3 the 90% confidence limits of the calculated outputs have been presented. The variation in the calculated outputs has been summarised as follows:
Total
exposure Exp.viasoil ingestion Exp.via crop con-sumption Exp.via indoor air inhalation Conc.root
vegetables Conc.leafy vegetables Conc. indoor air Conc. pore water Conc. soil air Limited x x Substantial x x x Large x x x x
The following (arbitrary) categorisation has been used:
• Limited variation: The majority of the outputs is within a factor of 5 higher and a factor of 5 lower than the scenario
medians.
• Substantial variation: The majority of the outputs is in between a factor of 10 higher and a factor of 10 lower than the
scenario medians: there is a "substantial variation" in the calculated human exposures.
• Large variation: The majority of the outputs is in between a factor of 100 higher and a factor of 100 lower than the
scenario medians.
• Huge variation: The majority of the outputs is not in between a factor of 100 higher and a factor of 100 lower than the
scenario medians.
Furthermore the following conclusions on the variation in calculated exposure have been drawn:
Insight in variation in exposure:
• For Total exposure, Exposure via crop consumption, and Exposure via indoor air
inhalation the variation from different model concepts seems to dominate over the
variation from using different input parameters. Only for Exposure via soil ingestion variation clearly increase when country-specific default parameters are used instead of standardised input parameters.
• For each type of exposure a few extreme values have been calculated, i.e. values that are “very different” from the median value. Most extreme values are calculated in the following decreasing order: Exposure via indoor air inhalation (high extremes) > Total
exposure (low extremes) > Exposure via crop consumption (low and high extremes) > Exposure via soil ingestion (low extremes).
Understanding variation in exposure:
• The majority of the models contribute to large variation in calculated exposure. Besides, variation in calculated exposure (Total exposure; Exposure via indoor air inhalation and especially Exposure via crop consumption) is strongly dependent on the type of
contaminant. Only for Exposure via soil ingestion the variation in calculated exposure is scarcely dependent on type of contaminant. The variation in exposures is scarcely dependent on soil use and even less on soil type.
• There is a strong relation between variation in Exposure via indoor air inhalation and variation in Concentration in indoor air. This suggests that the factors that control the variation in Concentration in indoor air, i.e. Concentration in soil air, Surface and
Volume of the house or building, Ventilation frequency, also control the variation in Exposure via indoor air inhalation.
• On the contrary there is no clear relation between the variation in Exposure via crop
consumption and the variation in Concentration in crop (root or leafy vegetables). This
suggests that the input parameters Total (root and leafy) vegetable consumption and
Fraction of root and leafy vegetables that is homegrown (also) control the variation in Exposure via crop consumption.
• The variation in Concentration in pore water is not clearly related to the variation in
Exposure via crop consumption or to the variation in Concentration in leafy root or leafy vegetables.
• The variation in Concentration in soil air is not clearly related to the variation in Exposure
via indoor air inhalation or to the variation in Concentration in indoor air.
Recommendations
• The variation in calculated human exposure should be investigated in more detail. As part of this further research the differences in the model-algorithms on variation in exposure should be evaluated in more detail. To this purpose international human exposure model experts should participate actively in this further research.
• On the long term a toolbox should be constructed on an European level, including:
• standardisation of the elements that are suitable for standardisation and harmonisation
(“fixed model tools” and “fixed input parameter tools”);
• flexible (country-specific) elements (“flexible model tools” and “optional parameter
tools”) to account for country-specific (geographical, ethnological and political) elements;
• a procedure on assessing human exposure, including documentation on the sensitivity
of calculated human exposure to the input parameters and a guideline on when and how to measure concentrations in contactmedia;
1.
Introduction
1.1 Background
The reliability of human exposure calculations is limited because of uncertainties about model concepts and input parameters, in particular:
• Uncertainties about model concepts, for example, there is lack of knowledge about model concepts that describe the relationship between contaminant concentration in groundwater and indoor air concentration, a major determinant of human exposure to volatile compounds (e.g. Waitz et al., 1994).
• Uncertainties about input parameters, for example, there is a lack of knowledge about the input parameters that describe human behaviour, such as the amounts of soil ingestion by humans (Stanek and Calabrese, 1995). In addition, there may be regional variations in input parameters, for example, in the organic matter content of the soil. Variation in calculated exposure may also result from a limited understanding of how human exposure modelling is carried out by users of models and/or (subsequent) unintentional mis-use of human exposure models. For example, if an exposure model in which the transport of volatile contaminants usually is derived for homogeneous soils with an average soil
temperature of around 10 degrees is used to assess the human exposure related to volatile contaminants at a waste dump site, where materials are heterogeneous and temperatures high. The consequences of the uncertainty around this type of mis-use are hard to assess, but they might become more widespread as a variety of commercial user-friendly software packages become available.
Some studies using with the same scenarios as staring point indicated rather large differences between calculated exposures, when using different models (Dor et al., 1998).
Human exposure models are in widespread use, both implicitly and explicitly. An example of implicit use is the comparison of measured contaminant concentrations with soil and
groundwater quality standards derived from these exposure models. Explicit use is decision-making based on (site-specific) exposure calculations. Hence the impact of the uncertainties described above can have serious consequences for public health, if a site is incorrectly diagnosed as "safe". Otherwise can uncertainties about input parameters lead to the inclusions of high-end estimates, which can lead to compounded conservatism (e.g. Finley and
Paustenbach, 1994; Paustenbach, 1995; Kissel et al., 1998). This could have adverse
consequences for the social and financial situation of organisations and individuals, if a site is incorrectly diagnosed as "dangerous".
The combination of "limited reliability" and "major consequences" requires a better insight into the reliability of calculated exposure. This requirement can be most directly addressed by performing a validation study, i.e. comparing calculated exposure with measured exposure. However, measuring (long-term) exposure in the human body is difficult, both for ethical and technical reasons. Statistical procedures (like Monte Carlo techniques (e.g. Cullen, 1994; Kissel et al., 1998), can be used to deal with the influence of uncertain parameters, or uncertain model concepts. However, these procedures are relatively time-consuming.
Another way to gain insight into the reliability of calculated exposure is to compare calculation results using different human exposure models, for standard datasets and assumptions. Although such a comparison does not give a scientific proof, it does give a valuable insight into the variation in calculated human exposures.
1.2 Purpose
The present study has the following aims:
1. Gaining insight into the variation in calculated human exposure. 2. Understanding the variation in calculated human exposure.
Use was made of the intensive communication network that was developed within the study, which resulted in the following additional activities:
1. Overviewing default values for the input parameters used in different approaches. 2. Overviewing general information of human exposure models.
The results of this study are likely to be important to the evaluation of decision-making that uses soil quality standards based on human exposure calculations, and to indicate how to improve concepts and input parameters for existing exposure models. Its outputs could have a profound influence on future research and development in this area, and the study itself may be a precursor to a larger R&D proposal.
It should be noted that:
• this study is only focused on calculated exposure, not on critical exposure or on resulting soil quality standards;
• only exposure to one separate contaminant is considered, not the potentially synergistic or antagonistic effects of exposure to more than one contaminant;
• only exposure to soil contaminants is considered, exposure to contaminants in air, groundwater or surface water is not considered in this study;
• background exposure, i.e. exposure from other sources than contaminated soil, is not taken into consideration in this study.
2.
Procedure
2.1 Collection of information
The needed information has been collected on the basis of a questionnaire and is categorised as follows:
• General information on the human exposure models (Chapter 3).
• Input parameters used as defaults in the different approaches (Chapter 4). • Calculated outputs (Chapter 5).
During the project frequent additional communication, mainly using email, was found necessary with all participants.
2.2 Participating models
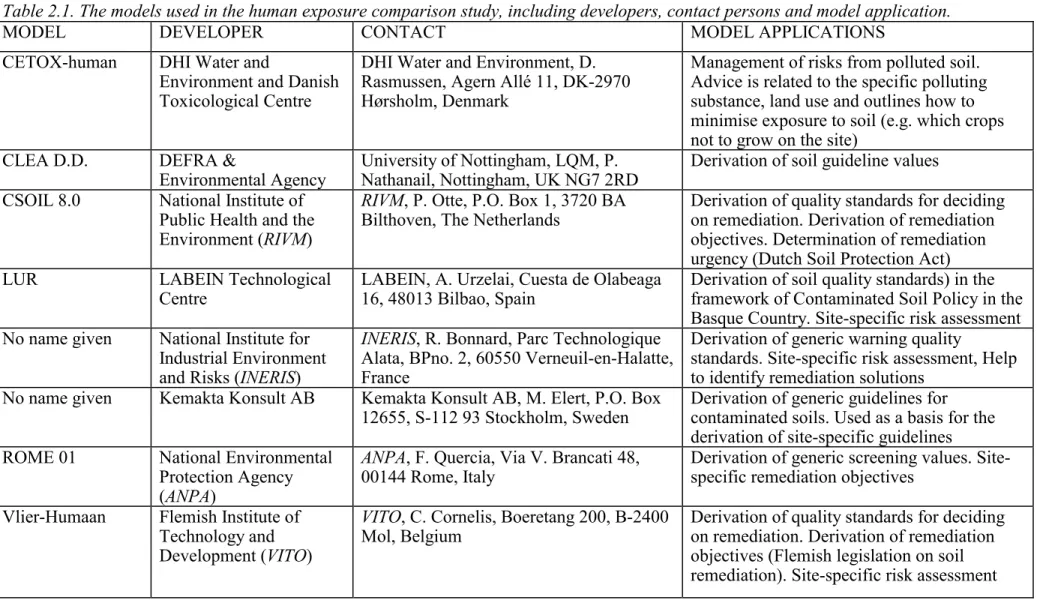
The models used in this human exposure comparison study are summarised in Table 2.1, which also provides an overview of each model developer, contact person and model applications.
Table 2.1. The models used in the human exposure comparison study, including developers, contact persons and model application.
MODEL DEVELOPER CONTACT MODEL APPLICATIONS
CETOX-human DHI Water and
Environment and Danish Toxicological Centre
DHI Water and Environment, D. Rasmussen, Agern Allé 11, DK-2970 Hørsholm, Denmark
Management of risks from polluted soil. Advice is related to the specific polluting substance, land use and outlines how to minimise exposure to soil (e.g. which crops not to grow on the site)
CLEA D.D. DEFRA &
Environmental Agency University of Nottingham, LQM, P.Nathanail, Nottingham, UK NG7 2RD Derivation of soil guideline values
CSOIL 8.0 National Institute of
Public Health and the Environment (RIVM)
RIVM, P. Otte, P.O. Box 1, 3720 BA
Bilthoven, The Netherlands Derivation of quality standards for decidingon remediation. Derivation of remediation objectives. Determination of remediation urgency (Dutch Soil Protection Act)
LUR LABEIN Technological
Centre LABEIN, A. Urzelai, Cuesta de Olabeaga16, 48013 Bilbao, Spain Derivation of soil quality standards) in theframework of Contaminated Soil Policy in the Basque Country. Site-specific risk assessment
No name given National Institute for
Industrial Environment and Risks (INERIS)
INERIS, R. Bonnard, Parc Technologique
Alata, BPno. 2, 60550 Verneuil-en-Halatte, France
Derivation of generic warning quality
standards. Site-specific risk assessment, Help to identify remediation solutions
No name given Kemakta Konsult AB Kemakta Konsult AB, M. Elert, P.O. Box
12655, S-112 93 Stockholm, Sweden Derivation of generic guidelines forcontaminated soils. Used as a basis for the derivation of site-specific guidelines
ROME 01 National Environmental
Protection Agency (ANPA)
ANPA, F. Quercia, Via V. Brancati 48,
00144 Rome, Italy Derivation of generic screening values. Site-specific remediation objectives
Vlier-Humaan Flemish Institute of
Technology and Development (VITO)
VITO, C. Cornelis, Boeretang 200, B-2400
Mol, Belgium Derivation of quality standards for decidingon remediation. Derivation of remediation
objectives (Flemish legislation on soil remediation). Site-specific risk assessment
Note that
• the HESP model and the Risc human use the same algorithms and the same input parameter set as the CSOIL 8.0 model.
• The JAG model is similar, but not equal to the CETOX-human model and is used for different purposes as the CETOX-human model.
2.3 Activities
The following activities has been performed to conduct the human exposure comparison study”:
1. Activity in relation to purpose 1 (Gaining insight into the variation in calculated
human exposure):
Comparison of calculated exposure via the different major exposure pathways, i.e. oral soil ingestion, crop consumption, inhalation of indoor air (inhalation of vapours only, excluding suspended particles in the air), using the different human exposure models ascertained from the questionnaires: a) by using the same prescribed input parameters and, b) by using the default input parameter that are used in different countries. The results of this activity have been described in chapter 5.
2. Activity in relation to purpose 2 (Understanding the variation in calculated human
exposure):
Evaluating the variation in calculated exposure on the basis of comparing the variation in exposure with the variation in other exposures and/or with variation in
concentration in the contactmedia and in the soil compartments and the variation in input parameters. The results of this activity have also been described in chapter 5. Evaluating the variation in calculated exposure on the basis of the different model concepts is not part of this study, because this evaluation is difficult without direct participation of the human exposure model experts (workshop).
3. Activity in relation to additional activity 1 (Overviewing default values for the input
parameters used in different approaches):
Overviewing default values used for the major input parameters in the different approaches in the different countries ascertained from the questionnaires. The results of this activity have been described in chapter 4.
4. Activity in relation to additional activity 2 (Overviewing general information of some
European human exposure models):
Collecting general information of the European human exposure models. The results of this activity have been described in chapter 3.
3.
General model information
On the basis of the questionnaires general model information was collected for all seven human exposure models. This information concerns:
• model characteristics (e.g. contact person);
• dependencies between the models and model applications;
• model layout (e.g. compartments and exposure pathways that are included);
• model possibilities (e.g. probabilistic application, acute exposure);
• model use (e.g. major applications, standard scenarios that have been included). This information has been summarised in the following sections. The detailed general information on all seven human exposure models, as was derived from the questionnaires, is included in Appendix 2.
3.1 Dependencies between the models and model applications
In Table 3.1 the dependencies between the European models and default input parameters are indicated (see Appendix 2 for more detailed information).
Table 3.1: Dependencies between the models (before the slash) and between the default input parameters (after the slash); + = model concepts or input parameters are related.
MODEL: Model to which
MODEL is related:
CETOX Human
CLEA D.D. CSOIL 8.0 LUR NoName
France 20001 NoName Sweden1 ROME 01 Vlier-Humaan CETOXhuman + / + CLEA D.D. CSOIL 8.0 + / + + / + + / + / + LUR NoNameFrance 2000 +/ + NoNameSweden + / ROME 01 Vlier-Humaan + / +
The conclusion on the dependencies between the model and default input parameters is that the model concepts and the input parameters of the exposure models CETOX-human, NoNameFrance 2000, Vlier-Humaan and CSOIL 8.0 are related to each other. Besides, the model concept of the exposure model NoNameSweden is related to the four models
mentioned and vice versa.
3.2 Model layout
In Table 3.2 information on the layout of the European models is summarised (see Appendix 2 for more detailed information).
Table 3.2: Information on the layout of the European human exposure models; x = incorporated in the model. CETOX-human CLEA D.D. CSOIL 8.0 LUR NoName France 2000 NoName Sweden ROME 01 Vlier-humaan Compartments soil x x x x x x x x
groundwater unsaturated zone x x x x x
groundwater saturated zone x x x
surface water x
air x x x
Exposure pathways:
soil ingestion x x x x x x x x
crop consumption x x x x x x x
ingestion of particles attached to crops x x
consumption of meat and milk products x
fish consumption x
direct groundwater consumption (x) x x x
drinking water (contaminated by x x x
inhalation of indoor air x x x x x x x x
inhalation outdoor air x x x x x x x
inhalation dust/ soil particles, indoors x x x x x x x x
inhalation dust/ soil particles, outdoors x x x x x x x x
inhalation of bathroom air x x x x
inhalation of vapours from groundwater x
dermal uptake through soil, indoors x x x x x x
dermal uptake through soil, outdoors x x x x x x x x
Table 3.2: Information on the layout of the European models; x = incorporated in the model (continued). CETOX-Human CLEA D.D. CSOIL 8.0 LUR NoName France 2000 NoName Sweden ROME 01 Vlier-humaan Principal basis model concepts (before the
slash)/ input parameters (after the slash)
worst case x x
realistic worst case x /x
reasonable Maximal Exposure*1 x /x /x /x x /x x /x x /x
average case x
best case
min, max, average /x
Starting point
total soil content x x x x x x x x
groundwater concentration x
concentration contactmedia x (x)
How is the distribution of contaminants over the soil compartments calculated
using the fugacifity theory x x x
using partition coefficients x x x x x x x
The major conclusions on the layout of the European human exposure models are:
•
The soil compartment and the unsaturated groundwater zone are included in most of the models; besides most models include several other compartments (air, surface water, saturated groundwater zone).•
The following exposure pathways are incorporated in all models: Soil ingestion, Crop consumption (except for ROME 01), Indoor air inhalation (inhalation of vapours only, excluding suspended particles in the air), Dermal uptake, Inhalation of dust/ soil particles. Besides most models include several other exposure pathways.•
All model concepts and default input parameters are based on Maximal Reasonable Exposure or (realistic) worst case.•
All models use the total soil content as starting point.•
The distribution of the contaminants over the soil compartments is mainly calculated on the basis of partition coefficients in some cases on the fugacitivity theory.3.3 Model possibilities
In Table 3.3 information on the possibilities of the European models is summarised (see Appendix 2 for more detailed information).
Table 3.3: Possibilities of the European exposure models.
CETOX-Human
CLEA D.D.
CSOIL 8.0 LUR NoName
France 2000 NoNameS weden ROME 01 Vlier-humaan
Possibilities for probabilistic applications? no yes no no yes no no yes
Is background exposure taken into account? yes optional no yes no yes no yes
Standard age ranges (years) 1-3
20-60 year 0 to 6, 16-59, 59-70 0-6 (child) 6-70 (adult) 0-6 (child) 6-70 (adult) 0-6 (child) 6-70 (adult) 0-6 6-64 0-6 6-70 0-6 6-70 How is dealt with exposure to children and
adults?
calculated separately x x x
(non- carcino-gens) x (non- car-cinogens) x (non- car-cinogens) x (non- carcino-gens) summed up x (carci-nogens) x (carci-nogens) x (carci-nogens) x (carci-nogens)
calculated separately or summed up x x x x
Is the possibility for calculating acute exposure included in the model?
no no no no no yes no no
Any kinetic (time dependent) processes in the model?
no yes no no yes yes no no
Is degradation included in the model? no no no no no no no no
Any standards incorporate that limit concentrations in contactmedia?
no no yes no no yes yes yes
Is exposure to mixtures included in the model?
The major conclusions on the possibilities of the European models are:
•
Only part of the models include the possibility for probabilistic application, background exposure, kinetic processes, or standards that limit the concentration in contactmedia.•
Most models do not offer the possibility for acute exposure, degradation and exposure to amixture of contaminants.
3.4 Model use
In Table 3.4 information on the use of the European models is summarised (see Appendix 2 for more detailed information).
Table 3.4: Information on the use of the European exposure models. CETOX-human CLEA D.D. CSOIL 8.0 LUR NoName France 2000 NoName Sweden ROME 01 Vlier-humaan The models is used for
deriving soil quality standards yes yes yes yes yes yes (yes)*1 yes
standardised risk assessment yes yes yes
deriving remediation goals (yes) yes yes yes yes
site-specific exposure assessment (yes) yes yes yes yes yes
Is the model available for third parties no yes (yes) no no no yes no
In the model in general use? no yes yes yes no yes yes yes
What standard scenario's are included
residential with garden(s) (yes) yes yes yes yes yes yes yes
residential without garden(s) yes yes yes yes yes
industrial (yes) yes yes yes yes yes yes yes
vegetable garden (allotments) yes yes yes (yes) no
kindergarten yes (yes) (yes)
children playground yes (yes) (yes)
sport fields yes (yes)
parks yes yes yes (yes) yes yes
garden yes yes yes
recreation yes yes (yes) yes yes
parks, playing fields and open spaces no yes yes
nature reserves (yes) no
agriculture (yes) no yes
less sensitive land-use, but with (yes)
infrastructure yes (yes)
consolidated areas yes
*1:
Table 3.4: Information on the use the European exposure models (continued). CETOX-human CLEA D.D. CSOIL 8.0 LUR NoName France 2000 NoName Sweden ROME 01 Vlier-humaan Any guidelines for selection of input
parameters?
no yes yes yes yes no yes (yes)
Any recommendation or guidelines for measurements in contactmedia?
no no yes no no yes yes no
Is phytotoxicity (a maximal concentration in crops) included?
no (no) no no no no no no
Is site-specific calculation of the Concentration in crops possible?
yes yes no no no no no no
Is site-specific calculation of the concentration in indoor air possible?
The major conclusions on the use of the European models are:
•
All models are used for the derivation of soil quality standards. Besides all models are used for at least one additional purpose.•
The soil uses Residential site and Industrial site are incorporated in all models; besides all models includes several other soil uses.•
No model includes phytotoxicity (a maximal concentration in the crop, above which the crop will show adverse effects).•
Most models do include guidelines for selection of input parameters; most models do not include recommendations or guidelines for measurements in contactmedia.•
All models offer the possibility for the site-specific calculation of the concentration in the indoor air. However, only two models offer the possibility for the site-specific calculation of the concentration in crops.4.
Overviewing input parameters
In this chapter an overview is given of the (variation in) default input parameters used in different model approaches. The overview of default parameters enables model users to select data (additional activity 1, i.e. Overviewing default values for the input parameters used in
different approaches). For policy makers it could be interesting to have insight into the variation in default input parameters. Besides the variation in the default input parameters is
used in relation to purpose 2, i.e. Understanding the variation in calculated human exposure: variation in exposure or variation in concentration in contactmedia can possibly or in soil compartments be related to variations in relevant input parameters, in Chapter 5.
Because developments in the use of human exposure models and the derivation of soil quality standards are quick, several elements changed since the start of the project. Major revisions of models and input parameters were performed in
• Italy: ROME 2.0, available from www.sinanet.anpa.it (addition of exposure pathway via surface water, extension of database on contaminants, update of toxicological and
chemical data, independent screening and site-specific levels, possibility for comparison of observed concentration with both legal limits and risk-based screening values).
• The Netherlands: CSOIL2000 (Rikken et al., 2001: model concepts; Otte et al., 2001: input parameters).
• The United Kingdom: CLEA2002, available from www.environment-agency.gov.uk or www.defra.gov.uk.
The data presented in this chapter relate to the available models and default input parameters available in the year 2000. These data also are the basis for the calculations using country-specific default input parameters in Chapter 5.
4.1 Data organisation
The default input parameters are categorised in the following categories:
• human characteristics;
• parameters that relate to the Exposure via crop consumption;
• parameters that relate to the Exposure via inhalation of indoor air;
• parameters that relate to other exposure pathways;
• contaminant-specific input parameters.
A "practical format" has been used: scientific format for most parameters and normal format (number between 0 and 1) for fractions.
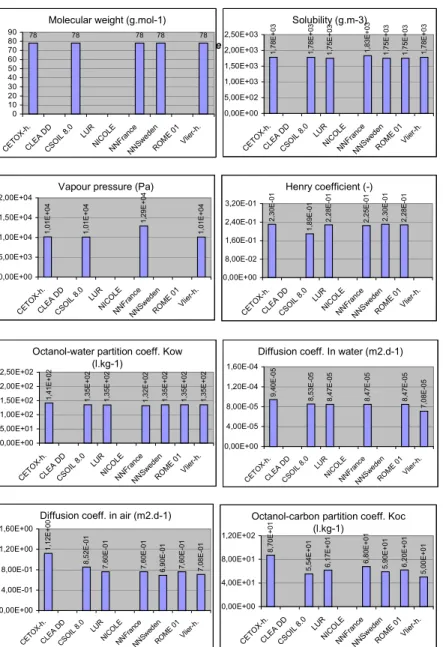
To facilitate comparison, bar charts are presented in Figure 4.1, which enable visual
interpretation of the variation in the default input parameters. Note that when input parameters have a value of 0, “0” has been added in the graphs. When “0” or any other number is lacking this input parameter is note used in the model.
Figure 4.1: Bar charts of the default input parameters: Human Characteristics.
When “0” or any other number is lacking this input parameter is not used in the model; for CLEA D.D. several
input parameters have been given in a probabilistic format, no value given in the bar charts.
Body weight, child (kg)
10 15 15 15 15 15 15 0 4 8 12 16 CETO X-h. CLEA D D CSO IL 8 .0 LUR NICO LE NNFr ance NNSw eden ROM E 01 Vlie r-h.
Body weight, adult (kg)
70 62 70 70 73 70 70 70 70 0 20 40 60 80 CETO X-h. CLEA DD CSO IL 8.0 LU R NIC OLE NNFr ance NNSw eden ROME 01 Vlie r-h.
Breathing volume, child (m3.d-1)
15 7,6 7,6 7,6 7,6 9 7,6 0 4 8 12 16 CETO X-h. CLEA DD CSOI L 8.0 LUR NIC OLE NNFra nce NNS wede n ROME 01 Vlier-h .
Breathing volume, adult (m3.d-1)
22 20 13,3 20 20 20 20 0 5 10 15 20 25 CETO X-h. CLEA DD CSO IL 8.0 LU R NIC OLE NNFr ance NNSw eden ROME 01 Vlie r-h.
Residence time in the (floor, one-compartment) house (inhalation
indoor), child (h.d-1) 15 21,1 18,5 19,5 24 16 16 0 10 20 30 CETO X-h. CLEA DD CSOI L 8.0 LUR NIC OLE NNFr ance NNSw eden ROME 01 Vlier-h.
Residence time in the (floor, one-compartment) house (inhalation
indoor), adult (h.d-1) 15 22,8 21,5 16 14,3 24 18 16 0 10 20 30 CET OX-h. CLEA DD CSO IL 8.0 LUR NIC OLE NNFr ance NNSw eden ROME 01 Vlier-h.
Residence time outdoors, around the house (soil ingestion), adult (h.d-1)
1 1,2 4 1,5 3,3 4 0 1 2 3 4 5 CETO X-h. CLEA DD CSO IL 8 .0 LUR NICO LE NNF ranc e NNSw eden ROM E 01 Vlier-h .
Residence time outdoors, around the house (soil ingestion), child (h.d-1)
1 2,9 5,5 4,5 4 0 2 4 6 8 CETO X-h. CLEA DD CSO IL 8 .0 LUR NICO LE NNF ranc e NNS wede n ROM E 01 Vlier-h .
Residence time at industrial site (h.d-1), adult 8 5,8 8 8,8 8 8 12 8 0 3 6 9 12 CETO X-h. CLEA DD CSOIL 8. 0 LUR NIC OLE NNFr ance NNSw eden ROME 01 Vlier -h.
Residence time (for inhalation) indoors (h.d-1), adult 7 6 8 8 10 4,75 0 4 8 12 CETO X-h. CLEA DD CSOI L 8.0 LUR NICOL E NNFr ance NNS wede n ROM E 01 Vlie r-h.
Figure 4.1 (continued): Bar charts of the default input parameters: Human Characteristics.
When “0” or any other number is lacking this input parameter is not used in the model; for CLEA D.D. several input parameters have been given in a probabilistic format, no value given in the bar charts.
Total consumption root vegetables (incl. potatoes), child (gdw.d-1)
95 15,1 25,5 37 15 90 0 50 100 150 CETO X-h. CLEA DD CSOI L 8.0 LUR NICO LE NNFr ance NNS wede n ROM E 01 Vlie r-h.
Total consumption root vegetables (incl. potatoes), adult (gdw.d-1)
225 27,6 118,5 106 59 29 207 0 100 200 300 CET OX-h. CLEA DD CSOI L 8.0 LUR NICO LE NNFra nce NNS wede n ROM E 01 Vlie r-h.
Total intake leafy vegetables, child (gdw.d-1) 40 8,9 32,5 25 8,8 60 0 40 80 120 CETO X-h. CLEA DD CSOIL 8.0 LUR NICO LE NNF rance NNS wede n ROM E 01 Vlier-h .
Total intake leafy vegetables, adult (gdw.d-1) 45 18,5 152 87 61 17 138 0 50 100 150 200 CETO X-h. CLEA DD CSOI L 8.0 LUR NICO LE NNFr ance NNS wede n ROME 01 Vlier-h .
Relative retention factor soil particles in lungs (-) 1 1 0,75 1 0,75 0,75 0,75 0 0,4 0,8 1,2 CETO X-h. CLEA DD CSOIL 8.0 LUR NICO LE NNFr ance NNS wede n ROM E 01 Vlier -h. Residence time (for soil ingestion),
outdoors, adult (h.d-1) 1 2 0 3,25 0 1 2 3 4 CETO X-h. CLEA DD CSO IL 8. 0 LUR NICO LE NNF ranc e NNSwe den ROME 01 Vlier -h.
Average daily soil intake residential site, child (mg.d-1) 1000 150 200 40 150 150 200 50 0 400 800 1200 CETO X-h. CLEA DD CSOIL 8.0 LUR NICO LE NNF rance NNS wede n ROM E 01 Vlier-h .
Average daily soil intake residential site, adult (mg.d-1) 25 50 1 50 50 100 20 0 30 60 90 120 CETO X-h. CLEA DD CSOI L 8.0 LUR NICO LE NNFr ance NNSw eden ROM E 01 Vlier -h.
Average daily soil intake industrial site, adult (mg.d-1) 25 50 50 1 0,5 18 50 35 0 20 40 60 80 CET OX-h . CLEA DD CSOIL 8.0 LUR NICO LE NNFra nce NNS wede n ROM E 01 Vlier-h .
Figure 4.1 (continued): Bar charts of the default input parameters: Exposure due to crop consumption.
When “0” or any other number is lacking this input parameter is not used in the model.
Figure 4.1 (continued): Bar charts of the default input parameters: Exposure due to inhalation.
When “0” or any other number is lacking this input parameter is not used in the model.
Fraction of total root vegetable consumption that is homegrown (%)
25 10 50 30 25 0 15 30 45 60 CETO X-h. CLEA DD CSOIL 8.0 LUR NICO LE NNFr ance NNS wede n ROM E 01 Vlier -h.
Moisture content roots (%)
88 79,8 85 82 80 80 0 30 60 90 120 CETO X-h. CLEA DD CSOIL 8.0 LUR NICO LE NNFr ance NNS wede n ROM E 01 Vlier -h.
Moisture content leafy vegetables (%)
83 88,3 90 90 88 88 0 30 60 90 120 CETO X-h. CLEA DD CSOI L 8.0 LUR NICOL E NNFra nce NNSw eden ROM E 01 Vlier -h.
Fraction of toal leafy vegetable consumption that is homegronwn (%)
25 10 60 30 25 0 20 40 60 80 CETO X-h. CLEA DD CSOIL 8.0 LUR NIC OLE NNFr ance NNSwe den ROM E 01 Vlier -h.
Exposure due to inhalation of indoor air
Ventilation frequency house (h-1)
0,3 1,25 0,5 0,5 0,5 1,25 0 0,5 1 1,5 CET OX-h . CLEA DD CSOIL 8.0 LUR NICOL E NNFra nce NNSw ede n ROM E 01 Vlier-h .
Ventilation frequency building at an industrial site (h-1) 0,75 0,75 0,5 0,5 0,83 1,25 0 0,4 0,8 1,2 1,6 CETO X-h. CLEA DD CSO IL 8 .0 LUR NICO LE NNFr ance NNSw eden ROME 01 Vlier -h.
Figure 4.1 (continued): Bar charts of the default input parameters: Other exposure pathways.
When “0” or any other number is lacking this input parameter is not used in the model.
Others
Concentration suspended particles in the air, industrial, indoors (mg.m-3)
1,50E -01 5,30E -02 5,25E -01 7,00E -02 1,07E + 00 0,00E+00 5,00E-01 1,00E+00 1,50E+00 CETO X-h. CLEA DD CSOIL 8.0 LUR NICO LE NNF rance NNSw eden ROME 01 Vlier -h.
Concentration suspended particles in the air, residential, indoors (mg.m-3)
1, 50E -01 5, 30E -02 5, 25E -02 7, 00E -02 9, 20E -02 0,00E+00 6,00E-02 1,20E-01 1,80E-01 2,40E-01 CETO X-h. CLE A DD CSOI L 8.0 LUR NICO LE NNFra nce NNS weden ROME 01 Vlier-h .
Fraction soil particles in suspended air, indoors (-) 1 0,8 0,8 0,8 0 0,4 0,8 1,2 CETO X-h. CLEA D D CSOI L 8.0 LUR NICO LE NNFr ance NNSw eden ROME 01 Vlier-h .
Fraction soil particles in suspended air, outdoors (-) 1 0,5 1 0,5 0,5 0 0,4 0,8 1,2 CETO X-h. CLEA DD CSOIL 8.0 LUR NICO LE NNFr ance NNS wede n ROME 01 Vlier -h.
Figure 4.1 (continued): Bar charts of the default input parameters: B(a)P-specific input parameters.
When “0” or any other number is lacking this input parameter is not used in the model.
Compound specfic characteristics: B(a)P
Molecular weight (g.mol-1)
252 252,2 252 252 252 252 0 100 200 300 CETO X-h. CLEA DD CSOI L 8.0 LUR NICOL E NNFr ance NNS wede n ROME 01 Vl ier-h. Solubility (g.m-3) 1,00E -0 3 3,80E -0 3 3,00E -0 4 1,62E -0 3 3,00E -0 3 1,60E -0 3 1,62E -0 3 3,00E -0 3 0,00E+00 2,00E-03 4,00E-03 6,00E-03 CETO X-h. CLEA DD CSO IL 8.0 LUR NICO LE NNF ranc e NNS wede n ROME 01 Vlie r-h.
Vapour pressure (Pa)
7,30E -0 7 7,00E -0 7 1,31E -0 8 7,20E -0 7 1,31E -0 8 0,00E+00 3,00E-07 6,00E-07 9,00E-07 1,20E-06 CETO X-h. CLEA DD CSO IL 8.0 LUR NICO LE NNFr ance NNS wede n ROME 01 Vli er-h. Henry coefficient (-) 1,90E -0 5 9,47E -0 1 4,67E -0 6 4,63E -0 5 4,17E -0 5 4,60E -0 5 4,63E -0 5 1,10E -0 3 0,00E+00 5,00E-01 1,00E+00 1,50E+00 CETO X-h. CLEA DD CSOI L 8.0 LUR NICO LE NNFr ance NNSw eden ROME 01 Vlier -h.
Octanol-water partition coeff. Kow (l.kg-1) 2,24E +06 1,15E +06 2,23E +06 1,29E +06 1,00E +06 1,29E +06 1,29E +06 2,24E +06 0,00E+00 1,00E+06 2,00E+06 3,00E+06 4,00E+06 CETOX -h. CLEA DD CSO IL 8. 0 LUR NICO LE NNFr ance NNS wede n ROM E 01 Vlier -h.
Diffusion coeff. In water (m2.d-1)
5,20E -0 5 4,30E -0 5 4,75E -0 5 7,78E -0 5 5,96E -0 5 7,78E -0 5 4,75E -0 5 0,00E+00 4,00E-05 8,00E-05 1,20E-04 CET OX-h. CLEA DDCSO IL 8.0 LU R NICOL E NNF rance NNSw ede n ROM E 01 Vl ier-h.
Diffusion coeff. in air (m2.d-1)
6,20E -0 1 4,30E -0 1 4,75E -0 1 3,72E -0 1 3,89E -0 1 6,90E -0 1 3,72E -0 1 4,75E -0 1 0,00E+00 4,00E-01 8,00E-01 1,20E+00 CETO X-h. CLEA DD CSO IL 8. 0 LUR NICO LE NNFr ance NNS wede n ROME 01 Vlie r-h.
Octanol-carbon partition coeff. Koc (l.kg-1) 1,40E +06 1,14E +06 9,20E +05 9,69E +05 1,00E +06 1,02E +06 9,69E +05 9,00E +05 0,00E+00 5,00E+05 1,00E+06 1,50E+06 2,00E+06 CETO X-h. CLEA DD CSOI L 8.0 LUR NICO LE NNFr ance NNS weden ROME 01 Vlier-h . BioConcentrationFactor, root vegetables (mg.kg-1CRfw/ mg.l-1PW) 3,00E +01 2,34E +03 6,98E +01 9,80E -0 4 1,50E +04 9,00E -0 2 0,00E+00 5,00E+03 1,00E+04 1,50E+04 2,00E+04 CETOX -h. CLEA DD CSO IL 8.0 LUR NICO LE NNFr ance NNS wede n ROM E 01 Vlier-h . BioConcentrationFactor leafy vegetables (1CRfw/ mg.kg-1PW) 8,15E +03 1,45E +00 6,98E +01 5,40E -0 3 2,00E +00 9,00E -0 2 0,00E+00 5,00E+03 1,00E+04 1,50E+04 CET O X-h. CLEA DD CSO IL 8.0 LUR NICO LE NNF ranc e NNSw eden ROME 01 Vlie r-h.
Figure 4.1 (continued): Bar charts of the default input parameters: cadmium-specific input parameters.
When “0” or any other number is lacking this input parameter is not used in the model.
Compound specfic characteristics: Cd
Molecular weight (g.mol-1)
112 112,4 112,4 112,4 112,4 112,4 0 40 80 120 CETO X-h. CLEA DD CSOIL 8.0 LUR NICO LE NNFr ance NNSw eden ROME 01 Vlier -h.
Partition coeff. solid phase/ porewater Kd (l.kg-1) 5,01E +03 1,90E +02 7,50E +01 2,10E +02 3,00E +01 7,50E +01 5,60E +01 0,00E+00 2,00E+03 4,00E+03 6,00E+03 8,00E+03 CETO X-h. CLEA DD CSOI L 8.0 LUR NICO LE NNFr ance NNSw eden ROM E 01 Vl ier-h.
BioConcentrationFactor, root veg. (mg.kg-1CRdw/ mg.kg-1SOIL) 7,96E +02 1,50E -01 2,00E -01 7,30E -01 7,00E -01 1,50E -01 0,00E+00 5,00E+02 1,00E+03 1,50E+03 CETO X-h. CLEA DD CSOI L 8.0 LUR NICOL E NNFr anc e NNSw eden ROME 01 Vlier-h .
BioConcentrationFactor leafy veg. (mg.kg-1CROPdw/ mg.kg-1SOIL) 1,37E +03 7,00E -02 3,60E -01 1,27E +00 1,50E -01 7,00E -01 0,00E+00 5,00E+02 1,00E+03 1,50E+03 2,00E+03 2,50E+03 CETO X-h. CLEA D D CSOI L 8.0 LUR NICO LE NNFr ance NNS wede n ROM E 01 Vlier-h .
Figure 4.1 (continued): Bar charts of the default input parameters: benzene-specific input parameters.
When “0” or any other number is lacking this input parameter is not used in the model.
Compound specfic characteristics: Benzene
Molecular weight (g.mol-1)
78 78 78 78 78 0 10 20 30 40 50 60 70 80 90 CETO X-h. CLE A DD CSOI L 8.0 LUR NICO LE NNF ranc e NNS weden ROME 01 Vlier -h. Solubility (g.m-3) 1,78E +03 1,78E +03 1,75E +03 1,83E +03 1,75E +03 1,75E +03 1,78E +03 0,00E+00 5,00E+02 1,00E+03 1,50E+03 2,00E+03 2,50E+03 CETOX -h. CLE A DD CSO IL 8.0 LUR NICO LE NNFr ance NNSwedenRO ME 0 1 Vlier -h.
Vapour pressure (Pa)
1,01E +04 1,01E +04 1,29E +04 1,01E +04 0,00E+00 5,00E+03 1,00E+04 1,50E+04 2,00E+04 CET OX-h. CLE A DD CSO IL 8.0 LUR NICO LE NNF ranc e NNS weden ROM E 01 Vlier-h . Henry coefficient (-) 2,30E -01 1,89E -01 2,28E -01 2,25E -01 2,30E -01 2,28E -01 0,00E+00 8,00E-02 1,60E-01 2,40E-01 3,20E-01 CET OX-h. CLE A DD CSOI L 8. 0 LUR NICO LE NNFr ance NNS weden ROME 01 Vlier -h.
Octanol-water partition coeff. Kow (l.kg-1) 1,41E +02 1,35E +02 1,35E +02 1,32E +02 1,35E +02 1,35E +02 1,35E +02 0,00E+00 5,00E+01 1,00E+02 1,50E+02 2,00E+02 2,50E+02 CETO X-h. CLE A DD CSOI L 8.0 LUR NICO LE NNF ranc e NNSw eden ROM E 01 Vlier -h.
Diffusion coeff. In water (m2.d-1)
9,40E -05 8,53E -05 8,47E -05 8,47E -05 8,47E -05 7,08E -05 0,00E+00 4,00E-05 8,00E-05 1,20E-04 1,60E-04 CETO X-h. CLEA DD CSO IL 8.0 LU R NICO LE NNF ranc e NNS wede n ROME 01 Vlier -h.
Diffusion coeff. in air (m2.d-1)
1,12E +00 8,52E -01 7,60E -01 7,60E -01 6,90E -01 7,60E -01 7,08E -01 0,00E+00 4,00E-01 8,00E-01 1,20E+00 1,60E+00 CETO X-h. CLEA DD CSOI L 8.0 LUR NICO LE NNFr ance NNSw eden ROM E 01 Vlier -h.
Octanol-carbon partition coeff. Koc (l.kg-1) 8,70E +01 5,54E +01 6,17E +01 6,80E +01 5,90E +01 6,20E +01 5,00E +01 0,00E+00 4,00E+01 8,00E+01 1,20E+02 CETO X-h. CLE A DD CSOIL 8.0 LUR NICO LE NNF ranc e NNS weden ROM E 01 Vlier -h.
Figure 4.1 (continued): Bar charts of the default input parameters: trichloroethene-specific input parameters.
When “0” or any other number is lacking this input parameter is not used in the model.
Compound specfic characteristics: TCE
Molecular weight (g.mol-1)
132 131,5 131,4 131,5 131,5 0 50 100 150 CETOX -h. CLE A DD CSOI L 8.0 LUR NICO LE NNF ranc e NNS weden ROME 01 Vlier -h.
Octanol-water partition coeff. Kow (l.kg-1) 2,63E +02 5,13E +02 5,13E +02 5,13E +02 2,40E +02 5,13E +02 5,13E +02 2,51E +02 0,00E+00 2,50E+02 5,00E+02 7,50E+02 1,00E+03 CETO X-h. CLEA DDCSOI L 8.0 LUR NICOL E NNF rance NNSwe den ROME 01 Vlier -h. Solubility (g.m-3) 1,10E +02 1,10E +03 1,10E +03 1,10E +03 1,07E +03 1,10E +03 1,10E +03 1,40E +03 0,00E+00 5,00E+02 1,00E+03 1,50E+03 2,00E+03 CETO X-h. CLE A DD CSOI L 8.0 LUR NICO LE NNFr ance NNS weden ROM E 01 Vlier-h .
Vapour pressure (Pa)
9,20E +03 8,00E +03 7,96E +03 8,00E +03 0,00E+00 4,00E+03 8,00E+03 1,20E+04 1,60E+04 CETOX -h. CLE A DD CSOI L 8.0 LUR NICO LE NNFr ance NNS weden ROM E 01 Vlier-h . Henry coefficient (-) 4,00E -01 4,22E -01 4,10E -01 4,22E -01 4,28E -01 4,20E -01 4,22E -01 0,00E+00 2,00E-01 4,00E-01 6,00E-01 CE TOX-h. CLEA DDCSOI L 8. 0 LUR NICO LE NNF rance NNSw ede n ROME 01 Vlie r-h.
Diffusion coeff. In water (m2.d-1)
7,30E -05 7,86E -05 6,57E -05 7,86E -05 7,86E -05 7,86E -05 6,58E -05 0,00E+00 3,00E-05 6,00E-05 9,00E-05 1,20E-04 CETOX -h. CLE A DD CSOI L 8. 0 LUR NICO LE NNF ranc e NNS weden ROM E 01 Vlier-h .
Diffusion coeff. in air (m2.d-1)
8,60E -01 6,83E -01 6,57E -01 6,83E -01 6,83E -01 6,90E -01 6,83E -01 6,58E -01 0,00E+00 3,50E-01 7,00E-01 1,05E+00 1,40E+00 CETO X-h. CLEA D D CSOI L 8.0 LUR NICO LE NNFr ance NNS weden ROM E 01 Vlier-h .
Octanol-carbon partition coeff. Koc (l.kg-1) 1,20E +02 9,43E +01 2,11E +02 94,3 1,11E +02 2,11E +02 9,40E +01 8,70E +01 0,00E+00 1,00E+02 2,00E+02 3,00E+02 4,00E+02 CETO X-h. CLEA DD CSO IL 8.0 LU R NICO LE NNF ranc e NNSw eden ROM E 01 Vlie r-h.
4.2 Conclusions
In the following sections the major conclusions are drawn about the variation in default input parameters used in different approaches. To this purpose the following (arbitrary)
categorisation has been used:
• The difference between the extreme values is within a factor of 2: default input parameters are "similar".
• The difference between the extreme values is in between a factor of 2 and 10: there is a "substantial variation" in the default input parameters.
• The difference between the extreme values is in between a factor of 10 and 100: there is a "large variation" in the default input parameters.
• The difference between the extreme values is more than a factor of 100: there is a "huge variation" in the default input parameters.
The conclusions are drawn in the order of increasing variation in the default input parameters.
4.2.1 Human characteristics
• The Body weight is similar for all approaches, although in the CETOX-human approach a lower Body weight for children is used.
• The Breathing volume is similar for all approaches, although in the CETOX-human approach a relatively high Breathing volume for children and in the NICOLE approach a relatively low Breathing volume for adults is used.
• There is a substantial variation in most Residence times between the approaches. In all approaches the Residence time at an industrial site for children is zero, except for the NoNameSweden approach where this is 8 hours.
• There is a substantial variation in the Amount of total consumption of root vegetables for children (from 15 gdw/day in the CSOIL 8.0 and NoNameSweden approaches up to 95
gdw/day in the CETOX-human approach) and for adults (from 28 gdw/day in the CSOIL 8.0
approach up to 225 gdw/day in the CETOX-human approach). The same trend is found for
the Amount of total consumption of leafy vegetables.
• There is a substantial variation in the Average daily soil intake at a residential site for adults (from 1 mg/day in the NICOLE approach up to 100 mg/day in the ROME 01 approach) and a large variation in the Average daily soil intake at a residential site for children (from 40 mg/day in the NICOLE approach up to 1000 mg/day in the Danish approach). The same trend is found for the Average daily soil intake at an industrial site adults.
4.2.2 Input parameters in relation to Exposure via crop consumption
• The Moisture content of root and leafy vegetables is similar for all approaches.
• There is a substantial variation in the Fraction of total root and leafy vegetable
consumption that is homegrown (from 10% for the CSOIL 8.0 approach up to 50% (for root vegetables) and 60% (for leafy vegetables) for the NICOLE approach).
4.2.3 Input parameters in relation to Exposure via inhalation of indoor
air
• There is a substantial variation in the Ventilation frequency of a house (from 0.3 1/h for the CETOX-human approach up to 1.25 1/h for Vlier-humaan and the CSOIL 8.0 approaches). The same trend is found for the Ventilation frequency of a building at an
industrial site.
The Surface of a house, the Surface of a building at an industrial site, the Volume of a house and the Volume of a building at an industrial site has not been compared, because of
differences in building construction types in different countries. In some approaches transport of volatile contaminants from the soil to a crawl space, having a different surface and volume, is considered.
4.2.4 Input parameters related to other exposure pathways
• The Fraction soil particles in suspended air, indoors and the Fraction soil particles in
suspended air, outdoors is similar in all approaches.
• There is a substantial variation in the Concentration in suspended particles in the air at a
residential site, indoors (from 0.05 mg/m3 for the NoNameFrance 2000 and the CSOIL 8.0
approaches up to 0.15 mg/m3 for the CETOX-human approach). There is a large variation in the Concentration in suspended particles in the air at an industrial site, indoors (from 0.05 mg/m3 for the CSOIL 8.0 approach up to 1.07 mg/m3 for the Vlier-humaan approach).
4.2.5 Contaminant-specific input parameters
Conclusions are only drawn for benzo(a)pyrene, cadmium, benzene and trichloroethene, not for atrazine because of lack of data from the questionnaires.
• The Molecular weight is similar for all contaminants in all approaches.
• The Solubility is similar for benzene in all approaches; however, there is a large variation in the Solubility for benzo(a)pyrene and trichloroethene.
• The Vapour pressure is similar for benzene and trichloroethene for all approaches; however, there is a large variation in the vapour pressure for benzo(a)pyrene. • The Henry coefficient is similar for benzene and trichloroethene for all approaches;
however, there is a large variation in the Henry coefficient for benzo(a)pyrene.
• The Octanol-water partition coefficient Kow is similar for benzene for all approaches; however, there is a substantial variation in the Octanol-water partition coefficient Kow for benzo(a)pyrene and trichloroethene.
• The Diffusion coefficient in water is similar for benzene, trichloroethene and, to a lesser extent, for benzo(a)pyrene for all approaches. The same trend is found for Diffusion
coefficient in air.
• The Octanol-carbon partition coefficient Koc is similar for benzo(a)pyrene and for
partition coefficient Koc for trichloroethene. There is a huge variation in the Partition coefficient solid phase/ pore water for cadmium (from 75 l/kg for the LUR approach up to
5010 l/kg for the CETOX-human approach).
• There is a huge variation in the BioConcentrationFactor for root and leafy vegetables for benzo(a)pyrene (root vegetables: from 0.00098 mg/kg-cropfw: mg/lpore water for the
NoNameFrance 2000 approach up to 15000 mg/kg-cropfw: mg/lpore water for the
NoNameSweden approach; leafy vegetables: (from 0.054 mg/kg-cropfw: mg/lpore water for
the NoNameFrance 2000 approach up to 8150 mg/kg-cropfw: mg/lpore water for the
CETOX-human approach). There also is a huge variation in the BioConcentrationFactor for root
and leafy vegetables for cadmium (root vegetables: from 0.15 mg/kg-cropdw: mg/kgsoil for
the CSOIL 8.0 and the Vlier-Humaan approach up to 796 mg/kg-cropdw: mg/kgsoil for the
CETOX-human approach; leafy vegetables: (from 0.07 mg/kg-cropdw: mg/kgsoil for the
CSOIL 8.0 approach up to 137 mg/kg-cropdw: mg/kgsoil for the CETOX-human approach.
Note that some of the BioConcentrationFactors have been based on measured data, while others have been calculated.
• Half of the models use a Relative retention factor for soil particles in lungs of 0.75, while the other half of the models use a Relative retention factor for soil particles in lungs of 1.0.