Reference projection for greenhouse gases
in the Netherlands
Emission projections for the period 2001-2010
R. van den Wijngaart and J.R. Ybema
11 Energy Research Centre of the Netherlands (ECN), PO Box 1, 1755 ZG Petten
This report is a translation of RIVM report 773001020.
This research was commissioned by the Ministry of Housing, Spatial Planning and the Environment (VROM) and the Ministry of Economic Affairs. It was funded by the Ministry of VROM, Directorate-General for Environmental Protection within the scope of the reference projection for energy and greenhouse gases project, described in MAP 2001 under project number M/773001/01/YK (reference projection 2010).
Abstract
Reference projections for greenhouse gases: emission projections for 2001 – 2010
This report presents the results of the project ‘reference projection for energy and greenhouse gases’ carried out by RIVM and ECN for the Ministries of Housing, Spatial Planning and the Environment, and Economic Affairs. The reference projection considers emission of greenhouse gases in the Netherlands in 2010. Emission sources and developments up to 2000 were analysed, and expected developments with respect to economic growth and energy supply for the period 2001-2010 updated. This led to new estimates for the greenhouse gas emissions in 2010. Differences with previous scenario studies were analysed, and the effects of both announced and implemented policy measures assessed. Emissions of CO2 were analysed separately from other greenhouse gases.
The total expected greenhouse gas emissions for the Netherlands in 2010 are concluded to be 225 Mton CO2 equivalent, which represents a near stabilisation for 2000 as the net result of a 12 Mton increase in CO2 emissions and a 9 Mton decrease in non-CO2 greenhouse gases. The expected development of domestic emissions appears favourable with respect to the current policy goal: an emission target stated in the Kyoto agreement of –6 % in relation to the 1990/1995 level and the realisation of half emission reductions through domestic measures. The uncertainty in total annual CO2-equivalent emissions in 2010 is estimated at 14 Mton (95% confidence interval) due to identified uncertain future societal developments and possible future improvements in greenhouse gas emission inventories.
This report will be used to evaluate the current progress with respect to the national climate change policy in the Netherlands, described in ‘The Netherlands’ Climate Policy Implementation Plan, Part I: domestic measures’ (VROM, 1999a).
Preface
This report reflects the result of the ‘Reference projection for Energy and Greenhouse gases’ project, commissioned by the Ministry of Economic Affairs (EZ) and the Ministry of Housing, Spatial Planning and the Environment (VROM). The advisory board consisted of representatives from the Ministries of EZ and VROM, the Ministry of Agriculture, Nature Management and Fisheries (LNV), the Traffic and Transport Advice Service and the Netherlands Bureau for Economic Policy Analysis (CPB). We thank them for their critical and constructive comments.
In addition to the authors, various employees from ECN Policy Studies1 and the RIVM's Office for Environmental Assessment2 have contributed to this study, namely: B. Daniels, A.W.N. van Dril, C.H. Volkers (all ECN), A. Gijsen, J.A. Oude Lohuis and R. Thomas (all RIVM).
1 The Energy Research Centre of the Netherlands (ECN) is an independent market-oriented organisation for research, development and consultancy on energy-related topics. With sustainability as a guideline, ECN develops innovative technologies for a reliable, efficient and environmentally sound energy system. ECN’s work focuses on six priority areas: solar and wind, and biomass and clean fuels, energy efficiency and policy studies.
ECN Policy Studies offer governments and companies independent advice with respect to
sustainability and energy market developments. About 50 policy experts focus on energy problems and solutions at local, national and international levels. Combining a scientific orientation and a pragmatic attitude, ECN Policy Studies holds an intermediate position between an academic research institute and a professional consultancy.
2 The RIVM is a policy-supporting research institute in the field of public health and the
environment, as well as being an environmental and nature assessment office. The RIVM carries out research for the ministries of VWS, VROM and LNV, inspectorates and government agencies. RIVM researchers develop and gather scientific knowledge worldwide. They integrate this knowledge for policy makers, who develop policies for the protection of human health, the environment and nature, and for those who monitor their implementation. The RIVM also uses this accumulated knowledge in its monitoring tasks.
Contents
Summary 51. Introduction 7
2. Developments in greenhouse gas emissions 2001 - 2010 9
2.1 Developments in total greenhouse gas emissions 9 2.2 Development in the CO2 emissions 10
2.3 Developments in non-CO2 greenhouse gases 11
2.4 Uncertainty margin of the emission projection in 2010 13
3. The reference projection compared with the GC scenario 15
3.1 Introduction 15
3.2 Comparing the emission levels of all greenhouse gases collectively 15 3.3 Explaining the difference in the CO2 emission levels 17
3.4 Explaining the difference in emission levels of the non-CO2 greenhouse gases 19
4. Effect of the Climate Policy Implementation Plan 21
4.1 Effect on the greenhouse gas emissions 21 4.1.1 Effects of implemented policies21 4.1.2 Policy in preparation24
4.2 Side-effects on acidifying emissions 26
Appendix A Overview of implemented and planned policies 27
Appendix B Technical information on the determination of emission levels 28
B.1 Emission levels in the Global Competition scenario: adjustment of emission factors 28 B.2 Sector emissions of greenhouse gases in the reference projection and the GC scenario 31 B.3 Emission reduction in the Climate Policy Implementation Plan 32
B.4 Emission of greenhouse gases in the NCPIP 32 B.5 GWP factor 33
B.6 Margin of uncertainty for the emission of greenhouse gases 33
Summary
In the reference projection, the emission of greenhouse gases that can be attributed to the Netherlands is estimated at a level of 225 Mton CO2 equivalent in the year 2010. This is a very limited increase with respect to the emissions in the year 2000 (222 Mton CO2 eq.). This ‘near’ stabilisation is the net result of an increase in the approximately 12 Mton and a decrease in the emission of the non-CO2 greenhouse gases by 9 Mton.
Emission of greenhouse gases
190 200 210 220 230 240 250 1990 1995 2000 2005 2010 Greenhouse gas e m issi ons ( in M ton C O 2-eq.)
Realised Reference projection
Figure S.1 Emission of greenhouse gases over the period 1990 – 2010. The shaded area indicates the range in which the emissions lie if the uncertainty in societal developments and the monitoring of
emissions are taken into account.
The domestic emission of greenhouse gases develops more favourably in the reference projection than in the reference used in the National Climate Policy Implementation Plan (NCPIP). The Kyoto target for the Netherlands is a permitted emission of –6% with respect to 1990/1995. Allowing for a relatively high economic growth, the NCPIP identified a policy target of 50 Mton reduction. In the updated reference projection, the policy target is 40 Mton. This reduction of the policy target comes from the exogenous (volume) factors and improved emission inventories. The exogenous factors are a lower expected economic growth, a less energy-intensive economic structure and the increase in imported electricity. The improvement of the emission inventories has led, among other things, to lower emission factors for the non-CO2 (i.e. non-CO2) greenhouse gases. The current climate policy
makes an important contribution to the limitation of the greenhouse gas emissions. Under the currently implemented NCPIP policy, the emissions will be reduced by approximately 14 Mton, compared to what would have been emitted without that policy. A further 26 Mton reduction is required to meet the Kyoto target. Policy in preparation of domestic CO2 measures might lead to a reduction of 2.5 Mton. Part of the remaining emission reduction can take place abroad. The aim of the Climate Policy Implementation Plan was to realise half the policy target abroad. This reference projection does not look any further into the possibilities for the Netherlands of realising its emission reductions abroad.
Many developments that are crucial for the final emissions, such as the effect of the liberalisation of the energy market on energy prices and the import/export balance of electricity, are uncertain. The emissions in 2010 could therefore turn out to be approximately 14 Mton lower or higher. The remaining required reduction is then 12 and 40 Mton, respectively.
In the coming 10 years, the CO2 emissions will continue to grow by 0.6% per year with an economic
growth of 2.5% per year. The CO2 emissions and economic growth in the reference projection can therefore not be entirely uncoupled. Despite the ‘bonuses’ in the exogenous developments and the resulting lower policy target with respect to the Climate Policy Implementation Plan (NCPIP-1), the estimated CO2 emissions in 2010 are higher than used in the NCPIP1 calculations. An important reason for this is that part of the extra climate policy from the NCPIP-1 has not yet been put into operation, including the Coal covenant and kilometre pricing to replace pay-as-you-drive. In addition, the elaboration of the policy instruments means that the energy-saving measures are less effective than was planned in the NCPIP-1. The CO2-reduction effect of the NCPIP-1 is estimated at 8 Mton in the reference projection. This is approximately half the effect expected in the NCPIP-I, and agrees with what was reported by the ECN and RIVM
in 1999 as the
‘hard' effect.
1The emissions of the non-CO2 greenhouse gases are developing favourably. A combination of
effective policies and technical measures has meant that emissions of non-CO2 greenhouse gases will
fall by 20% in the period 2000 - 2010. The net effect of the slightly more favourable developments in the non-CO2 greenhouse gases and the marginally disappointing development in CO2 is a near stabilisation of emissions of all greenhouse gases in 2010 at the 2000 level.
The CO2reduction measures from the Climate Policy Implementation Plan also reduce other emissions related to energy consumption, namely NOx and SO2. Part of this NOx reduction contributes to the realisation of the objective (55 kton
NO
x in 2010) of theNO
x emission trade, in which industry,refineries and the electricity sector participate. With the development of the energy consumption (as shown in the reference projection) in combination with the policies implemented, the emission of the acidifying components will continue to fall at the current tempo until 2010 (approximately 290 kton
NO
x and 70 kton SO2). The National Environmental Policy Plan 4 (NMP4) targets for 2010 forNO
xand SO2 are still out of reach under the policy implemented (231 kton
NO
x and 46 kton SO2, respectively).The RIVM and ECN carried out the reference projection for greenhouse gases at the request of the ministries of VROM and EZ to support the interim evaluation of the national climate policy in 2002. The reference projection takes the energy consumption and the greenhouse gas emissions from 2000 as the starting point. From a cautious environmental viewpoint, the economic growth up to 2010 is assumed to be relatively high, just as in the Climate Policy Implementation Plan. The economic growth is based on the ‘optimistic’ economic growth scenario of the Medium-term outlooks (CPB 2001a,b). The effects of the energy and climate policies (implemented on 1 July 2001) are included.
1.
Introduction
The ministries of VROM and EZ published new policy documents, both for the energy and climate policies, at the beginning of 2002 (VROM, 2002; EZ, 2002). In preparation for this, the ECN and RIVM were asked for an updated insight into the energy supply, the emissions of CO2 and non-CO2 greenhouse gases and, among other things, the side-effects on the emissions of acidifying
components.
The Netherlands’ Climate Policy Implementation Plan (VROM, 1999a) states that the minister of VROM will draw up an evaluation moment in 2002 with regard to the effects of the measures and the policies announced in the Climate Policy Implementation Plan. The goal of this evaluation moment is, for example, to answer the question on whether the chosen approach will enable the Netherlands to meet the targets agreed on in an international context. These are translated into the national target of -6% for the emission of greenhouse gases in the period 2008-2012 compared to 1990/1995. The reference projection will support the answer to this question.
The scenario that has been used the most as background for various policy documents in the climate change theme (including the Netherlands’ Climate Policy Implementation Plan) is the long-term Global Competition scenario (GC) for 1995 to 2020. The choice of the GC scenario was suggested for the climate policy to be able to formulate policies that would sufficiently limit emissions, even for higher economic growth. The GC scenario is becoming progressively less suitable for supporting and assessing the environmental and energy policies in the mid-term; this comes from the actual
development and the projected development having drifted further apart in a number of sectors. The high economic growth of the past few years, the emergence of service sectors such as ICT, the liberalisation of the energy markets, and uncertainties with regard to such developments are all reasons to adjust the projections.
This reference projection for greenhouse gases deviates from the GC picture in various aspects. It should be noted here that this is not a new long-term scenario. The term envisioned is only 10 years; no extended analysis of the surroundings has been carried out and there is just one single projection. For the economic environment a connection has been sought in the recently published Medium Term (up to 2010) of the CPB (2001,a,b). This report is not a prediction, but a projection based on certain principles and methods. The macro-economic environment employed by the sectors in question corresponds to the MLT-optimistic variant with a relatively high economic growth, so that the environmental objective can be considered in an environmentally unfriendly setting. CPB was on the advisory board.
The reference projection is carried out as a joint effort of the RIVM and the ECN. This report
describes the developments of all greenhouse gases. The development described here is based on two separate studies. The Reference projection for energy and CO2 (Ybema et al., 2002) gives insight into the developments in the energy supply and, as such, looks at the developments in the gas and
electricity markets, energy saving, renewable energy and the use of fuels. The Reference projection for non-CO2 greenhouse gases (Beker and Peek, 2002) gives a detailed description of the basis for the projection of the non-CO2 greenhouse gases.
This report does not look at the possibilities and the approach needed to realise emission reductions abroad (for example, via a Joint Implementation and Clean Development Mechanism, as described in the NCPIP Part II: Cooperation with foreign countries (VROM, 1999b). To allow results to be
checked against the Kyoto target for the Netherlands, they should be supplemented by the
projections/assumptions with respect to the reductions. In this report, the reductions of the planned, but not yet implemented, domestic policy measures are not included in the projection. However, the reduction effects of these measures are estimated in section 4.1.2.
This report does not include a separate section with a justification of the approach and methods followed. The relevant simultaneously published reports: ‘Reference projection for Energy and CO2 ’ and ‘Reference projection for non-CO2 greenhouse gases’ are mentioned. These reports look in detail at the economic and demographic background developments employed, the policies included and the uncertainties. The acidifying emissions of the energy supply and uncertainties are also studied in more detail in various background reports (Wesselink et al., 2002 and ECN/RIVM, 2002).
2.
Developments in greenhouse gas emissions 2001 - 2010
2.1 Developments in total greenhouse gas emissions
This section describes the development in the greenhouse gases emissions in a historical context and the projections up until 2010 in relation to the national Kyoto targets.
Dutch greenhouse gas emissions increased gradually in the period 1990 – 1998. The emissions in 1999 and 2000 then dropped to more than 2% above the 1990 level. A sharp drop in the non-CO2 greenhouse gases in 1999 was mainly due to a specific reduction measure (improved after-burning of HFCs in the chemical sector). Around 1999 the emissions of CO2 also stabilised, mainly due to the increased imports of electricity. The emissions of greenhouse gases in the reference projection is 225 + 14 Mton CO2 -eq in 2010. The estimated emission level in 2010 is just above that of 2000
(222 Mton CO2-eq.). The near stabilisation is the net result of a rise in the CO2 emissions of approximately 12 Mton and a fall in the emissions of the non-CO2 greenhouse gases by 9 Mton.
Emission of greenhouse gases
190 200 210 220 230 240 250 1990 1995 2000 2005 2010 E m issi o n of greenh ouse gases (i n M ton CO2-eq. )
Realised Reference projection
Figure 2.1 Emission of greenhouse gases in the period 1990 – 2010. The shaded area indicates the range in which the emissions fall if the uncertainty in societal developments and in monitoring of
emissions are taken into account. Policy goal
The Kyoto target for the Netherlands is an emission reduction of 6% with respect to 1990/19952. In the NCPIP, the policy target was defined by calculating the difference in the emissions from the high economic growth GC scenario in the fourth National Environmental Outlook (RIVM, 1997) in 2010 and the Kyoto target. This policy target amounted to a 50 Mton reduction. In the NCPIP, half of this was meant to be realised in the Netherlands, and half to be realised abroad. According to the updated reference projection, without the extra climate policies from the NCPIP, the policy target would be 40 Mton. The currently implemented domestic measures would realise 14 Mton of the targeted 40 Mton. To meet the Kyoto target, a further 26 Mton reduction would need to be realised with the (planned) domestic and foreign measures.
2 1990 is the reference year for the emissions of CO
2, nitrous oxide and methane; 1995 is the reference year for the emissions of the fluorinated gases.
Table 2.1 Policy target and emissions in the reference projection
Policy target
and NCPIP effect Emission(Mton)
Emission target in 2010 (Kyoto:-6% with respect to 1990/1995) 199
Emission reference projection in 2010 without NCPIP measures 239
Updated policy target 40 Mton reduction
Expected effect of domestic measures implemented 14 Mton reduction Reference projection emissions in 2010
(Including expected effect of domestic measures implemented) 225
Remaining policy target of (planned ) domestic and foreign measures 26 Mton reduction
2.2 Development in CO
2emissions
This section outlines the development in CO2 emissions with particular focus on the changes in the
energy consumption, the mix of fuel, the developments per sector and the uncertainties in the estimates.
The emissions of CO2 rose by 8% in the period 1990 – 2000. This rise was highest in the first five years. The smaller increase in the last five years was largely due to the increase in imported
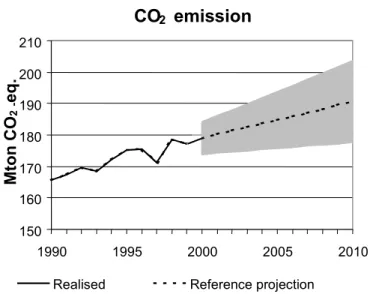
electricity. The lower economic growth in the period 2001 – 2010 goes hand in hand with an increase of 7% in the CO2 emissions in 2010 with respect to 2000, and an increase of 15% with respect to 1990.
CO
2emission
150 160 170 180 190 200 210 1990 1995 2000 2005 2010 Mto n C O 2-eq.Realised Reference projection
Figure 2.2 CO2.emissions. The shaded area indicates the range in which the emissions fall if the
uncertainty in the societal developments and in the monitoring of emissions are taken into account.
The estimated CO2 emissions in 2010 is 191 + 12 Mton. This is higher than the planned emission level from the Climate Policy Implementation Plan (186 Mton). The CO2 emissions development is determined by the changes in energy consumption and the mix of fuels. These changes are the result, for example, of other economic developments, consumer behaviour and energy prices. The economic growth in the period 2000 – 2010 is lower than in1990 – 2000. This contributes to lower CO2
Table 2.2 Economic growth, and increase in energy consumption and CO2 emissions, both
historically and in the reference projection
1990 – 2000 2000 – 2010
GDP 2.95% per year 2.5% per year
Energy consumption 1.0% per year 0.6% per year CO2 emissions 0.8% per year 0.6% per year
Between 1990 and 2000 the primary energy consumption rose by 1.0% per year, on average. The projection up to 2010 predicts a continuation of the growth of 0.6% per year. The tempo of energy-saving for the Netherlands as a whole, at 1.2 % per year, remains the same as in 1990 – 20003. No significant shift in the contributions from the most important fuels has taken place in the past 15 years. Natural gas and oil are the dominant primary fuels, with respective shares of approximately 50% and 35% in 1999. The share of coal is approximately 10%. There are small contributions from atomic energy, renewable energy and imported electricity. In the reference projection, the distribution of the primary fuels remains more or less constant up to 2010. In 2010, natural gas will still have a 50% share. The share of renewable energy does increase, but remains modest, at 3.5% of the total4. The largest sectors with respect to CO2 emissions are industry, electricity production and transport. The direct CO2 emissions from industry, transport and electricity production increase over time. The direct CO2 emissions from households, services and greenhouse horticulture decreases somewhat.
2.3 Developments in non-CO
2greenhouse gases
An outline of the emission developments in the non-CO2 greenhouse gases divided into the specific
substances (CH4 , N2O and F gases)
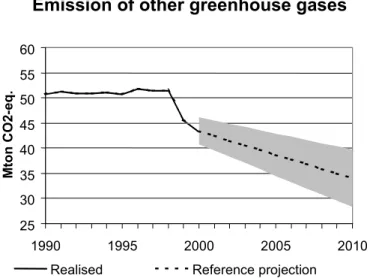
Emissions of the non-CO2 greenhouse gases have remained roughly stable from 1990 to 1998/1999. In the past two years substantial reductions have been realised in the emission of HFCs in the
chemical sector. After 2000, a continued drop in the non-CO2 greenhouse gases is expected, resulting in a drop in the emissions in 2010 of one-third compared to 1990. The share of the non-CO2
greenhouse gases in the total emissions of Dutch greenhouse gases will then have fallen from 24% in 1990 to 15% in 2010.
3 The rate of energy saving is calculated on the basis of the new Energy Saving Protocol. The energy-saving target based on the Protocol is 1.8% per year. There are uncertainties about both the historical and the future energy-saving tempo.
Emission of other greenhouse gases
25 30 35 40 45 50 55 60 1990 1995 2000 2005 2010 M ton CO 2-eq.Realised Reference projection
Figure 2.3 Emission of non-CO2 greenhouse gases. The shaded area indicates the range in which the
estimates fall when uncertainties in societal developments and monitoring of emissions are taken into account.
The estimated emissions of non-CO2 greenhouse gases in 2010 is 34 + 5 Mton. This means that a somewhat lower emission level is achieved than that planned in the Climate Policy Implementation Plan (36 Mton). The structural fall of the non-CO2 greenhouse gases in the period 2000 – 2010 is mainly due to a steady decrease in the CH4 emissions. Of all non-CO2 greenhouse gases, methane has been tackled first, mainly for non-climate reasons (renewable energy policy: landfill gas; waste policy: reduction in amount of waste for dumping). A downward trend is visible from 1990 onwards. The most important cause of this fall is the reduced numbers of livestock as a result of the manure and ammonia policy, and a reduction in the methane emissions from landfill sites. Many landfill sites were equipped with methane extraction installations in the past 10 years, while the dumping of organic material decreased significantly in that period.
Emissions of N2O currently show only slow decreases and remain fairly stable over the entire period of consideration. In the agriculture sector, the N2O emissions depend heavily on the use of artificial fertiliser and manure, which changes slowly over time. The N2O emissions in industry occur as a result of a few specific production processes. The so-called fluorinated gases show a much more erratic course. These substances are the ‘newcomers’ in the climate policy. Both the historical emissions and projections have been significantly adjusted in the past few years. This reference projection estimates a limited further fall in the F gases between 2000 and 2010. This fall is possible due to both the slower increase in the use of these substances and the effects of new policies.
0.0 10.0 20.0 30.0 40.0 50.0 60.0 1990 1995 2000 2005 2010 Mton CO 2 -eq.
CH4 N2O F-gases Total
Figure 2.4 Emissions of the non-CO2 greenhouse gases: methane, nitrous oxide and gases containing
fluorine.
2.4 Uncertainty margin of the emission projection in 2010
A description of the most important uncertainty factors in the projection of the emissions for
2010
The estimated emissions of greenhouse gases in 2010 are based on the CPB trade and industrial sector developments for a moderate economic growth (1.5% per year) in 2001 and 2002, and the MLT optimistic (higher) economic growth (2.75% per year) in the period 2003 – 2010. The ECN and RIVM have also investigated future developments, which may influence the energy consumption and the greenhouse gas emissions, and which currently cannot be estimated with any certainty. We should think here in terms of societal developments, which are difficult to predict, and possible changes of emission factors. Important uncertain societal developments for the energy consumption and the CO2 emissions include the oil price, the international competitiveness of the energy-intensive sectors, the use of electrical equipment, the import of electricity and the developments in the ICT sector.
Uncertain societal developments for the non-CO2 greenhouse gases are the number of livestock (N2O and CH4), the amount and composition of dumped waste (CH4), the production of nitric acid in the chemical fertiliser industry (N2O), and the production and application of fluorinated gases. Another uncertainty factor is a possible adjustment of emission factors and underlying data, such as the data from Statistics Netherlands (CBS) on energy consumption. The emission factors may be adjusted in the next few years as a result of research designed to improve the emission inventories. Much research has already been carried out the past few years and emission inventories significantly improved. The adjustments are expected to become smaller as time progresses.
The uncertainty amounts to 13 Mton for societal developments and 6 Mton for the emission factors. The uncertainties cannot just be added up. They are integrally calculated using statistical methods. The total uncertainty of societal developments and emission factors considered is estimated at 14 Mton.
Table 2.3 Margin of uncertainty for societal developments and emission factors (95% confidence interval)
Societal developments
in energy consumption and CO2 emissions
in emission of non-CO2 greenhouse gases
13 Mton
12 Mton 5 Mton
Emission factors
in the reference year
in the estimated emissions in 2010 with respect to the reference year
6 Mton
2 Mton 4 Mton
3.
The reference projection compared with the GC scenario
The Global Competition scenario is used as the basis for formulating the Climate Policy
Implementation Plan part 1: domestic measures (NCPIP-1). The NCPIP-1 measures (basic domestic package) were used to estimate the realisation of the (domestic) Kyoto target. The question is how the new reference projection relates to the GC scenario. The most important differences between the GC scenario and the reference projection are formed by the scenario environment and the expected effectiveness of the extra climate policy in the NCPIP-1.
3.1 Introduction
The ministries requested an investigation into the differences between the GC scenario5 and the reference projection. To determine the effect of the NCPIP measures in the reference projection, a variant of the reference projection without the NCPIP measures was drawn up. This chapter looks mainly at the differences that are not connected with the NCPIP policy. The difference in the effectiveness of the NCPIP is explained in the next chapter.
The reason for drawing up the reference projection has to do with the changes in various areas with respect to development in greenhouse gas emissions. Important changes are the projections of volume developments and dematerialization, the liberalisation of the electricity and gas markets (where we now have a better understanding of the consequences), technical developments, improved methods of estimation and the use of policy instruments. The emission levels of the GC scenario deviate from earlier reports, such as the MV4 and the NCPIP reports, in that they are recalculated using the current emission factors and the improved emission inventories.
3.2 Comparing the emission levels of all the greenhouse gases taken
collectively
This section explains the most important differences between the reference projection and the GC/NCPIP scenario.
Figure 3.1 shows the development of the greenhouse gas emissions in the reference projection (i.e., including the NCPIP measures implemented; 225 Mton in 2010) and the GC scenario (i.e., without the NCPIP measures; 246 Mton in 2010). The difference is approximately 21 Mton. One of the most important causes is actualising the year in which the projection started. The GC scenario started in 1995 and reached emission levels in 2000 that were approximately 9 Mton higher than in the reference projection (where 2000 is the starting year). Other important causes for the difference in 2010 are the developments in the period 2000 – 2010. In this period the emissions are estimated to be lower because of the economic growth, volume developments for the non-CO2 greenhouse gases, the import of electricity, the use of electrical equipment and the extra climate policy from the NCPIP. The opposite of these developments are less dematerialization, less combined heat and power, more coal-fired power stations and increased mobility.
An important element when comparing the projections is whether or not to include the extra NCPIP climate policy. The projections without the NCPIP policy are higher in the GC scenario than in the reference projection. The plannned target in the GC scenario is shown for the projections with the NCPIP policy, i.e. including both the measures set at the time and the planned measures. In the
5
An important difference is that the GC scenario was one of the scenarios from the Long-Term Surveys (CPB, 1997) which spanned the period 1995 to 2020. The starting year for the reference projection was actualised to 2000, with 2010 as its end year.
projection using the NCPIP policy, only the set policy is included in the reference projection, and not the planned measures.
Emission of greenhouse gases
210 220 230 240 250 199 199 200 200 201 Mt o n CO 2-eq .
Realised GC Reference projection
UK-effect in GC UK-effect
in RP
Figure 3.1 Emissions of greenhouse gases with and without the NCPIP policy in the GC scenario and the reference projection (RP).
Table 3.1 Emission of greenhouse gases in the GC scenario and the reference projection Carbon dioxide (CO2 ) Non-CO2 greenhouse
gases
All greenhouse gases
Without With Without With Without With
GC 203 186 42 36 245 222
RP 199 191 40 34 239 225
The projections are given for the following situations: - Without: without the policy measures from the NCPIP;
- With: the intended reduction through the NCPIP in the GC scenario and with the current NCPIP measures implemented in the reference projection (RP).
The following sections go into more detail about the differences between CO2 and the non-CO2 greenhouse gases.
3.3 Explanation of the difference in the CO
2emission levels
The most important developments (economy, energy demand, energy supply, policy)show differences between the GC and the reference projection.
The development of the CO2 emissions in the reference projection (191 Mton in 2010) and in the GC scenario (203 Mton in 2010) is shown in Figure 3.2. The difference is approximately 12 Mton. One of the most important causes is the actualisation of the starting year of the projection. The GC scenario started in 1995 and reached an emission level in 2000 that was 6 Mton higher than in the reference projection (with 2000 as the starting year). Other important causes for the difference in 2010 are the lower economic growth (3 Mton) and the effects of the NCPIP (8 Mton). Developments increasing the emissions are dematerialisation, more coal used in power stations and increased mobility.
CO
2emission
150 160 170 180 190 200 210 1990 1995 2000 2005 2010Mton CO
2-e
q
Realised GC Reference projection
Figure 3.2 CO2 emissions in GC and the reference projection.
Table 3.2 CO2 emissions in the GC and reference projection in 1995, 2000 and 2010 (Mton CO2 )
1995 2000 2010
GC 175 185 203
Reference projection 175 179 199 (without
NCPIP) 191 ( with
NCPIP)
CO
2emissions in the starting year of the reference projection (2000)
Various developments in the period 1995 – 2000 have resulted in the actual CO2 emissions in 2000 being lower than the CO2 emissions according to the GC scenario. The difference is 6 Mton. Most of this is associated with, on balance, the lower emissions from the electricity sector, industry and glasshouse horticulture. The realised emissions from the transport sector were actually a little higher than the emissions according to the GC scenario. The most important causes are explained below. The actual energy consumption in 2000 was 130 PJ lower than the energy consumption in 2000 according to the GC scenario. This difference is not a result of a lower economic growth. There was actually stronger economic growth in the Netherlands from 1995 to 2000 (3.7% per year, on average) than assumed in the GC scenario. However, the growth occurred in the service sector. The difference is caused by the growth in the energy-intensive sectors being lower than assumed in the GC scenario.
In the GC scenario, the growth of the economy was more directly translated into a strong volume growth in the energy-intensive sectors. In addition, the import of electricity in 2000, for which conversion losses during the generation are not attributed to the Netherlands, was much higher than assumed in the GC scenario. Finally, approximately 30 PJ of the difference is due to several figures being corrected in the reference projection but not yet in the GC scenario..
Comparing the projections without the extra NCPIP climate policy
The CO2 emissions in the reference projection without the NCPIP measures (RP without) are 4 Mton lower than in the GC scenario (GC without). This is due to the altered exogenous scenario parameters such as the economic growth of the Dutch economy and the growth of underlying sectors, other energy prices through the world oil price, altered price-making for natural gas and electricity,
developments in energy-saving technology and various improved estimation methods. Table 4.3 gives an indication of some causes of lower or higher emissions for the sectors. The smaller role of
combined heat and power in RP-without with respect to that of GC contributes to the shift of emissions between the sectors.
Sector differences in emissions are indicated in Figure 3.3 and explained in Table 3.3. The table and figure sometimes contain different sector definitions such as joint ventures, whereby the numbers can deviate, one from the other.
0 10 20 30 40 50 60 70 GC RP T,S & PS GC RP agriculture GC RP households GC RP traffic GC RP energy GC RR industry Mton CO2-eq. emission after reduction by NCPIP measures emission avoided by NCPIP measures
Figure 3.3 CO2 emissions and the emissions avoided by the NCPIP measures
Table 3.3 Changes in the reference projection with respect to the GC scenario leading to higher or lower CO2 emissions. Excluding changes due to the deployment of the extra climate policy of the
NCPIP. Sector Less CO2 More CO2 Difference in CO2 emissions in the reference projection (without NCPIP) with respect to GC scenario (Mton) Industry and
refineries less growth, lower throughputby the refineries, less CHP less dematerialization, aluminiumindustry continues to exist, lower energy prices
-8 Mton Energy sector more import, less district
heating, less use of electrical equipment in households and in the Trade, services and public sector (T,S & PS)
less decentralised generation (CHP), more generating hours for coal-fired power stations, lower average efficiency, a better estimate of heat production during waste incineration, higher energy consumption for gas extraction, lower gas prices
+9 Mton
Traffic stronger autonomous
technology development higher road traffic volume level(passengers and freight) +3 Mton Households fewer households, higher gas
price, better high efficiency boilers, warmer climate
no impact -1 Mton
Agriculture less growth, higher gas prices, less CHP, warmer climate
no impact -4 Mton
T.S. & P.S. less growth, Energy
performance standard (EPN), less CHP, warmer climate
no impact -3 Mton
Total -4 Mton
3.4 Explanation of the difference in emission levels of the non-CO
2greenhouse gases
Here we describe the most important developments explaining the differences in the development of the non-CO2 greenhouse gases in GC and the reference projection according to activity level,
emission factor and policy.
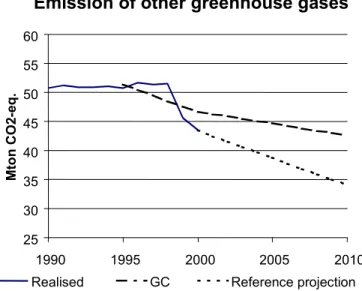
Figure 3.4 shows the emission pattern of the non-CO2 greenhouse gases in the reference projection (34 Mton in 2010) and the GC scenario (42 Mton in 2010). The difference is approximately 8 Mton CO2 equivalents. The most important causes for this difference are the volume level (2 Mton) and the effect of the NCPIP (6 Mton). The difference in the volume level occurs for N2O and fluorinated gases, and is ascribed to the starting year and the development in volume series.
Emission of other greenhouse gases
25 30 35 40 45 50 55 60 1990 1995 2000 2005 2010 M ton CO 2-eq.Realised GC Reference projection
4.
Effect of the Climate Policy Implementation Plan
Forthcoming from the request of the ministries of VROM and EZ, this section looks in more detail at the effects of the measures and policies, as formulated in the Climate Policy Implementation Plan on the emissions of greenhouse gases. The side-effects of the CO2 reduction measures on acidifying emissions of the energy supply are also examined.
4.1 Effect on the greenhouse gas emissions
4.1.1 Effects of implemented policies
Effects of implemented policies on the emission of greenhouse gases.
The climate policy of the NCPIP assumes an emission reduction of 50 Mton CO2 equivalents compared to the GC scenario. In the NCPIP the Dutch government chose to allow half the emission reduction (25 Mton CO2 equivalent) take place in the Netherlands and the other half abroad. The NCPIP indicates what the expected effects are per sector and which policy instruments should be applied. This reference projection includes all policy instruments from the NCPIP implemented before July 2001. The reduction effect of the policy measures in the NCPIP has been verified. This effect occurs in addition to that of the energy policy in force at the time of the NCPIP and other policies (particularly waste and agriculture) having an effect on the emissions of greenhouse gases. These policies lead to a reduction of approximately 22 Mton in the period 1990 – 2000 (RIVM, 2001). Approach
To get an idea of the impact of the climate policy, a variant of the reference projection has been assessed without including the policy instruments arising from the NCPIP policy document. The working method given above implies that if the emissions of CO2 are lower than in the GC scenario, but not due to the policy related to the NCPIP policy document, the CO2 emissions will not be attributed to this policy. For greenhouse horticulture the effect is clearly obvious. The reference projection gives significantly lower emissions for greenhouse horticulture than the GC scenario, which is primarily a result of the higher consumer prices for natural gas expected for this sector. The opposite can also be true. For instance, the CO2 emissions from the coal-fired power stations in the reference projection in 2010 is already higher than in the GC scenario, though they would have been even higher without the measures from the NCPIP-1 policy document. This definition is not 100% correct. Indeed, the policy aimed at CO2 reduction with regard to the greenhouse horticulture remains in force and will also influence the developments, while not being reflected in the policy effects. Then again, the effect that could be achieved by a coal covenant would increase if more coal were used. Results
The total difference in emissions between the reference projection and its variant without the NCPIP policy is 14 Mton, of which 8 Mton results from the measures already set and policy aimed at CO2 reduction. This outcome is in line with the ECN/RIVM assessment of the measures from the NCPIP policy document (Beeldman et al., 1999). For CO2, the ECN/RIVM assessment produced a CO2 reduction of 7 Mton as a result of the so-called ‘hard’ measures. The currently planned CO2 measures are not included in the reference projection. The reduction forthcoming from this policy in
preparation will be separately estimated in the next paragraph.
In the reference projection approximately half the planned CO2 reduction effect of the NCPIP-1 policy document is achieved. The lower reduction is realised, for example, in the policy regarding coal-fired power stations. In the NCPIP-1 policy document, it was planned to negotiate a Coal covenant with a planned reduction of 6 Mton (in addition to GC). Although the coal covenant has not yet been signed, the supporting policy measures already implemented are resulting in a reduction of 0.8 Mton due to the extra use of biomass. Whether the Benchmark from the electricity sector leads to a reduction is not
certain. At the moment a Coal covenant is being prepared, which would make it possible to reduce an extra 1 to 2 Mton. The Coal covenant in preparation is not included in the reference projection. The energy-saving policy in built-up and industrial areas achieves a lower CO2 reduction than planned (2 Mton less). In the glasshouse horticulture sector, the GLAMI covenant gives a 1 to 2 Mton smaller reduction compared to the NCPIP. Compared to the GC scenario, the reference projection assumes higher energy prices for this sector, in which energy saving is present but not attributed to the NCPIP policy. In a general sense we can say that the energy-saving measures may deliver less because the energy consumption in the reference projection is lower than in the GC scenario. After all, less can be saved when less is consumed, so that the reduction potential decreases.
For the non-CO2 greenhouse gases the reduction achievable due to the policies is somewhat smaller than reported in the assessment. The most important reason is that the emission level (without NCPIP policy) in the reference projection is lower than was assumed at the time of the NCPIP. This also means that the measure achieves a lower reduction. The planned emission level is easily met.
Table 4.1 Reduction in the emissions of greenhouse gases in Mton CO2 equivalents from:
RP: measures from the NCPIP-1 already implemented in the reference projection. Measures in preparation are therefore not included. The reduction is ascertained by determining differences between the RP and a variant of the RP, in which the NCPIP-1 measures have not been included;
NCPIP-1: the planned measures in the NCPIP-1 and their effect compared to the GC scenario, as reported in the NCPIP-1.
Measures
Reduction Explaining the difference between RP andNCPIP-1
(Extra contribution from NCPIP-1)
RP
NCPIP -1 Support CHP
(CHP payment deduction, higher EIA, BSB conversion)
0.5 - Measures to ensure increase in CHP have some effect; the use of CHP in the RP is much lower than in the GC scenario. Industry and refineries saving
(benchmark covenant, Multi-year agreement 2 (MJA-2)
1.4 2.3 Fewer residual heating projects than expected; as yet no goal for Broadening themes of the MJAs.
Glasshouse horticulture saving
(GLAMI) 0.1
1 2.0 Higher gas prices have a larger effect than the GLAMI. GLAMI target is not met.
Existing housing saving
(higher Regulatory energy tax (REB), EPA, EPR)
1.0 2 Voluntary EPA has less effect. Existing commercial and non-residential
buildings saving (higher REB, EPA)
0.7 1 Effect of EPA is limited due to voluntary nature.
Energy-efficient equipment (higher REB, energy labels, EPR)
0.8 0.3 Larger reduction is a result of combination of labels and higher REB electricity.
Measures for coal-fired power stations
(higher REB and Articles 36I and 36o) 0.8
2 6.0 Coal covenant is still being prepared and the effect is not included; higher REB and articles for renewable energy (art. 36I and 36o) lead to additional biomass complementary and supplementary heating of 4%.
Intermediate goal renewable 5%
(higher REB and Articles 36I and 36o) 2.0
3 4.04 Renewable share remains limited to 3.5%, of which 0.6% imported; import of renewable electricity does not lead to CO2reduction in NL
Improved energy-efficient traffic 1.2 2.2-2.9 No sanction possibilities with respect to. ACEA covenant; no pay-as-you-ride; no differentiation of the BPM but less effective energy-efficient private vehicle tax [OK?]in 2002 tax plan; kilometre pricing is not included5.
Accelerated forestation n.c. 0.1 n.c. = not considered in reference projection.
Total CO2 7.7 17
Use of fluorinated gases 1.0 4.0 Lower reference emission level so that measures reduce less.
PFC aluminium 1.2 1.2
HFC process 3.66 2.5 Higher volume growth whereby measures reduce more. N20 car catalytic converters 0 0.5 From measurements it appears that emissions are much lower
than expected, so that a policy not needed. Total non-CO2 greenhouse gases 5.8 8
Total greenhouse gases 13.5 25
1 The GLAMI covenant and an expected price increase of natural gas lead collectively to energy savings. The CO 2
reduction is almost entirely attributed to the effect of higher gas prices for greenhouse horticulture than assumed in NCPIP-1. The policy effect is made up of a small additional effect from the GLAMI and the effect of additional stimulation of technology. If the gas price for market gardeners were to increase less or not at all, then the expected energy saving under the influence of the GLAMI covenant would be roughly the same. The emission-reduction effect attributed to the GLAMI would then be 1.0 Mton.
2 REB-level from before NCPIP-1, with articles for renewable energy (art 36i and 36o) already leads to 6% biomass supplementary heating (1.1 Mton).
3 Import of electricity from renewable sources will force out the import of grey power. This may well lead to a CO reduction abroad, provided that the import demand from the Netherlands leads to an increased production of renewable energy abroad. The policy of the Ministry of Economic Affairs aims to ensure that imports of renewable energy meet these requirements. The extent of the CO2 reduction abroad depends on the sort of electricity production that is replaced; it is between 0.5 and 1.5 Mton CO2. There is also an overlap of 0.8 Mton with measures at coal-fired power stations.
4There is an overlap of 2 Mton with measures at coal-fired power stations.
5 Depending on the specification of kilometre pricing, the effect will be between 0 and 2 Mton. 6 Of this, 2.1 Mton has already been realised.
4.1.2 Policy in preparation
Effects of policies in preparation on the emissions of greenhouse gases. The effects are not included in the projection.
The Reference projection for 2001-2010 is, with a few exceptions, based on government policy up to 1 July 2001 and is assumed to continue to 2010. The Ministry of VROM has requested ECN and RIVM to indicate what the effects of the policy measures in preparation might be on the CO2 emissions indicated in the reference projection.
If we assume the policy implemented in Part 1 of the NCPIP, the effect of reduction in the Reference projection will be estimated at 7.7 Mton, as shown in section 4.1.1. Implementing the current policy in the ‘pipeline’ will increase the certainty that this reduction effect will be met. Many measures in preparation represent a continuation or repair of the policy measures included in the Reference projection. Besides, some measures provide a new stimulus for CO2 reduction. These are, namely, tightening up the Energy Performance Coefficient (EPC) for new non-residential buildings, kilometre pricing, ‘new-style’ driving and the Coal covenant.
Table 4.2 shows the estimation of the additional effect of exceptional measures.
Table 4.2 The expected additional and intended effect of CO2 reduction in policy’ in preparation’ with
respect to the Reference projection, showing a maximum obtainable effect for two of the measures in realising the policy aims.
Expected additional effect in 2010
(Mton)
Intended effect if policy aim is realised
(Mton)
Renewables: wind –energy covenant BLOW1 0-0.10 0.30
Services: tightening up the EPC for non-residential
building 0.15-0.25
Services: coupling EPA2 for non-residential building as in Environment Management Act
0 Households: intensifying the EPA for existent dwellings 0.05-0.20 Communities: the BANS3 climate covenant for
municipalities and provinces 0.05-0.20
Industry: MJA-2 with Broadening themes 0.05-0.20
Agriculture: General Administrative Order for
glasshouse horticulture 0-0.25 0.80
Transport: kilometre pricing 0.70-1.50
Transport: ‘New-style’ driving 0.20-0.30
Transport: short-trip programme 0
Electricity production: Covenant for coal-fired plants and CO2 production
0.7-1.7
Total 1.9-4.7
Expected realisation 2.5
1 Intergovernmental agreement on national development of wind energy 2 Energy performance advice
3 Intergovernmental agreement new-style
The total effect is estimated at 1.9-4.7 Mton. Realisation of the top of this range depends on how kilometre pricing is set up, how willing the owners of coal plants are to invest in view of the uncertain energy price developments and how enforceable some of the measures in the coal covenant are. In view of current insights, the chance of realising the top of the range is small. The most likely effect is a reduction of 2.5 Mton.
4.2 Side-effects on acidifying emissions
Finally, the effect is estimated of the extra climate policy implemented (NCPIP) on the emissions of acidifying substances in the reference projection.
Although the measures and instruments in the Climate Policy Implementation Plan are primarily aimed at the reduction of greenhouse gases, there are also effects on the emissions of acidifying substances. A further limitation of these emissions is an important side-effect for the environment. The order of magnitude of the reductions of these substances has been estimated as an indication of the side-effects, based on an earlier analysis and assumptions similar to those in ‘Assessment of the effects of the Climate Policy Implementation Plan’ (Beeldman et al., 1999; in Dutch).
Table 4.3 Indication of effects of the Climate Policy Implementation Plan on acidifying emissions, VOCs and particulate matter in 2010
Reduction per sector NOx
(kton) SO2 (kton) VOS (kton) Particulate matter (kton) CO2 (Mton) Traffic 1.1 0 1.1 0.06 1.2 End users 3.4 0.5 0.3 0.01 4.5
Coal-fired power stations 0 0.3 0 -0.04 0.8
Renewable energy 0.7 0.5 0.1 0.01 1.2
Total reference projection 5.2 1.3 1.5 0.04 7.7
Total reduction in NCPIP-1 10.5 5.5 --- 0.25 17
Emission target NMP4 231 46 163
Emission in reference projection
289 70 220 27 192
Emission in GC 301 95 247 32 203
The effect of the NCPIP leads to approximately 5 kton extra NOx reduction, 1 kton SO2 reduction, 2 kton VOC reduction and 0.04 kton particulate matter reduction in 2010. These reductions are lower than the reductions in NCPIP-1; i.e. than if the NCPIP measures were to be implemented in full against the background of the GC scenario from the fourth National Environmental Outlook. The emission target of the Fourth National Environmental Policy Plan (VROM, 2001) for the acidifying substances are not met in 2010 with the policy implemented in the reference projection
(see Table 4.3).
Conclusions on side-effects of the Climate Policy Implementation Plan
The CO2 reduction measures of the Climate Policy Implementation Plan also lower other substances emitted from the energy suppliers, namely NOxand SO2. It is therefore easier for the large companies in the industrial sector, refineries and the electricity sector, which take part in the NOx emission trade to realise the collective aim (55 kton in 2010).
Appendix A
Overview of implemented and planned policies
Table A.1 Overview of the policy measures implemented and included in the reference projection and the measures currently planned by the government, which are not included in the assessments.
Sector Included in RP Not included in RP
Generic REB at current level (indexed) BANS climate covenant with local authorities and provinces
operating support CHP in REB CO2 reduction plan
fiscal incentives via EIA and VAMIL (effective contribution 20% of investments)
partly tax-deductible interest from green investments
Industry Benchmark covenant MJA-2 with Broadening themes MJA energy-efficiency (1st generation)
environmental permit
Energy REB zero-tariff green electricity covenant with coal-fired power stations (not yet signed) plus Article U
payment deduction REB for renewable energy REB clean fossil facility for 2003 (maximally 25 million euro per year) wind energy covenant (State-provinces) Glasshouse horticulture GLAMI covenant General Administrative Order- Glasshouse
horticulture (not yet published) Trade, services,
government
voluntary EPA linking EPA with AmvB Environmental Management Act (not yet finalised) EPN for new housing tightening EPC for non-residential buildings
per 1-1-2002 Traffic and transport EU agreement with car manufacturers kilometre pricing
purchase incentive for economical cars and labelling
projects based on CO reduction plan: BPM exemption for in-car instruments “Short trips” project
intensified enforcement of speed limits fiscal dealings with commuter traffic, business trips, taxable car benefit
increased tyre pressure “New-style” driving Households voluntary EPA concentrating EPA policy
EPN energy premium for energy savings in the home
Energy labels with a premium for most efficient equipment (since 1-1-2001, energy premium scheme has been extended by 3 categories of renewable energy equipment (sun -pv, sun-thermal and heat-pump boilers), to be extended per 1-1-2002 with 1 more category (heat pumps)
19% VAT
Other greenhouse gases measures with a reduction effect of 6 Mton CO2
equivalent in 2010 measures identified in the Reductionprogramme for non-CO2 greenhouse gases (ROB) as additional reduction potential
Appendix B
Technical information on the determination of
emission levels
This appendix provides technical information, forming the base for carrying out the calculations, such as the emission factors. Results, such as the emission levels of sectors, are presented in the reference projection and the Global Competition scenario. The following subjects are dealt with under the following headings (in this order):
1 Emission levels of the Global Competition scenario: adjustment of emission factors 2 Sector emissions of greenhouse gases in the reference projection and the GC scenario 3 Emission reduction resulting from the Climate Policy Implementation Plan
4 Emission of greenhouse gases in the NCPIP
5 Overview of Greenhouse Warming Potential (GWP) factors 6 Margin of uncertainty for the emissions of greenhouse gases
B.1 Emission levels of the Global Competition scenario: adjustment of
emission factors
An explanation is given of the way in which the emission levels of greenhouse gases belonging to the Global Competition scenario are adjusted in this report to enable a consistent comparison with the results of the reference projection. The emissions in this report, which belong to the GC, therefore deviate from the emissions as described in the Climate Policy Implementation Plan.
Work is continually being done to improve the emission factors and underlying data such as the energy consumption for the benefit of the emission inventories, for example. The reference projection makes use of the most recent data, particularly in relation to emission factors. As this report often compares the reference projection with the GC scenario that was used in the NCPIP policy document, the emissions from the GC scenario are re-estimated here on the same basis as emission factors used in the reference projection.
B.1.1 Improvement of the emission inventories
An important goal of the Emission Inventories is to be able to determine the realised emissions in the Netherlands more accurately. The latest knowledge leads to regular adjustment of emissions of previous years in the Emission and waste annual report (EAJR; Emission monitoring EM) and the Environmental Balance. Examples of improvements in the emission inventories:
- The N2O emissions from the nitric acid industry have recently been re- measured;
- New measurements have been carried out for catalytic converters of cars for the N2O emissions from kilometre traffic;
- Of the fluorinated gases, HFC and PFC emissions as by-products of the chemical and aluminium industries, respectively, have recently been measured; the leak percentages in the cooling sector have been adjusted; since the Option document, a general recalculation of the SF6 emissions has taken place (from potential to actual emissions);
- In 2000 it was discovered that the CO2-process emissions from the cement industry in 1990 had not been included;
- In recent years, the CBS has eliminated the statistical difference in energy consumption for all previous years;
- In recent years the energy consumption was counted twice in the individual company data (coke-oven gas in the steel industry) and during electricity generation.
The most recent figures for the previous years are given in the Emission Monitor 2001 and the Environmental Balance 2001. By way of illustration, Table B1.1 shows the difference between the years 1990 and 1995 with the 1998 Option document.
B.1.2 Adjustment of the emissions from the GC scenario
The reference projection makes use of the most recent emission factors, while the GC scenario was based on outdated emission factors. To be able to compare the reference projection and the GC scenario, a rough estimate is made of the emissions from the GC scenario based on the most recent emission factors. To do this, the emissions from GC in 2010 are adjusted with the difference from the year 1995, as the GC scenario starts in 1995. For the fluorinated gases, the accumulation over time is taken into account (see Table B1.1). The original GC scenario is also corrected for the reduction effect from the CO2 reduction plan. Table B1.2 gives an overview of the emissions in 2010 for the adjustment per greenhouse gas.
The emission level of the Kyoto target (-6% with respect to 1990/1995), as reported in the NCPIP, is also altered (Environmental Balance 2001) due to the improved emission inventories, as are the emissions of the reference year 1990/1995. The adjustment of the emission factors therefore changes both the GC emissions in 2010 and the emission level of the Kyoto target. The net result is a reduction of the policy target from the NCPIP from 50 Mton to 46 Mton. Table B1.3 indicates the emissions from the GC scenario, the Kyoto target and the policy target according to the NCPIP, summarised for the original and adjusted GC scenario. In the adjusted GC scenario, the measures from the NCPIP have less of a reduction effect for the non-CO2 greenhouse gases, mainly because the emission level of the fluorinated gases is lower. There is therefore less to be reduced. The total NCPIP effect as calculated in the NCPIP is therefore reduced from 25 Mton to 23 Mton (see Table B1.4).
The emission level calculated in the NCPIP on the basis of the GC scenario, assuming that all NCPIP measures are carried out with the planned effect, decreases as a result of the adjustment of the emission factors from 231 Mton to 222 Mton (see Table B1.5).
Table B1.1 Difference in emissions between the Option document and the Environmental Balance 2001 (RIVM, 2001) for 1990 and 1995, and the adjustment of the GC emissions in 2010
Kyoto Protocol reference year 1990/19951 GC scenario starting year 1995 Adjustment GC scenario 2010 Explanation
CO2 industry 1 1 1 Eliminating statistical difference and
correction of cement industry process emissions.
CO2 traffic 0.5 0.5 0.5 Recalculation of energy consumption
(MB2000 with respect to MB1999) CO2 T.S. &
P.S.
0.5 0.5 1.5 Elimination of statistical difference:
natural gas
CO2 other2 0 2 1 Elimination of statistical difference
N2O industry 2.1 2.4 2.4 Measurements instead of calculations of
nitric acid
N2O traffic 1 1.6 1.3 Improved traffic measurements
Fluorinated gases (industry)
2 2.1 3 Improved calculation of SF6 emissions
and adjustments of leak percentages during use in the cooling sector
Total 7 10 11
1. Reference year for CO2 and N2O is 1990; for fluorinated gases it is 1995.
2. CO2 other target groups, including waste treatment companies, construction, sewerage and water purification plants, and drinking-water companies.
Table B1.2 Emission of greenhouse gases in 2010 according to the GC scenario; original data (MV4) and after adaptation as a result of adjusted emission factors and CO2 reduction plan
GC emissions (MV4) Effect CO2 red. plan (included in NCPIP and NMP3) Effect of adjusting emission factors GC emissions as reported in this study CO2 210 -3 -4 203 CH4 14 0 0 14 N2O 21 0 -4 17 Fluro. gases 14 0 -3 11 Total 259 -3 -11 245
Table B1.3 Emission of greenhouse gases in GC (including CO reduction plan) and GC adjusted in 2010 (Mton CO – eq.)
Scenario CO2 Other
greenhouse gases
Total Kyoto target (-6% with respect to
1990/1995)
Policy target
GC 207 49 256 206 50
GC adjusted 203 42 245 199 46
Table B1.4 Reduction of the non-residential building measures in 2010 according to the NCPIP policy document and after adjustment of the emission factors
CO2 Non-CO2 greenhouse
gases
Total
NCPIP effect (VROM, 1999a) 17 8 25
NCPIP effect (VROM, 1999a): adjusted 17 6 23
.
Table B1.5 Emission from the GC scenario with intended effect of all NCPIP measures in 2010 according to NCPIP and after adjustment of the emission factors
CO2 Non-CO2 greenhouse
gases
Total
GC with NCPIP measures (VROM, 1999a) 190 41 231
GC with NCPIP measures (VROM, 1999a): adjusted
B.2 Sector emissions of greenhouse gases in the reference projection
and the GC scenario
Tables B2.1 to B2.3 show the emissions in 2010 according to the reference projection, including the effect of the NCPIP measures implemented, as estimated by Beeldman et al., 1999 in the GC scenario without the NCPIP measures and the difference between these two projections.
Table B2.1 Emission of greenhouse gases in the reference projection per substance and per sector in 2010 (Mton CO2 eq.) CO2 CH4 N2O F-gases Total Industry1 65 0 7 5 77 Energy sector1 50 6 0 0 56 Traffic 39 0 1 0 40 Agriculture 7 8 6 0 20 Households 20 0 0 0 20 T. S. & P.S. 10 0 0 0 10 Other 0 1 2 0 2 Total 191 14 15 5 225
1 The emissions from joint ventures (7 Mton CO2 ) are subtracted from the industrial sector and is attributed to
the energy sector.
Table B2.2 Emission of greenhouse gases in the GC scenario6 per substance and per sector in 2010
(Mton CO2 -eq.). CO2 CH4 N2O F-gases Total Industry1 65 0 9 11 85 Energy sector1 53 5 0 0 59 Traffic 38 0 1 0 38 Agriculture 14 8 7 0 28 Households 23 0 0 0 23 T.S. & P.S. 11 0 0 0 11 Other 0 2 0 2 Total 203 14 18 11 245
1 The emissions from joint ventures (13 Mton CO2 ) are subtracted from the industrial sector and attributed to
the energy sector.
2 The emissions from agriculture include mobile machinery.
Table B2.3 Table showing difference between reference projection and the GC scenario per substance and per sector (Mton CO2 -eq.)
CO2 CH4 N2O F-gases Total Industry -1 0 -2 -6 -9 Energy sector -4 1 0 0 -3 Traffic 2 0 0 0 2 Agriculture -7 0 -1 0 -7 Households -3 0 0 0 -3 T.S. & P.S. 0 0 0 0 0 Total -12 0 -2 -6 -20
6 GC scenario from the MV4, including the CO
2 reduction plan. The emissions are also adjusted to the emission factors in conformance with MB2001.
B.3 Emission reduction in the Climate Policy Implementation Plan
Tables B3.1 and B3.2 show the respective emissions reductions estimated by the ECN/RIVM of the NCPIP measures implemented and the emission reduction of the NCPIP measures as calculated in the NCPIP.
Table B3.1 Emission reduction of the NCPIP measures implemented in the reference projection in 2010 (Mton CO2 -eq.) CO2 CH4 N2O Flour. gases Total Industry 1.4 0 0 5.8 7 Energy sector 3.31 0 0 0 3 Traffic 1.2 0 0 0 1 Agriculture 0.1 0 0 0 0 Households 1.0 0 0 0 1 T.S. & P.S. 0.7 0 0 0 1 Total 8 0 0 6 14
1 The reduction effect of CHP and efficient equipment is attributed to the energy sector
Table B3.2 Emission reduction of the Climate Policy Implementation Plan in the GC scenario according to the NCPIP in 2010 (Mton CO2 -eq.). The adjusted emissions factors are taken into
account. CO2 CH4 N2O Fluor. gases Total Industry 2.3 0 0 6.1 8 Energy sector 8.0 0 0 0 8 Traffic 2 0 0 0 2 Agriculture 2.0 0 0 0 2 Households 2.3 0 0 0 2 T.S. & P.S. 1.0 0 0 0 1 Total 17 0 0 6 23
B.4 Emission of greenhouse gases in the NCPIP
Table B4.1 Emission of greenhouse gases in the GC scenario, with NCPIP measures as calculated in the NCPIP (Mton CO2 -eq.)
CO2 CH4 N2O Flour. gases Total Industry 63 0 9 5 77 Energy sector 45 5 0 51 Traffic 36 0 1 37 Agriculture 12 8 7 26 Households 21 0 21 T.S. & P.S. 10 10 Other 0 2 2 Total 186 14 18 5 222
B.5 GWP factor
Table B.5 Conversion factor for climate change
Substance Factor N20 310 CH4 21 HFCs 140 – 117001 PFC s 6500 – 92001 SF6 23900
1 The GWP varies per substance within the group of HFCs and PFC s.
B.6 Margin of uncertainty for the emission of greenhouse gases
Uncertainty per sector emission : 95%
0 2 4 6 8 10
agriculture industry and refineries
HDO households
traffic e-sector
[Mton CO2-equivalents]
CO2 Other greenhouse gases
Figure B6.1 Indication of the margin of uncertainty for the emission of greenhouse gases in 2010 (confidence interval 95%). The margin is, roughly speaking, symmetrical with respect to the estimated
emission in 2010, that is, the presented uncertainty is applicable both downwards and upwards with respect to the reported emissions of the sectors.