COSTS OF OFFSHORE WIND
ENERGY 2018
Note
Sander Lensink and Iulia Pisca
Costs of offshore wind energy 2018
© PBL Netherlands Environmental Assessment Agency The Hague, 2019
PBL publication number: 3623
Corresponding author
iulia.pisca@pbl.nl
Authors
Sander Lensink and Iulia Pisca
Production coordination
PBL Publishers
This publication can be downloaded from: www.pbl.nl/en. Parts of this publication may be reproduced, providing the source is stated, in the form: Sander Lensink and Iulia Pisca (2019), Costs of offshore wind energy 2018. PBL Netherlands Environmental Assessment Agency, The Hague.
PBL Netherlands Environmental Assessment Agency is the national institute for strategic policy analysis in the fields of the environment, nature and spatial planning. We contribute to improving the quality of political and administrative decision-making by conducting outlook studies, analyses and evaluations in which an integrated approach is considered paramount. Policy relevance is the prime concern in all of our studies. We conduct solicited and
Contents
1
FINDINGS
4
2
RESEARCH QUESTION
5
3
METHOD
5
3.1 Electricity grid costs 5
4
RESULTS
6
1 Findings
The Dutch Ministry of Economic Affairs and Climate requested PBL to conduct an update on SDE+ base amounts and grid connection costs of offshore wind energy in the Netherlands, based on current market insights. This note presents the results of the update, which were drawn on those of past offshore wind tenders in the Netherlands and the trends in
surrounding offshore wind energy markets. The designated wind farm zones opened for tender in the upcoming 2019–2026 period, as outlined in the Netherlands’ Offshore Wind Energy Roadmap 20301, feature the following zones: Hollandse Kust (Zuid) sites III and IV,
Hollandse Kust (Noord), Hollandse Kust (West), Boven de Wadden Eilanden and IJmuiden Ver.
The production costs for offshore wind energy, calculated using the methodology of base amounts over a 25-year lifetime, average out at 0.047 EUR/kWh. In the analysis, the distribution of costs over the various sites comes to 0.007 EUR/kWh per site. These costs do not include grid connections. The most cost-effective zone is Hollandse Kust (Zuid) sites III and IV, while the highest costs are incurred in Boven de Wadden Eilanden and IJmuiden Ver. The higher costs (excluding grid connection costs) in zones such as IJmuiden Ver come from the cost components that are linked to site characteristics, such as distance to the nearest harbour, water depth and soil conditions. In comparison with last year’s cost update, the cost differentiation between sites has increased as overall turbine costs declined. This
development shows that the costs categories most impacted by site characteristics are turbine installation and maintenance. Examples are the 15% difference in investment costs and 35% difference in O&M costs between IJmuiden Ver and Hollandse Kust (Zuid) sites III and IV.
There are large cost disparities among the designated offshore wind farms, with respect to their required electricity grid connection. Costs range between 0.017 EUR/kWh for Hollandse Kust (Zuid) sites III and IV, and 0.028 EUR/kWh for IJmuiden Ver. This cost component is influenced by two aspects; namely, the wind farm’s distance to the grid and the broader deployment strategy of a grid at sea, after 2023.
The broader deployment strategy of an electricity grid at sea after 2023 depends on various policy and design choices. This may include the set-up of artificial islands, the combination of wind farm connections, interconnector capacity between neighbouring electricity markets, the use of direct current to connect wind farms or, in a broader sense, the development of a North Sea grid. It is important to keep in mind that these types of policy and design choices will have a significant impact on the network costs of offshore wind farms.
2 Research question
The Dutch Ministry of Economic Affairs and Climate requested PBL to conduct an update on SDE+ base amounts and grid costs associated with the development of offshore wind energy in the Netherlands, based on current market insights. The request specifically referred to the following zones: Hollandse Kust (Zuid) sites III and IV, Hollandse Kust (Noord), Hollandse
Kust (West), Boven de Wadden Eilanden and IJmuiden Ver.
3 Method
For the update, PBL used its offshore cost model. To conduct the research into the latest price and technology developments, PBL processed the latest insights, including information from the wind energy tender for the Hollandse Kust (Zuid) sites I and II. The data used in the model were collected from various sources. Due to the confidential and market-sensitive nature of these data, the sources themselves cannot be disclosed.
3.1 Electricity grid costs
Grid connection costs were adjusted on the basis of the latest insights. Clarity on considered and adopted grid set-up routes eliminated some of the cost uncertainties imbedded in our previous assessment for this cost category. The installed wind capacity of various wind farms represented a major consideration in our grid cost calculation, as this affects the scale of the necessary connection. This is evident from the grid cost differentiation between Hollandse Kust (Zuid) sites III and IV (740 MW), Hollandse Kust (Noord) site V (700 MW), Hollandse Kust (West) (1400 MW), Boven de Wadden Eilanden (700 MW) and IJmuiden Ver
(4000 MW). In the case of IJmuiden Ver, the uncertainties are largely reflected in the broader cost difference. For IJmuiden Ver, we considered a DC cable connection.
4 Results
Table 1 shows the results from the model calculations. References to these figures are also indicated in the section ‘Findings’. The costs in Table 1 are comparable to the base amounts in the SDE+. These costs are calculated based on a 25-year economic lifetime of offshore wind energy projects.
Table 1 – Summary of the results from the offshore wind energy cost assessment
Wind farm Investment costs [EUR/kW] Operation and maintenance costs * [EUR/kW/year] Base amount
[EUR/kWh] Grid connection costs [EUR/kWh]
Full load hours
[hours/year] Total [EUR/kWh]
Hollandse Kust (Zuid) (III&IV) 1600 41 0.043 +0.017 to +0.019 4,400 0.061 Hollandse Kust (West) 1750 44 0.047 +0.019 to +0.020 4,500 0.066 Hollandse Kust (Noord) (V) 1700 41 0.046 +0.016 to +0.018 4,400 0.063 IJmuiden Ver 1850 56 0.050 +0.024 to +0.032 4,600 0.078 Boven de Wadden Eilanden 1900 64 0.050 +0.021 4,800 0.071 *Operational and maintenance costs do not include decommissioning costs. These costs are included under incidental expenditures in year 26.
5 Discussion
The offshore wind SDE+ base amounts presented in this Dutch wind offshore cost update are indicative for the level at which the majority of interested market parties can profitably develop a wind farm. The general expectation is that upcoming bids for the development of Dutch offshore wind farms could be lower than the cost estimates presented here. The cost reduction trend which is driving the tenders for offshore wind farms in north-western Europe to unprecedented low levels is not expected to come to a halt, but rather to be reinforced by regional developments and increasing competition between offshore wind energy developers active on the Dutch market. The magnitude of cost reductions over the coming years is, therefore, highly uncertain and depend on both direct (i.e. offshore wind energy market dynamics) and indirect market factors (e.g. primary metals, financial markets). A mere extrapolation of the current cost-reduction trend would take market dynamics insufficiently
The choice of turbine is a balancing act between investment costs and the energy yield that is determined by offshore site conditions. The efforts of the Dutch Government to improve the procedure and preconditions of the tendering system for offshore wind energy have contributed to improving the cost-competitiveness of the Dutch offshore wind energy sector. The cost-competitiveness has increased further by regional market dynamics, leading to tender results comparable to regional best-case practices. Turbine, foundation and cabling have all seen robust cost reductions. As such, offshore wind energy developers are moving towards larger turbines that extract additional kinetic energy from the wind. This is reflected in the full load hours of the various projects, which range from 4400 h/year to 4800 h/year, yielding increasing electricity output. As a result, offshore wind energy developers are opting for these turbines to extract the maximum amount of energy at the offshore sites. For this assessment, we differentiated between types of turbines for each of the five investigated sites. We included generic turbines of 8 MW, 9.5 MW and 10 MW.
The wind offshore cost model used by PBL was improved to better calibrate the calculation method to the distance-related costs of offshore wind farms. This is particularly the case for costs related to turbine installation, foundation, cabling and monitoring. The
cost-components that are most affected by distance to harbour concern the transportation of foundation materials, and the installation of both the foundation and the turbine itself. Additional factors that contribute to the cost differentiation are turbine type, water depth, soil quality and wave conditions at the site. Distance-related costs are included in the base amounts of the sites such as Hollandse Kust (Zuid) sites III and IV (20 km away from the nearest harbour) and Boven de Wadden Eilanden (90 km away from the nearest harbour). The figures in this Dutch update of offshore wind energy costs do not provide any insights into the associated cost uncertainties. The main sources of uncertainty in the model concern data inputs, modelling simplification and imperfect accounting of market developments. For example, data inputs such as wind speed, grid connection routes and water depth are approximate measurements and thus may have been overestimated or underestimated. Since 2015, developments in the offshore wind energy sector have accelerated. The current analysis is just an indication of what might be expected in the upcoming tenders for the Hollandse Kust sites, keeping in mind that the market is highly dynamic and standardisation has not fully entered any of the major parts of the value chain.
An important cost component is that of grid connection, which goes hand in hand with the somewhat larger uncertainties for the wind farms further away from the shore. The cost estimates presented in this analysis vary depending on the technical choices made, such as mains voltage, voltage type, cable capacity, type of platform, length of the cable trajectories and any half-current compensation in the middle and the related, specifically required platform. However, these technical choices, in turn, depend on those concerning the broader development of a sea-based grid and any future sea areas for wind energy.
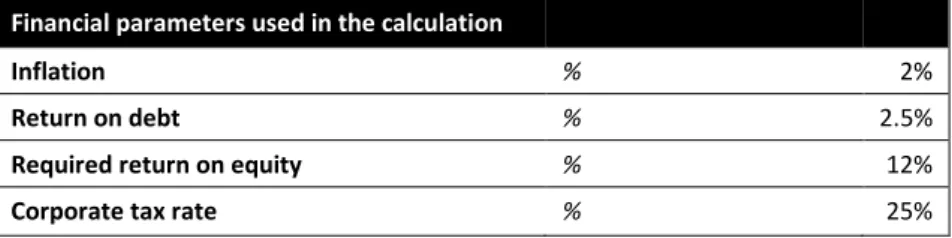
The financing of offshore wind energy projects has been accommodating in the past years. The eurozone’s economic growth of the past years is expected to trigger an increase in inflation, in the single-currency zone. In view of such expectations, the Dutch Central Bank has increased the inflation target to below but close to 2%.2 As a result, the cost of
borrowing and return on equity also had to be re-evaluated. For this analysis, we used the euro level of 2018. Table 2 provides a list of the financial parameters used in the
assessment.
Table 2 – Summary of financial parameters used in the cost assessment
Financial parameters used in the calculation
Inflation % 2%
Return on debt % 2.5%
Required return on equity % 12%