ANALYSING INTERNATIONAL
SHIPPING AND AVIATION
EMISSION PROJECTIONS
Note
Kendall Esmeijer, Michel den Elzen, Heleen van Soest
Analysing international shipping and aviation emission projections
© PBL Netherlands Environmental Assessment Agency The Hague, 2020 PBL publication number: 4076 Corresponding author Michel.denElzen@pbl.nl Authors Kendall Esmeijer Michel den Elzen Heleen van Soest
Production coordination
PBL Publishers
This document has been prepared by PBL under contract to DG CLIMA (EC service contract No. 340201/2017/64007/SER/CLIMA.C1), started in December 2017.
This project is being funded by the EU:
Disclaimer:
The views expressed are purely those of the authors and may not in any circumstances be regarded as stating an official position of the European Commission.
This publication can be downloaded from: www.pbl.nl/en. Parts of this publication may be reproduced, providing the source is stated, in the form: Esmeijer K. et al. (2020), Analysing international shipping and aviation emission projections. PBL Netherlands Environmental Assessment Agency, The Hague.
PBL Netherlands Environmental Assessment Agency is the national institute for strategic policy analysis in the fields of the environment, nature and spatial planning. We contribute to improving the quality of political and administrative decision-making by conducting outlook studies, analyses and evaluations in which an integrated approach is considered paramount. Policy relevance is the prime concern in all of our studies. We conduct solicited and
Contents
MAIN FINDINGS
5
1
INTRODUCTION
7
1.1 Background 7
1.2 Aim and scope 9
2
EMISSIONS UNDER IMO AND ICAO TARGETS
11
2.1 Which targets have been adopted? 11
International shipping 11
International aviation 11
2.2 Quantification of targets 12
Historical data 12
3
EMISSION PROJECTIONS IN 2 °C SCENARIOS
15
3.1 IAM perspective 15
Reported emission projections 15
Emission projections for 2050 19
3.2 Non-IAM perspective 19
Reported emission projections 19
Emission projections for 2040 and 2050 23
4
COMPARING TARGETS AND PROJECTIONS
24
4.1 IAM perspective 24
International shipping 24
International aviation 25
International shipping and aviation combined 25
4.2 Non-IAM perspective 26
International shipping 26
International aviation 26
International shipping and aviation combined 27
5
MODELLING CAPABILITIES OF IAMS
28
6
CONCLUSIONS
33
6.1 Emission projections 33
Targets set by IMO and ICAO 33
Emission projections from 2 °C scenarios 33
Comparison between targets and emission projections 34
6.2 Avenues for further research 35
Main Findings
Integrated assessment models (IAMs) are often used to develop and assess mitigation pathways in which greenhouse gas emissions are reduced to limit warming to specific temperature limits at the lowest overall cost. At the moment, international aviation and shipping are underrepresented in most IAMs. Improving the representation of international transport would provide better insight into its potential contribution to global mitigation. This is the main finding from this assessment study, based on a questionnaire and interviews with several IAM teams, an analysis of published emission projections and a comparison to projections of non-IAMs (mainly sectoral models) that focus on the transport sector. A key reason for this underrepresentation is that data on both domestic and international transport activities and energy use are not easily available. Other specific findings are:
-
Emission projections for international aviation and shipping differ between IAMs and non-IAMs (sectoral models) in mitigation scenarios. However, only a limited number of mitigation scenario projections are available, with the exception of international shipping projections made by non-IAMs. IAMs often do not separately report internationalshipping and aviation emission projection, nor do they distinguish between national (domestic) and international emissions.
- Most non-IAM projections indicate that mitigation scenarios for international shipping do not meet the 2050 reduction target of 50%, compared to 2008 level, as set by the International Maritime Organization (IMO), whereas projections of the 2 °C scenarios by a limited number of IAMs show them to be close to or achieving the IMO targets. - Despite the limited number of mitigation scenarios for international aviation emissions,
we tentatively conclude that the mitigation scenarios of non-IAMs show emission projections that do not achieve the aspirational goal of the International Civil Aviation Organization (ICAO) of ‘Carbon Neutral Growth from 2020’, which for the purpose of this study was defined as no increase in CO2 emissions from international aviation, from 2020
onwards.1 However, the lack of scenarios makes this result indicative and requires
confirmation through future analyses with more scenarios.
- Generally, shipping is better represented in IAMs (in more models, and distinguishing national and international) than aviation.
- Most IAMs represent different fuel types and calculate transport or energy demand, but efficiency standards are often not captured.
Based on these findings, we recommend a systematic analysis of data on historical activity, energy use, and mitigation potential to improve IAM modelling of the international aviation and shipping sectors. Specific recommendations for teams wishing to improve the
representation of these sectors are:
o Distinguish between aviation and shipping and between domestic and international;
o Distinguish national and international transport emissions;
o Incorporate fuels, efficiency standards, and energy or transport demand levers.
1 In order to achieve this aspirational goal, the ICAO agreed a global market-based measure, the Carbon
Offsetting and Reduction Scheme for International Aviation’ (CORSIA) in 2016. CORSIA relies on emissions offsetting and work is currently ongoing on agreeing a monitoring, reporting and verification system and defining the emissions units and registries to be used (UNEP, 2017).
Sectoral models can be used to help improve the representation of the demand and activity data of international aviation and shipping and the technological mitigation options in IAMs. Sectoral models could also be soft-linked to IAMs.
1 Introduction
1.1 Background
Integrated assessment models (IAMs) are often used to develop and assess pathways in which greenhouse gas emissions are reduced, and that aim at limiting warming to specific temperature targets at the lowest overall cost (Rogelj et al., 2011). Sectoral emission projections from these pathways can help policymakers in shaping their countries’ climate targets. To date, more than 190 Parties to the United Nations Framework Convention on Climate Change (UNFCCC) have pledged to decrease their greenhouse gas emissions by ratifying the Paris Agreement and formulating so-called nationally determined contributions (NDCs). These NDCs cover domestic emissions. However, for nearly all Parties, the NDCs do not address international emissions, such as those resulting from international aviation and international marine transport (one of the exceptions2 being the EU that includes
international aviation in its NDC). However, emissions from international aviation and shipping are included in the global mitigation goal of Paris Agreement Article 4.1, which calls for global greenhouse gas emissions to peak and decline rapidly thereafter, reaching balance anthropogenic emissions by sources and removals by sinks this century.
Total international non-domestic CO2 emissions from aviation and shipping have grown by
more than 90% since 1990 to 1.2 Gt CO2 in 2018 (Crippa et al., 2019). The contribution of
international aviation and maritime transport to global CO2 emissions amounted to
approximately 1.5% and 1.8%3, respectively in 2018. According to the International Civil
Aviation Organization (ICAO) (Fleming and de Lépinay, 2019) and International Maritime Organization (IMO), international aviation and shipping emissions could increase by approximately 280% and 85%, respectively, in the period 2015–2050, under baseline scenario emissions (including fleet renewal for international aviation). These projections are highly dependent on the assumed forecast demand and contributions from technological and operational improvements. The International Transport Forum (ITF) shows increases for international aviation4 and shipping emissions of 95% and 165%, respectively, in the period
2015–2050, under current ambition conditions (International Transport Forum, 2019). It is therefore clear that the future emission share of the international transport sector will increase, especially because domestic emission reductions are expected to be achieved through the commitments made in the NDCs.
The international shipping and aviation sectors recognise their contribution to global
emissions and have set targets to mitigate emissions in the future. The ICAO has adopted an aspirational goal of ‘Carbon Neutral Growth from 2020’, that is, to stabilise international aviation’s CO2 emissions at 2020 levels. This is to be achieved through a basket of measures,
including the Carbon Offsetting and Reduction Scheme for International Aviation (CORSIA) (ICAO, 2016). The International Maritime Organization (IMO) has adopted the Initial IMO
strategy on reduction of greenhouse gas emissions from ships, which sets quantitative
carbon intensity and greenhouse gas reduction targets for the international shipping sector, including (i) at least a 40% reduction in carbon intensity by 2030 and pursuing efforts towards a 70% reduction by 2050, both compared to 2008 levels; (ii) a peak in greenhouse
2 https://www4.unfccc.int/sites/NDCStaging/Pages/Search.aspx?k=aviation
3 In the 3rd IMO GHG study the emissions estimate for international shipping for 2008 (peak so far) is 916 –
921 Mt CO2 (leading to 2.9% of total global emissions in 2008), with ICCT estimating the number for 2015 at
812 Mt CO2 (2.2% of total global emissions).
gas emissions from international shipping as soon as possible and to reduce them by at least 50% by 2050 compared to 2008 levels (IMO, 2018).
Although these targets are encouraging, much remains unclear about whether they lead to emission reductions in line with what is needed to achieve the Paris climate goals of limiting warming to well below 2 °C, and pursuing to limiting it to 1.5 °C, and the attainability of the 2 °C targets in general is also not clear.
Regarding aviation and its mitigation potential, the UNEP Gap report (UNEP, 2017) presented the expected impact of CORSIA, and concluded that it could reduce global emissions from international aviation between 0 and 0.3 GtCO2 by 2030, compared to an increase from 0.5
to 1.1 GtCO2 under a no policy scenario in the period 2017–2030. The wide range in
reductions depends on the way the offsetting rules will be set, and highly depends on the quality of the offsets that are allowed under CORSIA. In the absence of a robust decision of which units can be used in the scheme, CORSIA is not expected to result in additional emissions reduction compared to a situation without the scheme (Warnecke et al., 2019). Warnecke et al. showed that the reduction could be zero if credits were allowed, for example, from Clean Development Mechanism (CDM) projects initiated several years ago that keep operating regardless of whether or not the CDM credits are sold, and whose reductions are included in the current emission trajectory of the country selling the offsets. Furthermore, Larsson et al. (2019) noted that existing international climate policies for aviation are not expected to deliver major emission reductions and that tougher international policy
instruments should be put in place if the aviation sector is to contribute to achieving the 2 ˚C target.
Regarding shipping and the attainability of the targets, a literature review performed by Bouman et al. (2017), which covered many sector model studies, showed that for the entire maritime sector, emission reductions of 75% by 2050, compared to baseline emissions in
2050, are possible (Bouman et al., 2017). Given that emissions for the sector are expected
to increase in the period 2008–2050, the IMO’s reduction target of 50%, compared to 2008
emissions, could be difficult to achieve. An underrepresentation of bioenergy competition
with other sectors, as is the case for some sector models, could lead to an overestimation of technological potential. Indeed, Bouman et al. (2017) show a large mitigation potential through the use of biofuels for marine transport. Demand for biofuels in mitigation scenarios is, however, also high in other sectors, which makes the feasibility of the mitigation potential as foreseen by sector models (main focus of Bouman et al.) uncertain. This issue has also been addressed by some authors, such as Wise et al. (2017). They presented integrated mitigation scenarios, which consider demand in other sectors and in which the aviation sector relies to a larger extent on biofuels without crowding out bioenergy in the rest of the energy system. It is, however, unclear whether they also assumed a high bioenergy demand for shipping (Larsson et al., 2019). Traut et al. (2018) have also explored a range of
scenarios of international shipping, and demonstrate that in the near term, immediate and rapid exploitation of available efficiency mitigation measures, including changes to speed, ship size and utilisation, available retro-fit technologies, is of critical importance to deliver mitigation in line with the Paris Agreement.
IAMs consider these interlinkages between different sectors and have provided much of the quantitative mitigation scenario literature in the past (Rogelj et al., 2018). These models, in principle, are appropriate tools to address the attainability issues mentioned above.
However, these models have not yet provided a specific quantification of the contributions required by the international shipping and aviation sectors to achieve the Paris climate goals. Now, there is no assessment study that provides an overview of the IAM scenarios for the international shipping and aviation sector, possible due to a lack of scenarios and
underrepresentation of this sector in most IAMs. There are more non-IAM or sectoral model scenarios available, but they do not consider interactions between the sectors properly, and the mitigation scenarios are often not explicitly addressing the temperature objective of 2 °C or 1.5 °C. Some non-IAM scenarios also rely on offsetting, which implies that offsets need to come from other sectors, which goes beyond the sector analysis. This aspect can be
addressed in a more systematic and consistent way via IAM analyses.
1.2 Aim and scope
The aim of this note is twofold:
1. Assess the currently available IAM and non-IAM emission projections for international shipping and aviation considering the Paris Agreement climate goals.
2. To get a better insight in how the international shipping and aviation sector is represented in the IAMs, with the purpose to identify if, and to what extent, these models can be further developed in order to better represent the international shipping and aviation sectors.
The first aim of this note will be addressed by an analysis of published emission projections and a comparison to projections of non-IAMs (mainly sectoral models) that focus on the transport sector. The second aim will be addressed based on a questionnaire and interviews with several IAM teams.
More specifically, we address the first aim in Chapter 2, Chapter 3 and Chapter 4. In
Chapter 2, we will use the target of IMO and the aspirational goal of ICAO to estimate a
target emission level for 2050, which will be compared to the IAM emission projections for 2050 in Chapter 4. More specifically, Chapter 2 shows the projected emission levels for international shipping and aviation by 2050 under a full implementation of the adopted emission goals of IMO and ICAO (aspirational), if the other policy measures (such as energy efficiency and emission intensity targets) included in the IMO and ICAO goals will help to achieve these emissions targets.
In Chapter 3, we will present IAM emission projections for 2050 for the international shipping and aviation sectors from baseline and 2 °C scenarios. Projections from 1.5 °C scenarios are not considered in this study, because at the time of the analysis there were only a limited number of 1.5 °C scenarios available from the sectoral models (including the IEA). Apart from IAMs, there are multiple models and studies that have projected emissions under stringent climate targets. Results from some of these models are also presented in this chapter.
In Chapter 4, we will present the emission projections from Chapter 3 and compare these to the greenhouse gas targets that are presented in Chapter 2.
The second aim of this note will be addressed in Chapter 5. In this chapter, we will present results obtained from a questionnaire distributed amongst several IAMs, in which we asked how the models calculate the emissions by the international shipping and aviation sectors. In Chapter 6, we will discuss the results presented in Chapters 2 through 4 and suggest avenues for further research, based on the questionnaire results from Chapter 5.
Scope
There is currently no consensus on the level to which the emissions from international shipping and aviation should be limited in order to be in line with the Paris Agreement goals. The two aims of this not mentioned above contribute to the development of improved IAM
projections, thereby helping to create clarity. Given the current lack of consensus, this note will not address the extent to which a) the targets set by IMO and ICAO, b) the IAM emission projections or c) the non-IAM emission projections, are in line with reaching Paris Agreement climate goals.
2 Emissions under IMO
and ICAO targets
2.1 Which targets have been adopted?
International shipping
Three so-called levels of ambition are defined by the IMO in their ‘Initial IMO strategy on
reduction of greenhouse gas emissions from ships’ (IMO, 2018). These are formulated as
energy efficiency targets, CO2 emission reduction targets per transport work and greenhouse
gas emission reductions targets from international shipping. Here, we focus on the last objective:
to peak greenhouse gas emissions from international shipping as soon as possible and to reduce the total annual greenhouse gas emissions by at least 50% by 2050 compared to 2008 whilst pursuing efforts towards phasing them out as called for in
the Vision as a point on a pathway of CO2 emissions reduction consistent with the
Paris Agreement temperature goals.
The assessment of the first two objectives would require detailed modelling work.
International aviation
In 2010, ICAO adopted an aspirational goal of carbon-neutral growth of international aviation from 2020 onward (ICAO, 2010). To achieve this, among other means, ICAO adopted a global market-based measure, the ‘Carbon Offsetting and Reduction Scheme for
International Aviation’ (CORSIA) at its 39th Assembly (Resolution A39-3) in 2016 (ICAO, 2016). Two of the thirty-eight resolutions adopted by this assembly, namely 2 and A39-3, encompass consolidated statements related to climate change (A39-2) and Global-Market-based Measures (GMBM) (A39-3). These two resolutions have been updated at the 40th ICAO Assembly that took place in September 2019:
1. A40-18 §4: ‘Resolves that States and relevant organizations will work through ICAO to achieve a global annual average fuel efficiency improvement of 2 per cent until 2020 and an aspirational global fuel efficiency improvement rate of 2 per cent per annum from 2021 to 2050, calculated on the basis of volume of fuel used per
revenue tonne kilometre performed’;5
2. A40-19 §5: ‘Recalls its decision at the 39th Session to implement a GMBM scheme in the form of the Carbon Offsetting and Reduction Scheme for International Aviation
(CORSIA) to address any annual increase in total CO2 emissions from international
civil aviation (i.e. civil aviation flights that depart in one country and arrive in a different country) above the 2020 levels, taking into account special circumstances and respective capabilities’. 6
A third relevant commitment is supported by many organisations on behalf of the
international aviation industry, including IATA (ICAO, 2016). The goal is to reduce carbon
5https://www.icao.int/Meetings/a40/Documents/Resolutions/a40_res_prov_en.pdf 6https://www.icao.int/Meetings/a40/Documents/Resolutions/a40_res_prov_en.pdf
emissions by 50% by 2050 compared to 2005 levels. ICAO acknowledges this commitment but did not set this target itself. In September 2019, at its 40th Meeting, the Assembly
requested the Council to continue to explore the feasibility of a long-term global aspirational goal for international aviation, (…) for the progress of the work to be presented to the 41st Session of the ICAO Assembly. Therefore, it is not within the scope of this note.
The GMBM scheme CORSIA has some elements that could be interesting to analyse, such as the fact that only international transport and CO2 are considered, the pilot and first phases
are voluntary, exemptions are provided, and the scheme only runs until 2035. However, as this note focuses on IAM projections, and as the current rules for carbon market mechanisms and carbon crediting and offsets are still under development and often difficult to represent in IAMs, an assessment of CORSIA is beyond the scope of this study. Robust eligibility criteria for a new global scheme to offset aviation emissions are extensively discussed in the literature (Michaela et al., 2019; Warnecke et al., 2019).
In this note, we focus on the aspirational goal of carbon neutral growth from 2020, as adopted by ICAO. An assessment of the effects associated with the implementation of the fuel efficiency target would require extensive modelling work.
2.2 Quantification of targets
Historical data
Most IAMs are calibrated on data from the International Energy Agency (IEA). The IEA provides a historical data set for both international shipping and international aviation (International Energy Agency, 2018), encompassing CO2 emissions data from international
aviation and shipping for the years 2000–2016. This data set is used here to present historical emissions and compared to the greenhouse gas emissions projections of
international aviation and shipping from the IAMs. For international shipping and aviation, non-CO2 emissions are a small share of total greenhouse gas emissions (4% in 2016)
(Crippa et al., 2019).
However, these non-CO2 emissions can have significant climate impact, i.e. impact upon
radiative forcing in both positive (warming) and negative (cooling) ways. Overall, aviation’s non-CO2 effects generate significant additional warming over shorter timescales (Lee et al.,
2009; 2010). Shipping has short-term, local cooling effects but these do not outweigh the longer-term warming effect of CO2. These effects are not dealt with further here, but
assessments are provided by Lee et al. (2009; 2010) and Lee (2018) for aviation and by Eyring et al. (2010) for shipping.
In the figures below, we show historical CO2-only emissions of IEA next to projected total
greenhouse gas (Kyoto) emissions, for some scenarios.
Some models, such as POLES and several non-IAMs, calibrate shipping emissions on IMO data. We, therefore, also show historical CO2 emissions for the period 2000–2012, obtained
from the Second and Third IMO greenhouse gas studies (Buhaug et al., 2009; Smith et al., 2015).
Emission targets
The emissions targets presented here relate to the net emissions of the international shipping and aviation sectors, which for the aviation sector will include offsets purchased from other sectors. The emission projections of the models presented in this note only
include actual emissions by the international shipping and aviation sectors, and therefore do not include offsets.
International shipping
The IMO does not mention a reference emission level for 2008 to be used in calculating the 2050 target. Therefore, we present a range for the international shipping target. The lower bound of the range is based on the IEA data set, as described above. The upper bound is based on the IMO data set from the Third IMO greenhouse gas study (Smith et al., 2015). The IMO presents two historical inventories: one based on a bottom-up and one on a top-down approach. We use the bottom-up inventory in this note, as its emissions are in line with those from the Second greenhouse gas study. The bottom-up inventory also leads to higher targets, which means that we cover a higher range. Reference emissions in 2008 amounted to 648 Mt CO2 according to the IEA, resulting in a 2050 target of 324 Mt CO2.
Reference emissions in 2008 amounted to 921 Mt CO2 according tothe IMO, resulting in a
2050 target of 461 Mt CO2. International aviation
For international aviation, a recent official emissions projection for the reference year 2020 is not available. Therefore, we extrapolated the IEA data from 2016 to 2020 using a 5-year average growth rate from the period 2011–2016. Emissions in 2016 were 558 Mt CO2 (IEA,
2018) and the average growth rate in the period 2011–2016 was 3.3%. This leads to a projected emission levels of 636 Mt CO2 for international aviation in 2020. In its current
setup, CORSIA will run until 2035. The carbon neutral growth goal, which CORSIA aims to address, does not have an end year. Therefore, we assume that the carbon neutral growth goal will continue after 2035 and, hence, we also use 636 Mt CO2 as target emissions for
2050.
International shipping and aviation combined
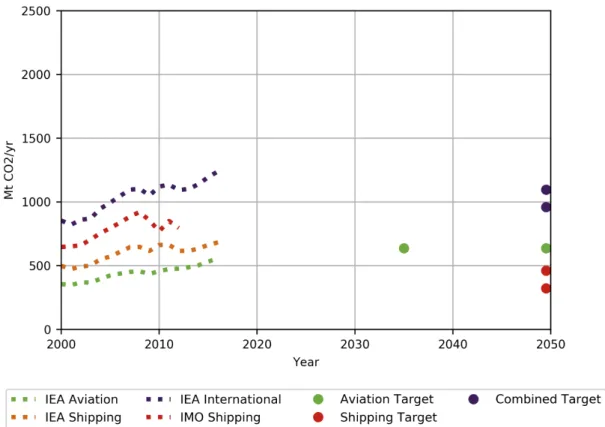
We also present a combined target for the international aviation and shipping emissions, which is a combination of the IMO target for international shipping and the ICAO target for international aviation. Recall that the IMO target as presented in this note is a range, which uses IEA and IMO data as reference. Therefore, the combined target for international shipping and aviation is also a range. The lower bound of this range is the sum of the IEA-based target for international shipping and the IEA-IEA-based target for international aviation. The upper bound is the sum of the IMO-based target for international shipping and the IEA-based target for international aviation. Using this approach, the combined target range for international shipping and aviation for 2050 becomes 960–1097 Mt CO2. Figure 1 gives a
Figure 1. Historical emissions and target emissions for 2035 (international aviation) and 2050 (international shipping and a derived combined international aviation and shipping target).
3 Emission projections
in 2 °C scenarios
3.1 IAM perspective
A questionnaire was distributed amongst ten IAM teams, nine of which responded. They were asked to elaborate on whether they have reported international shipping and aviation
emissions in the past (covered in Section 3.1.1) and how they generally model the international shipping and aviation sectors (covered in Chapter 5). A more elaborate analysis of the survey is presented in Chapter 5.
This Chapter presents the emission projections for baseline and 2 °C scenarios. For most models, the results were obtained from the CD-LINKS project7 (McCollum et al., 2018). This
is a research project in which national and global modelling teams have developed
transformation pathways that are in line with meeting the Paris Agreement climate goals. For the POLES model, a higher sectoral disaggregation of emission projections is reported in the GECO 2018 report (i.e. aviation and shipping emissions are reported separately instead of combined as total international bunker emissions). Therefore, for POLES, we present the emission projections from the GECO 2018 report (Tchung-Ming et al., 2018), instead of those from the CD-LINKS project.
Reported emission projections
The IAM teams were asked whether they reported international shipping and international aviation emissions in the past. Throughout this note, we explicitly distinguish domestic emissions and international emissions.
Table 1 gives an overview of how the international shipping and aviation emissions under baseline and 2 °C scenarios were submitted by the modelling teams. Given that in the CD-LINKS scenario database8, no separate variables for international shipping and international
aviation were included, these emissions needed to be obtained through manipulation of the data. The fifth column shows that for the four models that submitted their data to the CD-LINKS database (McCollum et al., 2018), the emissions for international shipping and international aviation were calculated by taking the difference between the sum of all the world regions and the world as a whole9. The sixth column shows that, through this method,
two emission profiles for international shipping could be extracted (IMAGE and MESSAGE) and two emission profiles for the international shipping and aviation sector combined could be extracted (AIM and REMIND). POLES reported on international shipping and aviation emissions separately in the GECO 2018 report. The seventh column indicates that all the extracted emissions include international emissions only, and that domestic emissions are thus excluded in the IAM projections presented in this note.
7 See http://www.cd-links.org/.
8 See https://db1.ene.iiasa.ac.at/CDLINKSDB/dsd?Action=htmlpage&page=40.
9 In the CD-LINKS scenario database the international emissions are allocated to the region World, since these
emissions cannot be allocated to a specific country or region. The international emissions are calculated as the difference between the regional aggregate and the World region.
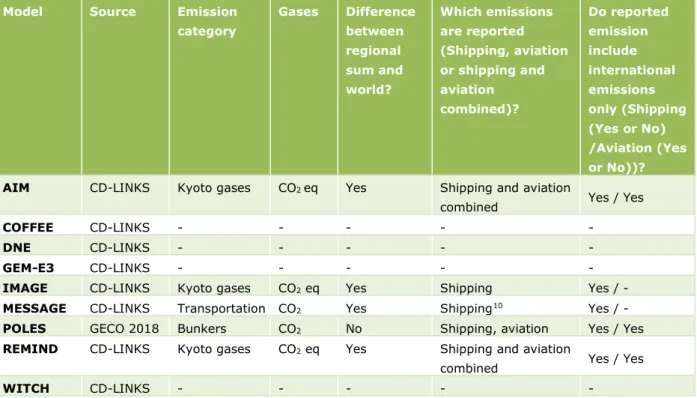
Table 1. Detail on international shipping and international aviation emissions reporting by IAMs, whose scenarios are used in this note.
Model Source Emission
category Gases Difference between regional sum and world? Which emissions are reported (Shipping, aviation or shipping and aviation combined)? Do reported emission include international emissions only (Shipping (Yes or No) /Aviation (Yes or No))?
AIM CD-LINKS Kyoto gases CO2 eq Yes Shipping and aviation
combined Yes / Yes COFFEE CD-LINKS - - - -
-DNE CD-LINKS - - - - -GEM-E3 CD-LINKS - - - - -IMAGE CD-LINKS Kyoto gases CO2 eq Yes Shipping Yes /
-MESSAGE CD-LINKS Transportation CO2 Yes Shipping10 Yes / -
POLES GECO 2018 Bunkers CO2 No Shipping, aviation Yes / Yes
REMIND CD-LINKS Kyoto gases CO2 eq Yes Shipping and aviation
combined Yes / Yes WITCH CD-LINKS - - - -
-The following sections present the calculated emissions of international shipping,
international aviation and the combination of international shipping and aviation based on the method described above. The projections include a baseline and a 2 °C scenario. The 2 °C scenarios in the CD-LINKS Scenario Database (McCollum et al., 2018) represent the objective of keeping global warming below 2 °C with a 66% probability, starting with cost-effective deep reduction measures in 2020. In the CD-LINKS project, the temperature target was implemented in the scenarios as a long-term cumulative CO2 emissions budget of 1,000
GtCO2 for the 2010–2100 period. The historical IEA emissions trends are also included in the
figures. For shipping, the historical IMO emissions are also presented.
International shipping
For international shipping, three models reported emissions. Figure 2 shows the emission projections for IMAGE, MESSAGE and POLES under baseline and 2 °C scenarios. Projections for IMAGE and MESSAGE start at roughly the same level as the historical IEA data set, because both models are calibrated to IEA data. The historical POLES projections are higher and in line with the IMO data, because the POLES international shipping emissions are calibrated to the emission data of the IMO Second greenhouse gas study. Compared to the baseline, all models project lower emissions for the 2 °C scenarios, with a range in 2050 between 301 and 677 Mt CO2 eq.
Figure 2. greenhouse gas emission projections (Mt CO2 eq/year) for international shipping from IAMs. Left: Baseline scenarios, Right: 2 °C scenarios. Dotted lines: historical data (IEA and IMO). Circles: IMO target range.
International aviation
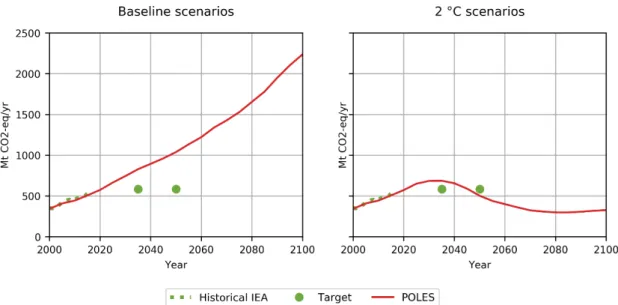
For international aviation, only the POLES model has reported emissions separately. Figure 3 shows baseline and 2 °C emission projections and historical IEA emissions. The historical timeseries are similar because the POLES historical energy-related CO2 emissions were
calibrated to the IEA emissions data (IEA, 2018). The baseline emissions show a continuous increase until the end of the century, whereas for the 2 °C scenario, emissions start to decrease after 2030, reaching emissions levels below those of the year 2000, by the end of the century.
For the 2 °C mitigation scenario, emissions are projected to be approximately 504 Mt CO2 eq
Figure 3. greenhouse gas emission projections (Mt CO2 eq/year) for international aviation from IAMs. Left: Baseline scenarios, Right: 2 °C scenarios. Dotted lines: historical data (IEA). Circles: ICAO aspirational goal.
International shipping and aviation combined
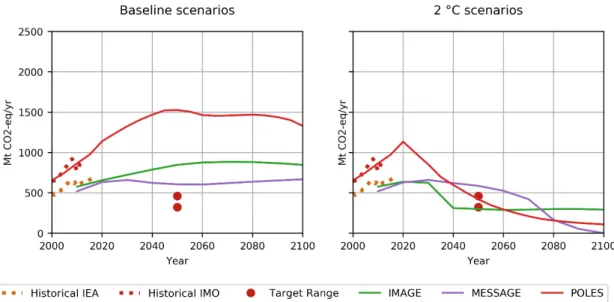
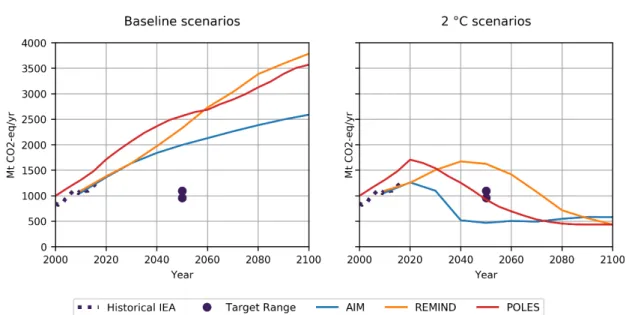
For international shipping and aviation combined, three models have reported emissions. Figure 4 shows the baseline and 2 °C international emission projections of AIM, REMIND and POLES. Historical emissions for AIM and REMIND are in line with the historical IEA emissions. As explained above, the historical POLES emissions are slightly higher due to international shipping emissions being calibrated on higher IMO data. For the 2 °C scenario, all models project decreasing emissions. The timing and rate at which emissions decrease, however, is different. For AIM, emissions decline rapidly in the period 2020–2040, after which they level out over the rest of the century. For REMIND, a more smoothed emission profile is
noticeable, with emission reductions starting in 2040 and gradually decreasing until 2100. For POLES, a steep decline in emissions occurs from 2020 until 2070, after which emissions level out until 2100. These different emission pathways result in a large range of emissions in 2050, but similar levels of approximately 500 Mt CO2 by 2100. The range in 2050 and
similarity in 2100 are not surprising, because the scenarios were all constructed with the aim of limiting global warming to 2 °C in 2100. There are multiple pathways that achieve the same temperature target, so emissions can be different halfway the century.
The emissions for the 2 °C mitigation scenarios range between 469 and 1626 Mt CO2 eq by
Figure 4. greenhouse gas emission projections (Mt CO2 eq/year) from IAMs for international shipping and aviation combined. Left: Baseline scenarios, Right: 2 °C scenarios. Dotted lines: historical data (IEA). Circles: derived target range.
Emission projections for 2050
A comparison of the emissions projections shows that mid century, absolute emission levels differ considerably between the models, in both baseline and 2 °C pathways (Table 2). For shipping, the emission projections in 2050 for the 2 °C scenarios of three models show a wide range, including the range of the IMO target. For aviation, the emission projection of only one model exceeds the ICAO aspirational goal by 2020 but is lower than the ICAO aspirational goal by 2050. For two of the three models, the projected emission levels for international aviation and shipping under 2 °C scenarios are similar to the combined ICAO and IMO target range.
Table 2. Overview of emission levels in 2050 under targets from IMO, ICAO (aspirational goal) and the combined sectors, and emission projections for 2050 from all assessed IAM scenarios.
Emission levels in 2050 Baseline 2 ˚C Target in 2050
Min Max Min Max Min Max
Shipping 774 1526 301 677 324 461 Aviation 1040 1040 504 504 636 636 Shipping and Aviation 1997 2566 469 1626 960 1097
3.2 Non-IAM perspective
Reported emission projections
International shipping
For international shipping, emission projections from five sources were obtained. Figure 5 shows the baseline and mitigation projections from Shell, the Lloyd’s Register (Lloyd), the IMO, the International Transport Forum (ITF) (International Transport Forum, 2019) and DNV GL. The historical emissions of the Shell and Lloyd scenarios are in line with those from
IEA, and the historical emissions in the IMO, ITF and DNV GL scenarios are similar to those of the IMO.
• Shell has published one relevant mitigation scenario, which is described as
‘consistent with limiting the global average temperature rise to well below 2 °C from
pre-industrial levels’ (Shell, 2018).
• The Lloyd’s Register published one baseline and three mitigation scenarios (Lloyd's Register, 2016). These scenarios were constructed using combined RCP 2.611/SSP312 transport demand projections, which were taken from the IMO Third greenhouse gas study (Smith et al., 2015). More specifically, the oil and coal demand are based on an RCP 2.6 scenario. The bulk and cargo demand are based on an SSP3 scenario. The Lloyd furthermore published for each of the mitigation scenarios, a timeseries which shows emission reductions in other sectors (i.e. offsets). Because we only present emissions in the sectors themselves in this note, we do not take these offsets into account.
• The IMO published one baseline and three mitigation scenarios (Smith et al., 2015). All are RCP 2.6/SSP413 variants, with different assumptions on fuel mix and efficiency improvements.
• The ITF published two scenarios, which they refer to as a Current Ambition and a High Ambition scenario (ITF High in Figure) (International Transport Forum, 2019). The Current Ambition scenario includes current and anounced mitigation policies. We consider this to be a baseline scenario. As the name would suggest, more ambitious policies are inluded in the High Ambition scenario. The ITF states that this scenario fails ‘to deliver the reductions required to achieve the Paris Agreement’. However, 2050 emissions for this scenario are within the range of those in the IMO mitigation scenarios. Hence, we present this emission scenario alongside the other non-IAM mitigation scenarios.
• DNV GL has published one baseline and one low-carbon scenario (DNV, 2018). For the latter, they set the requirement that ‘the IMO GHG targets should be met’. Compared to their respective baselines, emissions under the mitigation scenarios14 of Lloyd, ITF and DNV are considerably lower in 2050. The IMO baseline emissions are similar to those in the upper range of all mitigation scenarios. The Shell mitigation scenario does not have a baseline for comparison, but projects emissions to increase until 2050. Looking at the mitigation scenarios only, we see a large range in emission levels by 2050, with most scenarios projecting an increase in emissions from current levels. Of the nine mitigation scenarios presented here, only one of the Lloyd and one of the DNV scenarios project a decrease by 2050, with respect to historical emissions. The IMO scenario was constructed using a transport demand that was taken from RCP 2.6 with an SSP4 storyline and the Lloyd scenario was based on RCP 2.6 with an SSP3 storyline. Such transport demands are at the lower end of possible transport demands (see Figure A.1 in the Appendix). Both IMO and
11 The RCP2.6 emission pathway is representative of the literature on mitigation scenarios aiming to limit the
increase of global mean temperature to 2 °C.
12 The Shared Socio-economic Pathway 3 (SSP3) assume slow economic growth, rapidly growing population,
and high inequality.
13 The Shared Socio-economic Pathway 4 (SSP4) assume slow economic growth, median growing population,
but very high inequality.
Lloyd scenario sets took the transport demand as presented in the IMO Third greenhouse gas study. One would, therefore, expect the resulting emissions from such scenarios to be lower. Compared to the 2050 IMO target, most unharmonised emission projections fail to achieve the required emissions level. This will be elaborated further in the next chapter. Projected emissions for the mitigation scenarios range between 441 and 1500 Mt CO2 eq by 2050.
Figure 5. Greenhouse gas emission projections (Mt CO2 eq/year) from non-IAMs for
international shipping. Dotted lines: historical data (IEA and IMO). Circles: IMO target range. Shaded areas: the emission ranges of the IMO and Lloyds Register scenarios (IMO Scens and Lloyd Scens).
International aviation
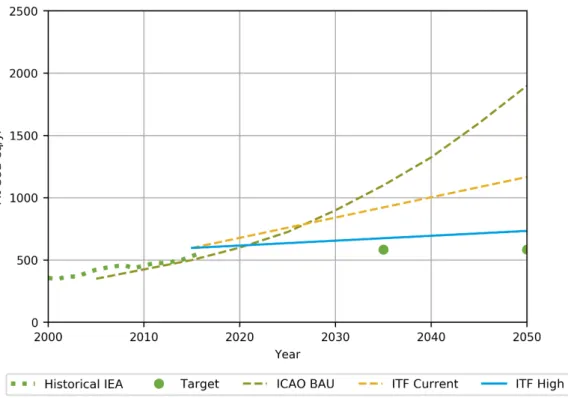
For international aviation, the ITF (International Transport Forum, 2019) and ICAO (Fleming and de Lépinay, 2019) provide relevant scenarios.
• The scenario setup for ITF is the same as for international shipping: we used the Current Ambition scenario as a baseline and the High Ambition scenario as mitigation scenarios.15 The ITF does not consider this High Ambition scenario to be in line with meeting the climate goal of the Paris Agreement. Projected emissions for this scenario amount to about 735 Mt CO2 eq by 2050.
• For the ICAO we used the baseline scenario, but excluded the scenarios with technological and operational improvements in the Figure below (pathway was not available), leading to emission projections between about 1200 and 1900 Mt CO2
eq/year by 2050.
Figure 6 shows that, compared to baseline, the emissions in the mitigation scenario are projected to be lower. The emission projection exceeds the emissions levels of the ICAO
aspirational goal. This will be elaborated further in the next chapter, in which we also analyse the impact of harmonisation the emissions projections with the historical emissions.
Figure 6. Greenhouse gas emission projections (Mt CO2 eq/year) for international aviation
from non-IAMs. Dotted green line: historical data (IEA). Circles: ICAO aspirational goal. Source: ITF (International Transport Forum, 2019) and ICAO (Fleming and de Lépinay, 2019).
International shipping and aviation combined
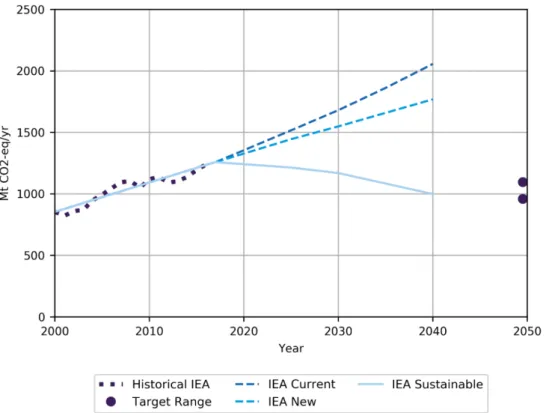
Projections for international shipping and aviation combined were obtained from the IEA and are presented in Figure 7. Note that these projections only run until 2040. Two scenarios serve as a baseline, being the Current Policies and New Policies scenarios. The third, Sustainable Development, scenario is, according to the IEA, ‘fully aligned with the Paris
Agreement’s goal’. It is in the lower range of emissions scenarios of IAMs limiting global
warming to 2 °C, and near the median of scenarios limiting warming to 1.5 °C. We,
therefore, classify it as a 2 °C mitigation scenario. Compared to the two baseline scenarios, the Sustainable Development scenario shows significantly lower emissions until 2040. Projected emissions for the 2 °C mitigation scenario amount to 999 Mt CO2 eq by 2040.
Figure 7. greenhouse gas emission projections (Mt CO2 eq/year) from non-IAMs for international shipping and aviation combined. Dotted line: historical data (IEA). Circles: target range.
Emission projections for 2040 and 2050
The projections for international shipping from the assessed non-IAM scenarios differ considerably from one another in 2050 (Table 2). We conclude that for international shipping, the projected emissions of mitigation scenarios16 from the non-IAMs (some are classified as 2 °C scenarios by the underlying studies, as described above) are not in agreement on emission levels required to meet the temperature goals of the Paris
Agreement. Most projections do not meet the 2050 reduction target of 50%, compared to 2008, set by the IMO. The emission levels for aviation and the combined shipping and aviation sectors are somewhat more in agreement with the IAM projections, however, only one non-IAM scenario for each is available. The projection for international aviation of the only available non-IAM scenario meets the aspirational goal of carbon neutral growth from 2020, as adopted by ICAO, and also the projection for international shipping and aviation for the only available non-IAM scenario meets the combined IMO and ICAO target.
Table 3. Overview of emission goals from IMO, ICAO and the combined sectors and emission projections from all assessed non-IAM scenarios.
Emission levels Baseline Mitigation scenarios Target in 2050
Min Max Min Max Min Max
Shipping (in 2050) 1170 2103 441 1500 324 461 Aviation (in 2050) 1167 1900 734 743 636 636 Shipping and Aviation
(in 2040)
1769 2057 999 999 960 1097
16 As the scenarios of non-IAMs are not explicitly addressing the temperature objective goal of 2 oC, we call
4 Comparing targets
and projections
Models show differences in historical emissions. Therefore, comparing projected absolute emission levels to absolute emission target values would give an inaccurate representation of reductions. For this reason, this chapter presents two relative emission reduction values for each scenario.
The first is an emissions reduction estimate for 2050, relative to the scenario emissions in 2010, for each individual scenario (i.e. 2050 emission projection values divided by 2010 emissions). The second value is a harmonised reduction estimate, in which the emission projections for each scenario were harmonised to the historical reference values that we used to calculate the IMO and ICAO goals (i.e. the same method as for the unharmonised case, but with 2050 emission projection values corrected for the difference between the 2010 scenario emissions value and the 2010 historical IEA value).
4.1 IAM perspective
International shipping
Looking at the relative emission reductions, we see that the results from the IMAGE and POLES scenarios are within the IMO target range and close to the higher end of the target range of 51% reduction (Table 4). The MESSAGE model does not achieve the target reductions in 2050, but as shown in the previous chapter, the absolute emission levels by 2100 are projected to be similar to IMAGE and POLES.
Two disclaimers should be kept in mind when interpreting the results of IMAGE and POLES. - First, the IMAGE model has a lower mitigation potential available for international
shipping, compared to POLES, which could lead to higher IMAGE international shipping emissions projections. However, IMAGE does not take into account the possible increase of shipping due to increased biomass use and transport, which could lead lower IMAGE emission projections.
- Second, The POLES scenario was constructed with the aim of reaching the IMO target, so it is no coincidence that the unharmonised emission reduction levels in 2050 are nearly identical to the target levels.
Based on these two cautionary notes, and the fact that results from only three models were compared, we cannot draw any meaningful conclusions on the 2050 emission levels from international shipping, as projected by IAMs. Therefore, we limit our comments to the observation that two out of three models project emission levels in 2050 that are similar to the target set by the IMO.
Table 4. Emission reductions for international shipping from IAMs. Positive values correspond
with decreasing emissions.
Scenario Unharmonised Harmonised
Reduction value in 2050 (relative to model 2010 levels) Reduction target reached (30% to 51% below 2010 levels)? Reduction value in 2050 (relative to IEA 2010 levels) Reduction target reached (30% to 51% below 2010 levels)?
IMAGE 48% Yes 42% Yes
MESSAGE -13% No -10% No
POLES 52% Yes 67% Yes
International aviation
POLES is the only model for which international aviation projections were available. For the mitigation scenario, the ICAO aspirational goal of carbon neutral growth from 2020, leading to a 39% increase in emissions by 2050, is overachieved (Table 8).
Table 5. Emission reductions for international aviation from IAMs. Negative values
correspond with increasing emissions.
Scenario Unharmonised Harmonised
Reduction value in 2050 (relative to model 2010 data) Reduction target reached (-39% below 2010 levels)? Reduction value in 2050 (relative to IEA 2010 data) Reduction target reached (-39% below 2010 levels)?
POLES -13% Yes -13% Yes
International shipping and aviation combined
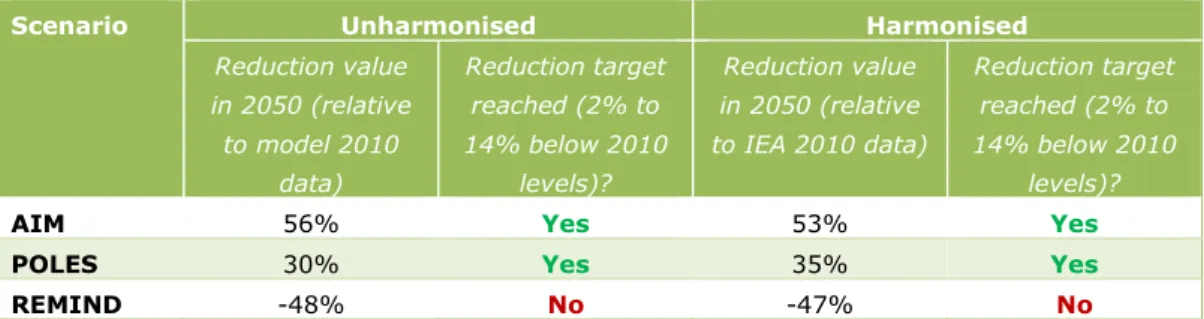
For the combined emissions of international shipping and aviation, two models project mid-century emissions to be within the range of the combined target, while one model projects higher emissions (Table 6). Projected emission reductions in 2050 differ considerably between the models. As already explained in the previous chapter, the main reason is that these IAM scenarios have been constructed with the aim of reaching a target by 2100, and not necessarily in 2050.
Given that only three models were assessed, we conclude that two out of three models project emission levels in 2050 like the combined IMO and ICAO target.
Table 6. Emission reductions for international shipping and aviation combined from IAMs.
Negative values correspond with increasing emissions.
Scenario Unharmonised Harmonised
Reduction value in 2050 (relative to model 2010 data) Reduction target reached (2% to 14% below 2010 levels)? Reduction value in 2050 (relative to IEA 2010 data) Reduction target reached (2% to 14% below 2010 levels)?
AIM 56% Yes 53% Yes
POLES 30% Yes 35% Yes
4.2 Non-IAM perspective
International shipping
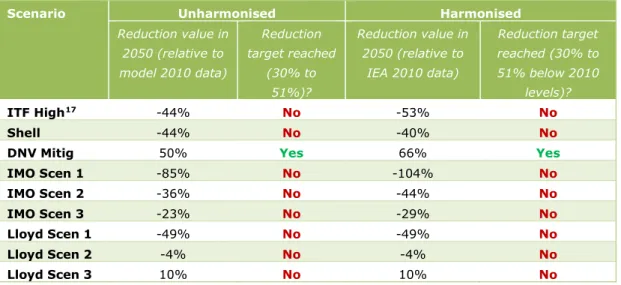
The reduction values for international shipping projected by non-IAMs, as presented in Table 7, show a large range in emission reductions. The harmonised emission reductions range between 66% and -104% by 2050 and only one out of nine scenarios (i.e. DNV mitig) is projected to reach the IMO target, which would be an emissions reduction of 30% to 51% relative to 2010. The range in emissions is considerably larger, and the emission levels are substantially lower than the range that we found for the IAM scenarios. For most models this can be explained.
The ITF, for instance, states that their scenario is not in line with reaching 2 °C. The Shell scenario, as the IAM scenarios, was constructed with the aim of reaching a target in 2100, and it not reaching a target midway is thus not surprising. The LR (Lloyd) scenarios assume offsetting to take place outside of the sector, which reduces the requirement to achieve mitigation within the sector itself. The DNV scenario is the only one showing emission reductions in line with the IMO target.
Based on the limited information of the non-IAM models and due to the large variety in the storylines underlying their scenarios, we are unable to assess whether the non-IAMs give a more accurate projection of mitigation pathways for international shipping than the IAMs. We, therefore, limit our comments to the observation that only one out of nine scenarios project 2050 emission levels to be similar to the target set by IMO.
Table 7. Emission reductions for international shipping from non-IAMs. Negative values
correspond with increasing emissions.
Scenario Unharmonised Harmonised
Reduction value in 2050 (relative to model 2010 data) Reduction target reached (30% to 51%)? Reduction value in 2050 (relative to IEA 2010 data) Reduction target reached (30% to 51% below 2010 levels)? ITF High17 -44% No -53% No Shell -44% No -40% No
DNV Mitig 50% Yes 66% Yes
IMO Scen 1 -85% No -104% No IMO Scen 2 -36% No -44% No IMO Scen 3 -23% No -29% No Lloyd Scen 1 -49% No -49% No Lloyd Scen 2 -4% No -4% No Lloyd Scen 3 10% No 10% No
International aviation
The international aviation results show that the ICAO aspirational goal is not reached in the ITF High Ambition scenario (Table 8). Compared to 2010 emissions levels (IEA), emissions under the target are allowed to increase by up to 39% compared to 2010 levels, yet in the ITF High Ambition scenario, they increase by 43% to 48% (unharmonised and harmonised values respectively). Given the fact that there is only one non-IAM scenario available, we cannot assess whether non-IAMs or IAMs give a more accurate projection of mitigation pathways for international aviation. We tentatively conclude that the mitigation scenarios of non-IAMs show emission projections that do not meet the ICAO aspirational goal.
Table 8. Emission reductions for international aviation from non-IAMs. Negative values
correspond with increasing emissions.
Scenario Unharmonised Harmonised
Reduction value in 2050 (relative to model 2010 data) Reduction target reached (-39% below 2010 levels)? Reduction value in 2050 (relative to IEA 2010 data) Reduction target reached (-39% below 2010 levels)? ITF High18 -43% No -48% No
International shipping and aviation combined
For the analysis of the combined emissions from international shipping and aviation, we used the IEA SD scenario.These projections only run until 2040, but the emission pathway shows similarities to that of the POLES model. From Figure 4 and Figure 7, we saw that both pathways project emission reductions starting around 2020. Calculating the reduction values for 2040, we only see slight differences between the IEA and POLES results (see Table 9). It is, therefore, reasonable to assume that a similar emission trend could occur for the IEA scenario in the period 2040–2050, which would then lead to similar reduction values in 2050 as those reached by the POLES model. However, we choose a conservative approach, and assume that emissions will remain constant in the period 2040–2050, resulting in 2050 emission reduction values from IEA to be the same as in 2040 (i.e. 9% and 8% for the unharmonised and harmonised values respectively). The 2050 emission levels of the IEA scenario would then be similar to the combined IMO and ICAO target of between 2% and 15% reduction.
Table 9. Emission reductions for international shipping and aviation combined from IEA and
POLES (as comparison). Negative values correspond with increasing emissions. The emission reductions in 2040 for the IEA scenario are similar to those for the POLES scenario (second and fourth column). If emissions in the period 2040–2050 are assumed to remain constant, the 2050 reduction values of the IEA scenario would be similar to the calculated combined IMO and ICAO reduction target (third and fifth column).
Scenario Unharmonised Harmonised
Reduction value in 2040 for both IEA and POLES (relative to model 2010 data) Reduction target reached in 2050 (2% to 14% below 2010 levels)? Reduction value in 2040
for both IEA and POLES (relative to IEA 2010 data) Reduction target reached in 2050 (2% to 14% below 2010 levels)?
IEA SD 9% Yes 8% Yes
POLES 4% - 5%
18 For ITF only historical 2015 data was obtained. The growth rate of IEA in the period 2010–2015 was used to
5 Modelling capabilities
of IAMs
The lack of sufficient detail in IAM shipping and aviation scenario results, as shown in Chapter 3, indicates that reporting on international shipping and aviation emissions has not been a major priority in the past. However, from our questionnaire, we can conclude that IAMs are, in principle, able to report on these emissions. Chapter 3 covered the emissions that have been reported to publicly available databases or reports. This section provides insights into what the different models are actually capable of. Table 10 shows that all IAMs who responded indicate that their model can calculate international shipping emissions (second column), and eight out of nine indicate that their model is able to calculate international aviation emissions (third column). Colouring indicates the level of detail in which emissions are being calculated, with green, yellow and orange corresponding to good, moderate and poor. The POLES model, for instance, calculates emissions using the activity demand of trade flows, fleet efficiency, fuel shares and associated emission factors. This method is the most detailed of all models and therefore green. Other models, such as IMAGE, only use energy demand and an emission factor (without the activity demand lever that drives energy demand) and are, therefore, yellow. DNE does not calculate aviation emissions at all and is, therefore, orange.
Table 10. Emission calculation method
Model How are shipping emissions calculated? How are aviation emissions calculated?
AIM Multiplying energy demand with an emission factor Same method as for shipping COFFEE Using an emission factor, which varies depending on the mixture of fossil fuels and
biofuels
Same method as for shipping
DNE Multiplying final energy consumption with an emission factor International aviation emissions are not calculated GEM-E3 Multiplying energy demand by fuel with the appropriate emission factor (biofuels by
assumption have zero emission factor). But not differentiating international shipping
Using travel demand, efficiency improvements and fuel mix (only for the sum of national and international emissions)
IMAGE Multiplying energy demand (TPES oil) with an emission factor Using travel demand per travel mode (only for the sum of national and international emissions)
POLES For each trade flow:
activity level (tkm) * fleet efficiency * fuel share * emission factor Efficiency is not differentiated across trade flows
Energy and emissions can be redistributed by country on the basis of each country's weight in global activity level for each trade flow (e.g. net LNG imports over world LNG trade) (can differ from statistics)
For each flight type, for each region:
activity level (pkm, tkm) * fleet efficiency * fuel share * emission factor Energy and emissions are summed to world totals.
MESSAGE Emissions are based on the fuel related emission factors Non-CO2 emissions are based on trajectories, while CO2 emissions are based on the
fuel mix in the transport sector REMIND Multiplying energy demand with an emission factor Same method as for shipping WITCH Multiplying fuel consumption by the stoichiometric coefficient Same method as for shipping
An inaccurate representation of a sector in an IAM could lead to an overestimation or underestimation of emissions. The IMAGE model, for instance, only uses oil for shipping. Switching to carbon neutral hydrogen fuel cells is, therefore, not possible, yielding higher emissions than for a model that would be able to use this technology for the same transport demand. The REMIND model, on the other hand, has aviation combined in a ‘rest’ sector together with road freight transport. More mitigation options are available for road freight than for aviation. The combined emissions would therefore be lower than for a model that would be able to split these transport modes.
Table 11 and Table 12 elaborate, to a certain extent, the level of detail in which the sectors are modelled. The colouring scheme from Table 10 is also applied here. From the tables, we find that more models make a distinction between international and domestic emissions for shipping than for aviation (second column). Passenger and freight distinction (third column) and the use of different vehicle types for different transport requirements (fifth column) are levels of modelling detail that few models have included, for either shipping or aviation. A distinction between existing and new fleet stock, or different efficiency standards, can be made for both shipping and aviation in some models (fourth column) and different fuel types are also allowed in half of the models for both shipping and aviation (sixth column). Finally, most models estimate a certain transport demand that must be met, which in turn is used to calculate emissions (seventh column).
Table 11. International shipping modelling detail Model International shipping
emissions calculated separately from national emissions
Distinction between freight and passenger transport
Accounting for existing and new fleet stocks and different vessels / efficiency standards
Different vessels for different transport requirements
Accounting for different technology types / fuels
Modelling the volume of international shipping demand
AIM Yes Yes No No No Yes COFFEE Yes No, only freight Yes No Yes, conventional and
biomass bunker, HEFA19,
Hydrogen, LNG
Yes DNE Yes No Yes No Yes, two levels of energy
efficiencies and five fuel types
Yes GEM-E3 No, only sum of national
and international (to be improved in 2019)
Yes No, but different fuel efficiency standards can be modelled implicitly
No Yes, oil and biofuels (hydrogen to be included)
Yes, but only the sum of national and international (was to be improved in 2019)
IMAGE Yes No No No No No POLES Yes No Yes, efficiencies can be
applied to existing fleet (retrofit) or to new ships
No, but distinction of different goods
Yes, oil, biofuels, natural gas, hydrogen
Yes, eight trade flows MESSAGE Yes No No No Yes Yes
REMIND Yes, using bunker
transport fuel use this can be calculated
No, aviation and road + water freight are included in the ‘rest’ sector
No, only for LDV No No No, the energy demand is modelled (could be converted to tkm) WITCH Yes No No No Technologies are
differentiated according to their fuel consumption
Table 12. International aviation modelling detail Model International aviation
emissions calculated separately from national emissions
Distinction between freight and passenger transport
Accounting for existing and new fleet stocks and different vessels / efficiency standards
Different vessels for different transport requirements
Accounting for different technology types / fuels
Modelling the volume of international aviation demand
AIM Yes Yes No No No Yes COFFEE Yes No, only passenger Yes, two plane options,
differentiated by efficiency standards
No Yes, conventional and biomass jet fuel
Yes, but only for passenger DNE No No No No No No GEM-E3 No, only sum of national
and international (was to be improved in 2019)
No, only passenger No, but different fuel efficiency standards can be modelled implicitly
No Yes, kerosene, bio-kerosene, electricity, synthetic kerosene
Yes, in pkm but only the sum of national and international IMAGE No Yes, but only sum of
national and international
Yes, 5 different planes, each with its owns efficiency
No, but 5 different planes with different efficiencies
Yes, but only sum of national and international transport. Oil and biofuels
Yes, but only sum of national and international POLES Yes Yes Yes, efficiency options can
be applied to existing fleet (retrofit) or to new ships
Yes, four flight types (passenger/freight * national/international) each with own efficiency
Yes, oil and liquid biofuels, similar shares across the four flight types, applied to different efficiencies
Yes, for each of the four flight types
MESSAGE Yes, but only for CO2 No No No Yes, as part of the overall
transportation demands
Yes, but only as part of overall transportation REMIND Yes, using bunker
transport fuel use this can be calculated
No, aviation and road + water freight are included in the ‘rest’ sector
No, only for LDV No No No, the energy demand is modelled (could be converted to tkm) WITCH Yes No No No Technologies are
differentiated according to their fuel consumption
6 Conclusions
6.1 Emission projections
The first aim of this note is to assess the currently available IAM emission projections for international shipping and aviation in light of the Paris Agreement climate goals. This has
been done by identifying the greenhouse gas targets set by IMO and ICAO in Chapter 2, presenting baseline and 2 °C emission projections from IAMs and non-IAMs in Chapter 3, and comparing these two in Chapter 4.
Targets set by IMO and ICAO
There is uncertainty about what absolute emission levels would be required for the goals set by IMO and ICAO (aspirational goal) to be met. One reason for this uncertainty is that these sectors have formulated more goals and measures than only a greenhouse gas target. ICAO, for instance, has also formulated an energy efficiency improvement target for the period 2021–2050. The impact of this target could result in 2050 emission levels that are lower than the 2020 values. This would make the carbon neutral growth (greenhouse gas target) less stringent than the energy efficiency target. The same holds for IMO, which has formulated a carbon intensity target until 2050, the impact of which could result in lower emissions than the greenhouse gas target. Analysis of the impact of these measures, especially when implemented in parallel, would require extensive modelling work.
Another reason for the uncertainty is that the greenhouse gas targets have not been formulated as an absolute target or as a target with a fixed reference level. The IMO has a relative reduction target (percentage) based on historical emissions in 2008, but does not state which historical emission reference level should be used. The IMO presents two historical time series. Using 2008 emissions from their upper limit of these two time series and the 2008 emissions from IEA (close to the lower limit of the IMO range) as the lower limit, leads to a target range of 324–461 Mt CO2 by 2050 (30% to 51% reduction, relative
to 2010 levels). The ICAO aspirational goal is to keep emissions constant at 2020 levels. As these emissions are not yet known, an extrapolation of IEA data was used to calculate the 2020 emission levels, which leads to a target of 636 Mt CO2 by 2050 (39% increase, relative to 2010 levels). Combining these two absolute targets yields a target range for international shipping and aviation of 960–1097 Mt CO2 by 2050 (2% to 14% reduction, relative to 2010 levels). An additional reason for uncertainty is linked to the use of offsets to achieve the carbon neutral growth, which in practice means that emissions will be allowed to grow above the target level. A decision on the eligible credits has not been adopted yet but it will play a major role in the achievement of the target.
Emission projections from 2 °C scenarios
Several limitations and uncertainties apply to the assessed emission projections. The number of available scenarios, for instance, is limited. For IAMs, seven scenarios were assessed: three for international shipping, one for international aviation and three for the combined international shipping and aviation sector. The statistical significance of results from such a small sample is low, and in addition there is only one model (POLES) that has scenarios for all three cases. For non-IAMs, eleven scenarios were analysed: nine for international