RIVM report 260701002/2006
Costs of lifestyle interventions within health care and the amount of weight loss achieved
RP Bogers, SMC Vijgen, WJE Bemelmans
Correspondence to:
WJE Bemelmans, centre for Prevention and Health Services Research, 030-274 4297,
wanda.bemelmans@rivm.nl
This investigation has been performed by order and for the account of the Dutch Ministry of Health Welfare and Sport, within the framework of project V/260701 ‘prevention of
overweight’
Abstract
Costs of lifestyle interventions within health care and the amount of weight loss achieved
Lifestyle counselling in health care with respect to diet and physical activity can reduce body weight at reasonable costs. A weight loss of 5% after one year can be achieved at a cost of around €150 per patient (with an uncertainty range up to €300-€400). Each extra investment of €100 results in an additional loss of weight of one per cent. Extra investments above the €1000 do not result in more weight loss. The most effective interventions – where costs are kept constant - seem to be those in which a lower calorie diet is prescribed (and not only dietary advice), along with the possibility of behavioural therapy. These conclusions are based on 73 interventions described in 42 original articles; all interventions had a dietary and a physical activity component. Intervention costs were assessed according to a standard procedure and compared to the reported weight loss one year after an intervention had been started. Quality-related study characteristics such as participant drop-out did not have an effect on the outcome. The fact that more expensive interventions are associated with more weight loss most probably reflects higher intensities of more expensive interventions. Weight loss also appeared to be associated with intervention costs after two years, but the number of interventions for this analysis was low. Further research into the long-term health effects, interpersonal variation and optimal intervention is recommended. Although our study did not indicate that supervised physical activity is associated with more weight loss, physical activity remains important because of its relationship with other favourable health effects.
Key words: overweight, obesity, interventions, weight loss, health care, costs, diet, physical activity, behavioural therapy
Rapport in het Kort
Kosten van leefstijlinterventies binnen de gezondheidszorg en het bereikte gewichtsverlies
Leefstijlbegeleiding binnen de gezondheidszorg rondom voedings- en beweeggedrag kan het lichaamsgewicht tegen redelijke kosten verminderen. Een gewichtsverlies van 5% na een jaar kan bereikt worden met begeleidingskosten rond de €150 per patiënt (met een
onzekerheidsrange tot €300-€400). Elke extra besteding van €100 levert een
gewichtsvermindering van één procent op. Boven een bedrag van ongeveer €1000 leidt meer begeleiding niet tot extra gewichtsverlies. Begeleidingstrajecten waarin deelnemers een dieet met een verlaagde hoeveelheid calorieën wordt voorgeschreven (en niet alleen
dieetvoorlichting krijgen) en waarin gedragstherapie wordt aangeboden lijken –bij gelijkblijvende kosten– het meest effectief.
Dit blijkt uit een analyse van 73 begeleidingstrajecten beschreven in 42 originele publicaties, die alle gericht waren op zowel voeding als bewegen. De kosten van de trajecten zijn op een gestandaardiseerde manier berekend en vergeleken met het gewichtsverlies na één jaar. Studiekenmerken die samen kunnen hangen met de kwaliteit van onderzoek, zoals uitval van deelnemers, hadden geen effect op de uitkomsten.
Dat duurdere begeleidingstrajecten tot meer gewichtsverlies leiden komt waarschijnlijk doordat de kosten zijn gerelateerd aan de intensiteit van het programma. Ook na twee jaar leek gewichtsverlies samen te hangen met de programmakosten, maar het aantal
begeleidingstrajecten in deze analyse was laag. Er is verder onderzoek nodig naar de gezondheidseffecten op lange termijn, variatie tussen personen en het optimale programma. Ondanks dat de huidige analyse er niet op wijst dat bewegen onder begeleiding meer gewichtsverlies oplevert, blijft lichaamsbeweging belangrijk omdat dit andere gunstige gezondheidseffecten kan hebben.
Trefwoorden: overgewicht, obesitas, interventies, gewichtsverlies, gezondheidszorg, kosten, voeding, lichamelijke activiteit, gedragstherapie
Preface
This report was produced by the centre for Prevention and Health Services Research of the Dutch National Institute for Public Health and the Environment, within the ‘prevention overweight’- project, as issued by the Dutch Ministry of Health, Welfare and Sports1.
This report presents an in-depth analysis of the costs and effects of more than 70 international interventions aimed at prevention of overweight; organised within a health care setting. Further research will focus on the effects, costs and reach of interventions in other settings.
Wanda Bemelmans, Project leader.
1 Within programme 2 ‘Policy Support Public Health and Health Care’
Contents
Samenvatting 7 1. Introduction 11 2. Methods 13 2.1 Selection of interventions 13 2.2 Outcome measures 142.3 Assessment of intervention costs 14
2.4 Statistical analysis 15
2.4.1 Overview 15
2.4.2 Step 1: quality of research 15
2.4.3 Step 2: association between weight changes and costs 16
2.4.4 Step 3: influence of intervention characteristics 16
2.4.5 Relationship between costs and weight loss after two years 17
2.4.6 Success rate 17
3. Results 19
3.1 Quality of research 19
3.2 Association between weight changes and costs 20
3.3 Influence of intervention characteristics 24
3.4 Costs and weight loss after two years 27
3.5 Success rate 30
4. Discussion and conclusions 31
4.1 Summary of main results 31
4.2 Discussion of methods 31
4.3 Policy implications 32
4.4 Conclusions 33
References 35
Acknowledgements 39
Appendix A: Characteristics of the six literature reviews 41 Appendix B: Overview of included studies from the six literature reviews 43 Appendix C: Assumptions made for each intervention 45
Appendix D: Cost estimates per unit 48
Appendix E: General characteristics of studies reporting weight after one year 50 Appendix F: Intervention characteristics of studies reporting weight after one year 53 Appendix G: General characteristics of studies reporting weight after two years 55 Appendix H: Intervention characteristics of studies reporting weight after two years 57
Appendix I: Procedure used to assess potential confounding by study characteristics on the relationship between intervention costs and weight changes 58
Samenvatting
KernboodschapHet is effectief en relatief goedkoop om patiënten te adviseren over hun
voedings- en beweeggedrag met als doel gewichtsverlies. Een klinisch relevant gewichtsverlies van 5% kan bereikt worden voor een bedrag van rond de €150 per patiënt (met een onzekerheidsrange tot €300-€400). Voor elke extra besteding van €100 per persoon is een gewichtsvermindering van ongeveer 1% te verwachten. Dit geldt tot een bedrag van ongeveer €1000, waarboven weinig extra gewichtsverlies lijkt op te treden. Dit rapport presenteert één van de eerste uitgebreide analyses over kosten en effecten van interventies gericht op gewichtsvermindering.
Een nadere beschouwing van de interventies wees uit dat –onafhankelijk van de kosten– interventies waarin een energiebeperkt dieet wordt voorgeschreven en waarin deelnemers gedragstherapie volgen meer effect sorteren dan interventies zonder deze componenten. Het aanbieden van een beweegprogramma onder toezicht lijkt niet te leiden tot meer
gewichtsverlies na een jaar, vergeleken met de interventies zonder een begeleid
beweegprogramma. Voor dit laatste punt was de statistische ‘power’ van de analyse echter laag.
Resultaten na twee jaar voor 18 interventies suggereren nog steeds een verband tussen kosten en gewichtsverlies. Verder wetenschappelijk onderzoek is nodig naar de
(gezondheids)effecten op langere termijn, de additionele kosten die nodig zijn voor langdurig behoud van het gewichtsverlies, de verschillen tussen personen (o.a. om specifieke
doelgroepen te kunnen onderscheiden) en de optimale interventiemix.
Beleidsrelevantie
Dit rapport maakt duidelijk dat het begeleiden van patiënten rond hun leefstijl kan leiden tot een klinisch relevant gewichtsverlies na een jaar. Bijkomend voordeel is dat andere positieve gezondheidseffecten te verwachten zijn van het verbeterde eet- en beweeggedrag. De kosten zijn laag – rond de €150 in het eerste jaar; zeker in vergelijking met gewichtsreducerende medicatie. Deze kost rond de €75 per maand en leidt tot een vergelijkbaar gewichtsverlies na een jaar (echter zonder de positieve neveneffecten van een verbeterde leefstijl).
Het verdient daarom aanbeveling om de mogelijkheden te inventariseren voor uitgebreidere implementatie van leefstijlbegeleiding binnen de reguliere gezondheidszorg. In onderstaand kader staat een fictief voorbeeld van een interventie die €150 per persoon kost.
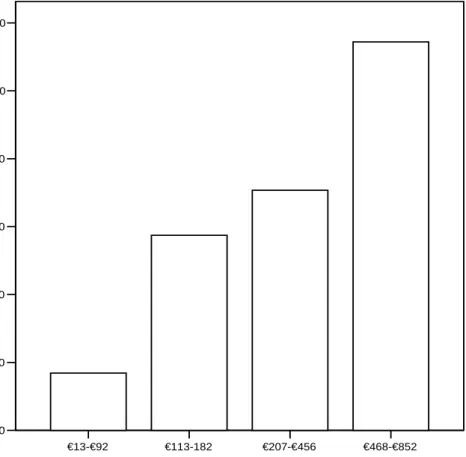
Gemiddeld gewichtsverlies (in %) per kostencategorie. 1: €13 – €92 (n=15); 3: €207 – €456 (n=15); 2: €113 – €182 (n=15); 4: €468 – €852 (n=16)
€13-€92 €113-182 €207-€456 €468-€852
Quartiles of intervention costs
0,00 2,00 4,00 6,00 8,00 10,00 12,00 Me a n w e ig ht l o ss (%)
* Dit is een voorbeeld gemaakt op basis van kosten van interventiecomponenten zoals beschreven in Appendix D; voor het vaststellen van de optimale inhoud van een interventieprogramma is nader onderzoek nodig.
Methoden
De analyses zijn gebaseerd op 80 recente interventies afkomstig uit 49 artikelen2, die werden geselecteerd uit zes overzichtsartikelen. Het tekstblok presenteert de inclusiecriteria.
De kosten van een interventie zijn afhankelijk van de intensiteit en duur van een interventie. Van elke interventie werden op gestandaardiseerde wijze de kosten berekend per jaar dat de interventie duurde. Dit werd gedaan door voor materiaalkosten en personeelskosten steeds dezelfde eenheidsprijzen te hanteren. De kosten in het eerste jaar werden vervolgens gerelateerd aan de effecten één jaar na aanvang van de interventies.
Nuancering
De analyses wezen uit dat de kosten gerelateerd zijn aan het percentage gewichtsverlies na een jaar, waarschijnlijk omdat de kosten de intensiteit van de begeleiding weergeven. Hierbij is uitvoerig nagegaan of deze relatie beïnvloed wordt door inclusie van onderzoek met een lagere kwaliteit, bijvoorbeeld door hoge uitval van deelnemers of een laag aantal patiënten. Op basis van diverse analyses werd geconcludeerd dat studiekwaliteit geen belangrijke rol speelt in de relatie tussen kosten en gewichtsverlies. Echter, uitsluiting van bepaalde soorten onderzoeken had wel invloed op de geschatte kosten voor een gewichtsdaling van 5%, die dan op kunnen lopen naar €300 à €400. Dit is dan wel weer gebaseerd op minder interventies en bovendien lagen de kosten voor een gewichtsdaling van 10% consistent rond de €700, ongeacht de selectie naar type onderzoek.
Een ander aandachtspunt betreft de berekening van de kosten, waarbij uitgegaan werd van volledige deelname aan de interventieonderdelen. De werkelijk gemaakte kosten per
2 Hiervan werden voor 73 interventies beschreven in 42 artikelen resultaten na één jaar gerapporteerd.
Mogelijke inhoud van een interventie van €150*
• duur interventie: 6 maanden
• 45 minuten individuele bijeenkomst met een diëtist
• maandelijks een uur voedingsinstructie door een diëtist in een groep van 10 patiënten • maandelijks een uur gedragstherapie door een psycholoog in een groep van 10 patiënten • twee uur beweeginstructie door een fitness-instructeur in een groep van 10 patiënten • ondersteunend materiaal à €35 per patiënt
Inclusiecriteria voor artikelen/interventies
• het artikel rapporteert lichaamsgewicht en/of BMI aan het begin van de interventie en een jaar en/of twee jaar na aanvang van de interventie
• de interventie is gericht op verandering van zowel voedings- als beweeggedrag
• de interventie vindt plaats binnen de gezondheidszorg of bij mensen met overgewicht, en/of is uitgevoerd door personeel uit de gezondheidszorg
• de publicatiedatum van het artikel is 1 januari 1990 of later
• het artikel verschaft voldoende informatie om de kosten van een interventie te kunnen bepalen op een gestandaardiseerde manier
deelnemer in relatie tot gewichtsverlies kunnen zowel hoger als lager uitvallen als deelnemers voortijdig stoppen met een programma of minder consulten bezoeken dan aangeboden. Verder moet bedacht worden dat de resultaten werden behaald bij deelnemers aan een wetenschappelijk onderzoek, met een bepaalde mate van gemotiveerdheid. Mogelijk wijken de resultaten in de ‘echte praktijk’ wat af. Daarnaast betreft het hier de gemiddelde kosten die gemaakt worden voor een gemiddeld gewichtsverlies van 5%. Dat wil dus niet zeggen dat íedereen die de interventie krijgt aangeboden inderdaad ook dit gewichtsverlies bereikt. Het feit dat begeleide beweegprogramma’s niet tot extra gewichtsverlies leken te leiden, wil niet zeggen dat lichaamsbeweging geen rol speelt. Er moet op gewezen worden dat in alle interventies in meer of mindere mate lichaamsbeweging gestimuleerd werd. Bovendien is uit de literatuur bekend dat lichaamsbeweging een rol kan spelen bij het behoud van
gewichtsverlies en dat bewegen diverse andere gunstige effecten op de gezondheid heeft. Daarnaast was door het kleine aantal interventies met een begeleid beweegprogramma de statistische ‘power’ voor dit onderdeel van de analyses laag.
Tot slot is niet helemaal duidelijk of het verband tussen interventiekosten en gewichtsverlies op lange termijn blijft bestaan of dat het verloren gewicht er weer bijkomt. We wijzen er echter op dat een periode van een jaar al geldt als een ‘lange termijn’ in een proces van afvallen/gewichtsbehoud. Bovendien leek het erop dat bij interventies met een relatief groot gewichtsverlies na een jaar, ook na twee jaar het gewichtsverlies nog relatief groot was. Er moet echter wel op worden gewezen dat voor een langdurig behoud van het gewichtsverlies extra investeringen nodig kunnen zijn.
Conclusie
Het is effectief en relatief goedkoop om patiënten te adviseren over hun voedings- en beweeggedrag met als doel gewichtsverlies. Een klinisch relevant gewichtsverlies van 5% kan bereikt worden voor een bedrag van rond de €150 per patiënt. Voor elke extra besteding van €100 per persoon is een gewichtsvermindering van één procent te verwachten, tot een bedrag van ongeveer €1000. Interventies waarin een energiebeperkt dieet wordt
voorgeschreven en waarin gedragstherapie wordt aangeboden, lijken –bij gelijkblijvende kosten– het meest effectief te zijn. Hoewel het onderzoek niet aantoonde dat
lichaamsbeweging onder begeleiding leidt tot extra gewichtsverlies, blijft het stimuleren van lichamelijke activiteit zonder meer belangrijk, vanwege andere gunstige gezondheidseffecten.
Aanbevelingen
- Inventarisatie van mogelijkheden voor uitgebreidere implementatie van leefstijlbegeleiding binnen de reguliere gezondheidszorg;
- Verder wetenschappelijk onderzoek naar de (gezondheids)effecten op langere termijn, de kosten die nodig zijn voor langdurig behoud van het gewichtsverlies, de
verschillen tussen personen (onder andere om specifieke doelgroepen te kunnen onderscheiden) en de optimale interventiemix.
1.
Introduction
The prevalences of obesity are increasing worldwide and reversing the current trends belongs to the targets of health policy in many countries. Overweight (body mass index [BMI] 25-30) and obesity (BMI≥30) are important risk factors for the development of type 2 diabetes mellitus, coronary heart diseases, and other chronic diseases (1), and increase the number of life years with disabilities and medication use (2). Successful preventive strategies and treatment of overweight therefore are likely to result in lower incidences of these diseases. Physical inactivity and an unbalanced dietary energy intake contribute to the development of overweight (3). Interventions targeted at influencing these behaviours may therefore succeed in decreasing body weight in the longer term.
In literature many interventions have been described which were organised within a health care setting. Most of these interventions are aimed at influencing lifestyle and incorporate a dietary and physical activity component in their program, and many include behavioural therapy.
a Reference: Lindahl B, Nilsson TK, Jansson JH, Asplund K, Hallmans G. Improved fibrinolysis by intense
lifestyle intervention. A randomized trial in subjects with impaired glucose tolerance. J Intern Med. 1999;246(1):105-112.
Several reviews (4, 5) concluded that such interventions can be effective in reducing weight. The individual interventions as included in these reviews varied largely in terms of effects and approach (e.g., diet, physical activity, behaviour therapy), intensity, duration and health care provider. Furthermore, in health care policy the decisions about organising care are not based solely on the effects of potential interventions, but also on the costs, which depend on the intensity and the duration of an intervention. With respect to costs, limited information is available for these types of behavioural interventions targeted at weight reduction, and it is recommended that the cost-effectiveness of intervention programs be evaluated (6).
The primary objective of the present report is to investigate the relationship between the costs and the weight changes in recently published behavioural interventions, performed in a health care setting or in overweight people (secondary prevention). For this, the costs of 80 interven-tions described in 49 articles3 were calculated in a standardised way. A secondary objective was to explore the variation in effects of interventions with similar costs, in order to obtain
3 Intervention and control conditions within an article were considered as separate interventions. The effects and
costs of each intervention group were assessed. For 73 interventions (42 articles) weight changes after one year were reported.
Example of the content of an intervention a
Diet: Diet calculated to contain approximately 20% of the energy from fat and with a relatively high fibre content. The recommended portion sizes were calculated to give a daily energy intake of 7.6 MJ in men and 6.3 MJ in women.
Exercise programme: Aerobic physical exercise of low to moderate intensity daily for 2.5 h, e.g. brisk walks, gymnastics, cycling and swimming. Behavioural therapy: Useful and health promoting coping strategies together with
stress management and relapse prevention techniques.
Participants were stimulated to make detailed plans on how to incorporate new and healthier habits in everyday life.
insight in the optimal intervention characteristics. Weight changes were evaluated as the average loss in body weight one year after the start of an intervention.
2.
Methods
2.1
Selection of interventions
The selection of interventions was based on six literature reviews (see Table 1) which included interventions specifically targeted at weight reduction or interventions likely to result in weight loss. Further details on inclusion criteria of these reviews can be found in Appendix A. From the reviews we selected studies that fulfilled the following inclusion criteria:
• the article reports on body weight and/or BMI at baseline and either one year or two years after the start of the intervention;
• the intervention incorporates both a dietary and physical activity component;
• the intervention is carried out in a health care setting or in an overweight population and/or is carried out by health care professionals;
• the publication date of the article is 1 January 1990 or later;
• the article provides sufficient information to estimate costs of an intervention in a standardised way.
Interventions were excluded if they incorporated pharmacological or surgical treatment. A total of 49 original articles (describing 80 interventions) were selected. These articles
described weight loss after one year for 73 ‘interventions’ (42 articles), and weight loss after two years for 27 interventions (21 articles). Seven interventions (seven articles) reported weight loss after two years but not after one year. Table 1 shows the topics of the reviews and the number of articles from each review that were included in the present analysis. An
example of a study that was excluded is a study described by Elder et al. (7). In this
intervention obese persons were referred to community agencies which were not included in the protocol, and therefore not all the costs for the obese could be calculated. None of the interventions from the review by Eakin et al. fulfilled our inclusion criteria.
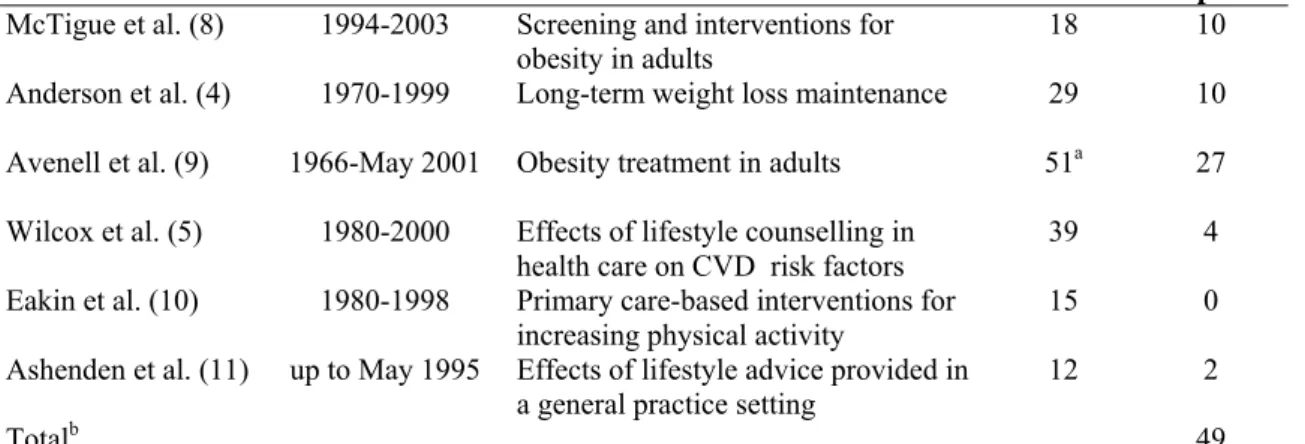
Table 1. Reviews used for the selection of interventions
Author Years search Topic N
articles in reviews N articles in present report McTigue et al. (8) 1994-2003 Screening and interventions for
obesity in adults 18 10
Anderson et al. (4) 1970-1999 Long-term weight loss maintenance 29 10 Avenell et al. (9) 1966-May 2001 Obesity treatment in adults 51a 27
Wilcox et al. (5) 1980-2000 Effects of lifestyle counselling in
health care on CVD risk factors 39 4
Eakin et al. (10) 1980-1998 Primary care-based interventions for
increasing physical activity 15 0
Ashenden et al. (11) up to May 1995 Effects of lifestyle advice provided in
a general practice setting 12 2
Totalb 49
a excluding articles about surgery and pharmacological interventions. b four studies were reported in two reviews.
Appendix B presents a list of the original articles which were included for the present study. Since not all articles included a ‘control group’ and because of the variety in control groups (e.g. usual care or a less intensive intervention) weight changes were considered within groups that received an intervention, and not between groups. In the text box an example of the selection of interventions, and subsequent methodology, is presented.
If a control group was used in a study the above listed inclusion criteria were also applied. For example, if a group of patients received only a pamphlet with health information, this information had to concern diet and physical activity to be included.
2.2
Outcome measures
The primary outcome measure was the change in weight from baseline to post-intervention, with a minimum of one year follow-up. Change in weight was calculated as the percentage of weight change from baseline to follow-up. Most articles reported weight changes for the participants for whom weight loss data were available after the intervention –excluding participants who dropped out during the study period– and therefore results were extracted for participants who completed both baseline and follow-up measurements if this information was available.
2.3
Assessment of intervention costs
In assessing costs of an intervention a distinction can be made between fixed and variable costs. The fixed costs do not depend on the number of persons in an intervention programme, and include for example the training of the health care provider. In our report only the fixed costs for providing group sessions during an intervention were considered, but further fixed costs were not considered because of insufficient information about these costs in literature. For example, the time used to develop and start an intervention is usually not mentioned in the literature. Furthermore, it is difficult to allocate such fixed costs to individual patients. Hence, our report was limited to the variable costs, which consist of material costs (i.e. costs for materials for the patients such as a training manual) and labour costs (i.e. the salary of the health care providers if patients are counselled individually). Thus, the calculated costs only included costs for (broader) implementation of the intervention. Further, we assumed an optimal implementation of the intervention. This means that e.g. subjects participate in all sessions that are offered and use all the materials. We calculated the costs per percent weight
Example of the selection of interventions from an article
Aim of study: Comparing the effects of an intensive lifestyle program
(intervention group) to a leaflet with health information (control group)
Number of interventions: Two interventions included for present report
Methodology: a) calculating costs of the intervention for each group;
b) assessing amount of weight loss after one year, as compared to baseline, for both groups. For example, the intervention group may have lost 5% of their initial weight, on average, and the control group may have lost 1% after one year.
loss per participant who started an intervention. This is equivalent to the planned intervention costs per person.
The present study is a cost-outcome description (see Drummond et al. (12)) in which
intervention costs were compared to weight loss. The intervention costs included direct health care costs but for some interventions also essential direct non-health care costs were included. These were costs of meal replacements such as Modifast, which may or may not be paid by the patients themselves.
For calculating intervention costs, resource use (volumes) and unit prices of these resources were determined. Details about resource use and the content of the interventions were
retrieved from the papers. Examples of resource use are the time that a moderator spends on a group session and the amount of group sessions in a certain intervention. Authors of the original papers were contacted in case of uncertainties about the precise content of the programmes. For example, uncertainties could remain about the exact duration of consults, the type of health care provider or the exact number of persons participating in group sessions. However, despite our enquiries assumptions about some of these issues had to be made to calculate costs. The assumptions made per intervention are described in Appendix C. Subsequently, resource use had to be multiplied by unit costs. The costs of interventions were calculated in a standardised way. Hence, the same costs were attributed to similar
components of different interventions, e.g., an equal salary was attributed to a dietician in intervention A and one in intervention B. Standard cost prices per unit are described in Appendix D.
The costs of an intervention were expressed as costs per participant and were calculated for the first, second, third et cetera year that an intervention lasted. In addition to the costs per year, cumulative costs were calculated until the end of each year of follow-up. All costs were calculated in 2004 euros and were rounded off to the nearest euro.
2.4
Statistical analysis
2.4.1 Overview
The key characteristics of the interventions were entered into a database. Subsequently, the data were analysed in three phases:
Step 1: quality examination of research → exclusion of low quality research;
Step 2: primary analysis → association between costs of interventions and amount of weight loss after one year;
Step 3: secondary analysis → impact of intervention characteristics on outcome; More detailed information about these steps is provided in the next paragraphs.
2.4.2 Step 1: quality of research
With respect to research trials, a study is considered as ‘high quality’ when the number of participants is high (‘sufficient power’), loss to follow-up is low, and participants are
randomly allocated to treatment conditions4. The characteristics of a study or the quality of a research design may confound the relationship between the costs of interventions and the amount of weight loss after one year. For example, the same intervention could lead to different outcomes if the effects are investigated in study populations which have a different motivation to lose weight.
4 Another quality criterium is that researchers and interveners are blinded to the condition of the participants.
In step 1 the potential confounding effects of the following study characteristics were investigated: the study size, drop-out (attrition) of participants during the study (‘loss to follow-up’), randomised controlled trial (RCT) versus other (randomised or non-controlled trial), recruitment of study population (volunteers as attracted by media attention or inclusion in health care procedures) and the use of self-reported body weight vs. measured body weight. For attrition we used the percentage of participants that was assessed at one year, i.e. 100% - % attrition.
Potential confounding by study characteristics was examined in a few steps, because it turned out that study characteristics, intervention costs and weight loss were interrelated. First, correlation coefficients between study characteristics, weight loss and intervention costs were calculated. Second, using linear regression analysis, the influence of study characteristics on weight loss adjusted for intervention costs was determined per study characteristic (univariate analyses). Third, in a multivariate model with a stepwise elimination procedure the most influential study characteristics in addition to intervention costs were identified. Fourth, this analysis was repeated after adding baseline weight to the model. Regression coefficients for intervention costs from the various univariate and multivariate models were compared and associations between weight loss and the most influential study characteristics were explored graphically. To finally determine if study characteristics confounded the association between intervention costs and weight loss, interventions with a high drop-out percentage were excluded and the regression coefficient for costs was compared with the coefficient from the analysis which included these interventions.
2.4.3 Step 2: association between weight changes and costs
The primary analysis, as performed during step 2, was focused on the association between weight changes and costs of interventions. Some articles reported results for men and women separately. Therefore, it was first checked whether the relationship between intervention costs and weight changes was the same for men and women. This turned out to be the case, and therefore data were used for men and women combined. If combined results were not reported the results were pooled.
The relationship between costs and effects of interventions was graphically explored in scatter plots. Correlation coefficients between costs and weight changes were calculated, and linear regression analysis was used to estimate the weight change associated with an increase in intervention costs of €100 per person. The regression model was adjusted for body weight at baseline. The costs were also categorised and the mean weight change per category
depicted in a bar chart. Since the large majority of studies reported weight changes one year after baseline, the above mentioned analyses were performed for the one-year weight changes. One year was defined as being between 0.75 and 1.25 years.
2.4.4 Step 3: influence of intervention characteristics
Finally, in step 3 it was examined which intervention characteristics were associated with higher weight reduction while the costs remained the same. Analyses were done per quartile of intervention costs, so that interventions could be compared with respect to their
characteristics irrespective of intervention costs (intensities). Cross-tabulations and t-tests were performed to assess if weight changes differed between interventions with the following content:
• containing a prescribed diet, i.e. subjects were required to consume a limited, defined amount of energy (e.g., a very-low-calorie diet (VLCD)), and were not just
encouraged to reduce their energy intake;
• containing a supervised exercise programme, e.g., participants trained in the presence of an exercise trainer;
• containing a behavioural therapy programme; • individual and/or group meetings.
An example of an intervention that contained all of the above components is shown in the text box below.
a Reference: Blonk MC, Jacobs MAJM, Biesheuvel EHE, Weeda-Mannak WL, Heine RJ. Influences on weight
loss in type 2 diabetic patients: little long-term benefit from group behaviour therapy and exercise training. Diabet Med. 1994;11(5):449-457
2.4.5 Relationship between costs and weight loss after two years
For those interventions that reported second year outcomes, results for two years after baseline were graphically explored, and regression analysis was used to estimate the relationship between costs of an intervention and weight loss.As an indication of what part of the budget was spent in the second year, the costs that were spent in the second year were divided by the total costs in the first two years and multiplied by 100 to obtain a percentage. These percentages were tabulated to examine if the spreading of the intervention costs over the years influenced the weight loss after two years.
2.4.6 Success rate
For some interventions the success rate was reported, that is the percentage of the participants who lost 5% or 10% of their initial weight. Since the number of interventions reporting the success rate was low, this information was only tabulated and no further statistical analysis was performed.
Example of the content of an intervention a
Prescribed diet: Individualised moderately energy restricted diet designed to reduce usual energy intake by 500 kcal with a minimum intake of 1000 kcal/24 h.The diet prescription was composed of 50-55 energy per cent (En %) carbohydrate, approximately 25 g fibre, 30 En % fat, emphasising the use of unsaturated fat and the reduction of dietary cholesterol below 300 mg/day, and 15 En % protein.
Supervised exercise programme: Three periods of 3-month duration each, in a group format, with five to six patients, led by two physiotherapists. Sessions consisted of a 5-min warm-up period, followed by training on a bicycle ergometer for 30 min at an intensity of 60-80% of maximal heart rate. During the final 30 min a variety of sports activities were performed followed by a 5-min cool-down period.
Behavioural therapy: Behavioural modification sessions conducted in a group format, with 8 to 10 patients, led by a psychologist experienced in eating disorders. Behavioural strategies taught included self-monitoring, stimulus control techniques, self-reinforcement, cognitive restructuring approaches, and relapse prevention methods.
3.
Results
The analysis was limited to 62 interventions costing < €1000, as this was the range in which the cost – weight change curve was linear (see section 3.2), and another intervention was excluded because this was an outlier in the regression analyses (see section 3.2). Thus, the final sample included 61 interventions.
3.1
Quality of research
The mean number of participants at baseline was 190, ranging from eight to 3440 partici-pants. The mean drop-out percentage was 18%, ranging from zero to 49%. Of the 61 inter-ventions, 26 were performed within a randomised controlled trial design. For 32 interventions the population was recruited via the media (e.g., via newspaper adds), and for 13 interven-tions recruitment was done via the health care system. Since no studies used self-reported weights after one year of follow-up, this was not further considered as a confounding factor5. Appendix E shows the characteristics of the studies.
Several study characteristics which potentially could influence weight changes were correlated with each other (Table 2).
Table 2. Spearman correlation coefficientsa between intervention costs, weight changes, study size and drop-out (n=61)
Intervention costs in first year Weight loss (%) Mean weight at baseline No. participants at baseline Weight loss (%) 0.64*
Mean weight at baseline 0.37* 0.64*
N participants at baseline -0.17 -0.39* -0.41*
Percentage assessed at
measurement year 0.11 -0.03 0.12 -0.04
* p<0.01.
a: a negative association means that higher values of one variable are associated with lower values of the other
variable.
Table 2 shows that higher costs (i.e. intensities) of an intervention were associated with more weight loss. Table 2 further shows that a larger study size is associated with a lower mean body weight at baseline, and less weight loss after one year. The drop out rate (percentage assessed) was not associated with the other characteristics.
Univariate regression models showed that the study design (randomised controlled trial [RCT] vs. non-RCT) and the study size (number of participants at baseline) were
significantly associated with weight changes (in addition to costs; see Appendix I-1). RCTs and larger studies were associated with less weight loss.
A stepwise regression analysis in which all study characteristics and costs were considered simultaneously yielded study design as a significant study characteristic. With respect to study design, the mean percentage weight loss observed in RCTs was 3.1% (t-test, p=0.005)
lower than in non-RCTs. However, the effect of adjustment for study design on the regression coefficient for intervention costs was marginally (the coefficient changed from 0.013 to -0.012 after this adjustment; Appendix I-1). Study size and drop-out percentage were also plotted against weight changes (Appendices I-3 and I-4) to visualise the association with weight changes; inspection of the plots did not suggest an association with weight changes.
When baseline weight was added to the set of predictors (model B in Appendix I-2) and a stepwise selection procedure was done again, the percentage of the participants that was assessed was selected in the final model (Appendix I-2). After exclusion of five interventions with the highest drop-out percentage (results not shown), the coefficients for intervention costs (with and without adjustment for baseline weight) did not change.
Based on the plots and the small influence on the regression coefficient for intervention costs of adding study characteristics to the model, it was decided that study characteristics did not substantially change the relationship between intervention costs and weight changes.
However, it must be emphasised that study characteristics, intervention costs and weight changes were highly interrelated. Therefore, the primary analysis was also performed in a selection of articles where the quality of research can be considered as high, i.e. RCTs only and studies with N>60 only.
3.2
Association between weight changes and costs
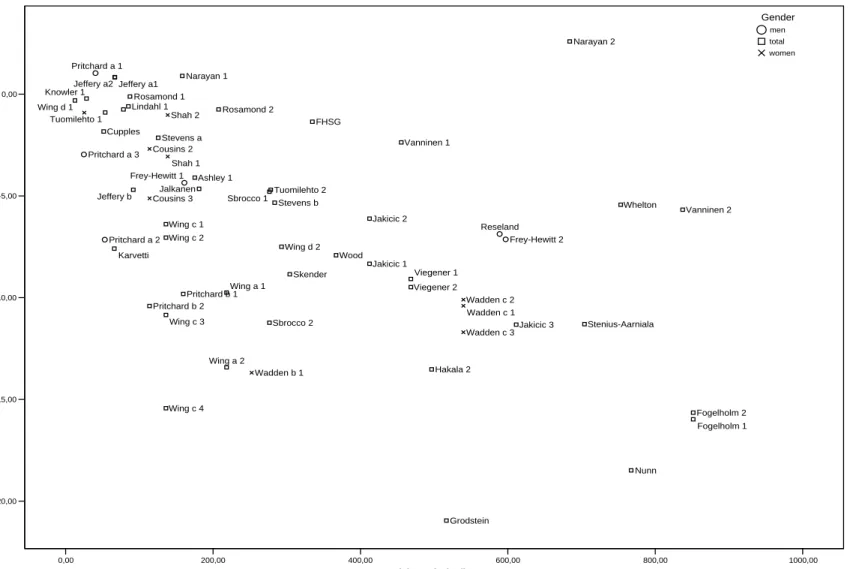
Figure 1 plots the relationship between the estimated costs made in the first year of the
intervention and the percentage weight reduction one year after the start of the programme for 73 interventions. Inspection of scatter plots with various ranges of costs revealed that the relationship between costs and weight changes was linear up to €1000 (Figure 2). Therefore further analyses were done in this cost range, which included 62 interventions. Examples of extremely expensive interventions were those by Hakala, consisting of a two week in-patient treatment in a rehabilitation research centre, and by Torgerson, which used many individual appointments with health care providers. One intervention (Narayan 2) was excluded because this interventions were outliers, so that the analysis was based on 61 interventions.
The interventions that were included are summarized in appendices E and F. The mean baseline weight was 91 (SD 11) kg. The mean costs made after one year amounted to €290 (SD €239) and the mean percentage weight reduction at one year was 6.6 (5.2), ranging from a 21% reduction to a one percent increase in weight. Pearson’s correlation coefficient for the correlation between intervention costs and weight changes was -0.60, and Spearman’s r was -0.64. Linear regression analysis (Table 3) showed that after adjustment for baseline weight, each increase in costs of €100 was associated with an extra weight reduction of 1.0% (95% CI: 0.6% – 1.4%). The model explained 59% (=adjusted R2) of the variation between interventions in the percentage weight change. Models based on various selections of interventions yielded similar estimates for the relationship between weight changes and intervention costs.
0,00 1000,00 2000,00 3000,00 4000,00 5000,00 6000,00
Costs (€) made in first year
-30,00 -20,00 -10,00 0,00 Weight cha n ge ( % ) Frey-Hewitt 1 Frey-Hewitt 2 Pritchard a 1 Pritchard a 2 Pritchard a 3 Reseland Anderson a Anderson b Ashley 1 Ashley 2 Ashley 3 Blonk Cupples FHSG Fogelholm 1 Fogelholm 2 Grodstein Hakala 1 Hakala 2 Jakicic 1 Jakicic 3 Jeffery a1 Jeffery b Karvetti Knowler 1 Knowler 2 Lindahl 2 Narayan 2 Nunn Pritchard b 1Pritchard b 2 Rosamond 1 Sbrocco 2 Steptoe Stevens a Stevens b Torgerson 1 Torgerson 2 Vanninen 1 Viegener 1 Viegener 2 Whelton Wing a 2 Wing c 1 Wing c 2 Wing c 3 Wing c 4 Cousins 3 Wadden b 1 Wadden b 2 Wadden c 1 Wadden c 3 Gender men total women
Figure 1. The relationship between costs of an intervention and percentage change in weight one year after the start of an intervention (n=73)
0,00 200,00 400,00 600,00 800,00 1000,00
Costs (€) made in first year
-20,00 -15,00 -10,00 -5,00 0,00 We ight loss (% ) Frey-Hewitt 1 Frey-Hewitt 2 Pritchard a 1 Pritchard a 2 Pritchard a 3 Reseland Ashley 1 Cupples FHSG Fogelholm 1 Fogelholm 2 Grodstein Hakala 2 Jakicic 1 Jakicic 2 Jakicic 3 Jalkanen Jeffery a1 Jeffery a2 Jeffery b Karvetti Knowler 1 Lindahl 1 Narayan 1 Narayan 2 Nunn Pritchard b 1 Pritchard b 2 Rosamond 1 Rosamond 2 Sbrocco 1 Sbrocco 2 Skender Stenius-Aarniala Stevens a Stevens b Tuomilehto 1 Tuomilehto 2 Vanninen 1 Vanninen 2 Viegener 1 Viegener 2 Whelton Wing a 1 Wing a 2 Wing c 1 Wing c 2 Wing c 3 Wing c 4 Wing d 1 Wing d 2 Wood Cousins 2 Cousins 3 Shah 1 Shah 2 Wadden b 1 Wadden c 1 Wadden c 2 Wadden c 3 Gender men total women
Figure 2. The relationship between costs of an intervention and percentage change in weight one year after the start of an intervention for those interventions costing less than €1000 per person (n=62)
Table 3. The relationship between intervention costs and percentage weight reduction after one year for interventions below €1000
Model No.
interventions
% Weight loss per increase of €100 95% Confidence Interval Adjusted R2 of model
Adjusted for baseline weight 61a 1.0 0.6 – 1.4 0.59
Unadjusted 61b 1.3 0.9 – 1.8 0.35
Excluding drop-out > 40%c 56 1.0 0.6 – 1.4 0.61
RCTs only c 26 1.1 0.7 – 1.6 0.65
N baseline > 60 c 21 0.9 0.0 – 1.9 0.58
a the weight loss per €100 increase was 0.7% and the R2 was 0.41 when two outliers were included in the
analysis.
b the weight loss per €100 increase was 1.1% and the R2 was 0.18 when two outliers were included in the
analysis.
c adjusted for baseline weight.
€13-€92 €113-182 €207-€456 €468-€852
Quartiles of intervention costs
0,00 2,00 4,00 6,00 8,00 10,00 12,00 Me an weight loss (%)
Figure 3. Percentage weight reduction at one year per quartile of intervention costs
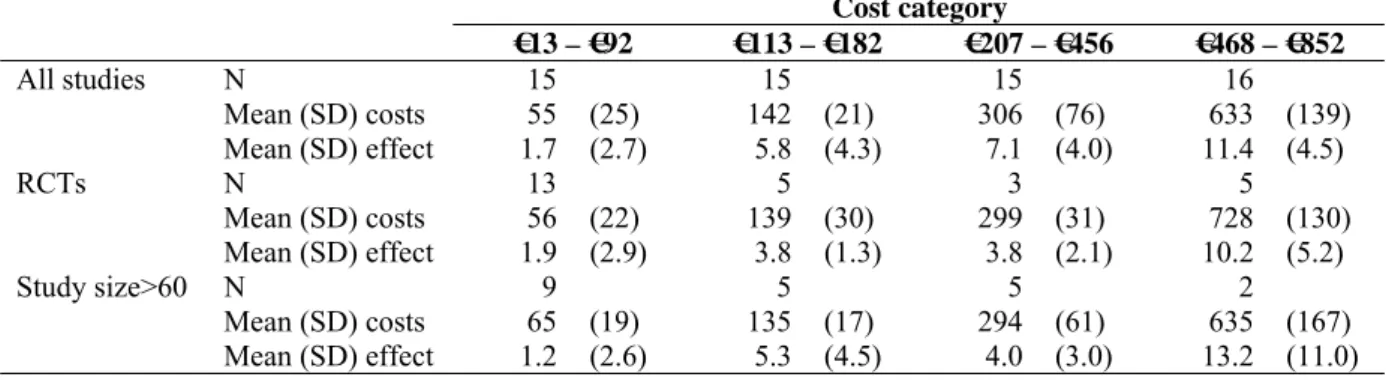
1: €13 – €92 (n=15); 2: €113 – €182 (n=15); 3: €207 – €456 (n=15); 4: €468 – €852 (n=16) Figure 3 shows the mean weight reduction for quartiles of intervention costs. The mean weight reduction was higher in higher quartiles of intervention costs. Interventions costing €113 – €182 (mean €142) showed a mean (SD) weight loss of 5.8 (4.3) %. After the most expensive interventions (mean €633) participants lost more than 10% of their weight. This general picture was similar when the mean weight loss was calculated for the same cost categories for RCTs and larger (>60 participants) studies only (Table 4). Differences in
weight loss between the second and third categories were small; programmes costing €207 – €456 also were associated with a weight loss around 5%.
Table 4. Mean costs and effects in different cost categories, for randomised controlled trials and studies with a large study size
Cost category €13 – €92 €113 – €182 €207 – €456 €468 – €852 All studies N 15 15 15 16 Mean (SD) costs 55 (25) 142 (21) 306 (76) 633 (139) Mean (SD) effect 1.7 (2.7) 5.8 (4.3) 7.1 (4.0) 11.4 (4.5) RCTs N 13 5 3 5 Mean (SD) costs 56 (22) 139 (30) 299 (31) 728 (130) Mean (SD) effect 1.9 (2.9) 3.8 (1.3) 3.8 (2.1) 10.2 (5.2) Study size>60 N 9 5 5 2 Mean (SD) costs 65 (19) 135 (17) 294 (61) 635 (167) Mean (SD) effect 1.2 (2.6) 5.3 (4.5) 4.0 (3.0) 13.2 (11.0)
3.3
Influence of intervention characteristics
Appendix F presents several characteristics of the intervention programmes. In 18 of the 61 interventions (30%) a specific reduced-energy diet was prescribed, and in 10 interventions (16%) participants followed an exercise program under supervision. Thirty-seven (61%) interventions included some form of behavioural therapy in their programme. The intervention included only individual activities in 16 (26%) interventions, included only group sessions in 29 (48%) interventions and both individual and group sessions in 16 (26%) interventions.
Table 5. Percentage weight loss for interventions with or without certain components in the programme, per cost quartile
Intervention component
Cost category
€13 – €92 €113 – €182 €207 – €456 €468 – €852 Na %change Na %change Na %change Na %change
Specific reduced- no 15 1.7 10 4.2 12 6.3 6 10.6
energy diet prescribed yes 0 n.a. 5 8.8 3 10.2 10 11.9
Exercise programme no 15 1.7 15 5.7 11 7.3 10 11.2
under supervision yes 0 n.a. 0 n.a. 4 6.4 6 11.8
Behavioural therapy no 11 1.7 5 5.6 5 3.4* 3 8.7
yes 4 1.7 10 5.8 10 8.9* 13 12.1
a number of interventions.
n.a.: not applicable.
Table 5 shows that in higher costs categories, a higher percentage of interventions included a specific diet, exercise training under supervision and behavioural therapy. Data from Table 5 were used to produce Figure 4, which shows that in general programmes in which a specific reduced-energy diet was prescribed or which contained behavioural therapy were associated with more weight loss independent of the intervention costs. Inclusion of a supervised
exercise programme in an intervention did not seem to result in a higher percentage of weight loss (Figure 4 and Table 5). However, because of a low number of interventions for some comparisons, lack of statistical power might be a problem.
In Table 6 interventions were compared in which a diet was prescribed, with or without a supervised exercise programme. However, the number of interventions was too small to make a valid comparison.
Table 6. Percentage weight loss for interventions in which a specific diet was prescribed, with or without an exercise programme under supervision, per cost quartile.
Exercise
programme under supervision
Cost category
€13 – €92 €113 – €182 €207 – €456 €468 – €852
N %change N %change N %change N %change
No - - 5 8.8 2 11.6 5 11.1
A B C Figure 4. Mean weight loss (%) per cost quartile and per intervention component
A: behavioural therapy; B: exercise under supervision; C: prescription of diet
Cost quartiles: 1: €13 – €92; 2: €113 – €182; 3: €207 – €456; 4: €468 – €852 * p < 0.05. 0,0 2,0 4,0 6,0 8,0 10,0 12,0 14,0 1 2 3 4 cost quartile per c ent w e ig ht l o ss
specific reduced-energy diet prescribed no specific reduced-energy diet prescribed yes
0,0 2,0 4,0 6,0 8,0 10,0 12,0 14,0 1 2 3 4 cost quartile p ercen t wei g h t l o ss
exercise program under supervision no exercise program under supervision yes
0,0 2,0 4,0 6,0 8,0 10,0 12,0 14,0 1 2 3 4 cost quartile p ercen t wei g h t l o ss behavioural therapy no behavioural therapy yes
Table 7. Mean weight loss in individually and group-oriented interventions
Cost category
€13 – €92 €113 – €182 €207 – €456 €468 – €852
N %change N %change N %change N %change
Individual component
8 0.7 2 10.1 4 2.3 2 9.6
Group component 2 6.1 11 5.7 9 9.2 7 11.8
Individual and group component
5 1.5 2 1.7 2 7.2 7 11.6
The mean percentages of weight loss in interventions that were offered individually, in
groups and in both ways are shown in Table 7. It appears that intervention programmes which were done in groups, e.g. which include classes, were the most effective. However, there were few interventions in some categories. Moreover, Table 8 shows that if an intervention contained one of the components which were shown to be effective above, this was almost always done in groups. Thus, it is hard to disentangle the mode of intervention from the intervention components.
Table 8. Number of interventions by mode of intervention (group or individual) and intervention components (diet, exercise, behavioural therapy)
Intervention component Specific reduced-energy diet prescribed Exercise programme under supervision Behavioural therapy
yes no yes No yes no
Individual component 0 16 1 15 3 13
Group component 15 14 8 21 26 3
Individual and group component
3 13 1 15 8 8
3.4
Costs and weight loss after two years
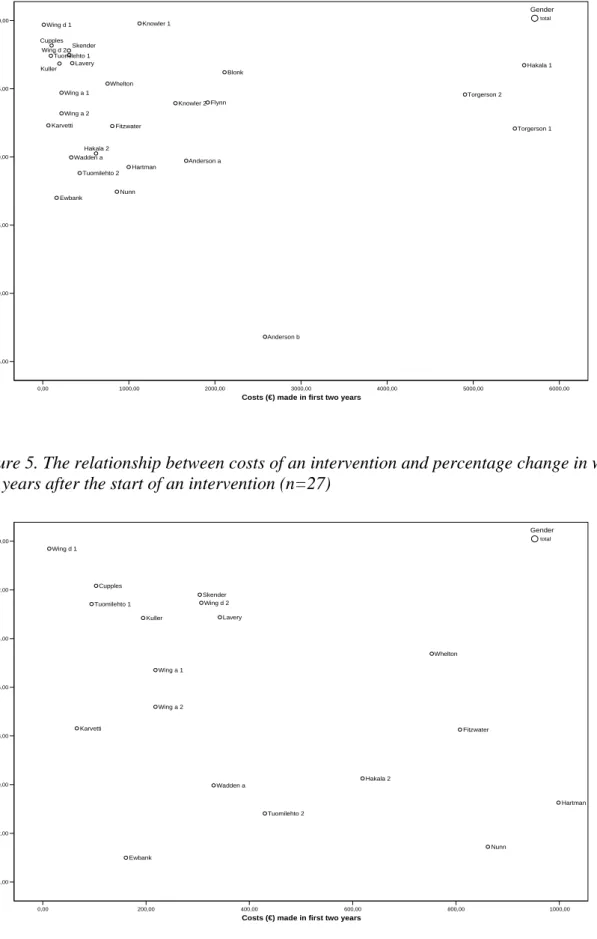
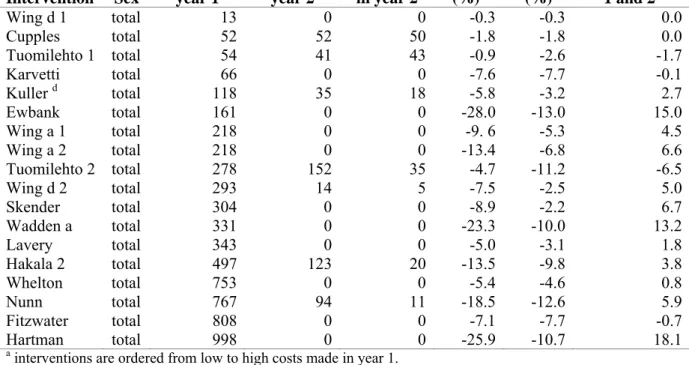
Figure 5 shows that there was large variation in intervention costs after two years. Like was done in the one-year analyses, the analyses were limited to interventions below €1000 (n=18, see Figure 6 and appendices G and H). The mean weight loss after 2 years of these 18
interventions was 6.4% (SD 4.1) and the mean costs €379 (SD 301). Figure 6 suggests an association between costs and weight loss after two years. Linear regression analysis showed that for each increase in costs of €100 the extra weight loss was 0.6% (95% CI -0.1 – 1.2), but this association was not statistically significant (p=0.087).
Intervention costs and weight losses for a 2-year period for each intervention are tabulated in Table 9. Interventions for which relatively high weight losses were observed after one year also showed relatively high losses after two years, although weight regain also was high for those interventions. With respect to spreading of the costs over the first two years, it can be seen that generally interventions became less intensive or ended after the first year. There were too few interventions to draw conclusions regarding the effects of spreading of the costs on weight loss after two years.
0,00 1000,00 2000,00 3000,00 4000,00 5000,00 6000,00 Costs (€) made in first two years
-25,00 -20,00 -15,00 -10,00 -5,00 0,00 W e ig h t ch an g e (% ) Anderson a Anderson b Blonk Cupples Ewbank Fitzwater Flynn Hakala 1 Hakala 2 Hartman Karvetti Knowler 1 Knowler 2 Kuller Lavery Nunn Skender Torgerson 1 Torgerson 2 Tuomilehto 1 Tuomilehto 2 Wadden a Whelton Wing a 1 Wing a 2 Wing d 1 Wing d 2 Gender total
Figure 5. The relationship between costs of an intervention and percentage change in weight two years after the start of an intervention (n=27)
0,00 200,00 400,00 600,00 800,00 1000,00
Costs (€) made in first two years -14,00 -12,00 -10,00 -8,00 -6,00 -4,00 -2,00 0,00 Wei g h t ch an g e (%) Cupples Ewbank Fitzwater Hakala 2 Hartman Karvetti Kuller Lavery Nunn Skender Tuomilehto 1 Tuomilehto 2 Wadden a Whelton Wing a 1 Wing a 2 Wing d 1 Wing d 2 Gender total
Figure 6. The relationship between costs of an intervention and percentage change in weight two years after the start of an intervention for interventions below €1000 (n=18)
Table 9. Intervention costsa and weight losses in year one and two Intervention Sex Costs per participant year 1 Costs per participant year 2 Percentage of total costs spent in year 2 Weight loss year 1 (%)b Weight loss year 2 (%) Difference between year 1 and 2c Wing d 1 total 13 0 0 -0.3 -0.3 0.0 Cupples total 52 52 50 -1.8 -1.8 0.0 Tuomilehto 1 total 54 41 43 -0.9 -2.6 -1.7 Karvetti total 66 0 0 -7.6 -7.7 -0.1 Kuller d total 118 35 18 -5.8 -3.2 2.7 Ewbank total 161 0 0 -28.0 -13.0 15.0 Wing a 1 total 218 0 0 -9. 6 -5.3 4.5 Wing a 2 total 218 0 0 -13.4 -6.8 6.6 Tuomilehto 2 total 278 152 35 -4.7 -11.2 -6.5 Wing d 2 total 293 14 5 -7.5 -2.5 5.0 Skender total 304 0 0 -8.9 -2.2 6.7 Wadden a total 331 0 0 -23.3 -10.0 13.2 Lavery total 343 0 0 -5.0 -3.1 1.8 Hakala 2 total 497 123 20 -13.5 -9.8 3.8 Whelton total 753 0 0 -5.4 -4.6 0.8 Nunn total 767 94 11 -18.5 -12.6 5.9 Fitzwater total 808 0 0 -7.1 -7.7 -0.7 Hartman total 998 0 0 -25.9 -10.7 18.1
a interventions are ordered from low to high costs made in year 1.
b Follow-up time within first year but not necessarily after exactly one year.
c negative values indicate extra weight loss, positive values weight regain between year 1 and 2. d between 1.5 and 2.5 years €41 spent.
3.5
Success rate
Table 10 shows the success rate of 16 interventions where this information was reported. The success rate is defined as the percentage of the study population with a weight reduction of 5 or 10%. Since there is variation in the years of follow-up, after which the success rates were determined, it is hard to draw conclusions. For interventions after which an average weight reduction between 3 to 7% was observed, the success rates for a 5% weight loss varied between 40% and 60%, while the follow-up period for most of these interventions was 2 years or more.
Table 10. Percentage of participants who lost at least 5% and 10% of their body weight
Intervention Sex Average weight loss (%) Success rate 5% Success rate 10% Years from baseline Cumulative costs (€) Fogelholm 1 total -8.8 38 20 3.0 851 Fogelholm 2 total -5.0 38 20 3.0 851 Hakala 1 total -3.3 43 14 2.0 5592 Hakala 1 total -1.9 36 22 5.0 6696 Hakala 2 total -9.8 75 46 2.0 619 Hakala 2 total -5.3 40 24 5.0 619 Holden total -11.5 60 40 3.3 4170 Knowler 1 total -0.2 15 5 4.0 1975 Knowler 2 total -3.9 45 20 4.0 1975 Lindahl 1 total -0.6 12 3 1.0 85 Lindahl 2 total -6.3 61 20 1.0 2178 Steptoe total -0.8 18 4 1.0 63 Torgerson 1 men -12.0 74 34 2.0 5484 Torgerson 1 women -5.2 47 20 2.0 5484 Torgerson 2 men -4.3 38 19 2.0 4905 Torgerson 2 women -6.0 48 30 2.0 4905
Tuomilehto 1 total -0.9 13 n.a. 1.0 54
Tuomilehto 2 total -4.7 43 n.a. 1.0 278
Wadden a men -13.1 75 42 2.5 331 Wadden a men -10.8 75 42 3.5 331 Wadden a men -8.6 61 26 4.5 331 Wadden a men -7.7 58 28 5.5 331 Wadden a women -9.2 58 43 2.5 331 Wadden a women -7.6 55 35 3.5 331 Wadden a women -6.2 49 32 4.5 331 Wadden a women -5.2 48 31 5.5 331 Wing c 4 total -15.4 16 3 1.0 136
4.
Discussion and conclusions
4.1
Summary of main results
The objective of the present study was to investigate the association between the costs (which reflect intensity) and effects of interventions aimed at reducing body weight and performed within a health care setting or in an overweight population and/or carried out by health care professionals. For 15 interventions costing on average €150 per person, the mean weight loss was around 5%, which is considered clinically significant. The relationship between costs and effects was linear until approximately €1000 per person. In the linear range, each increase in costs of €100 per person was associated with a weight reduction of 1.0% after one year. It appeared that interventions in which a specific diet (e.g. a (very)-low-calorie diet) was prescribed and which included behavioural therapy in their programme were associated with greater weight loss than interventions without these components. Weight reductions after 2 years also appeared to be related to intervention costs.
4.2
Discussion of methods
The results of the present study must be interpreted with some considerations in mind. First, the weight changes that were used in the analyses were the changes within each intervention or control group. This was done because many studies did not include a control group. If any, there were considerable variations in the type of control group. Some control groups were ‘real’ control groups, whereas other control groups received usual care or a less intensive intervention. We therefore decided to include control groups only if they fulfilled the same inclusion criteria as the intervention group in a study. The implication of using within-group changes is that several factors which influence weight (change) could not be controlled for. These sources include the natural course of weight over time and changes in diet and physical activity that would also have occurred without the intervention. Nevertheless, it is plausible that the observed weight changes result from the interventions, because the majority of the included interventions showed reductions in weight as opposed to the normally observed increases over time when no intervention is administered.
Second, it is important to notice that when only large studies and RCTs were included in the analyses, the weight loss in the second (mean costs approximately €150) and third (mean costs approximately €300, range €207 – €456) quartiles of intervention costs was similar. This implies that it is possible to achieve a weight loss of 5% with interventions costing €150 per person, but that it may also be necessary to use more expensive (i.e. more intensive) interventions to reach the same amount of weight loss. In addition to analysing all interventions, the analyses were performed for large studies and RCTs only because the quality of these studies is considered as high. However, the quality of the smaller studies and non-RCTs included in the present report was also good and all studies had all passed the criteria for inclusion in one or more of the six literature reviews that were used as a starting point for the selection of studies for the present report.
Third, if possible we extracted information for only the participants who did not drop out during the study, because the large majority of articles reported weight loss for participants who completed measurements. Since persons who drop out of a study may be less motivated
to participate, weight loss is likely to be higher among participants who remain in a study. A related issue is the participation in the intervention activities like classes and exercise
trainings. As the fixed costs of an intervention and costs of the staff remain the same regardless of the number of participants, low participation increases the real costs of an intervention per participant. However, if it is true that more motivated persons (who are likely to lose more weight) participate to a higher extent in a programme, this would decrease the real costs per person for each percent of weight loss. Since the effect of participation thus is unclear, we calculated the costs per percent weight loss per participant who started an intervention. This is equivalent to the planned intervention costs per person.
Fourth, because the description of the interventions was not always complete, some costs may not have been included in the cost calculations. Only the resource use as mentioned in the literature or as given by the authors was included in the calculations. In addition, the unit prices are estimates and may differ from the actual costs. Therefore the calculations described in this report are an indication of the real costs per participant in the several interventions. The calculated costs may be an underestimate of the real costs because fixed costs were excluded. On the other hand, an overestimation is also possible because we assumed a surcharge of 45% overhead costs, which may be too high for extramural interventions. However, for all interventions a standardised method was used to calculate costs, so that small underestimates or overestimates are not likely to have led to biased results with respect to the association between intervention costs and weight loss.
Fifth, we observed a linear relationship between intervention costs and weight loss for
interventions costing less than €1000. Therefore more expensive interventions were excluded from the analyses. After approximately €1000 the relationship became weaker. When more expensive interventions were included, i.e. the cut-off points for inclusion in the regression analyses were chosen at €1500, €2000 and €4000, each increase in costs of €100 per person was associated with a weight reduction of 5%, 4% and 3%, respectively.
Finally, regain of weight after ending a weight loss programme may occur. However, there was little information on weight loss one year or more after an intervention had ended. Therefore we could not examine if the association between intervention costs and effects would hold after an intervention has ended for some time. This implies that each year additional investments in weight loss maintenance programmes may be necessary to ensure that (a part of) the weight loss will sustain on the longer term. Nevertheless, since all
interventions were directed towards changing lifestyle, we expect that as positive changes in diet and exercise behaviour are made, at least a certain percentage of weight loss will be maintained. In addition, the results after two years show that despite weight regain, for most interventions a net weight loss is still observed, and that if a relatively high weight loss was observed after one year this was also the case after two years.
4.3
Policy implications
The present study indicates that interventions are likely to be more effective if the
intervention costs are higher, i.e. if an intervention is more intensive. However, it seems that after a certain amount of money, which lies around €1000, extra weight loss cannot be warranted; the interventions which cost more did not seem to result in more weight loss.
A clinically relevant weight loss of 5% of body weight during the first year of treatment can already be achieved by interventions costing around €150 per person. However, after exclusion of certain types of studies, the range in costs necessary for this weight loss was higher, and thus the costs may amount to €300-€400. Interventions costing €650 were
associated with a mean weight loss of 10%. Compared to around €75 per person per month of treatment with orlistat or sibutramine (see http://www.cvzkompassen.nl/fk/), lifestyle
interventions are relatively cheap. Moreover, lifestyle interventions are more likely to lead to other positive effects on health, like a reduction in blood pressure and improved blood lipid profiles (13).
Because of the variety in intervention programmes, the policy maker has to know which interventions work best in order to effectively allocate financial resources. All the included interventions were aimed at changing diet and exercise behaviour. Our results indicate that, irrespective of costs, a diet programme is more effective if participants are prescribed a certain reduced-energy diet (for an example see text box on page 17), than when they are simply encouraged to reduce their energy intake. Programmes which include behavioural therapy seem to be more effective than programmes without this form of therapy.
Interventions in which participants engage in physical activity under supervision of a trainer did not appear to be more effective than programmes in which participants are merely advised to be more physically active. However, the number of interventions that included a supervised exercise programme was relatively low and statistical power may have been insufficient on this specific point. From literature there are indications that exercise may be important in the maintenance of weight loss (14, 15). Furthermore, it must be reminded that all interventions were directed at physical activity, but that some only encouraged
participants to exercise more. Moreover, being physically active is related to various other favourable health outcomes (16, 17).
With respect to weight loss after group or individually-oriented interventions our data were not suitable to draw conclusions.
4.4
Conclusions
In the light of several methodological considerations, it is concluded that the costs of an intervention, which reflect the intensity, are predictive of its outcome. More intensive (expensive) interventions thus are likely to be more effective in reducing body weight in the secondary prevention of obesity. However, lifestyle interventions do not need to be
expensive, because a clinically significant weight loss of 5% was observed among the interventions costing around €150.
Intervention programmes which include prescribed energy-reduced diets and behavioural therapy seem to be more effective than interventions without these components. Although our analysis did not indicate that supervised physical activity programmes are associated with more weight loss, it is known from literature that physical exercise may be important in the maintenance of weight loss.
References
1. Overweight, obesity, and health risk. National Task Force on the Prevention and Treatment of Obesity. Arch Intern Med 2000;160:898-904.
2. Visscher TL, Rissanen A, Seidell JC, et al. Obesity and unhealthy life-years in adult Finns: an empirical approach. Arch Intern Med 2004;164:1413-20.
3. Martinez JA. Body-weight regulation: causes of obesity. Proc Nutr Soc 2000;59:337-45.
4. Anderson JW, Konz EC, Frederich RC, Wood CL. Long-term weight-loss maintenance: a meta-analysis of US studies. Am J Clin Nutr 2001;74:579-84. 5. Wilcox S, Parra-Medina D, Thompson-Robinson M, Will J. Nutrition and physical
activity interventions to reduce cardiovascular disease risk in health care settings: a quantitative review with a focus on women. Nutr Rev 2001;59:197-214.
6. Mullis RM, Blair SN, Aronne LJ, et al. Prevention Conference VII: Obesity, a worldwide epidemic related to heart disease and stroke: Group IV:
prevention/treatment. Circulation 2004;110:e484-8.
7. Elder JP, Williams SJ, Drew JA, Wright BL, Boulan TE. Longitudinal effects of preventive services on health behaviors among an elderly cohort. Am J Prev Med 1995;11:354-9.
8. McTigue KM, Harris R, Hemphill B, et al. Screening and interventions for obesity in adults: summary of the evidence for the U.S. Preventive Services Task Force. Ann Intern Med 2003;139:933-49.
9. Avenell A, Broom J, Brown TJ, et al. Systematic review of the long-term effects and economic consequences of treatments for obesity and implications for health
improvement. Health Technol Assess 2004;8:iii-iv, 1-182.
10. Eakin EG, Glasgow RE, Riley KM. Review of primary care-based physical activity intervention studies: effectiveness and implications for practice and future research. J Fam Pract 2000;49:158-68.
11. Ashenden R, Silagy C, Weller D. A systematic review of the effectiveness of promoting lifestyle change in general practice. Fam Pract 1997;14:160-76.
12. Drummond MF, O'Brien B, Stoddart GL, Torrance GW. Basic types of economic evaluation. In: Drummond MF, O'Brien B, Stoddart GL, Torrance GW, eds. Methods for the economic evaluation of health care programmes. New York: Oxford
University Press, 1997:6-26.
13. Kromhout D, Menotti A, Kesteloot H, Sans S. Prevention of coronary heart disease by diet and lifestyle: evidence from prospective cross-cultural, cohort, and intervention studies. Circulation 2002;105:893-8.
14. Fogelholm M, Kukkonen-Harjula K, Nenonen A, Pasanen M. Effects of walking training on weight maintenance after a very-low-energy diet in premenopausal obese women: a randomized controlled trial. Arch Intern Med 2000;160:2177-84.
15. Wadden TA, Vogt RA, Foster GD, Anderson DA. Exercise and the maintenance of weight loss: 1-year follow-up of a controlled clinical trial. J Consult Clin Psychol 1998;66:429-433.
16. Bauman AE. Updating the evidence that physical activity is good for health: an epidemiological review 2000-2003. J Sci Med Sport 2004;7:6-19.
17. Arroll B, Beaglehole R. Does physical activity lower blood pressure: a critical review of the clinical trials. J Clin Epidemiol 1992;45:439-47.