Environmental risk limits for
metsulfuron-methyl
Letter report 601716020/2008 J.W.A. Scheepmaker | J.W. Vonk
RIVM Letter report 601716020/2008
Environmental risk limits for metsulfuron-methyl
J.W.A. Scheepmaker J.W. Vonk
Contact:
J.W.A. Scheepmaker
Expertise Centre for Substances Jacqueline.scheepmaker@rivm.nl
This investigation has been performed by order and for the account of Directorate-General for
Environmental Protection, Directorate for Soil, Water and Rural Area (BWL), within the framework of the project ‘Standard setting for other relevant substances within the WFD’.
© RIVM 2008
Parts of this publication may be reproduced, provided acknowledgement is given to the 'National Institute for Public Health and the Environment', along with the title and year of publication.
Rapport in het kort
Environmental risk limits for metsulfuron-methyl
Dit rapport geeft milieurisicogrenzen voor het herbicide metsulfuron-methyl in water. Milieurisicogrenzen zijn de technisch-wetenschappelijke advieswaarden voor de uiteindelijke
milieukwaliteitsnormen in Nederland. De milieurisicogrenzen zijn afgeleid volgens de methodiek die is voorgeschreven in de Europese Kaderrichtlijn Water. Hierbij is gebruikgemaakt van de beoordeling in het kader van de Europese toelating van gewasbeschermingsmiddelen (Richtlijn 91/414/EEG), aangevuld met gegevens uit de openbare literatuur.
Contents
1 Introduction 7
1.1 Background and scope of the report 7
1.2 Status of the results 7
2 Methods 8
2.1 Data collection 8
2.2 Data evaluation and selection 8
2.3 Derivation of ERLs 9
2.3.1 Drinking water 9
3 Derivation of environmental risk limits for metsulfuron-methyl 11
3.1 Substance identification, physico-chemical properties, fate and human toxicology 11
3.1.1 Identity 11
3.1.2 Physico-chemical properties 12
3.1.3 Behaviour in the environment 12
3.1.4 Bioconcentration and biomagnification 12
3.1.5 Human toxicological threshold limits and carcinogenicity 13
3.2 Trigger values 13
3.3 Toxicity data and derivation of ERLs for water 13
3.3.1 MPCwater, eco and MPCmarine, eco 13
3.3.2 MPCsp, water and MPCsp, marine 15
3.3.3 MPChh food, water 16
3.3.4 MPCdw, water 16
3.3.5 Selection of the MPCwater and MPCmarine 16
3.3.6 MACeco 16
3.3.7 SRCeco, water 16
3.4 Toxicity data and derivation of ERLs for sediment 16
4 Conclusions 17
References 18
Appendix 1. Information on bioconcentration 19
Appendix 2. Detailed aquatic toxicity data 20
Appendix 3. Enclosure studies 25
1
Introduction
1.1
Background and scope of the report
In this report, environmental risk limits (ERLs) for surface water (freshwater and marine) are derived for the herbicide metsulfuron-methyl. The derivation is performed within the framework of the project ‘Standard setting for other relevant substances within the WFD’, which is closely related to the project ‘International and national environmental quality standards for substances in the Netherlands’ (INS). Metsulfuron-methyl is part of a series of 25 pesticides that appeared to have a high environmental impact on the evaluation of the policy document on sustainable crop protection (‘Tussenevaluatie van de nota Duurzame Gewasbescherming’; MNP, 2006) and/or were selected by the Water Boards (‘Unie van Waterschappen’; project ‘Schone Bronnen’; http://www.schonebronnen.nl/).
The following ERLs are considered:
• Maximum Permissible Concentration (MPC) – the concentration protecting aquatic ecosystems and humans from effects due to long-term exposure
• Maximum Acceptable Concentration (MACeco) – the concentration protecting aquatic ecosystems from effects due to short-term exposure or concentration peaks.
• Serious Risk Concentration (SRCeco) – the concentration at which possibly serious ecotoxicological effects are to be expected.
More specific, the following ERLs can be derived depending on the availability of data and characteristics of the compound:
MPCeco, water MPC for freshwater based on ecotoxicological data (direct exposure) MPCsp, water MPC for freshwater based on secondary poisoning
MPChh food, water MPC for fresh and marine water based on human consumption of fishery products
MPCdw, water MPC for surface waters intended for the abstraction of drinking water
MACeco, water MAC for freshwater based on ecotoxicological data (direct exposure)
SRCeco, water SRC for freshwater based on ecotoxicological data (direct exposure)
MPCeco, marine MPC for marine water based on ecotoxicological data (direct exposure)
MPCsp, marine MPC for marine water based on secondary poisoning
MACeco, marine MAC for marine water based on ecotoxicological data (direct exposure)
1.2
Status of the results
The results presented in this report have been discussed by the members of the scientific advisory group for the INS-project (WK-INS). It should be noted that the Environmental Risk Limits (ERLs) in this report are scientifically derived values, based on (eco)toxicological, fate and physico-chemical data. They serve as advisory values for the Dutch Steering Committee for Substances, which is appointed to set the Environmental Quality Standards (EQSs). ERLs should thus be considered as proposed values that do not have any official status.
2
Methods
The methodology for the derivation of ERLs is described in detail by Van Vlaardingen and Verbruggen (2007), further referred to as the ‘INS-Guidance’. This guidance is in accordance with the guidance of the Fraunhofer Institute (FHI; Lepper, 2005).
The process of ERL-derivation contains the following steps: data collection, data evaluation and selection, and derivation of the ERLs on the basis of the selected data.
2.1
Data collection
In accordance with the WFD, data of existing evaluations were used as a starting point. For pesticides, the evaluation report prepared within the framework of EU Directive 91/414/EC (Draft Assessment Report, DAR) was consulted (EC, 2000; further referred to as DAR). An on-line literature search was performed on TOXLINE (literature from 1985 to 2001) and Current Contents (literature from 1997 to 2007). In addition to this, all potentially relevant references in the RIVM e-tox base and EPA’s ECOTOX database were checked.
2.2
Data evaluation and selection
For substance identification, physico-chemical properties and environmental behaviour, information from the List of Endpoints of the DAR was used. When needed, additional information was included according to the methods as described in Section 2.1 of the INS-Guidance. Information on human toxicological threshold limits and classification was also primarily taken from the DAR.
Ecotoxicity studies (including bird and mammal studies) were screened for relevant endpoints (i.e. those endpoints that have consequences at the population level of the test species). All ecotoxicity and bioaccumulation tests were then thoroughly evaluated with respect to the validity (scientific reliability) of the study. A detailed description of the evaluation procedure is given in the INS-Guidance (see Section 2.2.2 and 2.3.2). In short, the following reliability indices were assigned:
- Ri 1: Reliable without restriction
’Studies or data … generated according to generally valid and/or internationally accepted testing guidelines (preferably performed according to GLP) or in which the test parameters documented are based on a specific (national) testing guideline … or in which all parameters described are closely related/comparable to a guideline method.’
- Ri 2: Reliable with restrictions
’Studies or data … (mostly not performed according to GLP), in which the test parameters
documented do not totally comply with the specific testing guideline, but are sufficient to accept the data or in which investigations are described which cannot be subsumed under a testing guideline, but which are nevertheless well documented and scientifically acceptable.’
- Ri 3: Not reliable
’Studies or data … in which there are interferences between the measuring system and the test substance or in which organisms/test systems were used which are not relevant in relation to the exposure (e.g., unphysiologic pathways of application) or which were carried out or generated
according to a method which is not acceptable, the documentation of which is not sufficient for an assessment and which is not convincing for an expert judgment.’
- Ri 4: Not assignable
’Studies or data … which do not give sufficient experimental details and which are only listed in short abstracts or secondary literature (books, reviews, etc.).’
All available studies were summarised in data-tables, that are included as Appendices to this report. These tables contain information on species characteristics, test conditions and endpoints. Explanatory notes are included with respect to the assignment of the reliability indices.
With respect to the DAR, it was chosen not to re-evaluate the underlying studies. In principle, the endpoints that were accepted in the DAR were also accepted for ERL-derivation with Ri 2, except in cases where the reported information was too poor to decide on the reliability or when there was reasonable doubt on the validity of the tests. This applies especially to DARs prepared in the early 1990s, which do not always meet the current standards of evaluation and reporting.
In some cases, the characteristics of a compound (i.e. fast hydrolysis, strong sorption, low water solubility) put special demands on the way toxicity tests are performed. This implies that in some cases endpoints were not considered reliable, although the test was performed and documented according to accepted guidelines. If specific choices were made for assigning reliability indices, these are outlined in Section 3.3 of this report.
Endpoints with Ri 1 or 2 are accepted as valid, but this does not automatically mean that the endpoint is selected for the derivation of ERLs. The validity scores are assigned on the basis of scientific
reliability, but valid endpoints may not be relevant for the purpose of ERL-derivation (e.g. due to inappropriate exposure times or test conditions that are not relevant for the Dutch situation).
After data collection and validation, toxicity data were combined into an aggregated data table with one effect value per species according to Section 2.2.6 of the INS-Guidance. When for a species several effect data were available, the geometric mean of multiple values for the same endpoint was calculated where possible. Subsequently, when several endpoints were available for one species, the lowest of these endpoints (per species) is reported in the aggregated data table.
2.3
Derivation of ERLs
For a detailed description of the procedure for derivation of the ERLs, reference is made to the INS-Guidance. With respect to the selection of the final MPCwater, an additional comment should be made:
2.3.1
Drinking water
The INS-Guidance includes the MPC for surface waters intended for the abstraction of drinking water
(MPCdw, water) as one of the MPCs from which the lowest value should be selected as the general
MPCwater (see INS-Guidance, Section 3.1.6 and 3.1.7). According to the proposal for the daughter
directive Priority Substances, however, the derivation of the AA-EQS (= MPC) should be based on direct exposure, secondary poisoning, and human exposure due to the consumption of fish. Drinking water was not included in the proposal and is thus not guiding for the general MPC value. The exact way of implementation of the MPCdw, water in the Netherlands is at present under discussion within the framework of the “AMvB Kwaliteitseisen en Monitoring Water”. No policy decision has been taken yet, and the MPCdw, water is therefore presented as a separate value in this report. The MPCwater is thus derived considering the individual MPCs based on direct exposure (MPCeco, water), secondary poisoning
(MPCsp, water) or human consumption of fishery products (MPChh food, water); the need for derivation of the latter two is dependent on the characteristics of the compound.
Related to this is the inclusion of water treatment for the derivation of the MPCdw, water. According to the INS-Guidance (see Section 3.1.7), a substance specific removal efficiency related to simple water treatment should be derived in case the MPCdw, water is lower than the other MPCs. For pesticides, there is no agreement as yet on how the removal fraction should be calculated, and water treatment is therefore not taken into account. In case no A1 value is set in Directive 75/440/EEC, the MPCdw, water is set to the general Drinking Water Standard of 0.1 µg/L for organic pesticides as specified in Directive 98/83/EC.
3
Derivation of environmental risk limits for
metsulfuron-methyl
3.1
Substance identification, physico-chemical properties, fate and human
toxicology
3.1.1
Identity
Figure 1. Structural formula of metsulfuron-methyl. Table 1. Identification of metsulfuron-methyl.
Parameter Name or number Source
Common/trivial/other name Metsulfuron-methyl EC, 2000 Chemical name Methyl
2-(4-methoxy-6-methyl-1,3,5-triazin-2-ylcarbamoylsulfamoyl)benzoate
EC, 2000
CAS number 74223-64-6 EC, 2000
EC number -
SMILES code COC(=O)c1ccccc1S(=O)(=O)NC(=O)Nc2nc(O C)nc(C)n2
U.S. EPA, 2007
Use class Herbicide
Mode of action Acetolactate synthase inhibitor Tomlin, 2002 Authorised in NL Yes
3.1.2
Physico-chemical properties
Table 2. Physico-chemical properties of metsulfuron-methyl.
Parameter Unit Value Remark Reference
Molecular weight [g/mol] 381.4 EC, 2000
Water solubility [g/L] 2.79 pH 7, 25 ºC; at pH 5: 0.548 EC, 2000
pKa [-] 3.75 EC, 2000
log KOW [-] -1.7 pH 7, 25 ºC EC, 2000
log KOC [-] 1.60 EC, 2000
Vapour pressure [Pa] 1.1 x 10⁻¹⁰ 20 ºC EC, 2000
Melting point [°C] 162 EC, 2000
Boiling point [°C] n.a. EC, 2000
Henry’s law constant [Pa.m3/mol] 4.5 x 10⁻¹¹ pH 7 EC, 2000. n.a. = not applicable.
3.1.3
Behaviour in the environment
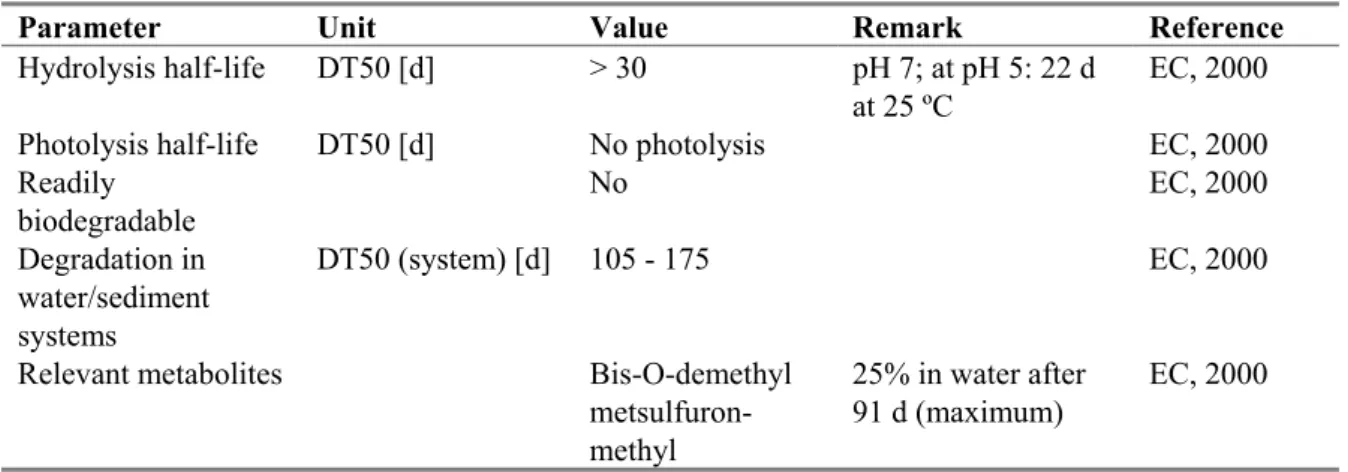
Table 3. Selected environmental properties of metsulfuron-methyl.
Parameter Unit Value Remark Reference
Hydrolysis half-life DT50 [d] > 30 pH 7; at pH 5: 22 d at 25 ºC
EC, 2000 Photolysis half-life DT50 [d] No photolysis EC, 2000 Readily biodegradable No EC, 2000 Degradation in water/sediment systems DT50 (system) [d] 105 - 175 EC, 2000
Relevant metabolites Bis-O-demethyl metsulfuron-methyl
25% in water after 91 d (maximum)
EC, 2000
3.1.4
Bioconcentration and biomagnification
An overview of the bioaccumulation data for metsulfuron-methyl is given in Table 4. Detailed bioaccumulation data for metsulfuron-methyl are tabulated in Appendix 1.
Table 4. Overview of bioaccumulation data for metsulfuron-methyl.
Parameter Unit Value Remark Reference
BCF (fish) [L/kg] < 1 0.007
Experimentally determined Calculated from log BCFfish = 0.85
x log Kow – 0.70
EC, 2000
Veith et al. (1979) BMF [kg/kg] 1 Default value for BCF < 2000
3.1.5
Human toxicological threshold limits and carcinogenicity
No toxicological R phrases are assigned. The substance is not carcinogenic or mutagenic and has no effects on reproduction. The human health protection assessment is not triggered (Draft Assessment Report, European Commission, 1997).
3.2
Trigger values
This section reports on the trigger values for ERLwater derivation (as demanded in WFD framework).
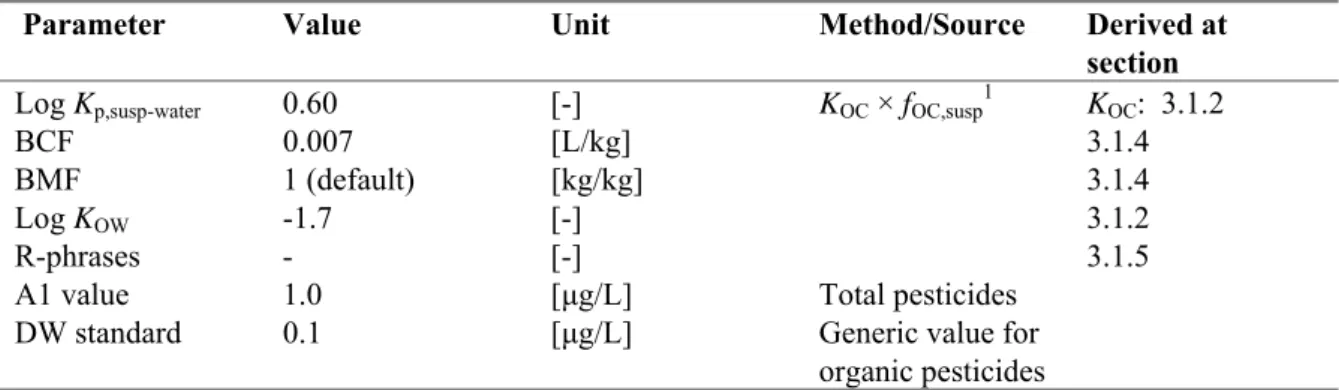
Table 5. Metsulfuron-methyl: collected properties for comparison to MPC triggers.
Parameter Value Unit Method/Source Derived at
section
Log Kp,susp-water 0.60 [-] KOC × fOC,susp1 KOC: 3.1.2
BCF 0.007 [L/kg] 3.1.4
BMF 1 (default) [kg/kg] 3.1.4
Log KOW -1.7 [-] 3.1.2
R-phrases - [-] 3.1.5
A1 value 1.0 [μg/L] Total pesticides
DW standard 0.1 [μg/L] Generic value for organic pesticides
1 f
OC,susp = 0.1 kgOC/kgsolid (EC, 2003).
o Metsulfuron-methyl has a log Kp, susp-water < 3; derivation of MPCsediment is not triggered.
o Metsulfuron-methyl has a BCF < 100 L/kg; assessment of secondary poisoning is not triggered. o Metsulfuron-methyl has no toxicological R classification. Therefore, the derivation of an
MPCwater for human health via food (fish) consumption (MPChh food, water) is not required.
o For metsulfuron-methyl no specific A1 value or Drinking Water Standard are available from Council Directives 75/440/EEC and 98/83/EC, respectively. Therefore, the general Drinking Water Standard for organic pesticides applies.
3.3
Toxicity data and derivation of ERLs for water
3.3.1
MPC
water, ecoand MPC
marine, ecoAn overview of the selected aquatic toxicity data for metsulfuron-methyl is given in Table 6 for freshwater and in Table 7 for the marine environment. Detailed aquatic toxicity data for metsulfuron-methyl are tabulated in Appendix 2.
For the aquatic macrophyte Lemna minor the chronic (7/14 d) EC50 can be used as a virtual acute EC50 -value because of the theoretically logarithmic growth rate of the fonts. The -value is useful for the derivation of the MACeco (see 3.3.6.1).
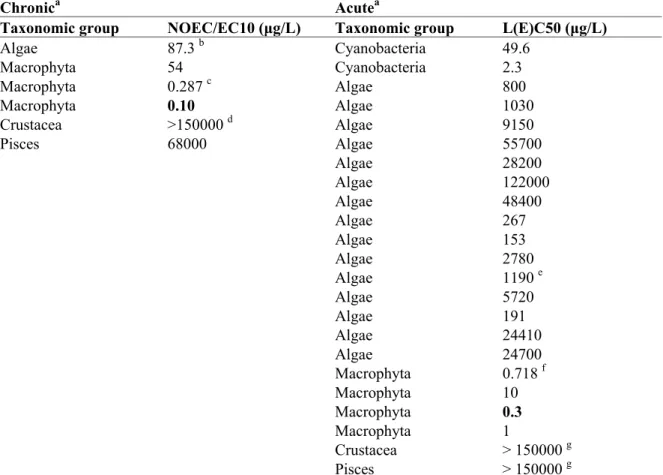
Table 6. Metsulfuron-methyl: selected freshwater toxicity data for ERL derivation.
Chronica Acutea
Taxonomic group NOEC/EC10 (μg/L) Taxonomic group L(E)C50 (μg/L)
Algae 87.3 b Cyanobacteria 49.6 Macrophyta 54 Cyanobacteria 2.3 Macrophyta 0.287 c Algae 800 Macrophyta 0.10 Algae 1030 Crustacea >150000 d Algae 9150 Pisces 68000 Algae 55700 Algae 28200 Algae 122000 Algae 48400 Algae 267 Algae 153 Algae 2780 Algae 1190 e Algae 5720 Algae 191 Algae 24410 Algae 24700 Macrophyta 0.718 f Macrophyta 10 Macrophyta 0.3 Macrophyta 1 Crustacea > 150000 g Pisces > 150000 g
a For detailed information see Appendix 2. Bold values are used for ERL derivation.
b Geometric mean of 0.29, 0.50, 0.04 and 0.01 mg/L for Pseudokirchneriella subcapitata (growth rate).
c Geometric mean of 0.00037, 0.00011, 0.00030, 0.0015, 0.00019 and 0.00016 mg/L for Lemna
minor (growth rate).
d This value completes the base set but is not used for further calculations.
e Geometric mean of 2.9, 0.85 and 0.68 mg/L for Pseudokirchneriella subcapitata (growth rate). f Geometric mean of chronic EC50 values: 0.00079, 0.0004, 0.00031, 0.00088, 0.0048, 0.00043,
0.0011 and 0.00036 mg/L for Lemna minor (growth rate).
g These figures show the absence of toxicity to Crustacea (Daphnia) and fish, but are not used for further calculations.
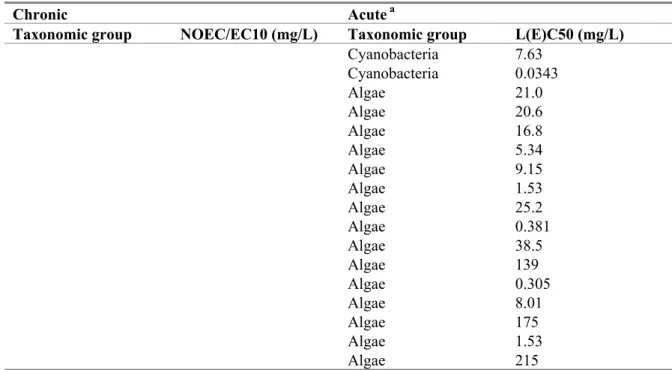
Table 7. Metsulfuron-methyl: selected marine toxicity data for ERL derivation.
Chronic Acute a
Taxonomic group NOEC/EC10 (mg/L) Taxonomic group L(E)C50 (mg/L)
Cyanobacteria 7.63 Cyanobacteria 0.0343 Algae 21.0 Algae 20.6 Algae 16.8 Algae 5.34 Algae 9.15 Algae 1.53 Algae 25.2 Algae 0.381 Algae 38.5 Algae 139 Algae 0.305 Algae 8.01 Algae 175 Algae 1.53 Algae 215
a For detailed information see Appendix 2.
3.3.1.1 Treatment of fresh- and saltwater toxicity data
ERLs for freshwater and marine waters should be derived separately. For pesticides, data can only be combined if it is possible to determine with high probability that marine organisms are not more sensitive than freshwater organisms (Lepper, 2005). For metsulfuron-methyl, such a comparison cannot be made and datasets are kept separated.
3.3.1.2 Mesocosm and field studies
Studies have been carried out with enclosures in natural and artificial water bodies. Details are given in Appendix 3. In one study actual concentrations during the exposure period not were determined. This makes the study not sufficiently reliable for MPC derivation. It should be remarked, however that distinct effects on Macrophyta were present already in the lowest tested concentration (1 μg/L). In a second study no Macrophyta were included. At the lowest concentration tested (10 μg/L) distinct effects were observed on Cyanophyta. The NOEC was < 10 μg/L. The study could therefore not be used for the derivation of ERLs.
3.3.1.3 Derivation of MPCeco, water and MPCeco, marine
The base set for freshwater organisms is complete. Chronic NOEC values are available for three trophic levels (fish, Daphnia, algae and Macrophyta). Therefore, the assessment factor is 10. The lowest available NOEC is that obtained with Elodea nuttallii: 0.10 μg/L. The MPCeco, water is derived as 0.10/10 = 0.01 μg/L.
Because the basis set for marine organisms is not complete the MPCeco, marine cannot be derived.
3.3.2
MPC
sp, waterand MPC
sp, marine3.3.3
MPC
hh food, waterDerivation of MPChh food, water for metsulfuron-methyl is not required (Table 5).
3.3.4
MPC
dw, waterThe Drinking Water Standard is 0.1 µg/L. Thus, the MPCdw, water is 0.1 µg/L.
3.3.5
Selection of the MPC
waterand MPC
marineThe lowest value of the routes included is the MPCeco, water. Therefore, the MPCwater is 0.010 μg/L. The MPCmarine cannot be derived.
3.3.6
MAC
eco 3.3.6.1 MACeco, waterThe MACeco, water is derived from the acute toxicity data. Since short-term values for three trophic levels (fish, Daphnia, Macrophyta and algae) are available and because:
• there is no potential to bioaccumulate, • the mode of action is known and specific and
• the potentially most sensitive species group (Macrophyta) is included in the data set,
an assessment factor of 10 is applied to the lowest EC50 of 0.3 μg/L (Elodea nutallii). Therefore, the MACeco is derived as 0.3 /10 = 0.03 μg/L.
3.3.6.2 MACeco, marine
Because not sufficient data on marine organisms are available (the marine base set is not complete) the
MACeco, marine cannot be derived.
3.3.7
SRC
eco, waterSince more than three long-term NOECs of all required trophic levels are available, the SRCeco, water is derived from the geometric mean of all available NOECs with an assessment factor 1. The geometric mean is 24.7 μg/L. Therefore, the SRCeco, water is derived as 24.7/1 = 24.7 μg/L.
3.4
Toxicity data and derivation of ERLs for sediment
The log Kp, susp-water of metsulfuron-methyl is below the trigger value of 3, therefore ERLs are not derived for sediment.
4
Conclusions
In this report, the risk limits Maximum Permissible Concentration (MPC), Maximum Acceptable Concentration for ecosystems (MACeco), and Serious Risk Concentration for ecosystems (SRCeco) are derived for metsulfuron-methyl in water. No risk limits were derived for the marine compartment because not enough data were available. Derivation of ERLs for sediment is not triggered.
The ERLs that were obtained are summarised in the table below. The MPC value that was set for this compound until now, is also presented in this table for comparison reasons. It should be noted that this is an indicative MPC (‘ad-hoc MTR’), derived using a different methodology and based on limited data.
Table 8. Derived MPC, MACeco, and SRC values for metsulfuron-methyl.
ERL Unit MPC MACeco SRC
Water, olda µg/L 0.00036 - -
Water, newb µg/L 0.010 0.03 24.7
Drinking waterb µg/L 0.1d - -
Marine µg/L n.d.c n.d.c -
a indicative MPC (‘ad-hoc MTR’), source: Helpdesk Water
http://www.helpdeskwater.nl/emissiebeheer/normen_voor_het/zoeksysteem_normen/
b The MPC
dw, water is reported as a separate value from the other MPCwater values (MPCeco, water, MPCsp, water or
MPChh food, water). From these other MPC water values (thus excluding the MPCdw, water) the lowest one is selected as
the ‘overall’ MPCwater.
c n.d. = not derived due to lack of data
d provisional value pending the decision on implementation of the MPC
References
EC. 2000. European Commission working document Metsulfuron-methyl. 7593/VI/97-final. Appendix I-II.
EC. 2003. Technical Guidance Document in support of Commission Directive 93/67/EEC on risk assessment of new notified substances, Commission Regulation (EC) no. 1488/94 on Risk Assessment for existing substances and Directive 98/9/EC of the European Parliament and of the Council concerning the placing of biocidal products on the market. Ispra, Italy: European Chemicals Bureau, Institute for Health and Consumer Protection. Report no. EUR 20418 EN/2. European Commission.1997. Draft Assessment Report (DAR) for Metsulfuron-methyl. Member State
Rapporteur France.
Lepper P. 2005. Manual on the methodological framework to derive environmental quality standards for priority substances in accordance with Article 15 of the Water Framework Directive
(2000/60/EC). Smallenberg, Germany: Fraunhofer-Institute Molecular Biology and Applied Biology. 47 pp.
MNP. 2006. Tussenevaluatie van de nota Duurzame gewasbescherming. Bilthoven, The Netherlands: Milieu- en Natuurplanbureau. MNP-publicatienummer: 500126001.
Tomlin CDS. 2002. e-Pesticide Manual 2002-2003 (Twelfth edition) Version 2.2. British Crop Protection Council.
U.S. EPA. 2007. EPI SuiteTM [computer program]. Version 3.2. Washington, DC, U.S.A: U.S. Environmental Protection Agency (EPA), Office of Pollution Prevention Toxics and Syracuse Research Company (SRC).
Van Vlaardingen PLA and Verbruggen EJM. 2007. Guidance for the derivation of environmental risk limits within the framework of “International and national environmental quality standards for substances in the Netherlands”. RIVM Report 601782001/2007.
Veith GD, Defoe DL and Bergstedt BV. 1979. Measuring and estimating the bioconcentration of chemicals in fish. J. Fish. Res. Board Can. 36: 1040-1048.
RIVM Letter R eport 601716020 Specie s properti es Tes t su bs ta nc e Substan ce purity (%) Analy sed Tes t ty pe Tes t wa te r pH Hardness/ Salinity [mg/L ] Ex p. tim e [d] Temp. [°C ] Ex p. con cn. BCF [L/kg w. w .] BCF type Method Validity Ref erenc e s 2-3 g , 4 -5 cm [14C- pheny l]metsul furon -met hy l > 98 Y F nw 7.2- 7.7 102 28+14 d 23 ±1 10 μg/ L < 1 Muscle Equili- brium 2 DAR, Han and Anderso n, 1982 s 2-3 g , 4 -5 cm [14C- pheny l]metsul furon -met hy l > 98 Y F nw 7.2- 7.7 102 28+14 d 23 ±1 1118 μ g/ L < 1 Muscle Equili- brium 2 DAR, Han and Anderso n, 1982
RIVM Letter R eport 601716020 1. A cut e t ox ici ty o f m etsulfuron-m ethy l to fres hw ater orga ni sm s. s A Test Test Purity Test pH T Ha rdness E xp . Criterion T est Value Ri Notes R eferen ce properti es ty pe compound w ater CaCO 3 time endpoint [%] [°C ] [m g/L ] [m g/L ] -aqu ae 10 ng ch lorophy ll-a/mL N S Ally 20 am 7 20 EC50 biomass < 0.00 038 2 5 Ny ström e t al., 199 9 -aq u ae Y S a.i. am 120 h EC50 0. 0954 4 DAR, Ev aluation T able, 1999 ridu m 10 ng ch lorophy ll-a/mL N S Ally 20 am 7 20 EC50 biomass 0.0496 2 5 Ny ström e t al., 199 9 s leo poliensi s 10 ng ch lorophy ll-a/mL N S Ally 20 am 7 20 EC50 biomass 0.0023 2 5 Ny ström e t al., 199 9 10 ng ch lorophy ll-a/mL N S Ally 20 am 7 20 EC50 biomass 0.8 2 5 Ny ström e t al., 199 9 rmis 10 ng ch lorophy ll-a/mL N S Ally 20 am 7 20 EC50 biomass > 0.38 2 5 Ny ström e t al., 199 9 s d yso sm o s 10 ng ch lorophy ll-a/mL N S Ally 20 am 7 20 EC50 biomass 1.03 2 5 Ny ström e t al., 199 9 s re inhardtii 10 ng ch lorophy ll-a/mL N S Ally 20 am 7 20 EC50 biomass 9.15 2 5 Ny ström e t al., 199 9 sonii 10 ng ch lorophy ll-a/mL N S Ally 20 am 7 20 EC50 biomass 55.7 2 5 Ny ström e t al., 199 9 ido s a 4 x 10 5 cell s/mL N S a.i. 90 am 25 96 h EC50 Biomass 14.22 3 9 Ma, 200 2 ido s a 3 x 10 5 ce lls/mL N S a.i. >95 am 20 96 h EC50 Biomass 0.62 3 9 W ei et al ., 1998 re no id if e ra 10 ng ch lorophy ll-a/mL N S Ally 20 am 7 20 EC50 biomass 28.2 2 5 Ny ström e t al., 199 9 ti ca 10 ng ch lorophy ll-a/mL N S Ally 20 am 7 20 EC50 biomass 122 2 5 Ny ström e t al., 199 9 10 ng ch lorophy ll-a/mL N S Ally 20 am 7 20 EC50 biomass 48.4 2 5 Ny ström e t al., 199 9 ntor tum 10 ng ch lorophy ll-a/mL N S Ally 20 am 7 20 EC50 biomass 0.267 2 5 Ny ström e t al., 199 9 sillum 10 ng ch lorophy ll-a/mL N S Ally 20 am 7 20 EC50 biomass 0.153 2 5 Ny ström e t al., 199 9 . 10 ng ch lorophy ll-a/mL N S Ally 20 am 7 20 EC50 biomass 2.78 2 5 Ny ström e t al., 199 9 e lla sub c api ta ta 1.2 x 10 5 cell s/mL N S a.i. 99.2 am 24 72 h EC50 biom ass 3.5 2 8, 1 1 DAR, Dougla s and Handley , 1988a e lla sub c api ta ta 1.2 x 10 5 cell s/mL N S a.i. 99.2 am 24 72 h EC50 Grow th rate 2.9 2 8 DAR, Dougla s and Handley , 1988a e lla sub c api ta ta 3.3 x 10 3 cells/mL N S a.i. 99 am 24 ±1 72 h NOEC Grow th rate 0.01 2 DAR, Frobi s ( no d at e) e lla sub c api ta ta 3.3 x 10 3 cells/mL N S a.i. 99 am 24 ±1 72 h EC50 Grow th rate > 0.04 5 2 DAR, Frobi s ( no d at e) e lla sub c api ta ta 10 4 cell s/mL N S a.i. 98.5 am 48 h EC50 Grow th rate 0.85 2 Cedergreen et al ., 2007 e lla sub c api ta ta 10 4 cell s/mL N S a.i. 98.5 am 8 22 48 h EC50 Grow th rate 0.68 2
Cedergreen and Streibig,
2005 e lla sub c api ta ta 10 4 cell s/mL N S a.i. 98.5 am 8 22 48 h EC10 Grow th rate 0.29 2
Cedergreen and Streibig,
2005 e lla sub c api ta ta 2 x 10 4 cell s/mL N S a.i. am 25 96 h EC50 Bi omass 0.19 2 4, 1 1 Fairchild et al ., 199 7 e lla sub c api ta ta 2 x 10 4 cell s/mL N S a.i. am 25 96 h NOEC Biomass < 0.01 9 2 4 Fairchild et al ., 199 7 e lla sub c api ta ta 10 ng ch lorophy ll-a/mL N S a.i. am 6 d NOEC biomass 0.04 3 6 Ny ström a nd B lanck, 1998 e lla sub c api ta ta 10 ng ch lorophy ll-a/mL N S a.i. am 6 d EC50 biomass 1.56 3 6 Ny ström a nd B lanck, 1998 e lla sub c api ta ta 10 ng ch lorophy ll-a/mL N S Ally 20 am 7 20 EC50 biomass 4.96 2 5, 1 1 Ny ström e t al., 199 9 bca p itata 5 x 10 4 ce lls/mL TC product 90 am 25 96 h EC 50 Cell bioma ss 24.7 2 Ma et al ., 2006 ngi seta 10 ng ch lorophy ll-a/mL N S Ally 20 am 7 20 EC50 biomass < 0.38 2 5 Ny ström e t al., 199 9 o b liq uus 4 x 10 5 cell s/mL N S a.i. 90 am 25 96 h EC50 Biomass 72.9 3 9 Ma, 200 2 o b tu siu scul u s 10 ng ch lorophy ll-a/mL N S Ally 20 am 7 20 EC50 biomass 5.72 2 5 Ny ström e t al., 199 9 va cu olatu s 10 6 cell s/mL N S a.i. >99 am 6.7 28 24 h EC50 Biomass 1.2 3 1 Fahl et al ., 1995 va cu olatu s 10 6 cell s/mL N S a.i. >99 am 6.7 28 24 h EC 50 Grow th rate 0.85 3 1 Fahl et al ., 1995 acil e 10 ng ch lorophy ll-a/mL N S Ally 20 am 7 20 EC50 biomass 0.191 2 5 Ny ström e t al., 199 9 anthu s 10 ng ch lorophy ll-a/mL N S Ally 20 am 7 20 EC50 biomass 24.41 2 5 Ny ström e t al., 199 9 < 48 h old N S a.i. 92.9 7.4-7. 9 20.2 160 48 h LC50 Mortali ty > 150 1 7 DAR, Philli ps, 1982 a < 48 h old Y S Ally 20 DF 20 nw 7.2-7 .6 20.2-20 .5 77 48 h EC50 Immobility > 200 2 DAR, Hutton , 1 989 hop hyllum Collected from w ild Y F a.i. am 8.5 15-18 14 d EC50 Grow th rate (bi oma ss) > 0.1 2 Cedergreen et al ., 2004 hop hyllum Collected from w ild Y F a.i. am 8.5 15-18 14 d EC50 Reducti on o f Speci fic Lea f Area 0.00007 3 3 Cedergreen et al ., 2004 hop hyllum Collected from w ild Y F a.i. am 8.5 15-18 14 d EC50 Grow th rate (bi oma ss) > 0.1 2 Cedergreen et al ., 2004
R eport 601716020 21 s A Test Test Purity Test pH T Ha rdness E xp . Criterion T est Value Ri Notes R eferen ce properti es ty pe compound w ater CaCO 3 time endpoint [%] [°C ] [m g/L ] [m g/L ] tri c hop hyllum Collected from w ild Y F a.i. am 8.5 15-18 14 d EC50 Reducti on o f Speci fic Lea f Area 0.00007 3 3 Cedergreen et al ., 2004 ta Collected from w ild Y F a.i. am 8.5 15-18 14 d EC50 Grow th rate (bi oma ss) > 0.1 2 Cedergreen et al ., 2004 ta Collected from w ild Y F a.i. am 8.5 15-18 14 d EC50 Reducti on o f Speci fic Lea f Area 0.0039 3 3 Cedergreen et al ., 2004 a Collected from w ild Y F a.i. am 8.5 15-18 14 d EC50 Grow th rate (bi oma ss) > 0.1 2 Cedergreen et al ., 2004 Collected from w ild Y F a.i. am 8.5 15-18 14 d EC50 Grow th rate (bi oma ss) > 0.1 2 Cedergreen et al ., 2004 Collected from w ild Y F a.i. am 8.5 15-18 14 d EC50 Reducti on o f Speci fic Lea f Area 0.0002 3 3 Cedergreen et al ., 2004 m ersum Collected from w ild Y F a.i. am 8.5 15-18 14 d EC50 Grow th rate (bi oma ss) > 0.1 2 Cedergreen et al ., 2004 m ersum Collected from w ild Y F a.i. am 8.5 15-18 14 d EC50 Reducti on o f Speci fic Lea f Area 0.0022 3 3 Cedergreen et al ., 2004 ensi s Collected from w ild Y F a.i. am 8.5 15-18 14 d EC50 Grow th rate (bi oma ss) > 0.1 2 Cedergreen et al ., 2004 ensi s Collected from w ild Y F a.i. am 8.5 15-18 14 d EC50 Reducti on o f Speci fic Lea f Area 0.00057 3 3 Cedergreen et al ., 2004 ii Y S a.i. 99 am 9-10.2 22 21 d EC50 Tota l le ngth o f sho ots 0.0003 2 12 Dorsman, 2007 N S a.i. 98.5 am 5 24 7 d EC10 Grow th rate 0.00037 2
Cedergreen and Streibig,
2005 N S a.i. 98.5 am 5 24 7 d EC50 Grow th rate 0.00079 2
Cedergreen and Streibig,
2005 N S a.i. 98.5 am 5 24 7 d EC50 Grow th rate 0.0004 2 Cedergreen et al ., 2005 N S a.i. tg am 24 7 d EC50 Grow th rate 0.00031 2 Cedergreen et al ., 2005 N S a.i. tg am 24 7 d EC10 Grow th rate 0.00011 2 Cedergreen et al ., 2005 N S a.i. tg am 24 7 d EC50 Grow th rate 0.00088 2 Cedergreen et al ., 2005 N S a.i. tg am 24 7 d EC10 Grow th rate 0.0003 2 Cedergreen et al ., 2005 N S a.i. tg am 24 7 d EC50 Grow th rate 0.0048 2 Cedergreen et al ., 2005 N S a.i. tg am 24 7 d EC10 Grow th rate 0.0015 2 Cedergreen et al ., 2005 N S a.i. tg am 24 7 d EC50 Grow th rate 0.00043 2 Cedergreen et al ., 2005 N S a.i. tg am 24 7 d EC10 Grow th rate 0.00019 2 Cedergreen et al ., 2005 Y F a.i. am 24 14 d EC50 Grow th rate (bi oma ss) 0.0008 3 2 Cedergreen et al ., 2004 Y F a.i. am 24 14 d EC50 Grow th rate (bi oma ss) 0.0011 2 Cedergreen et al ., 2004 Y F a.i. am 24 14 d EC50 Reducti on o f Speci fic Lea f Area 0.00018 3 3 Cedergreen et al ., 2004 Y F a.i. am 24 14 d EC50 Reducti on o f Speci fic Lea f Area 0.0001 3 3 Cedergreen et al ., 2004 N a.i. am 25 4 d EC50 Biomass ( # frond s) 0.0004 3 10 Fairchild et al ., 199 7 N a.i. am 25 4 d NOEC Biomass ( # frond s) < 0.00 02 3 10 Fairchild et al ., 199 7 2-3 frond s p er pl ant N R a.i. 99.2 am 5 21 ±1 14 d EC50 Grow th 0.00036 2 DAR, Dougla s and Handley , 1988b 2-3 frond s p er pl ant N R a.i. 99.2 am 5 21 ±1 14 d NOEC Grow th 0.00016 2 DAR, Dougla s and Handley , 1988b lca Collected from w ild Y F a.i. am 8.5 15-18 14 d EC50 Grow th rate (bi oma ss) 0.01 2 Cedergreen et al ., 2004 lca Collected from w ild Y F a.i. am 8.5 15-18 14 d EC50 Reducti on o f Speci fic Lea f Area 0.00062 3 3 Cedergreen et al ., 2004 c a tum Collected from w ild Y F a.i. am 8.5 15-18 14 d EC50 Grow th rate (bi oma ss) > 1 2 Cedergreen et al ., 2004 c a tum Collected from w ild Y F a.i. am 8.5 15-18 14 d EC50 Reducti on o f Speci fic Lea f Area 0.00029 3 3 Cedergreen et al ., 2004 cri p u s Collected from w ild Y F a.i. am 8.5 15-18 14 d EC50 Grow th rate (bi oma ss) > 0.1 2 Cedergreen et al ., 2004 cri p u s Collected from w ild Y F a.i. am 8.5 15-18 14 d EC50 Reducti on o f Speci fic Lea f Area 0.00023 3 3 Cedergreen et al ., 2004 emersum Collected from w ild Y F a.i. am 8.5 15-18 14 d EC50 Grow th rate (bi oma ss) > 0.1 2 Cedergreen et al ., 2004 yrrhi z a Collected from w ild Y F a.i. am 8.5 15-18 14 d EC50 Grow th rate (bi oma ss) > 1 2 Cedergreen et al ., 2004 yrrhi z a Collected from w ild Y F a.i. am 8.5 15-18 14 d EC50 Reducti on o f Speci fic Lea f Area 0.00019 3 3 Cedergreen et al ., 2004 ochi ru s 3.6 cm, av . 0 .87 g N S a.i. 92.9 nw 7.2-7 .6 22.2 114 96 h LC50 Mortali ty > 150 2 7 DAR, Philli ps, 1982 b ochi ru s 3.6 cm, av . 0 .87 g N S a.i. 92.9 nw 7. 2-7 .6 22.2 114 96 h NOEC Subletha l e ffects ≥ 150 2 7 DAR, Philli ps, 1982 b
RIVM Letter R eport 601716020 s A Test Test Purity Test pH T Ha rdness E xp . Criterion T est Value Ri Notes R eferen ce properti es ty pe compound w ater CaCO 3 time endpoint [%] [°C ] [m g/L ] [m g/L ] ru s Av . 3.0 cm , av . 0 .6 6 g Y S Ally 20 DF 20 nw 6.9-7 .5 21. 5-22 .5 77 96 h LC50 Mortali ty > 200 2 DAR, Hutton , 1 988 a m y k iss Av . 2.8 cm , av . 0 .1 7 g N S a.i. 92.9 nw 6.9-7 .5 12.2 110 96 h LC50 Mortali ty > 150 2 7 DAR, Muska , 1982 m y k iss Av . 5.2 cm , av . 2 .1 g Y S Ally 20 DF 20 nw 7.1-7 .4 11.5-11 .9 79 96 h LC50 Mortali ty > 200 2 DAR, Philli ps, 1988 much from OECD 201. No conti nuou s l ight. ev aluation. 50 % e ffect at ca. 0 .1 mg /L . ter i s no t sui table for EC50 d eriv ation sur ed by fluore scen ce. tion p eriod w as n ot repor ted. AUGC = Are a Under the Grow th Curv e. s po orly described and e ssentia l da ta are mi ssin g. ation s w ere no t me asured bu t d ue to the stabil ity of th e te st co mpound the d ata are con sider ed to b e v alid. te w as low er than usu al in the se studie s, but ye t ful filled the v alidation cr iter ion. egre ssi on model . period too shor t. 50 (b iomass) no t ta ken for MPC de riv ation, becau se grow th da ta are av ailable. nted in cl ay . nted in agar .
R eport 601716020 23 2. 2. A cut e t ox ici ty o f m etsulfuron-m ethy l to m arine org anism s. Specie s properti es A Tes t ty pe Tes t compound Purity [% ] Tes t wa te r pH T [°C] Salinity [‰ ] Ex p. tim e Criterion Tes t endpoint Value [m g/ L] Ri Not es Ref erenc e tana 10 ng ch lorophy ll-a/mL N S Ally 20 am 7.0 20 26 EC50 Biomass 7.63 2 1 Ny ström e t al., 199 9 rve y an a 10 ng ch lorophy ll-a/mL N S Ally 20 am 7.0 20 26 EC50 Biomass 0.0343 2 1 Ny ström e t al., 199 9 ter ae 10 ng ch lorophy ll-a/mL N S Ally 20 am 7.0 20 26 EC50 Biomass < 0.00 038 2 1 Ny ström e t al., 199 9 v ali s 10 ng ch lorophy ll-a/mL N S Ally 20 am 7.0 20 26 EC50 Biomass 21.0 2 1 Ny ström e t al., 199 9 a s bal tic a 10 ng ch lorophy ll-a/mL N S Ally 20 am 7.0 20 26 EC50 Biomass 20.6 2 1 Ny ström e t al., 199 9 twellii 10 ng ch lorophy ll-a/mL N S Ally 20 am 7.0 20 26 EC50 Biomass 16.8 2 1 Ny ström e t al., 199 9 tiole cta 10 ng ch lorophy ll-a/mL N S Ally 20 am 7.0 20 26 EC50 Biomass 5.34 2 1 Ny ström e t al., 199 9 xle y i 10 ng ch lorophy ll-a/mL N S Ally 20 am 7.0 20 26 EC50 Biomass 9.15 2 1 Ny ström e t al., 199 9 ana 10 ng ch lorophy ll-a/mL N S Ally 20 am 7.0 20 26 EC50 Biomass 1.53 2 1 Ny ström e t al., 199 9 erii 10 ng ch lorophy ll-a/mL N S Ally 20 am 7.0 20 26 EC50 Biomass 25.2 2 1 Ny ström e t al., 199 9 tricornutum 10 ng ch lorophy ll-a/mL N S Ally 20 am 7.0 20 26 EC50 Biomass > 381 2 1 Ny ström e t al., 199 9 c or diformi s 10 ng ch lorophy ll-a/mL N S Ally 20 am 7.0 20 26 EC50 Biomass 0.381 2 1 Ny ström e t al., 199 9 erug ineum 10 ng ch lorophy ll-a/mL N S Ally 20 am 7.0 20 26 EC50 Biomass 38.5 2 1 Ny ström e t al., 199 9 tum 10 ng ch lorophy ll-a/mL N S Ally 20 am 7.0 20 26 EC50 Biomass 139 2 1 Ny ström e t al., 199 9 mini mum 10 ng ch lorophy ll-a/mL N S Ally 20 am 7.0 20 26 EC50 Biomass 0.305 2 1 Ny ström e t al., 199 9 10 ng ch lorophy ll-a/mL N S Ally 20 am 7.0 20 26 EC50 Biomass > 381 2 1 Ny ström e t al., 199 9 s 10 ng ch lorophy ll-a/mL N S Ally 20 am 7.0 20 26 EC50 Biomass 8.01 2 1 Ny ström e t al., 199 9 co sta tum 10 ng ch lorophy ll-a/mL N S Ally 20 am 7.0 20 26 EC50 Biomass 175 2 1 Ny ström e t al., 199 9 co sta tum Y S a.i. am 120 h EC50 0.0936 4 DAR, Ev aluation Table 10 ng ch lorophy ll-a/mL N S Ally 20 am 7.0 20 26 EC50 Biomass 1.53 2 1 Ny ström e t al., 199 9 ra p s eu donana 10 ng ch lorophy ll-a/mL N S Ally 20 am 7.0 20 26 EC50 Biomass 215 2 1 Ny ström e t al., 199 9 tion p eriod w as n ot repor ted.
RIVM Letter R eport 601716020 3. C hron ic to xic it y of m etsulfur on-m ethy l to f reshw ater org anism s. Specie s properti es A Tes t ty pe Tes t compound Purity [%] Tes t wa te r pH T [°C ] Hardness CaCO3 [mg /L] Ex p. tim e Criterion Tes t endpoint Value [mg/L ] Ri Not es Ref erenc e e lla sub c api ta ta 10 4 cell s/mL N S A.i. 98.5 am 8 22 48 h EC10 Grow th rate 0.29 2 Cedergreen and Streibig, 2005 e lla sub c api ta ta 2 x 10 4 cell s/mL N S A.i. am 25 96 h NOEC Biomass < 0.01 9 2 2 Fairchild et al ., 199 7 lla sub c apitata 1.2 x 10 5 cell s/mL N S A.i. 99.2 am 24 120 h NOEC Grow th rate 0.50 2 3 DAR, Dougla s and Handley , 1988a e lla sub c api ta ta 10 ng ch lorophy ll-a/mL N S A.i. am 6 d NOEC Grow th rate 0.04 2 2 Ny ström a nd B lanck, 1998 lla sub c apitata 3.3 x 10 3 cells/mL N S A.i. 99 am 24 ±1 120 h NOEC Grow th rate 0.01 2 DAR, Frobi s ( no d at e) s Collected from w ild, 19.5 cm lon g shoo ts Y S A.i. ag nw 22 8 d NOEC Shoot leng th 0.054 2 1 W end t-Ra sch e t al ., 20 03 Y S A.i. 99 am 9-10.2 22 21 d NOEC Total le ngth of shoo ts 0.00010 2 5 Dorsman, 2007 N S A.i. 98.5 am 5 24 7 d EC10 Grow th rate 0.00037 2 Cedergreen and Streibig, 2005 N S A.i. tg am 24 7 d EC10 Gr ow th rate 0.00011 2 Cedergreen et al ., 2005 N S A.i. tg am 24 7 d EC10 Gr ow th rate 0.00030 2 Cedergreen et al ., 2005 N S A.i. tg am 24 7 d EC10 Gr ow th rate 0.0015 2 Cedergreen et al ., 2005 N S A.i. tg am 24 7 d EC10 Gr ow th rate 0.00019 2 Cedergreen et al ., 2005 N A.i. am 25 4 d NOEC Biomass (frond count) < 0.00 02 3 4 Fairchild et al ., 199 7 2-3 frond s p er pl ant N R A.i. 99.2 am 5 21 ±1 14 d NOEC Grow th 0.00016 2 DAR, Dougla s and Handley , 1988b N S A.i. 98.5 am 5 24 7 d EC50 Grow th rate 0.00079 2 Cedergreen and Streibig, 2005 N S A.i. 98.5 am 5 24 7 d EC50 Grow th rate 0.0004 2 Cedergreen et al ., 2005 N S A.i. tg am 24 7 d EC50 Gr ow th rate 0.00031 2 Cedergreen et al ., 2005 N S A.i. tg am 24 7 d EC50 Gr ow th rate 0.00088 2 Cedergreen et al ., 2005 N S A.i. tg am 24 7 d EC50 Gr ow th rate 0.0048 2 Cedergreen et al ., 2005 N S A.i. tg am 24 7 d EC50 Gr ow th rate 0.00043 2 Cedergreen et al ., 2005 Y F A.i. am 24 14 d EC50 Grow th rate (biomass) 0.0011 2 Cedergreen et al ., 2004 2-3 frond s p er pl ant N R A.i. 99.2 am 5 21 ±1 14 d EC50 Grow th 0.00036 2 DAR, Dougla s and Handley , 1988b < 24 h old Y R A.i. 98.8 nw 7.1-7. 7 19.9 78 21 d NOEC Reproduction ≥ 150 1 DAR, Hutton , 1 989 m y k iss Av . 4.7 cm , av . 2 .5 2 g Y F A.i. 98.8 nw 7.4-8 .7 10. 9-12 .8 72 21 d NOEC Length 68 2 DAR, Hutton , 1 988 b m y k iss Av . 4.7 cm , av . 2 .5 2 g Y F A.i. 98.8 nw 7.4-8 .7 10.9-12 .8 72 21 d LC50 Mortali ty > 150 1 DAR, Hutton , 1 988 b shoo ts pl ante d in pla stic j ars w ith se dim ent a nd pla ced in 9 L aq uaria. 5 Plan ts plan ted in clay sur ed by fluore scen ce. 4 Ex posure period too short. te w as low er than usu al in the se studie s, but ye t ful filled the v alidation cr iter io n
Appendix 3. Enclosure studies
Wendt-Rasch et al., 2003
Species/
Population/ Community
Test method Test substance Anal. Exposure regime T
[ºC] Macrophytes Phytoplankton Zooplankton Periphytic algae 80 L enclosures in artificial pond with natural lake sediment, open to air, precipitation and sunlight
Metsulfuron-methyl, anal. grade
N Single application,
acetone solution mixed through water
Not reported
pH Exp. time Criterion Test endpoint Value
[µg/L]
GLP Validity
8.5 14 d NOEC Macrophyte root
formation
< 1 N 3
Description
Twenty-four plastic enclosures (height 0.65 m, diam. 0.4 m) were placed in an artificial lake in Sweden. The time of the year was not reported.
Each system enclosed a portion of sediment (natural lake sediment mixed with fine gravel) and 80 L of water. The systems were open to air, precipitation and sunlight. The sediment was macrophyte-free before the experiment started. In each enclosure, 200 g (fresh weight) shoots of Elodea Canadensis from a nearby stream were introduced. Metsulfuron-methyl was dissolved in acetone (< 0.009%) and added to the enclosures. Nominal concentrations were: 0, 1, 5 and 20 μg metsulfuron-methyl/L. In some enclosures cypermethrin was also added, but the results of these enclosures are not reported here. The number of replicates per concentration was 3.
Four apical shoots of Myriophyllum spicatum and five apical shoots of E. canadensis were planted in plastic jars containing natural sediment from a nearby lake. In each enclosure, four jars with M.
spicatum and five jars with E. canadensis were placed 40 cm below the water surface at the beginning
of the experiment. At the end of the experiment (day 14), the plants were harvested, the occurrence of roots noted and the dry weight of the shoots determined.
Further parameters investigated were: phytoplankton community (species composition, chlorophyll-a), zooplankton community (rotatoria and nauplii), periphytic algae (species and chlorophyll-a) and physicochemical parameters: pH, conductivity, total N and P.
No macrofauna was included, but macrofauna is known to be insensitive for metsulfuron-methyl. Results were analysed by multivariate analysis.
Results
No influence of metsulfuron-methyl on phytoplankton species and total chlorophyll-a was found. After 14 days the chlorophyll-a content of periphytic algae was enhanced in comparison with the control in all three test item concentrations. A distinct effect was found in the 5 and 20 μg/L enclosures. The species Tetraspora sp. and Apiocysitis sp. decreased in number by exposure to metsulfuron-methyl. There was no effect on zooplankton.
Effects on macrophytes were most distinct. No significant difference in the dry weight of either M.
spicatum or E. canadensis was found between the control and the metsulfuron-methyl exposed plants.
However, no roots were found on the M. spicatum plants in any of the exposed enclosures, while all the plants in the control enclosures had developed roots. Similarly, none of the E. canadensis plants exposed to 5 or 20 μg/L had developed any roots. In the enclosures exposed to 1 μg/L 43% of the plants had developed a few short roots (</3 cm), while the rest of the plants in these enclosures lacked roots at the time of harvesting. All E. canadensis plants not exposed to the herbicide had developed long roots.
pH had increased after 10 days in all concentrations.
Conclusion
Because in the 1 μg/L enclosures serious effects on macrophytes were found the NOEC is < 1 μg metsulfuron-methyl/L.
Since no actual concentrations were measured during the experiment the reliability is low (validity code 3).
Thompson et al., 1993a, 1993b
Species/ Population/ Community
Phytoplankton, Zooplankton
Test method 90 m3 enclosures including sediment, in
mesotrophic boreal lentic lake
Test substance Escort, 60% DF formulation of
metsulfuron-methyl
Analysis Y
Exposure regime Single application, sprayed on the surface
T [ºC] 22
pH 6.7-7.3
Expose time 77 d
Criterion NOEC
Test endpoint Cyanophyta
Value [µg/L] < 10
GLP N
Validity 2-3
Description
Fifteen plastic enclosures (4.2 x 4.9 m, average depth to sediment 4.3 m) were placed in a mesotrophic, boreal lentic lake in Canada. The start of the experiment was August 1, 1989.
Each system enclosed a portion of bottom sediment and ca. 90,000 L of water. The systems were open to air, precipitation and sunlight. The pH was 6.7-7.3, DO 7.2-8 mg/L and conductivity 0.03 mS/cm. A parallel experiment with hexazinone was also performed, but is not reported here.
Metsulfuron-methyl was applied by spraying Escort, 60% DF formulation of metsulfuron-methyl on the enclosure surface. Nominal concentrations were: 0, 0.01, 0.1, 0.5 and 1.0 mg metsulfuron-methyl/L. The number of replicates per concentration was 3.
Concentrations of metsulfuron-methyl were quantified throughout the study by GLC.
The following parameters were investigated: phytoplankton (species and total counts) and zooplankton (Rotifera, Cladocera, Nauplii and other Copepoda). No macrofauna was included, but macrofauna is known to be insensitive for metsulfuron-methyl.
The following chemical parameters were measured: DO, pH, temperature, conductivity. Analysis of the results included linear and non-linear correlation of effects with concentration.
Results
Analysis showed that the concentration of metsulfuron-methyl at the 1.0 mg/L level decreased with a
DT50 > 84 d, whereas at the 0.01 mg/L level the DT50 was 29 d.
Phytoplankton biomass was inhibited by metsulfuron-methyl. Non-linear correlation analysis showed that the log inhibition of Cyanophyta could be correlated with the concentration of metsulfuron-methyl (r2 = 0.99). An EC50 of 0.002 mg/L was calculated. Other groups of phytoplankton did not correlate well with the concentration of metsulfuron-methyl.
Dissolved Oxygen was reduced maximally 23% after 50 days at 0.5 mg/L. Lower concentrations showed lower reductions. However, at 1.0 mg/L a 5% stimulation after 50 days was observed. These results were statistically not significant.
Conclusion
Metsulfuron-methyl decreased strongly the number of Cyanophyta in lake enclosures in Canada. The NOEC was < 0.01 mg/L. The EC50 value calculated for the dose-response relationship for Cyanophyta was 0.002 mg/L, therefore the NOEC is most likely < 0.002 mg/L.
The study was not carried out under GLP and no raw data were given. Macrophyta, known to be most sensitive for metsulfuron methyl, were not included in the study. Therefore, a validity code 2-3 is assigned to the study.
Appendix 4. References used in the appendices
Cedergreen N, Streibig JC. 2005. The toxicity of herbicides to non-target aquatic plants and algae: assessment of predictive factors and hazard. Pest Management Sci. 61: 1152-1160.
Cedergreen N, Andersen L, Olesen CF, Spliid HH, Streibig JC. 2005. Does the effect of herbicide pulse exposure on aquatic plants depend on Kow or mode of action? Aquatic Toxicology 71: 261-271. Cedergreen N, Hudsk P, Mathiassen SK, Streibig JC. 2007. Combination effects of herbicides on plants
and algae: do species and test systems matter? Pest Management Sci. 63: 282-295.
Cedergreen N, Streibig JC, Spliid NH. 2004. Sensitivity of aquatic plants to the herbicide metsulfuron-methyl. Ecotox. Environ. Safety 57: 153-161.
DAR = EC. 2000. European Commission working document Metsulfuron-methyl. 7593/VI/97-final. Appendix I-II.
Dorsman E. (2007). Effects of the herbicide metsulfuron-methyl on aquatic macrophytes. Final thesis, report no. 014/2007. Wageningen University and Research Centre, Alterra.
European Commission.1997. Draft Assessment Report (DAR) for Metsulfuron-methyl. Member State Rapporteur France.
Fahl GM, Kreft L, Altenburger R, Faust M, Boedeker W. Grimme LH. 1995. pH-Dependent sorption, bioconcentration and algal toxicity of sulfonylurea herbicides. Aquat.Toxicol. 31: 175-187. Fairchild JF, Ruessler DS, Haverland PS, Carlson AR. 1997. Comparative sensitivity of Selenastrum
capricornutum and Lemna minor to sixteen herbicides. Arch. Environ. Contam. Toxicol. 32:
353-357.
Ma J, Wang S, Wang P, Ma L, Chen X, Xu R. 2006. Toxicity assessment of 40 herbicides to the green alga Raphidocelis subcapitata. Ecotoxicol. Environm. Safety 63: 456-462.
Ma J. 2002. Differential sensitivity to 30 herbicides among populations of two green algae
Scenedesmus obliquus and Chlorella pyrenoidosa. Bull. Environ. Contam. Toxicol. 68: 275-281.
Nyström B, Björnsäter B, Blanck H. 1999. Effects of sulfonylurea herbicides on non-target aquatic micro-organisms. Growth inhibition of micro-algae and short-term inhibition of adenine and thymidine incorporation in periphyton communities. Aquatic Toxicol. 47: 9-22.
Nyström B, Blanck H. 1998. Effects of the sulfonylurea herbicide metsulfuron methyl on growth and macromolecular synthesis in the green alga Selenastrum capricornutum. Aquat.Toxicol. 43: 25-39. Thompson DG, Holmes SB, Thomas D, MacDonald L, Solomon KR. 1993a. Impact of hexazinone and metsulfuron methyl on the phytoplankton community of a mixed-wood/boreal forest lake. Environ. Toxicol. Chem. 12: 1695-1707.
Thompson DG, Holmes SB, Wainio KK, MacDonald L, Solomon KR. 1993b. Impact of hexazinone and metsulfuron methyl on the zooplankton community of a boreal forest lake. Environ. Toxicol. Chem. 12:1709-17. 0730-7268.
Wei L, Yu H, Sun Y, Fen J, Wang L. 1998. The effects of three sulfonylurea herbicides and their degradation products on the green algae Chlorella pyrenoidosa. Chemosphere 37: 747-751. Wendt-Rasch L, Pirzadeh P, Woin P. 2003. Effects of metsulfuron methyl and cypermethrin exposure
RIVM
National Institute for Public Health and the Environment P.O. Box 1