Trend analysis of harmful gases in shipping containers
(summary)
By order of VROM Inspectorate, Region South-West, Mr. W. Veldman
CC
Author(s) G.M. de Groot
Report version 2
Status report Definitive
Date May 2, 2007
Report number 20070190 IMD gmdg
Number of pages 7
IMD request number 2834
Project number M/609321/01/GA
Approval
Ir. E. Schols
RIVM letter report 20070151 IMD Trend analysis of harmful gases in shipping containers
3
Summary
Background
Every year hundreds of thousands of containers containing high levels of fumigants and other harmful components (e.g. the solvent benzene) at the time of arrival are imported through the Dutch ports. The presence of these containers forms a risk for workers at the port (e.g. those unloading containers) and the environment. The Dutch Inspectorate for VROM (Housing, Spatial Planning and the Environment) has inspected imported containers on a regular basis for a number of years by taking samples of the container air and analysing them for concentrations of fumigants and other harmful gases. This report documents the trend analysis of the RIVM, as ordered by the VROM Inspectorate, to determine trends of fumigants and other harmful gases in almost 300 air samples of containers for the 2003-2006 period. This trend analysis was based on the analysis data collected from 2003 to 2006. The main objective was to look for trends in the frequency, type and the concentrations of fumigants and other harmful gases in the inspected containers. This trend analysis only relates to the inspected containers analyzed by the RIVM. According to the VROM Inspectorate the selection method to inspect containers has not changed over the years.
Fumigants
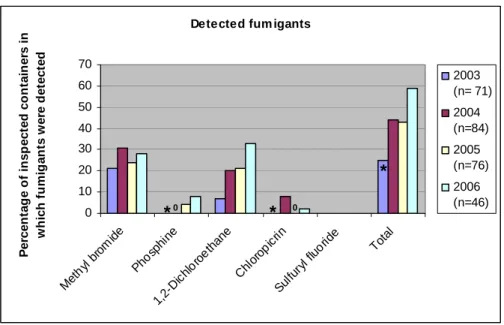
The percentage of inspected containers with fumigants shows a rising trend (see Figure 1). (Please note that in 2003 phosphine and chloropicrin were not analysed, which may cause an underestimation of the total score.)
Detected fum igants
0 10 20 30 40 50 60 70 Me thyl brom ide Phos phi ne 1, 2-Dic hlor oethane Ch loro picr in Sul furyl fluo ride Total P e rcen ta g e o f i n sp ect ed co n tain e rs i n w h ich f u m ig a n ts w e re d e tect ed 2003 (n= 71) 2004 (n=84) 2005 (n=76) 2006 (n=46)
Figure 1: Percentage of inspected containers in which fumigants were detected. *NB: in 2003 phosphine and chloropicrin were not analysed.
Especially 1,2-dichloroethane is found more frequently in containers: the percentage of containers in which 1,2-dichloroethane was found, rose from 7 to 33% in the 2003-2006
*
*
period. Methyl bromide was found most frequently in the last four years (in about 25% of the analysed containers), but there is no clear trend noticeable. Sulfuryl fluoride was not found in any of the containers.
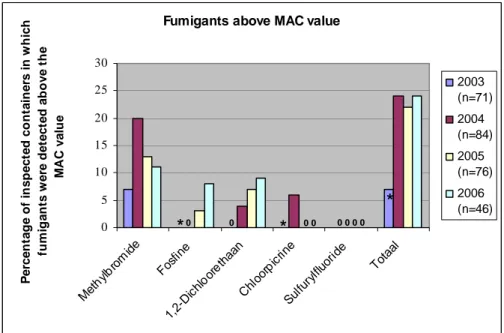
The percentage of containers in which fumigants were found in concentrations above the MAC -value1 shows a variable outcome (see Figure 2). (Please note that in 2003, phosphine and chloropicrin were not analysed, which may cause an underestimation of the total score.)
Fumigants above MAC value
0 5 10 15 20 25 30 Meth ylbrom ide Fosf ine 1, 2-Dic hloor ethaan Chl oor picr ine Sulfur ylfluor ide Totaal P e rcen ta g e o f in sp ect ed co n tai n e rs in w h ic h fu m ig a n ts w e re d e tect ed ab o ve t h e M AC v a lu e 2003 (n=71) 2004 (n=84) 2005 (n=76) 2006 (n=46)
Figure 2: Percentage of inspected containers in which fumigants were detected in concentrations above the MAC value. *NB: in 2003 phosphine and chloropicrin were not analysed.
The percentage of inspected containers that contain concentrations of methyl bromide above the MAC value, has, after an initial increase, decreased in the last two years. Especially 1,2-dichloroethane is found more frequently in concentrations above the MAC value. In 2006 almost one−quarter of the inspected containers contained fumigants in concentrations above the MAC value.
When we look at Table 1, we see that there is no clear increase or decrease in the mean or median methyl bromide concentration. For 1,2-dichloroethane we see an
increase in the mean concentration. This fumigant is not only found more frequently, but also in higher concentrations. For phosphine and chloropicrin there is not enough data to be able to comment on a possible trend in the mean or median concentration.
1 MAC value: maximum allowable concentration; the maximum concentration of a gas, vapour or haze or a
subtance at the workplace, which in general don’t has a negative effect on the health of employees en their
0 0 0 0 0 0 0 0
*
*
RIVM letter report 20070151 IMD Trend analysis of harmful gases in shipping containers
5
Table 1: Mean or median concentration (in μg/m3) of fumigants in positive samples.
2003 2004 2005 2006 Fumigant MAC value
(µg/m3)
Mean Median Mean Median Mean. Median Mean Median Methyl bromide 1000 1342 359 61364 2259 5237 1516 10882 442 Phosphine 140 - - n.d. n.d. )* )* )* )* 1,2-Dichloroethane 7000 1199 733 7011 1212 11649 631 22256 1836 Chloropicrin 700 - - 1920 1398 n.d. n.d. )* )* Sulfuryl fluoride 10000 n.d. n.d. n.d. n.d. n.d. n.d. n.d. n.d.
: not available; n.d.: not detected; *: too less positive samples (≤ 3)
Other compounds
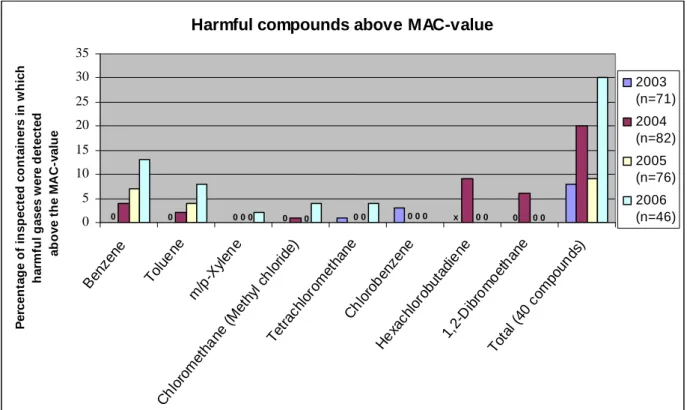
Except for fumigants, other harmful gases too are often detected in high levels in shipping containers. Aromates such as benzene, toluene, ethyl benzene and xylenes are found in most of the containers, with chloromethane being found frequently. These compounds are used mainly as solvents in glues, paints, varnishes, plastics, cleaning products and cosmetics. There is a rising trend in the percentage of containers which contain harmful gases at a level above the MAC value (see Figure 3).
Harmful compounds above MAC-value
0 5 10 15 20 25 30 35 Ben zene Tol uene m/p -Xyl ene Chlo rom etha ne ( Met hyl c hlo ride) Tet rach loro met hane Ch loro ben zene Hexa chlo robu tadi ene 1, 2-Dib rom oet han e Tot al ( 40 c om poun ds) P e rcen ta g e o f in sp ect ed co n tai n e rs in w h ic h h a rm fu l g ases w e re d e tect ed ab o ve t h e M A C -val u e 2003 (n=71) 2004 (n=82) 2005 (n=76) 2006 (n=46)
Figure 1: Percentage of inspected containers showing harmful compounds above the MAC value.
0 0 0 0 0 0 0 0 x 0 0 0 0 0 0
In 2006, 30% of the inspected containers showed an exceedance of the MAC value for one of the 40 examined compounds. This represented an increase in comparison with earlier years. Especially benzene and toluene were found more frequently in concentrations above the MAC value.
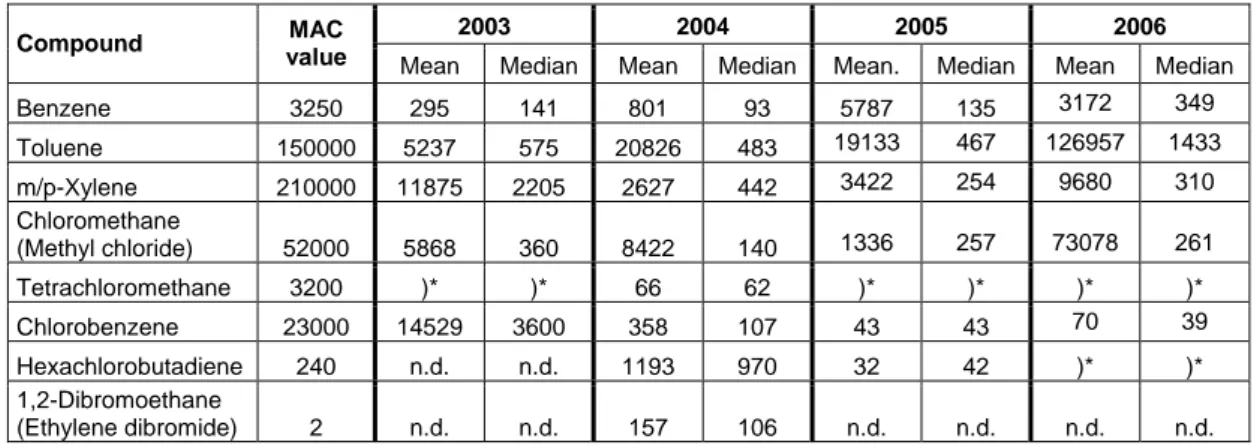
When we look at Table 2, we can see that, in general, the mean and median concentrations of benzene and toluene show a rising trend, while the levels of chlorobenzene show a falling trend. For the other compounds, there is no clear trend noticeable.
Table 2: Mean and median concentration (μg/m3) of harmful compounds in positive
samples.
2003 2004 2005 2006
Compound MAC
value Mean Median Mean Median Mean. Median Mean Median
Benzene 3250 295 141 801 93 5787 135 3172 349 Toluene 150000 5237 575 20826 483 19133 467 126957 1433 m/p-Xylene 210000 11875 2205 2627 442 3422 254 9680 310 Chloromethane (Methyl chloride) 52000 5868 360 8422 140 1336 257 73078 261 Tetrachloromethane 3200 )* )* 66 62 )* )* )* )* Chlorobenzene 23000 14529 3600 358 107 43 43 70 39 Hexachlorobutadiene 240 n.d. n.d. 1193 970 32 42 )* )* 1,2-Dibromoethane (Ethylene dibromide) 2 n.d. n.d. 157 106 n.d. n.d. n.d. n.d.
RIVM letter report 20070151 IMD Trend analysis of harmful gases in shipping containers
7
Conclusions
• The percentage of inspected shipping containers in which fumigants were detected, shows a rising trend, which is caused mainly by the increasing number of containers containing 1,2-dichloorethane and, to a lesser extent, the increase in phosphine. The percentage of containers with methyl bromide and
chloropicrin does not show a clear trend. As in the 2002 study, sulfuryl fluoride was not detected in a single container.
• The percentage of inspected containers with concentrations of fumigants above the MAC value shows a variable trend. The percentage of containers with methyl bromide concentrations above the MAC value decreased after an initial increase. The percentage of containers in which the MAC value for 1,2-dichloroethane was exceeded, shows a rising trend. In 2006, almost one-quarter of the inspected containers exceeded the MAC value for a fumigant.
• The percentage of inspected containers with other harmful substances (like solvents) above the MAC value has increased. In 2006, 30% of the inspected containers showed an exceedance of the MAC value for one of the 40 examined compounds. Especially the number of containers with exceeding benzene and toluene MAC values has increased.
• These results relate to containers inspected by the VROM Inspectorate for whom the selection method has not changed over the last few years.