Report 620860001/2010 P.A.M. Uijt de Haag et al.
A model for comparing occupational
health and safety
RIVM Report 620860001/2010
A model for comparing occupational health and
safety
P.A.M. Uijt de Haag (RIVM) L.J. Bellamy (White Queen BV) A. Burdorf (Erasmus MC, Rotterdam) D.J.J. Heederik (IRAS, Utrecht University) H.J. Manuel (RIVM)
I.A. Papazoglou (Demokritos, Greece) L. Portengen (IRAS, Utrecht University) A. Pronk (TNO)
E. Tielemans (TNO)
Contact:
P.A.M. Uijt de Haag Centre External Safety paul.uijt.de.haag@rivm.nl
This report has been produced for the Ministry of Social Affairs and Employment, The Hague
RIVM, P.O. Box 1, 3720 BA Bilthoven, the Netherlands Tel +31 30 274 91 11 www.rivm.nl
© RIVM 2010
Parts of this publication may be reproduced, provided acknowledgement is given to the 'National Institute for Public Health and the Environment', along with the title and year of publication.
Abstract
A model for comparing occupational health and safety
Employees can be exposed to different risks at the workplace, for example chronic exposure to harmful substances, physical stress and accidents. Up to now, these risks were assessed and judged independently. It appears possible to develop one integrated model that evaluates these different risks on the same basis, thus making them comparable. This is the result of a feasibility study carried out by RIVM in collaboration with experts from the University of Utrecht - IRAS, TNO, Erasmus University of Rotterdam, White Queen B.V. and Y. Papazoglou under the authority of the Dutch Ministry of Social Affairs and Employment. In the feasibility study, one integrated model is developed to compare different exposures for some selected jobs in the construction industry. The model calculates the occupational burden of disease of silicosis and lung cancer (due to exposure to silica), low back pain (due to lifting of heavy loads) and injury and mortality (due to accidents). In all cases, the DALY is used to measure the burden of disease. The functioning of the model is demonstrated by applying the model to a few selected jobs and diseases.
The first results of the pilot version of the OHIA model show that for three of the four selected jobs the occupational burden of disease, expressed in DALY, due to exposure to silica is one order of magnitude larger than the burden of disease due to lifting loads and incidents. For the carpenter, the burden of disease is comparable for the different working conditions. The model also shows the dynamic behaviour of the effects: the incidence of low back pain and incidents occurs only during the working life, whereas the incidence of lung cancer due to exposure to silica is for an important part after retirement. However, important information is still missing, and large uncertainties exist.
The feasibility study demonstrates that it is possible to develop an integrated model for occupational health and safety. This model gives insight in the working conditions having the largest occupational burden of disease and the possibilities for improvement. The model thus allows prioritizing the policy efforts and introducing better health and safety improvement programmes. The feasibility study also shows the areas where model improvements are required.
Key words:
occupational safety, occupational health, risk model, occupational incidents, silica
Rapport in het kort
De vergelijking van arbeidsveiligheid en arbeidsgezondheid – een haalbaarheidsstudie
Werknemers kunnen op hun werk blootgesteld worden aan verschillende risico’s, zoals blootstelling aan schadelijke stoffen, fysieke belasting en ongevallen. De risico’s van deze verschillende blootstellingen worden tot nu toe onafhankelijk van elkaar berekend en beoordeeld. Het blijkt haalbaar een model te ontwikkelen dat deze verschillende risico’s op gelijke wijze berekent en daarmee vergelijkbaar maakt. Dit blijkt uit deze haalbaarheidsstudie van het RIVM in samenwerking met een consortium van deskundigen van de Universiteit Utrecht – IRAS, TNO – Kwaliteit van Leven, Erasmus Universiteit Rotterdam, White Queen B.V. en Y. Papazoglou in opdracht van het ministerie van Sociale Zaken en
Werkgelegenheid.
In de haalbaarheidsstudie is voor enkele beroepen in de bouwnijverheid één model ontwikkeld waarmee verschillende blootstellingen vergeleken kunnen worden. Het model berekent de ziektelast van het optreden van silicose en longkanker (ten gevolge van de blootstelling aan silica), lage rugklachten (ten gevolge van het tillen van zware lasten) en sterfte en letsel (ten gevolge van ongevallen). Als maat is de DALY gebruikt, waarmee de verschillende ziektes vergelijkbaar zijn gemaakt. De werking van het model is zo
gedemonstreerd voor enkele beroepen en enkele ziektes.
De eerste berekeningen met een pilotversie van het OHIA-model laten zien dat voor drie van de vier geselecteerde beroepen de ziektelast, uitgedrukt in DALY, ten gevolge van blootstelling aan silica een orde van grootte groter is dan de ziektelast ten gevolge van het tillen van zware voorwerpen en arbeidsgerelateerde incidenten, terwijl voor de timmerman de bijdragen van de drie blootstellingen vergelijkbaar zijn. Uit het model volgt ook dat de dynamiek van de verschillende blootstellingen heel anders is: het optreden van rugklachten en ongevallen gebeurt alleen tijdens het werkzame leven, terwijl bijvoorbeeld longkanker ten gevolge van silica-blootstelling voor een belangrijk deel pas na het werkzame leven gebeurt. Ook blijkt dat belangrijke informatie nog ontbreekt, en er nog grote onzekerheden zijn. Uit de haalbaarheidsstudie blijkt dat het mogelijk is te komen tot een geïntegreerd model voor arbeidsveiligheid en –gezondheid. Hiermee is een perspectief ontwikkeld voor een model waarmee inzicht wordt verkregen in de sectoren en arbeidsomstandigheden die leiden tot de grootste ziektelast en waar de grootste verbeteringen mogelijk zijn. Hiermee kan de
beleidsinzet beter worden geprioriteerd en verbeterprogramma’s gerichter worden ingezet. De studie geeft ook inzicht in welke modelverbeteringen nog nodig zijn om te komen tot een praktisch toepasbaar model.
Trefwoorden:
Arbeidsveiligheid, arbeidsgezondheid, risicomodel, arbeidsongevallen, silica
Contents
List of tables and figures 9
Abbreviations 11 Samenvatting 13
Summary and conclusions 17
1 Introduction 21
1.1 Background 21
1.2 Scope of the OHIA model 21
1.3 Target groups 22
1.4 Pilot study 22
2 Overview of the model approach 23
2.1 Introduction 23
2.2 Life tables 23
2.3 Selection of job titles 24
2.4 Characteristics of the job titles 25
2.4.1 Cohorts 25
2.4.2 Number of employees 25
2.5 End point of the calculation 25
3 Silica exposure 27
3.1 General description of the model 27
3.2 Exposure data 27 3.3 Intervention measure 28 3.3.1 Intervention scenario 1 28 3.3.2 Intervention scenario 2 29 3.4 Dose response 30 3.4.1 Lung cancer 30 3.4.2 Silicosis 31 3.5 Results 34 3.5.1 Lung cancer 34 3.5.2 Silicosis 38
3.6 Limitations and further work 41
4 Accidents 43
4.1 General description of the model 43
4.2 Job descriptions 44
4.3 Exposure data 44
4.4 Intervention measure 47
4.5 Risk calculation 48
4.6 Results 50
4.7 Limitations and further work 54
5 Lifting 55
5.1 General description of the model 55
5.2 Job descriptions 56
5.3 Exposure 57
5.3.1 Step 1 The exposure profile 57
5.3.2 Step 2 Expected occurrence of low back pain 58
5.3.3 Step 3 Disability-adjusted life years due to low back pain 60 5.3.4 Step 4 Effect of the intervention on the exposure profile 62 5.3.5 Step 5 Expected occurrence of low back pain after intervention 63 5.3.6 Step 6 Disability-adjusted life years due to low back pain after the intervention 63 5.4 Considerations for the general OHIA model in the occupational population 64
6 Comparison of the results 67
7 Discussion 69
8 Conclusions and recommendations 73
References 75
Appendix A – Selection of agents for pilot study 79
Appendix B – Background mortality rates 83
Appendix C – Calculation of DALY for occupational injuries 85
List of tables and figures
Tables
Table 1 Selected sectors, agents and diseases in the pilot study. 22
Table 2 Occupations in the construction industry 24
Table 3 Number of employees per job in the construction industry and correction factor cohort 25 Table 4 Pre intervention eight-hour time weighted average (TWA) average silica exposure
(mg/m3) for concrete drillers/sawyers, carpenters, tilers, and road pavers. 28 Table 5 Post intervention eight-hour time weighted average (TWA) average silica
exposure (mg/m3) for concrete drillers/sawyers, carpenters, tilers, and road pavers
for intervention scenario 2. 30
Table 6 Lung cancer deaths and DALY associated with silica exposure for four job titles in
the construction industry. 35
Table 7 Development of silicosis and DALY associated with silica exposure for four job
titles in the construction industry. 38
Table 8 The risk rates per hour for injury or death as a result of an activity. 43 Table 9 Individual risks of average construction workers. 45 Table 10 Number of accidents occurring to the four job descriptions. 46 Table 11 Individual risks of the 4 job descriptions and the average construction worker. 47 Table 12 Individual risk of the average construction worker, when using self-powered tools
instead of electrical power tools. 47
Table 13 Occupational deaths and DALY associated with occupational deaths and injuries for the four job descriptions and the average construction worker. 53 Table 14 Profile of risk factors in physical load for the occurrence of low back pain. 57 Table 15 Exposure profile of physical load in selected occupations. 58 Table 16 Assumptions on incidence, recurrence, and prevalence of low back pain among
working populations without any relevant exposure to low back pain. 59 Table 17 Estimates of the annual transitional probabilities for low back pain. 60 Table 18 Distribution of duration of episodes of low back pain. 61 Table 19 Duration of episodes of low back pain and associated DALY. 61 Table 20 Estimated burden of disease due to low back pain in selected occupations. 62 Table 21 Influence of ergonomic interventions on manual materials handling, awkward
postures, and whole-body vibration in the construction industry. 63 Table 22 Estimated burden of disease due to low back pain in selected occupations before
and after the intervention. 63
Table 23 Sensitivity of the HIA-model for assumptions about remaining permanently
disabled due to low back pain. 65
Table 24 Occupational burden of disease (DALY) for different job titles, cohorts and agents/diseases. 67 Table 25 Number of employees per job in the construction industry and correction factor
cohort. 79
Figures
Figure 1 Dose response relationship (Lakhal and Lacasse, 2009) 31 Figure 2 Cumulative risk for silicosis by cumulative exposure to respirable silica from Chen
et al. (2001). 33
Figure 3 Dose response relationship between exposure to silica (mg/(m3*years)) and silicosis rate (spline: black line, quadratic model: striped, and log-model: dotted line). 34 Figure 4 Lung cancer (DALYs) associated with silica exposure for four job titles 36 Figure 5 Silicosis (DALYs) associated with silica exposure for four job titles 39 Figure 6 Predicted occupational deaths (cum) per job for the cohort with avg age 42 s.d. 7.8
50 Figure 7 Predicted occupational deaths (cum) per job for the cohort with age 20 50 Figure 8 Predicted DALY due to occupational deaths per job for the cohort with avg age 51 Figure 9 Predicted DALY due to occupational deaths per job for the cohort with age 20 51 Figure 10 Predicted DALY due to occupational injuries per job for the cohort with
avg age 42 s.d. 7.8 52
Figure 11 Predicted DALY due to occupational injuries per job for the cohort with age 20 52 Figure 12 Schematic approach for the health impact assessment for low back pain 55 Figure 13 Estimated DALYs in an occupational group with high exposure to manual materials
handling and frequent bending and twisting of the trunk (exposed group) relative to
an unexposed group (reference group) 62
Abbreviations
AR Absolute Risk
DALY Disability Adjusted Life Years – a measure used for the integration of different effects. DALY is the measure for the burden of disease and quantifies the loss of health due to premature death and due to life with illness. The DALY is the sum of the number of lost years due to premature death and the (weighted) number of lost years due to illness, where the gravity of a specific illness is expressed in the weighting factor. In this way all types of diseases are converted into one single number
ELR Excess Lifetime Risk
HRCT High-resolution computed tomography ILO International Labour Office
OHIA model Occupational Health Impact Assessment model – Model to evaluate the impact of both incidents and chronic exposure to illness-causing agents at work OR Odds Ratio; the ratio of the odds of an event occurring in one group (here: the
exposed group) to the odds of it occurring in another group (here: the non-exposed group)
ORCA Occupational Risk Calculator – Model for the risk assessment of occupational accidents
PAGO Periodiek Arbeidsgezondheidskundig Onderzoek; periodic medical examinations
RR Relative Risk
TWA Time Weighted Average
VASt Versterking Arbeidsomstandighedenbeleid Stoffen – programme of the Ministry of Social Affairs and Employment ‘Strengthening the health and safety policy on chemical substances’
Samenvatting
Inleiding
Het ministerie van Sociale Zaken en Werkgelegenheid heeft in het Programma ‘Versterking Arbeidsveiligheid’ een risicomodel voor arbeidsveiligheid laten ontwikkelen. Dit
risicomodel, Occupational Risk Calculator (ORCA) genaamd, maakt het mogelijk de risico’s van werknemers te berekenen om gewond te raken of te sterven ten gevolge van een
arbeidsgerelateerd ongeval. Ook kunnen de effecten van maatregelen doorgerekend worden, zodat het mogelijk is een optimale balans tussen kosten en baten van het implementeren van maatregelen te bepalen.
Het risicomodel ORCA is beperkt tot arbeidsgerelateerde ongevallen. Dit betreft naar schatting ongeveer 5 – 10% van de totale ziektelast ten gevolge van arbeidsomstandigheden. Het grootste deel van de ziektelast komt voor rekening van chronische blootstelling. Voor een integrale visie op het terugdringen van arbeidsrisico’s is het daarom gewenst een risicomodel te ontwikkelen, waarin zowel ongevallen als ziektelast ten gevolge van chronische blootstelling zijn meegenomen. Het OHIA-model, een acroniem voor Occupational Health Impact Assess-ment model, voorziet in deze behoefte.
Doel van het OHIA-model
Het model moet het mogelijk maken om de ziektelast van verschillende
arbeidsomstandigheden, namelijk de chronische blootstelling aan gevaarlijke stoffen, arbeidsgerelateerde ongevallen en fysieke belasting, op gelijke wijze te berekenen en te beoordelen. Dit maakt een geïntegreerde aanpak van zowel arbeidsveiligheid als
arbeidsgezondheid (‘gezond en veilig werken’) mogelijk op basis van wetenschappelijke kennis en inzichten, waarbij een optimale inzet van risicoreducerende interventies mogelijk moet zijn en de ziektelast kosteneffectief gereduceerd wordt. Het OHIA-model wordt dan ook ontwikkeld voor verschillende gebruikers:
− Op beleidsniveau kan het OHIA-model gebruikt worden om inzicht te krijgen in de sectoren en arbeidsomstandigheden die leiden tot de grootste ziektelast en waar de grootste verbeteringen mogelijk zijn. Hiermee kan de beleidsinzet beter worden geprioriteerd en verbeterprogramma’s gerichter worden ingezet.
− Op inspectieniveau kan beter bepaald worden welke maatregelen de grootste effectiviteit hebben, zodat de prioriteiten voor inspectie duidelijker worden.
− Op sector- en bedrijfsniveau kan bepaald worden welke beroepsgroepen de grootste ziektelast hebben en welke combinaties van maatregelen het kosteneffectiefst zijn.
Opzet van de haalbaarheidsstudie
De ontwikkeling van een volledig OHIA-model, waarin alle sectoren en
arbeidsomstandigheden zijn meegenomen, vraagt een zeer grote inspanning in tijd en geld. Daarom is eerst een haalbaarheidsstudie uitgevoerd. Het doel van deze studie is tweeledig, namelijk (i) nagaan of het mogelijk is een OHIA-model te ontwikkelen en (ii) bepalen welke stappen nodig zijn voor een OHIA-model en welke witte vlekken er nog zijn. Een consortium van deskundigen van de Universiteit Utrecht – IRAS, TNO – Kwaliteit van Leven, Erasmus Universiteit Rotterdam, White Queen B.V., Y. Papazoglou en het RIVM werkten samen in de haalbaarheidsstudie. Ook de sector Arbouw is betrokken bij deze haalbaarheidsstudie. De studie is gestart op 15 oktober 2009 en afgerond op 31 augustus 2010.
De haalbaarheidsstudie is uitgevoerd binnen de sector bouwnijverheid voor de beroepen en arbeidsomstandigheden zoals beschreven in navolgende tabel. Een inschatting is dat hiermee ongeveer een derde van het aantal werknemers in deze sector en een significant deel van de blootstelling in kaart is gebracht.
Sector, beroepen, arbeidsomstandigheden en gevolgen in de haalbaarheidsstudie
Sector Bouwnijverheid
Beroep Timmerman, tegelzetter, betonboorder/zager en stratenmaker Arbeidsomstandigheden Blootstelling aan silica, tillen van lasten en ongevallen Gevolgen Silicosis en longkanker
Rugklachten
Herstelbaar letsel, permanent letsel en sterfte
Berekeningen met het OHIA-model
Het OHIA-model berekent de ziektelast door voor elk beroep uit te gaan van een groep gezonde werknemers van 20 jaar, en deze gedurende hun hele leven te blijven volgen, aannemende dat zij tot hun pensionering hetzelfde werk blijven doen. Dit is in
overeenstemming met het uitgangspunt dat grenswaarden zo zijn vastgesteld dat werknemers bij blootstelling gedurende hun hele werkzame leven geen schade aan de gezondheid
ondervinden. Voor de vergelijking tussen de verschillende arbeidsomstandigheden zijn de verschillende effecten teruggebracht tot één maat, de Disability-Adjusted Life-Years (DALY). De DALY is een maat voor het verlies aan gezondheid en combineert verloren levensjaren ten gevolge van vroegtijdige sterfte met verminderde levenskwaliteit door jaren met ziekte.
Resultaten van het OHIA-model
Het ontwikkelde OHIA-model is de eerste demonstratie dat in één model verschillende beroepen en verschillende typen blootstelling op uniforme wijze met elkaar vergeleken kunnen worden, op basis van al bestaande data. De ziektelast van zowel ongevallen als van chronische blootstelling wordt op dezelfde wijze berekend en kan met elkaar vergeleken worden. Dit maakt het mogelijk om voor bijvoorbeeld een sector te bepalen welke
blootstellingen de grootste ziektelast veroorzaken en welke beroepsgroepen hieraan het meest zijn blootgesteld. Ook is het bijvoorbeeld mogelijk binnen een beroepsgroep de ziektelast voor een werknemer te bepalen, en welk type blootstelling de grootste bijdrage heeft. Omdat ook de effecten van maatregelen in het OHIA model doorgerekend kunnen worden, zijn de resultaten van het model bij uitstek geschikt voor het bepalen van de potentiële effectiviteit van verschillende verbeterprogramma’s.
De eerste berekeningen met een pilotversie van het OHIA-model laten zien dat voor drie van de vier geselecteerde beroepen de ziektelast, uitgedrukt in DALY, ten gevolge van blootstelling aan silica een orde van grootte groter is dan de ziektelast ten gevolge van het tillen van zware voorwerpen en arbeidsgerelateerde incidenten, terwijl voor de timmerman de bijdragen van de drie blootstellingen vergelijkbaar zijn. Uit het model volgt ook dat de dynamiek van de verschillende blootstellingen heel anders is: het optreden van rugklachten en ongevallen gebeurt alleen tijdens het werkzame leven, terwijl bijvoorbeeld longkanker ten gevolge van silicablootstelling voor een belangrijk deel pas na het werkzame leven gebeurt.
Beperkingen van het OHIA-model
De haalbaarheidsstudie heeft aangetoond dat het mogelijk is een geïntegreerd OHIA-model te maken waarmee risico’s van verschillende blootstellingen kunnen worden berekend en vergeleken op het niveau van een sector dan wel gemiddelde werknemer. Hiermee is er een duidelijk perspectief naar een volledig OHIA-model. Hoewel er in korte tijd veel bereikt is, ontbreekt nog belangrijke informatie voor een volwaardig OHIA-model. In een
vervolgonderzoek moeten deze hiaten verder ingevuld worden.
Schatting van de blootstelling
Voor de indeling van beroepen is gebruik gemaakt van de Arbouwcode. Binnen één Arbouwcode zijn er echter heel verschillende activiteiten mogelijk. Zo valt binnen de code van stratenmaker niet alleen het werken met stenen, maar ook asfalteren. In de
haalbaarheidsstudie is gebruikgemaakt van een gemiddelde waarde voor de blootstelling binnen een Arbouwcode, terwijl in werkelijkheid de blootstelling sterk zal variëren binnen deze beroepsgroep en ook per individu. In een vervolgfase moeten we de beroepen en de daaraan gekoppelde blootstelling beter karakteriseren.
Gebruik van vereenvoudigde modellen
In de berekeningen van de ziektelast zijn vereenvoudigingen gedaan. In een
vervolgonderzoek moet het belang van deze vereenvoudigingen worden bepaald aan de hand van een gevoeligheidsanalyse. Dit leidt tot een prioritering voor modelverbeteringen. Volledig maken van het OHIA-model
In de haalbaarheidsstudie zijn slechts enkele blootstellingen onderzocht, en het model moet nog uitgebreid worden met een aantal andere blootstellingen, zoals diesel. Hierbij moet wel opgemerkt worden dat zelfs voor de belangrijkste stoffen en belastingen nog veel informatie ontbreekt, zoals blootstellingsgegevens. Dit maakt in een vervolgfase meetcampagnes voor het verzamelen van dergelijke gegevens noodzakelijk.
Daarnaast zal een OHIA-model nooit volledig zijn in alle mogelijke blootstellingen: er zijn te veel stoffen waaraan werknemers kunnen worden blootgesteld, en een goede kwantitatieve relatie tussen blootstelling en ziektelast ontbreekt in veel gevallen. We kunnen uiteindelijk wel een OHIA-model ontwikkelen waarin per sector de belangrijkste stoffen en belastingen zijn opgenomen, zodat het model gebruikt kan worden voor effectieve interventies.
Eindpunt van de berekening
De vergelijking van de ziektelast is nu gebaseerd op de DALY. Dit betekent dat de vergelijking en afweging gebaseerd is op verloren levenskwaliteit en niet op verloren productiviteit. Er zijn verschillende studies naar het gebruik van dergelijke alternatieve maten. Het verdient aanbeveling na te gaan of deze alternatieve maten leiden tot andere inzichten.
Het maken van een software model
In de haalbaarheidsstudie zijn de berekeningen uitgevoerd met een aantal spreadsheets. Voor een OHIA-model dat bruikbaar is voor derden moet een gebruikersvriendelijke software-applicatie worden ontwikkeld. Hiervoor moeten eerst de specificaties worden opgesteld, zoals de benodigde invoer en uitvoer, de rekentijd, etc.
Summary and conclusions
Introduction
The Ministry of Social Affairs and Employment developed a risk model for occupational safety. This risk model, the Occupational Risk Calculator (ORCA), makes it possible to calculate the risk of injury or mortality to employees due to a job-related incident. The model can also be used to calculate the cost of risk-reducing measures and the extent to which the risk has been reduced. As such, the model can be used to work out an optimal balance between the costs and the benefits of implementing risk-reducing measures.
ORCA is limited to job-related incidents. It is estimated that incidents only account for 5 to 10% of the total occupational burden of disease in the Netherlands, whereas chronic exposure accounts for the rest. To have an integrated approach to risk reducing at work, it is useful to develop a risk model, in which both incidents and chronic exposure are combined. The OHIA model, an acronym for Occupational Health Impact Assessment (OHIA) model, meets the need.
Scope of the OHIA model
The OHIA model should make it possible to evaluate similarly the burden of disease due to various working conditions, namely chronic exposure to harmful substances, work-related incidents and physical stress. This allows an integrated approach to occupational safety and health based on scientific grounds, leading to an optimal use of risk reducing interventions and a cost-effective reduction of the burden of disease. The OHIA model is developed for different end-users:
− At the policy-decision level, the OHIA model can be used to gain an understanding of the industry sectors and working conditions leading to the largest burden of disease and possible improvements. The model thus allows prioritizing the policy efforts and introducing better improvement programmes.
− At the inspection level, the most effective measures can be identified, thus helping in prioritizing the inspections.
− At industry sector and company level, the jobs with the highest burden of disease can be identified and the combination of measures that is most cost-effective.
The feasibility study
The development of a complete OHIA model, addressing all industry sectors and all working conditions, is a very demanding task in terms of time and money. Therefore, first a feasibility study is carried out. The aim of the feasibility study is twofold, namely (i) to determine whether it is possible to develop an OHIA model and (ii) to determine the steps needed for the development of the model and the areas where information is missing. The feasibility study was carried out by an international group of experts from the University of Utrecht, TNO, Erasmus University of Rotterdam, White Queen B.V., Y. Papazoglou and RIVM. Also a representative from the construction industry organization, Arbouw, was involved in the study. The study started on October 15, 2009 and was completed on August 31, 2010. The feasibility study was carried out within the construction industry for the jobs and working conditions as described in the table. We estimate that about one-third of the employees in the sector and a significant part of the exposure are covered.
Sector, jobs, working conditions and effects addressed in the feasibility study
Sector Construction industry
Job concrete driller/sawyer, tiler, carpenter, road paver Working conditions Exposure to silica, lifting of loads, incidents Effects Silicosis and lung cancer
Low back pain
Recoverable injury, permanent injury, mortality
Calculations with the OHIA model
The OHIA model calculates the burden of disease for each job by starting with a fixed cohort of healthy employees of age 20, and following them until the last person dies. It is assumed that the employees keep the same job until retirement at age 65. This is in agreement with the concept of occupational exposure limits: an employee should not suffer detrimental health effects of life-time exposure to the limit value. To compare the different working conditions, the effects are reduced to one single measure, namely the Disability-Adjusted Life Years (DALY). The DALY is a measure for the loss of health and combines lost life years due to early death with loss of quality of life due to illness.
Results of the OHIA model
The OHIA model is the first demonstration that in one model different jobs and different working conditions can be compared similarly, based on existing data. The burden of disease of incidents and chronic exposure are calculated in the same way and compared. This allows determining on a sector level which working conditions have the largest contribution to the burden of disease and which jobs are most exposed. It is also possible to determine the burden of disease for an employee and the exposure with the largest contribution. Since the OHIA model also calculates the effects of an intervention measure, the results of the model are useful to determine the potential effectiveness of different intervention programmes. The first results of the pilot version of the OHIA model show that for three of the four selected jobs the occupational burden of disease, expressed in DALY, due to exposure to silica is one order of magnitude larger than the burden of disease due to lifting loads and incidents. For the carpenter, the burden of disease is comparable for the different working conditions. The model also shows the dynamic behaviour of the effects: the incidence of low back pain and incidents occurs only during the working life, whereas the incidence of lung cancer due to exposure to silica is for an important part after retirement.
Limitations of the OHIA model
The feasibility study demonstrated that it is possible to develop an integrated OHIA model in which risks of different working conditions can be calculated and compared on the level of a sector or average employee, resulting in a valuable prospect to a complete model. Although a lot of progress was made, important information is still missing for a complete model. These deficiencies should be addressed in the next phase.
Estimation of the exposure
The Arbouw code was used to classify the jobs. It should be noted that one Arbouw code covers a large variety of jobs and therefore large variety of exposure. For example, the job title ‘road paver’ may include working with asphalt, concrete or cobble stones, having very different types of exposure. In the next phase, the Arbouw codes and alternatives need to be studied in order to have job descriptions that match the exposure data.
Simplified modelling
In the modelling of the exposure and disease, simplifications were made. In the next phase, it is recommended to do a sensitivity analysis to determine the most important factors in the OHIA model and to give guidance to further improvements.
Completeness of the OHIA model
The feasibility study was limited to a few selected jobs and exposures. The model should be extended to cover the most important exposures, among others diesel. It should be noted that even for the most significant agents important information is missing, like exposure data. Therefore measuring campaigns for collecting exposure data are probably needed in the next phases.
An OHIA model will never cover all exposures and diseases: the range of substances for which exposure may occur is too large, and a quantitative relation between exposure and burden of disease is often missing. However, it is possible to develop an OHIA model that covers the most significant agents per sector, and the model can be used to make effective interventions.
The use of DALY as measure
The study used the DALY as measure to compare the different exposures and diseases. The use of DALY means that we compare the health effects over the entire life of an employee, including the period after retirement. Alternative measures are possible, focusing on the loss of productivity of employees. It is recommended to determine whether these alternative measures lead to different conclusions.
The software model
In the feasibility study, the calculations are done with spreadsheets. To have an OHIA model that can be used by others, a user-friendly application must be developed. For this
application, the requirements and specifications need to be formulated, e.g. the input and output, calculation time, etc.
1
Introduction
1.1
Background
In the Programme ‘Strengthening Labour Safety’ of the Ministry of Social Affairs and Employment a model for occupational risk (Occupational Risk Calculator – ORCA) is developed (Aneziris et al., 2008). ORCA is to provide employers with a choice of measures or combination of measures aimed at reducing the risk of employees suffering injury or death as a consequence of job-related incidents. The model can also be used to calculate the cost of these measures and the extent to which the risk has been reduced. As such, the model can be used to work out an optimal balance between the cost and the benefits of implementing risk-reducing measures.
ORCA is limited to job-related incidents. It is estimated that incidents only account for 5-10% of the total occupational burden of disease in the Netherlands, whereas chronic exposure accounts for the remainder (Eysink et al., 2007). There are already various models developed to calculate the health impact of combinations of agents and diseases for selected occupational groups. However, an overall health impact assessment model for occupational exposure is missing, thus hampering an overall view of the occupational burden of diseases and successful impact reduction strategies.
The Ministry of Social Affairs and Employment therefore wants to develop an integrated model, in which both incidents and chronic exposure are combined, the Occupational Health Impact Assessment (OHIA) model. With this model, the impact of both incidents and chronic exposure can be compared and evaluated, and a cost-effective impact reduction strategy can be developed.
1.2
Scope of the OHIA model
The scope of the OHIA model can be described as follows.
1. The OHIA model would show the occupational burden of disease for a selection of important agents, diseases, occupational groups and sectors using the population at risk. 2. The OHIA model would allow the comparison of the occupational burden of disease for a selection of important agents and diseases on the level of agent, disease and sector.
3. The OHIA model would allow the comparison between the risk of incidents and the impact of chronic exposure.
4. The OHIA model would facilitate to determine an effective impact reduction strategy per sector.
The OHIA model is primarily intended for risk and impact reduction strategies at the national level and at the level of a sector. It is not intended to be used at the level of an individual company. However, the results of the OHIA model are expected to be useful at company level also.
1.3
Target groups
The OHIA model has the following target groups.
1. Policy decision makers can use the OHIA model to determine the most relevant target groups for action programmes, i.e. sectors where the most health impact reduction can be achieved.
2. The labour inspectorate can use the OHIA model to prioritise the inspection capacity by focussing on the sectors where inspection may be most effective in improving safety.
3. Sectors can use the OHIA model to determine the activities with largest occupational burden and to identify optimal combinations of impact-reducing measures and their costs. The end-users of the OHIA model are expected to be ‘experts’ at the level of health and safety services.
1.4
Pilot study
The development of an integrated OHIA model, covering all (major) exposures and diseases for all sectors, is a very time-consuming and costly project. Therefore, a pilot study was carried out, with the objective to investigate the feasibility of an OHIA model, to determine the limitations of such a model and to determine a route map to a complete OHIA model. The results of the pilot study are described in this report.
For the pilot study, a limited number of agents and diseases were selected, based on the importance for the total occupational burden of disease and the availability of data. The selected agents and diseases are given in Table 1; the selection process is described in more detail in Appendix A.
Table 1 Selected sectors, agents and diseases in the pilot study.
Sector Construction industry
Agents Silica, Lifting and Accidents
Diseases Silicosis and Lung cancer due to exposure to silica Low back pain due to lifting
Recoverable injury, permanent injury and death due to accidents In this report, the results of the pilot study are described. Chapter 2 describes the model approach. The results for exposure to silica, incidents and lifting are described in the Chapters 3, 4 and 5 respectively. The results for the different exposures are compared in Chapter 6. Finally, in the Chapters 7 and 8 the feasibility of the OHIA model are discussed and recommendations for the follow-up are given.
2
Overview of the model approach
2.1
Introduction
Different types of models are used to determine the health impacts of silicosis and lung cancer due to exposure to silica, low back pain due to lifting and death and injury due to accidents. To combine these different models into one health impact assessment model, the common data input must be the same for all models. This means that the models should use the same life tables, job titles and end points.
2.2
Life tables
The most commonly used approach for health impact assessments is the estimation in change in excess lifetime risk (ELR), incidence or death as calculated from a life table. The life table risk represent the probability of a disease (or death attributed to a disease) during lifetime or up to a certain age. The life table risk takes into account that a cohort is dying out from other causes of death than the disease under study, in contrast to the conditional cumulative risk which is less accurate. The mortality rates and survival probabilities for all causes that were used for constructing life tables are shown in Appendix B.
In health impact modelling a disease model is used in combination with an average exposure level or exposure distribution to estimate (or simulate) the number of cases occurring each year. The advantage of this approach over risk assessment approaches is that a) population distributions of exposure can be used instead of fixed values and b) the effect of changes in the exposure distribution can be explored with regard to disease occurrence.
Besides a relative risk or absolute risk (RR or AR) as a function of exposure, several pieces of information are needed to calculate the ELR as a function of exposure with the help of a life table. These pieces are:
− The background rate of the disease or outcome of interest in each age group in the general population.
− The background all-cause morbidity or mortality rate in each age group in the general population. These should be gender specific, if the exposure distribution or the relative risks from the published study differ by gender.
− Depending on the purpose of the risk assessment, level of exposure in the target population.
The life table begins in a given year, starting with a fixed cohort of a certain size and age distribution, which is affected at every subsequent age by the mortality and disease rates for that age. The life table continues until the last person dies. The life table consists of age specific disease or mortality rates. With increasing age, increasing cumulative exposure is assumed (based on age, assuming that all workers started working at age 20 and are exposed to the same level).
With increasing cumulative exposure, the risk of disease increases and for each age category the mortality rate among exposed is calculated on the basis of the background risk (or risk in non-exposed) and the relative (in case of a disease that occurs among non-exposed) or absolute risk (in case of a disease that does not occur among non-exposed). This rate among
exposed can be used to calculate the number of cases in each stratum and this in its turn is used to calculate the risk at the end of the desired period. The number of cases in each stratum is adjusted for the probability that individuals die from other causes. To estimate the impact of exposure on the population with a certain age distribution in the start year a distinction
between age and calendar year has to be made in the life table.
2.3
Selection of job titles
The selection of job titles in the pilot study is based on the periodic medical examinations (PAGO) in the construction industry in 2005 (total number n=36,741), as collected and provided by Stichting Arbouw. All construction workers are invited for this PAGO and approximately 60% will attend. The invitation scheme is age-dependent: workers below 40 are invited every 4 years, whereas workers of 40 and older are invited every 2 years. This implies that the age distribution will be skewed towards older age. A selection is made on the 20 jobs with most construction workers, excluding white-collar jobs. These jobs cover approximately 74% of all workers attending the PAGO and are shown in Table 2.
Table 2 Occupations in the construction industry
Arbouw code Description Number
9541 Carpenter (timmerman)* 11704
9511 Bricklayer (metselaar)** 2892
9311 Painter (schilder)* 2658
7021 Supervisor (uitvoerder B & U) 2253
9919 Bricklayer's assistant (opperman/bouwvakhelper) 839
9746 Machinist (machinist GWW) 764
9514 Road paver (straatmaker) 666
9913 Excavation Worker (grondwerker) 644
9551 Plasterer (stukadoor traditioneel) 577
9546 Carpenter (timmerman)** 572
9513 Tiler (tegelzetter) 491
9547 Carpenter/Bricklayer (timmerman/metselaar) 475
9741 Machinist mobile crane (machinist mobiele kraan) 416
9914 Craftsman (vakman GWW) 388
9855 Driver (chauffeur) 375
9595 Cable pipeline layer (kabel- en buizenlegger) 356 9544 Woodworker mechanized (machinaal houtbewerker) 327
9521 Concrete driller/sawyer (betonboorder/zager) 288
8457 Mechanic machine maintenance (monteur onderhoud machines) 266 9598 Mechanic ceiling/completion (plafondmonteur/monteur afbouw) 246 * Maintenance, renovation (onderhoud, renovatie)
** Newly built (nieuwbouw)
Four job titles were selected for the pilot study, based on the number of employees and their relevance to lifting, dust exposure and accidents, namely:
− concrete drillers/sawyers; − tilers;
− carpenter; − road paver.
2.4
Characteristics of the job titles
2.4.1
Cohorts
Four job titles were selected, representing high and low exposure levels for each exposure. For each job title two fixed (no inflow) cohorts of 10,000 workers were defined: one cohort of 20 year old workers just starting their employment in the construction industry, and one cohort with a mean age of 42 year (standard deviation 7.8) who had all worked in the
construction industry since age 20. The age characteristics were based on an epidemiological survey among Dutch construction workers exposed to quartz-containing dust (Tjoe et al., 2003a). Workers were assumed to work in the same job until age 65 (45 years total).
2.4.2
Number of employees
The excess lifetime risk is calculated for cohorts of 10,000 employees for each job title. For the excess life time risk in the actual work force, a correction for the number of employees is needed. The correction is based on the following data:
− the total number of employees at the periodic medical examinations (PAGO) in the construction industry is 36,741 in 2005;
− the total number of employees in the construction industry (excluding painters) is 222,059 in 2006 (Rijswijk van, 2008).
Assuming that the job distribution of employees attending the periodic medical examinations is the same as the job distribution of all employees, we can calculate the number of employees per job by using a correction factor 6.5 (= 222,059 / (36,741–2658)). Table 3 shows the number of employees in the construction industry per job.
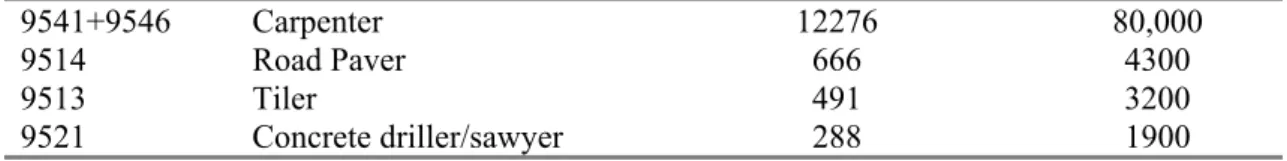
Table 3 Number of employees per job in the construction industry and correction factor cohort
Arbouw code Description Number PAGO Number of
employees
9541+9546 Carpenter 12276 80,000
9514 Road Paver 666 4300
9513 Tiler 491 3200
9521 Concrete driller/sawyer 288 1900
2.5
End point of the calculation
An indicator for work-related health damage should combine mortality, illness and other health effects. On a national level, the concept of DALY is generally accepted and already used in the various studies into the contribution of work-related exposure to substances to the prevalence of the illness. The concept may also be useful in the integration of the OHIA model and the Occupational Risk Model for accidents. Since the DALY concept has become a standard, it is used in the pilot study. This means that the OHIA model would be directed at the total life expectancy.
Using the life tables, the life expectancy at the age of incidence of the disease/incident is used to determine the contribution of the disease in terms of DALY.
3
Silica exposure
3.1
General description of the model
Two models were developed for silica-related exposures: a lung cancer and a silicosis model. Section 2.2 gives a general description of the life table method. For lung cancer background lung cancer mortality rates were used in combination with a relative risk (increase in risk per increase in exposure) to calculate age specific lung cancer mortality rates. It was assumed that lung cancer incidence was equal to lung cancer mortality. The number of deaths was
converted to DALY using a weight of 1 for each missed life year.
Silicosis does not occur among non-exposed subjects. Therefore an absolute risk (increase in incidence rate per increase in exposure) was used to calculate age specific incidence rates. Silica cases were assumed to leave the working population but have a normal life expectancy. The number of cases is converted to DALY using a weight factor of 0.43 for each life year with silicosis.
3.2
Exposure data
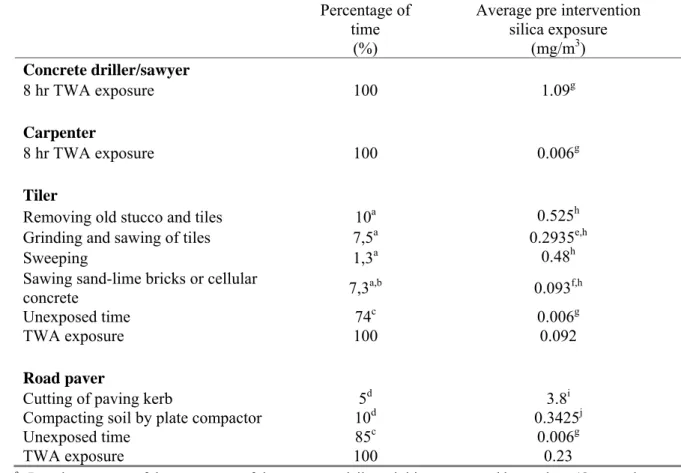
Pre-intervention mean (arithmetic mean) respirable silica exposure levels for the four job titles were extracted from the literature (Table 4). For concrete drillers and recess millers a mean eight-hour time weighted average (TWA) exposure level of 1.09 mg/m3 has been reported for the Dutch construction industry (Tjoe et al, 2004), which was used for concrete drillers/sawyers. This study also reported a background mean eight-hour TWA exposure level of 0.006 mg/m3. This value was used as an estimate for carpenters for whom only background
levels of silica were expected. For tilers and road pavers no eight-hour measurements were available and task based exposure measurements and time spent on daily activities were used to calculate an eight-hour TWA exposure (Table 4). For tilers task based exposure
measurements have been reported for removal of old tile and stucco layers, cutting, grinding or drilling of tiles, and cutting and grinding of bricks of sand-lime or cellular concrete (Spee et al., 2010). Average exposure levels for cutting and drilling of tiles were below the background exposure level as reported by Tjoe et al., 2004, and these tasks were considered unexposed. No exposure measurements were reported for removal of glue and cement, impregnating, preparing glue/cement, tiling, pointing and sponge off mortar, applying blocks, sealing, and wet cleaning. These tasks were also considered to be unexposed and a
background exposure of 0.006 mg/m3 was used (Tjoe et al, 2004). Average time expenditures
on these daily activities as reported by workers were available (Onos and Spee, 2004). Combining the average exposure levels and average time expenditure, a pre-intervention eight-hour TWA exposure of 0.092 mg/m3 was estimated (Table 4). For road pavers a
task-based exposure measurement has been reported for cutting of paving kerb (Chrisholm, 1999), which was in the range of levels reported for cutting of concrete slabs (Thorpe et al., 1999). In addition, exposure levels have been reported for compacting of soil by plate compactors (Brouwer et al., 2001). The average time spent on these activities was estimated, resulting in an estimated pre-intervention eight-hour TWA exposure of 0.23 mg/m3 (Table 4).
It should be noted that the eight-hour TWA exposure levels are point estimates rather than exposure distributions.
Table 4 Pre intervention eight-hour time weighted average (TWA) average silica exposure (mg/m3) for
concrete drillers/sawyers, carpenters, tilers, and road pavers.
Percentage of time
(%)
Average pre intervention silica exposure (mg/m3) Concrete driller/sawyer 8 hr TWA exposure 100 1.09g Carpenter 8 hr TWA exposure 100 0.006g Tiler
Removing old stucco and tiles 10a 0.525h
Grinding and sawing of tiles 7,5a 0.2935e,h
Sweeping 1,3a 0.48h
Sawing sand-lime bricks or cellular
concrete 7,3a,b 0.093f,h
Unexposed time 74c 0.006g
TWA exposure 100 0.092
Road paver
Cutting of paving kerb 5d 3.8i
Compacting soil by plate compactor 10d 0.3425j
Unexposed time 85c 0.006g
TWA exposure 100 0.23
a Based on a range of the percentage of time spent on daily activities as reported by workers (Onos and Spee, 2004). The midpoint was taken.
b Total sawing time: 14.5%. Assumption: 50% sand-lime bricks or cellular concrete and 50% gypsum (no silica exposure).
c 100% – ∑percentage of time spent on exposed jobs. d No data available, estimated.
e Pre intervention: always using an angle grinder (average of inside and outside was taken). f Pre intervention: always using a hand held circular saw.
g Tjoe et al., 2004. h Spee et al., 2010. i Chrisholm, 1999. j Brouwer et al., 2001.
3.3
Intervention measure
3.3.1 Intervention scenario 1The Dutch MAC (Maximally Accepted Concentration) for silica is 0.075 mg/m3 eight-hour
TWA. As a first intervention scenario we assumed that for road pavers, tilers and concrete drillers/sawyers, for whom the average pre-intervention exposure levels exceeded this MAC, the average post intervention level was reduced to the MAC value of 0.075 mg/m3 eight-hour
TWA. Since we use an average value of exposure and exposure varies from worker to worker, this means that still a considerable number of workers is exposed at or above the MAC.
3.3.2 Intervention scenario 2
The second intervention scenario is based on reported efficacies of actual interventions reported in the literature (Table 5). Implemented interventions are wet dust suppression and switching to a different type of tool. A study of the efficacy of risk management measures on occupational exposures reported an average reduction factor of 5 for wet suppression
(Fransman et al., 2008), which we used for this study. If possible this average reduction factor was compared to silica exposure reduction factors reported for specific applications.
Concrete drillers/grinders: Wet suppression was implemented during drilling and grinding,
resulting in a post intervention exposure level of 0.218 mg/m3. The reduction factor of 5 is in
line with reduction factors of 3 – 7 reported by a study of water dust suppression during cutting of concrete (Thorpe et al., 1999).
Tilers: Wet dust suppression was implemented for removing old stucco and tiles and for
sweeping.
The reduction factor of 5 is in the range of reported wet suppression reduction factors for demolition work (Brouwer et al., 2001) and sweeping (Tjoe et al., 2003b). In addition, for grinding and sawing of tiles a switch from angle grinder to a stationary saw with water suppression and for sawing of sand-lime bricks or cellular concrete a switch from a circular saw to a hand saw were implemented. Exposure levels for the use of these tools have been reported (Spee et al., 2010). These interventions resulted in a post intervention exposure level of 0.017 mg/m3.
Road pavers: Wet suppression was implemented during cutting of paving kerbs and
compacting of soil. The reduction factor of 5 is in the range of reduction factors reported during soil compacting (Brouwer et al., 2001) and cutting concrete (Thorpe et al., 1999). These interventions resulted in a post intervention exposure level of 0.050 mg/m3.
Table 5 Post intervention eight-hour time weighted average (TWA) average silica exposure (mg/m3) for
concrete drillers/sawyers, carpenters, tilers, and road pavers for intervention scenario 2.
Intervention measures scenario 2 Average post intervention silica exposure scenario 2
(mg/m3) Concrete driller/sawyer
8 hr TWA exposure Wet suppression: reduction factor 5a 0.218
Carpenter
8 hr TWA exposure NA 0.006b
Tiler
Removing old stucco and
tiles Wet suppression: reduction factor 5a 0.105
Grinding and sawing of tiles Stationary saw with water 0,0098c
Sweeping Wet suppression: reduction factor 5a 0.096
Sawing sand-lime bricks or
cellular concrete Hand saw instead of circular saw 0.001c,d
Unexposed time NA 0.006b
TWA exposure 0.017
Road paver
Cutting of paving kerb Wet suppression: reduction factor 5a 0.76
Compacting soil by plate
compactor Wet suppression: reduction factor 5a 0.0685
Unexposed time NA 0.006b
TWA exposure 0.050
a Fransman et al., 2008. b Tjoe et al., 2004. c Spee et al., 2010.
d After the intervention measure, the residual exposure appears to be less than the background value, as different sources of information are used.
3.4
Dose response
3.4.1
Lung cancer
For silica and lung cancer risk several meta-analyses are available. The most appropriate one which describes the exposure response relationship between cumulative silica exposure and lung cancer risk (expressed as relative risk) has been published by Lacasse et al., 2009. The modelling in this analysis was legitimately criticized, but in the rebuttal (Lakhal and Lacasse, 2009) a smoothed exposure response relationship was given through the origin (cumulative exposure=0, RR=1) which could be used in this health impact analysis. A meta analysis including 9 dose response studies of silica exposure and lung cancer roughly demonstrated a linear increase in lung cancer risk up to a RR of 1.8 for exposures between 0 and
5 mg/(m3.year), which levelled off to a steady RR of 1.8 for exposures above 5 mg/(m3.year)
(Lakhal and Lacasse, 2009) (Figure 1).
Figure 1 Dose response relationship (Lakhal and Lacasse, 2009).
3.4.2
Silicosis
Recent studies on silicosis in Dutch construction workers
The use of hand tools over the last decades in the construction industry has led to incidentally high exposure to silica containing dust and this was the reason to explore the risk for
developing silicosis. In a cross-sectional study among 1335 Dutch construction workers radiological changes were observed in 2.9% of profusion ILO category ≥1/1. Silicosis (defined as the presence of small rounded opacities) was reported on 10 (0.8%) chest radiographs. The study showed an exposure response association between the prevalence of ILO ≥1/1 and cumulative exposure to quartz containing dust. However, in the minor
profusion categories 0/1 and 1/0 a poor agreement between the three certified ‘B’ readers (κ between 0.21 and 0.4) was reported. Identification of pneumoconiosis (silicosis) at population level in workers exposed to silica containing dust has up to recently been done by
conventional chest radiographs, classified according to the International Labour Office (ILO) guidelines. In a follow-up study among a sample of construction workers from the source population, more advanced imaging techniques were used. High-resolution computed tomography (HRCT) has been shown to be superior to chest radiography for the detection of small opacities, interstitial fibrosis, and emphysema especially in low grade pneumoconiosis and a low radiation HRCT protocol was used to evaluate cases and controls in greater detail. Posterior-anterior chest radiographs, dynamic and static lung volumes and gas diffusion parameters were measured in all participating individuals as well. The study gives evidence that in workers with normal chest radiography (ILO 0/0) the presence of low grade silicosis cannot be excluded. In relatively high exposed construction workers a seven times higher risk of simple (nodular) silicosis was found. Emphysema on HRCT was associated with current or former smokers, but not with exposure, and contributed to a reduction in diffusion capacity. Airflow limitation was mainly determined by current smoking and was not associated with simple (nodular) silicosis.
Recently, a diagnostic rule has been developed on the basis of which the likelihood that an individual worker has silicosis can be predicted on the basis of cumulative exposure, lung function and self-experienced health status. Workers with a high probability are referred to a
specialized clinic. Approximately 150 workers with high scores have been referred and evaluated (Mets et al., 2010). The prevalence of silicosis in this group is again clearly elevated as expected. Many workers also experience COPD and emphysema. These studies together indicate that workers in the Dutch construction industry are at risk for developing silicosis. However, the cross-sectional data available is not optimal as a basis for risk or health impact assessment. Therefore, the literature was explored to identify studies which made use of either incidence or mortality data for silicosis.
Exposure response relations for silicosis
Silicosis exposure response relations have been evaluated in only a few studies. Exposure response relationships have been described for six cohort studies with silica exposure ranging from diatomaceous earth workers, granite workers, sand workers and gold miners using mortality data (’t Mannetje et al., 2002). Data from six occupational cohorts were pooled with good retrospective exposure data in which 170 deaths from silicosis were reported. The rate of silicosis mortality in the combined data was 28/100 000 person years (py), increasing in nearly monotonic fashion from 4.7/100 000 for exposure of 0-0.99 mg/(m3.year) to
233/100000 for exposure of >28.1 mg/(m3.year). The estimated risk of death up to age 65 from silicosis after 45 years of exposure at 0.1 mg/m3 silica (the current standard in many
countries) was 13 per 1000, while the estimated risk at an exposure of 0.05 mg/m3 was 6 per
1000. Both of these risks are above the risk of 1 per 1000 typically deemed acceptable by the US OSHA. If on the basis of this study the rates are converted to a lifetime risk, (risk=1-exp (-Σ time. rate)), the estimated risk of death by age 75 due to silicosis was 1.9% after a lifetime of work (age 20–65) at the current standard for silica in the US (0.1 mg/m3).
Other relatively recent studies made use of radiological data collected in a very similar way and were able to estimate the incidence of silicosis because of the cohort design of the studies (Chen et al., 2001; Kreiss and Zhen, 1996; Hnizdo et al., 1993; Steenland and Brown, 1995). Older studies are available (reviewed in Chen et al,. (2001) and Steenland (2005)) but these have no or limited follow up after the end of employment. As a result, the estimated lifetime risk is more than an order of magnitude lower and these studies are not of sufficient quality to be used for risk assessments. More specifically, the lifetime risk of exposure at 0.1 mg/m3 for
45 years varied between 2 and 92%, with the higher risks for studies which had extended follow-up till after the end of employment. In these studies, the risk varied less, but still close to a factor 2, between 47 and 92%.
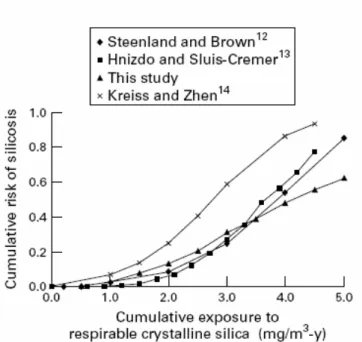
Incidence data is preferred over mortality data because it can be expected that silicosis as underlying cause of death will be poorly documented in most cases. The four studies which have made use of incidence data have closely resembling exposure response relationships for cumulative respirable silica exposure and cumulative risk of silicosis (Chen et al., 2001). This analysis was based on ILO category 1/1or higher (small opacities on radiograph) for most of the studies, similarly to the criterion used in the cross sectional study by Tjoe Nij et al (2003). The four studies with longer follow-up and comparable methodology have remarkably similar exposure response relationships.
Figure 2 Cumulative risk for silicosis by cumulative exposure to respirable silica from Chen et al. (2001).
Exposure response relationship used
The comparison of incidence and mortality data indicates that probably a minority of the workers die of silicosis, although the incidence is high in many studies. The difference between a silicosis risk (ILO 1/1) and the mortality risk varies between a factor 23.5 and 46. Although a direct comparison is not possible, and follow-up is not available in the Tjoe Nij et al. study, results indicate, given the excessively high levels above existing exposure standards, that the risk for developing silicosis may be low in the construction industry in comparison to other industries. Such observations have more extensively analyzed for tin and tungsten and pottery workers (Chen et al., 2005). At a given exposure level, the risk of silicosis was higher for the tin and tungsten than for the pottery workers. The observed differences in the risk of silicosis among the three cohorts suggest that silica dust characteristics, in addition to cumulative respirable silica dust exposure, may affect the risk of silicosis. This could potentially be associated with the specific toxicological properties of the silica dust, which does not originate from fresh cut stone, as in most of the mining studies. At this time, there is not sufficient reliable exposure information available for the construction industry to estimate potential differences in potency. This could be an area of more extensive research for the near future because these differences might be of relevance for the estimation of the burden of disease.
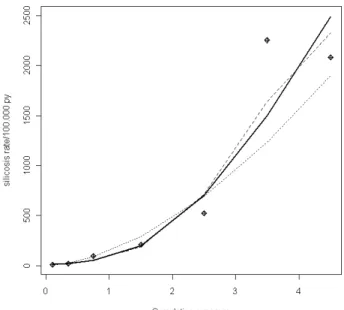
The exposure response relationship was obtained by fitting an exposure response relationship for silicosis risk (ILO classification >1/1) with cumulative exposure using the data described by Chen et al. (2001). The obtained dose response relationships between exposure to silica (mg/(m3.years)) and silicosis rate can be seen in Figure 3 for a quadratic and a log-model.
Figure 3 Dose response relationship between exposure to silica (mg/(m3.years)) and silicosis rate (spline:
black line, quadratic model: striped, and log-model: dotted line).
3.5
Results
3.5.1 Lung cancer
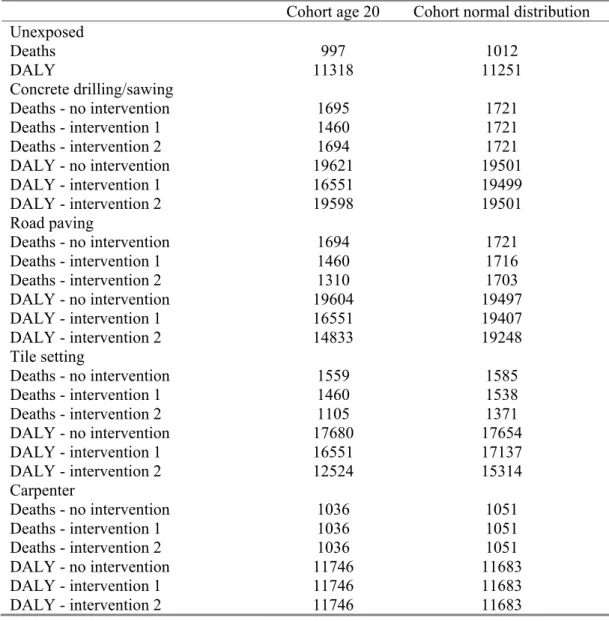
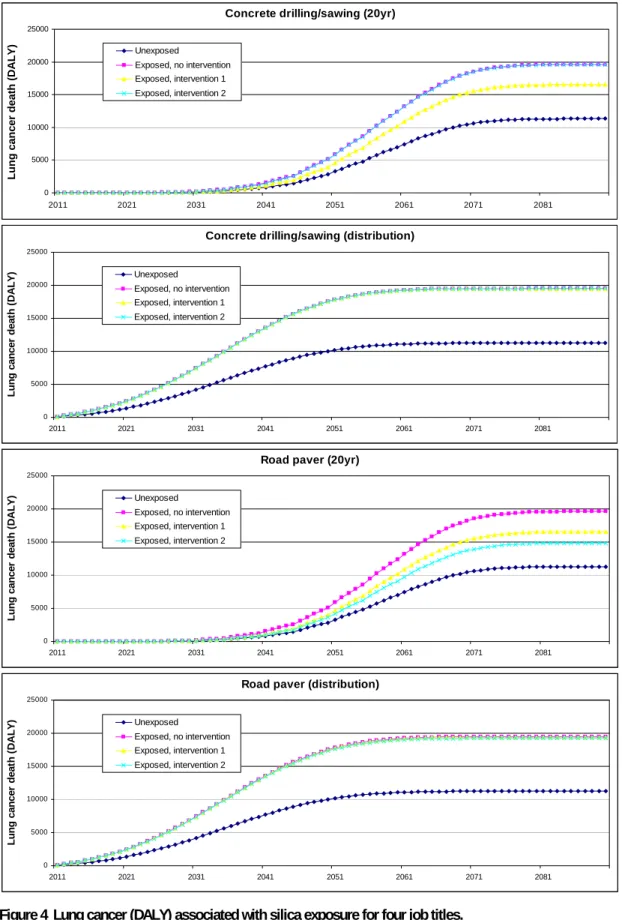
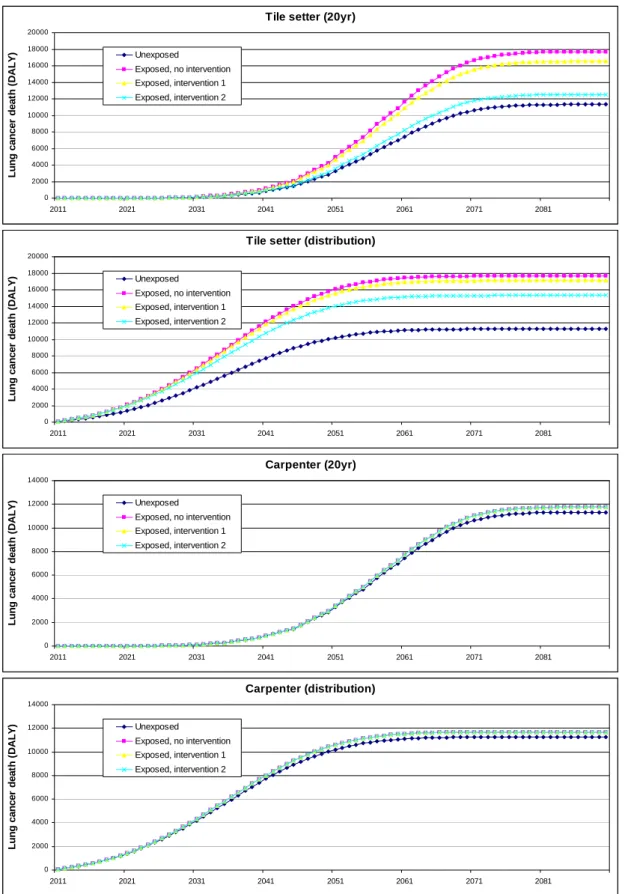
Figure 4 and Table 6 provide DALY associated with various silica exposure scenarios: i.e., unexposed, no intervention, intervention 1, and intervention 2. Impact assessments are conducted with two distinct cohort assumptions: i.e., ‘cohort age 20 at onset’ and ‘cohort normal age distribution at onset’. A distinct impact is depicted for the two types of cohorts, with the cohort of age 20 showing much more differentiation among the different exposure scenarios. This is especially the case for the jobs with very high exposure. For life tables assuming a normal age distribution at onset the cumulative exposure among workers in these jobs is already high before the start of the intervention. Hence risks are already approximating a maximum level before intervention which is irreversible. This is less the case for low exposed workers (e.g., carpenters). Both assumptions with respect to age distribution do not provide a sound reflection of reality of a dynamic population with continuous in and outflow of workers. For the high exposed jobs the number of DALY increased from 11,318
(unexposed) to approximately 19,500 (no intervention). For carpenters only a slight increase of DALY was observed.
Table 6 Lung cancer deaths and DALY associated with silica exposure for four job titles in the construction industry.
Cohort age 20 Cohort normal distribution Unexposed Deaths 997 1012 DALY 11318 11251 Concrete drilling/sawing Deaths - no intervention 1695 1721 Deaths - intervention 1 1460 1721 Deaths - intervention 2 1694 1721 DALY - no intervention 19621 19501 DALY - intervention 1 16551 19499 DALY - intervention 2 19598 19501 Road paving Deaths - no intervention 1694 1721 Deaths - intervention 1 1460 1716 Deaths - intervention 2 1310 1703 DALY - no intervention 19604 19497 DALY - intervention 1 16551 19407 DALY - intervention 2 14833 19248 Tile setting Deaths - no intervention 1559 1585 Deaths - intervention 1 1460 1538 Deaths - intervention 2 1105 1371 DALY - no intervention 17680 17654 DALY - intervention 1 16551 17137 DALY - intervention 2 12524 15314 Carpenter Deaths - no intervention 1036 1051 Deaths - intervention 1 1036 1051 Deaths - intervention 2 1036 1051 DALY - no intervention 11746 11683 DALY - intervention 1 11746 11683 DALY - intervention 2 11746 11683 RIVM Report 620860001 35
Concrete drilling/sawing (20yr) 0 5000 10000 15000 20000 25000 2011 2021 2031 2041 2051 2061 2071 2081 Lun g can c er death (DALY) Unexposed Exposed, no intervention Exposed, intervention 1 Exposed, intervention 2
Concrete drilling/sawing (distribution)
0 5000 10000 15000 20000 25000 2011 2021 2031 2041 2051 2061 2071 2081 L u n g ca ncer d eat h ( D A L Y ) Unexposed Exposed, no intervention Exposed, intervention 1 Exposed, intervention 2
Road paver (20yr)
0 5000 10000 15000 20000 25000 2011 2021 2031 2041 2051 2061 2071 2081 Lung ca nc e r de a th ( D A L Y) Unexposed Exposed, no intervention Exposed, intervention 1 Exposed, intervention 2
Road paver (distribution)
0 5000 10000 15000 20000 25000 2011 2021 2031 2041 2051 2061 2071 2081 Lung ca nc e r de a th ( D A L Y) Unexposed Exposed, no intervention Exposed, intervention 1 Exposed, intervention 2
Figure 4 Lung cancer (DALY) associated with silica exposure for four job titles.
Tile setter (20yr) 0 2000 4000 6000 8000 10000 12000 14000 16000 18000 20000 2011 2021 2031 2041 2051 2061 2071 2081 Lung ca nc e r de a th ( D A L Y) Unexposed Exposed, no intervention Exposed, intervention 1 Exposed, intervention 2
Tile setter (distribution)
0 2000 4000 6000 8000 10000 12000 14000 16000 18000 20000 2011 2021 2031 2041 2051 2061 2071 2081 Lung ca nc e r de a th ( D A L Y) Unexposed Exposed, no intervention Exposed, intervention 1 Exposed, intervention 2 Carpenter (20yr) 0 2000 4000 6000 8000 10000 12000 14000 2011 2021 2031 2041 2051 2061 2071 2081 Lung ca nc e r de a th ( D A L Y) Unexposed Exposed, no intervention Exposed, intervention 1 Exposed, intervention 2 Carpenter (distribution) 0 2000 4000 6000 8000 10000 12000 14000 2011 2021 2031 2041 2051 2061 2071 2081 Lung ca nc e r de a th ( D A L Y) Unexposed Exposed, no intervention Exposed, intervention 1 Exposed, intervention 2
Figure 4 Lung cancer (DALY) associated with silica exposure for four job titles (continued).
3.5.2
Silicosis
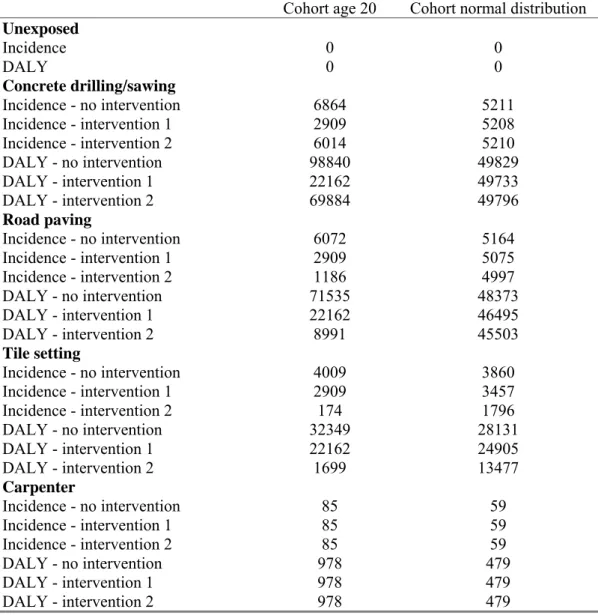
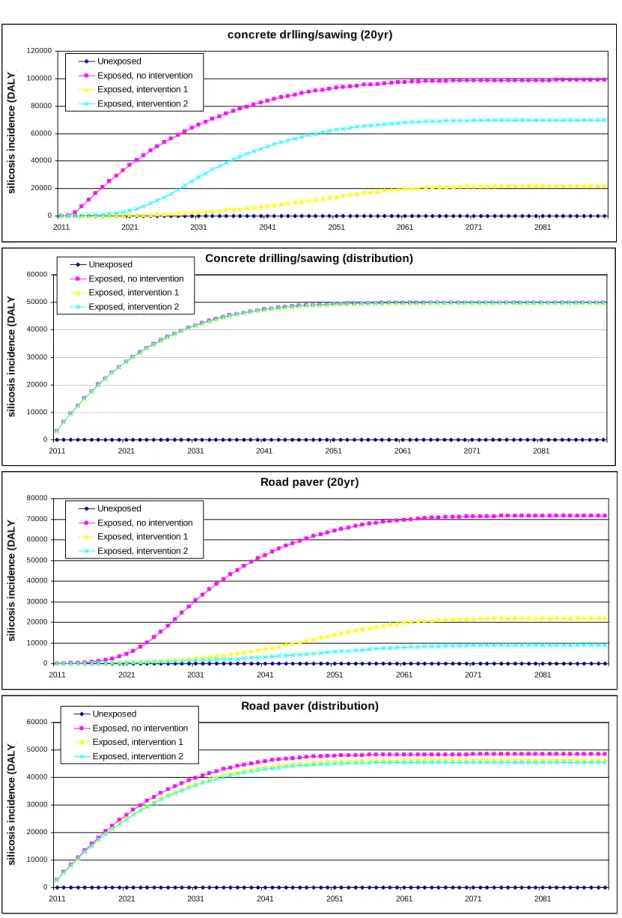
Figure 5 and Table 7 show DALY associated with the development of silicosis. The same pattern emerges with more differentiation between exposure scenarios in the population of 20 years at onset. Total number of DALY is substantial for the high exposed concrete drillers and road pavers. Only a very limited number of DALY is lost due to ex-posure among carpenters. Note that silicosis does not occur among non-exposed workers as opposed to the background rate in the previous lung cancer example.
Table 7 Development of silicosis and DALY associated with silica exposure for four job titles in the construction industry.
Cohort age 20 Cohort normal distribution
Unexposed Incidence 0 0 DALY 0 0 Concrete drilling/sawing Incidence - no intervention 6864 5211 Incidence - intervention 1 2909 5208 Incidence - intervention 2 6014 5210 DALY - no intervention 98840 49829 DALY - intervention 1 22162 49733 DALY - intervention 2 69884 49796 Road paving Incidence - no intervention 6072 5164 Incidence - intervention 1 2909 5075 Incidence - intervention 2 1186 4997 DALY - no intervention 71535 48373 DALY - intervention 1 22162 46495 DALY - intervention 2 8991 45503 Tile setting Incidence - no intervention 4009 3860 Incidence - intervention 1 2909 3457 Incidence - intervention 2 174 1796 DALY - no intervention 32349 28131 DALY - intervention 1 22162 24905 DALY - intervention 2 1699 13477 Carpenter Incidence - no intervention 85 59 Incidence - intervention 1 85 59 Incidence - intervention 2 85 59 DALY - no intervention 978 479 DALY - intervention 1 978 479 DALY - intervention 2 978 479 38 RIVM Report 620860001
concrete drlling/sawing (20yr) 0 20000 40000 60000 80000 100000 120000 2011 2021 2031 2041 2051 2061 2071 2081 si li c o s is i n ci d e n ce ( D A L Y ) Unexposed Exposed, no intervention Exposed, intervention 1 Exposed, intervention 2
Concrete drilling/sawing (distribution)
0 10000 20000 30000 40000 50000 60000 2011 2021 2031 2041 2051 2061 2071 2081 s il ico si s i n ci d e n c e ( D A L Y ) Unexposed Exposed, no intervention Exposed, intervention 1 Exposed, intervention 2
Road paver (20yr)
0 10000 20000 30000 40000 50000 60000 70000 80000 2011 2021 2031 2041 2051 2061 2071 2081 si li cosi s i n ci d e nce ( D A L Y ) Unexposed Exposed, no intervention Exposed, intervention 1 Exposed, intervention 2
Road paver (distribution)
0 10000 20000 30000 40000 50000 60000 2011 2021 2031 2041 2051 2061 2071 2081 si li cosi s i n ci d e nce ( D A L Y ) Unexposed Exposed, no intervention Exposed, intervention 1 Exposed, intervention 2
Figure 5 Silicosis (DALY) associated with silica exposure for four job titles.