Environmental risk limits for
chlorotoluenes (o-chlorotoluene,
m-chlorotoluene, p-chlorotoluene)
Report 601782021/2009
RIVM Report 601782021/2009
Environmental risk limits for chlorotoluenes
(o-chlorotoluene, m-chlorotoluene, p-chlorotoluene)
R. van Herwijnen L.C. van Leeuwen
Contact:
R. van Herwijnen
Expertise Centre for Substances rene.van.herwijnen@rivm.nl
This investigation has been performed by order and for the account of Directorate-General for Environmental Protection, Directorate Environmental Safety and Risk Management, within the framework of the project ’International and National Environmental Quality Standards for Substances in the Netherlands’ (INS).
© RIVM 2009
Parts of this publication may be reproduced, provided acknowledgement is given to the 'National Institute for Public Health and the Environment', along with the title and year of publication.
Rapport in het kort
Milieurisiccogrenzen voor chloortoluenen (o-chloortolueen, m-chloortolueen, p-chloortolueen)
Het RIVM heeft milieurisicogrenzen afgeleid voor chloortoluenen in water, grondwater, bodem en lucht. De groep stoffen omvat o-chloortolueen, m-chloortolueen en p-chloorotolueen. Deze stoffen worden gebruikt bij chemische productieprocessen en als oplosmiddel.
Voor deze afleiding zijn actuele ecotoxicologische gegevens gebruikt die zijn gecombineerd met de methodiek die is voorgeschreven door de Europese Kaderrichtlijn Water. De nieuwe ecotoxicologische gegevens laten zien dat de gevoeligheid van het ecosysteem voor chloortoluenen groter is dan voorheen bekend was. Hierdoor zijn de nieuwe milieurisicogrenzen lager dan de eerder afgeleide normen. Gezien de monitoringsgegevens en de fysisch-chemische eigenschappen van de stoffen worden de nieuwe milieurisicogrenzen naar verwachting niet overschreden. Voor de waterbodem zijn geen milieurisicogrenzen afgeleid want de binding van chloortoluenen aan sediment blijft beneden de grenswaarde. Hierdoor is de blootstelling van waterorganismen aan chloortoluenen via sediment minimaal.
Milieurisicogrenzen zijn maximale concentraties van een stof in het milieu om mens en ecosysteem op verschillende niveaus te beschermen tegen nadelige effecten. Nederland onderscheidt hierbij: een niveau waarbij het risico verwaarloosbaar wordt geacht (VR), een niveau waarbij geen schadelijke effecten zijn te verwachten (MTR), het maximaal aanvaardbare niveau voor ecosystemen, specifiek voor kortdurende blootstelling (MACeco) en tot slot het niveau waarbij mogelijk ernstige effecten voor ecosystemen zijn te verwachten (EReco). De milieurisicogrenzen dienen als advieswaarden voor de Nederlandse Interdepartementale Stuurgroep Stoffen. De stuurgroep stelt de uiteindelijke
milieukwaliteitsnormen vast. De overheid hanteert milieukwaliteitsnormen om het nationale stoffenbeleid en de Europese Kaderrichtlijn Water uit te voeren.
Trefwoorden:
Abstract
Environmental risk limits for chlorotoluenes (o-chlorotoluene, m-chlorotoluene, p-chlorotoluene)
The RIVM has derived environmental risk limits for chlorotoluenes in water, groundwater, soil and air. Current environmental levels of chlorotoluenes are not expected to exceed these limts. This group of substances contains o-chlorotoluene, m-chlorotoluene and p-chlorotoluene. These substances are used as chemical intermediate or as a solvent.
Current ecotoxicological data have been used to derive these values according to methodology as required by the European Water Framework Directive (WFD). The current ecotoxicological data show that the sensitivity of the aquatic ecosystems towards chlorotoluenes is higher than previously known. For this reason, the newly derived environmental risk limits are lower than previously derived limits. Monitoring data and physico-chemical characteristics of the chlorotoluenes do lead to the expectation that the newly derived environmental risk limits will not be exceeded. No risk limits were derived for the sediment compartment, because sorption to sediment is below the trigger value to derive such risk limits. Exposure of water organisms to chlorotoluenes via the sediment is considered to be negligible. Environmental risk limits are the maximum allowable concentrations of a substance in the environment to protect humans and the environment for any adverse effect. Four different levels are distinguished: Negligible Concentrations (NC), the concentration at which no harmful effects are to be expected (Maximum Permissible Concentration, MPC), the Maximum Acceptable Concentration for ecosystems specifically for short-term exposure (MACeco) and a concentration at which serious effects are to be expected (Serious Risk Concentrations, SRCeco). Environmental risk limits form the scientific basis on which the Interdepartmental Steering Committee for Substances sets the environmental quality standards. The government uses these quality standards for carrying out the national policy concerning substances and the European Water Framework Directive.
Key words:
Preface
The goal of this report is to derive risk limits that protect both man and the environment. This is done in accordance with the methodology of the Water Framework Directive (WFD). This methodology is incorporated in the Guidance for the derivation of environmental risk limits within the framework of the project ‘International and National environmental quality standards for Substances in the environment (INS)’ (Van Vlaardingen and Verbruggen, 2007).
The results presented in this report have been discussed by the members of the scientific advisory group for the INS-project (WK-INS). This advisory group provides a non binding scientific advice on the final draft of a report in order to advise the Dutch Steering Committee for Substances on the scientific merits of the report.
Acknowledgements
Thanks are due to dr. M.P.M. Janssen who is program coordinator for the derivation of Environmental Risk Limits (ERLs) at the RIVM. Ing. P.J.C.M. Janssen (RIVM-Centre for Substances and Integrated Risk Assessment) is thanked for his assistance in the human toxicological part.
The results of the present report have been discussed in the scientific advisory group INS (WK INS). The members of this group are acknowledged for their contribution.
Contents
Summary 11
1 Introduction 13
1.1 Background and scope of the report 13
1.2 Selection of substances 13
1.3 Production and use of chlorotoluenes 14
1.4 Status of the results 14
2 Methods 15
2.1 Data collection 15
2.2 Data evaluation and selection 15
2.3 Specific considerations relating to the test compound 16
2.4 Derivation of ERLs 16
3 Substance identification, physico-chemical properties, fate and human toxicology 19
3.1 o-Chlorotoluene 19
3.2 m-Chlorotoluene 21
3.3 p-Chlorotoluene 22
4 Derivation of environmental risk limits 25
4.1 Trigger values 25 4.2 Aquatic compartment 26 4.3 Sediment 29 4.4 Soil 29 4.5 Groundwater 30 4.6 Air 30
4.7 Comparison of the derived ERLs with monitoring data 30
5 Conclusions 33
References 35
Appendix 1. Detailed aquatic toxicity data 37 Appendix 2. Detailed terrestrial toxicity data 43 Appendix 3. References used in the appendices 45
Summary
Environmental risk limits are derived using ecotoxicological, physicochemical, and human
toxicological data. They represent environmental concentrations of a substance offering different levels of protection to man and ecosystems. It should be noted that the Environmental Risk Limits (ERLs) are scientifically derived values. They serve as advisory values for the Dutch Steering Committee for Substances, which is appointed to set the Environmental Quality Standards (EQSs) from these ERLs. ERLs should thus be considered as preliminary values that do not have an official status.
In this report, the risk limits Negligible Concentration (NC), Maximum Permissible Concentration (MPC), Maximum Acceptable Concentration for ecosystems (MACeco), and Serious Risk
Concentration for ecosystems (SRCeco) are derived for chlorotoluenes (o-chlorotoluene,
m-chlorotoluene and p-chlorotoluene) in water, groundwater, soil and air. No risk limits were derived
for the sediment compartment because exposure of sediment is considered negligible. Since not enough data were available for m- and p-chlorotoluene, the ERLs derived are based on a pooled dataset. They are sum values, so they apply to the total concentration of the three chlorotoluenes discussed in this report.
For the derivation of the MPC and MACeco for water, the methodology used is in accordance with the Water Framework Directive. This methodology is based on the Technical Guidance Document on risk assessment for new and existing substances and biocides (EC, 2003). For the NC and the SRCeco, the guidance developed for the project ‘International and National Environmental Quality Standards for Substances in the Netherlands’ was used (Van Vlaardingen and Verbruggen, 2007). An overview of the derived ERLs is given in Table 1.
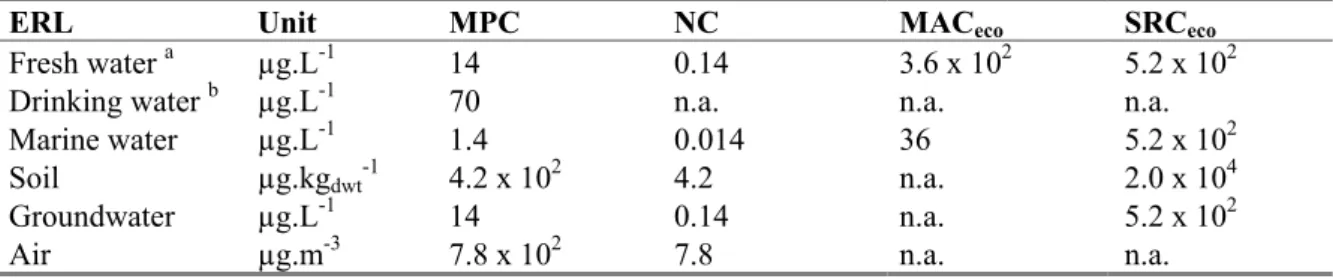
Table 1. Derived sum MPC, NC, MACeco, and SRCeco values for o-, m-, and p-chlorotoluene.
ERL Unit MPC NC MACeco SRCeco
Fresh water a µg.L-1 14 0.14 3.6 x 10² 5.2 x 10²
Drinking water b µg.L-1 70 n.a. n.a. n.a.
Marine water µg.L-1 1.4 0.014 36 5.2 x 10²
Soil µg.kgdwt-1 4.2 x 10² 4.2 n.a. 2.0 x 10⁴
Groundwater µg.L-1 14 0.14 n.a. 5.2 x 10²
Air µg.m-3 7.8 x 10² 7.8 n.a. n.a.
a From the MPC
eco, water, MPCsp, water and MPChh, food, water the lowest one is selected as the ‘overall’ MPCwater. b The exact way of implementation of the MPC
dw, water in the Netherlands is at present under discussion. Therefore, the
MPCdw, water is presented as a separate value in this report.
1
Introduction
1.1
Background and scope of the report
In this report, environmental risk limits (ERLs) for surface water, groundwater, soil and air are derived for o-, m- and p-chlorotoluene. The derivation is performed within the framework of the project
‘International and National Environmental Quality Standards for Substances in the Netherlands’ (INS). The following ERLs are considered:
- Negligible Concentration (NC) – concentration at which effects to ecosystems are expected to be negligible and functional properties of ecosystems must be safeguarded fully. It defines a safety margin which should exclude combination toxicity. The NC is derived by dividing the MPC (see next bullet) by a factor of 100.
- Maximum Permissible Concentration (MPC) – concentration in an environmental compartment at which:
1. no effect to be rated as negative is to be expected for ecosystems;
2a no effect to be rated as negative is to be expected for humans (for non-carcinogenic substances);
2b for humans no more than a probability of death of 10-6 per lifetime can be calculated (for genotoxic carcinogenic substances).
- Maximum Acceptable Concentration (MACeco) – concentration protecting aquatic ecosystems for effects due to short-term exposure or concentration peaks.
- Serious Risk Concentration (SRCeco) – concentration at which possibly serious ecotoxicological effects are to be expected.
These ERLs serve as advisory values that are used by the Steering Committee for Substances to set environmental quality standards (EQS) for various policy purposes. EQSs are all legally and non-legally binding standards that are used in Dutch environmental policy.
1.2
Selection of substances
ERLs are derived for o-chlorotoluene, m-chlorotoluene and p-chlorotoluene (Table 2), which were selected by the Dutch government within the framework of ‘International and national environmental quality standards for substances in the Netherlands’ (INS). The current environmental quality standards for these compounds are based on Van de Plassche et al. (1993). Using a QSAR-approach, they derived MPCs of 0.30, 0.33 and 0.30 mg.L-1 for o-, m- and p-chlorotoluene, respectively. The overall MPCwater for monochlorotoluenes was set to 0.31 mg.L-1, based on total content (310 µg.L-1). In that report, no ERLs for soil and sediment were derived due to a lack of data.
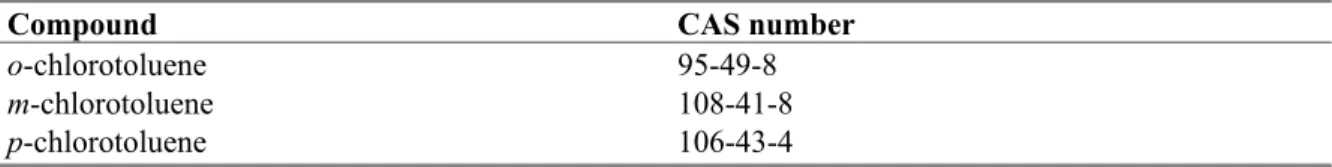
Table 2. Selected compounds.
Compound CAS number
o-chlorotoluene m-chlorotoluene p-chlorotoluene 95-49-8 108-41-8 106-43-4
1.3
Production and use of chlorotoluenes
Chlorotoluenes are produced by converting toluene with chlorine under moderate temperature and normal pressure in the presence of a catalyst. This gives a crude product with the isomeric ratio of chlorotoluenes depending on temperature and the catalyst. A part of this isomer mixture is processed directly, the other part is used for gaining the isomers by fractional distillation. The produced isomer mixture is processed on-site to cresoles. Cresoles are further used for the production of flame retardants, plasticizers, agrochemicals, material preservatives, thermal oils, fragrances, condenser fluids, and anti-aging agents. The main isomer used individually is o-chlorotoluene. o-Chlorotoluene is used as an intermediate in the chemical industry and as a solvent for chemical processing as well as a solvent for the formulation of agricultural pesticides. Mixtures of o-, p- and m-chlorotoluene are also used as solvent for herbicides (OECD-SIDS, 2000). The isomeric mixtures produced by Bayer (Germany) contain 40-45% o-chlorotoluene and 45-60% p-chlorotolunen (IUCLID, 2000) The worldwide production of chlorotoluenes is estimated at 130 000 tonnes per year. The production of
o-chlorotoluene is about 60 000 – 70 000 tonnes per year (OECD-SIDS, 2000). In Europe,
chlorotoluenes are classified as high production volume chemical. The European producers and importers are located in Leverkusen (Germany), Milan (Italy) and Haslemere (UK). There is no production of chlorotoluenes in the Netherlands (ECB website: ecb.jrc.ec.europa.eu/esis/ accessed: 31-10-2008). In the Netherlands, two potential sources for pollution by chlorotoluene utilising industry are identified in the Westerscheld area (VROM, 2004). Chlorotoluenes were also considered relevant for the Rhine area (ICBR, 2007). Since they have not been observed above the detection limit for several years, they are proposed for removal from the Rhine substances list of the International Commission for the Protection of the Rhine (ICBR).
1.4
Status of the results
The results presented in this report have been discussed by the members of the scientific advisory group for the INS-project (WK-INS). It should be noted that the ERLs in this report are scientifically derived values, based on (eco)toxicological, fate and physico-chemical data. They serve as advisory values for the Dutch Steering Committee for Substances, which is appointed to set the Environmental Quality Standards (EQSs). ERLs should thus be considered as proposed values that do not have an official status.
2
Methods
The methodology for the derivation of ERLs is described in detail by Van Vlaardingen and Verbruggen (2007), further referred to as the ‘INS-Guidance’. This guidance is in accordance with the guidance of the Fraunhofer Institute (FHI; Lepper, 2005).
The process of ERL-derivation contains the following steps: data collection, data evaluation and selection, and derivation of the ERLs on the basis of the selected data.
2.1
Data collection
An on-line literature search was performed on TOXLINE (literature from 1985 to 2001) and Current Contents (literature from 1997 to 2007). In addition to this, all references in the RIVM e-tox base and EPA’s ECOTOX database were evaluated (an additional 25 references). All toxicity data are reported in the appendices. Studies reported in Van de Plassche et al. (1993) have been reassessed for this report.
2.2
Data evaluation and selection
Substance identification, physico-chemical properties and environmental behaviour was included according to the methods as described in section 2.1 of the INS-Guidance.
Ecotoxicity studies were screened for relevant endpoints (i.e. those endpoints that have consequences at the population level of the test species). All ecotoxicity and bioaccumulation tests were then thoroughly evaluated with respect to the validity (scientific reliability) of the study. A detailed description of the evaluation procedure is given in the INS-Guidance (section 2.2.2 and 2.3.2). In short, the following reliability indices were assigned (Klimisch et al., 1997):
- Ri 1: Reliable without restriction
’Studies or data … generated according to generally valid and/or internationally accepted testing guidelines (preferably performed according to GLP) or in which the test parameters documented are based on a specific (national) testing guideline … or in which all parameters described are closely related/comparable to a guideline method.’
- Ri 2: Reliable with restrictions
’Studies or data … (mostly not performed according to GLP), in which the test parameters
documented do not totally comply with the specific testing guideline, but are sufficient to accept the data or in which investigations are described which cannot be subsumed under a testing guideline, but which are nevertheless well documented and scientifically acceptable.’
- Ri 3: Not reliable
’Studies or data ... in which there are interferences between the measuring system and the test substance or in which organisms/test systems were used which are not relevant in relation to the exposure (e.g., unphysiologic pathways of application) or which were carried out or generated according to a method which is not acceptable, the documentation of which is not sufficient for an assessment and which is not convincing for an expert judgment.’
- Ri 4: Not assignable
’Studies or data … which do not give sufficient experimental details and which are only listed in short abstracts or secondary literature (books, reviews, etc.).’
All available studies were summarised in data-tables, that are included as Annexes to this report. These tables contain information on species characteristics, test conditions and endpoints. Explanatory notes are included with respect to the assignment of the reliability indices.
Endpoints with Ri 1 or 2 are accepted as valid, but this does not automatically mean that the endpoint is selected for the derivation of ERLs. The validity scores are assigned on the basis of scientific
reliability, but valid endpoints may not be relevant for the purpose of ERL-derivation (e.g. due to inappropriate exposure times or test conditions that are not relevant for the Dutch situation).
After data collection and validation, toxicity data were combined into an aggregated data table with one effect value per species according to section 2.2.6 of the INS-Guidance. When for a species several effect data were available, the geometric mean of multiple values for the same endpoint was calculated where possible. Subsequently, when several endpoints were available for one species, the lowest of these endpoints (per species) is reported in the aggregated data table.
2.3
Specific considerations relating to the test compound
Considering the volatility of the chlorotoluenes the concentration of the compound should be
determined during the experiment. Therefore Ri2 is assigned to all studies where the outcome is based on measured concentrations. An exception is made for acute closed static algae tests since these species react to the initial exposure mainly. Also tests with Vibrio fischeri are assigned Ri2 because these tests have a very short exposure period.
2.4
Derivation of ERLs
For a detailed description of the procedure for derivation of the ERLs, reference is made to the INS-Guidance. With respect to the selection of the final MPCwater, some additional comments should be made:
2.4.1
Sum ERLs
Detailed toxicity data for all chlorotoluenes are tabulated in Appendix 2. Complete datasets are not available and when the individual compounds are considered, ERLs cannot be derived for
chlorotoluenes. Because the compounds occur in an isomer mixture and toxicity is within the same order of magnitude, derivation of sum-ERLs is considered most appropriate (for further discussion see section 4.2.1). Therefore, all data for the three substances were pooled to derive one set of
environmental risk limits which applies to the total concentration of all three chlorotoluenes.
2.4.2
Drinking water
The INS-Guidance includes the MPC for surface waters intended for the abstraction of drinking water (MPCdw, water) as one of the MPCs from which the lowest value should be selected as the general MPCwater (see INS-Guidance, section 3.1.6 and 3.1.7). According to the proposal for the daughter directive Priority Substances, however, the derivation of the AA-EQS (= MPC) should be based on direct exposure, secondary poisoning, and human exposure due to the consumption of fish. Drinking
water was not included in the proposal and is thus not guiding for the general MPCwater value. The exact way of implementation of the MPCdw, water in the Netherlands is at present under discussion within the framework of the ‘AMvB Kwaliteitseisen en Monitoring Water’. No policy decision has been taken yet, and the MPCdw, water is therefore presented as a separate value in this report.
The MPCdw, water is also used to derive the MPCgw. For the derivation of the MPCdw, water, a substance specific removal efficiency related to simple water treatment may be needed. Because there is no agreement as yet on how the removal fraction should be calculated, water treatment is not taken into account.
2.4.3
MAC
eco, marineIn this report, a MACeco is also derived for the marine environment. The assessment factor for the MACeco, marine value is based on:
- the assessment factor for the MACeco, water value when acute toxicity data for at least two specific marine taxa are available, or
- using an additional assessment factor of 5 when acute toxicity data for only one specific marine taxon are available (analogous to the derivation of the MPC according to Van Vlaardingen and Verbruggen, 2007), or
- using an additional assessment factor of 10 when no acute toxicity data are available for specific marine taxa.
If freshwater and marine data sets are not combined the MACeco, marine is derived on the marine toxicity data using the same additional assessment factors as mentioned above. It has to be noted that this procedure is currently not agreed upon. Therefore, the MACeco, marine value needs to be re-evaluated once an agreed procedure is available.
3
Substance identification, physico-chemical
properties, fate and human toxicology
3.1
o-Chlorotoluene
3.1.1
Identity
CH3
Cl
Figure 1. Structural formula of o-chlorotoluene. Table 3. Identification of o-chlorotoluene.
Parameter Value
Common/trivial/other name o-chlorotoluene, 2-chlorotoluene
Chemical name 1-chloro-2-methylbenzene
CAS number 95-49-8
EC number 202-424-3
SMILES code c(c(ccc1)Cl)(c1)C
3.1.2
Physico-chemical properties
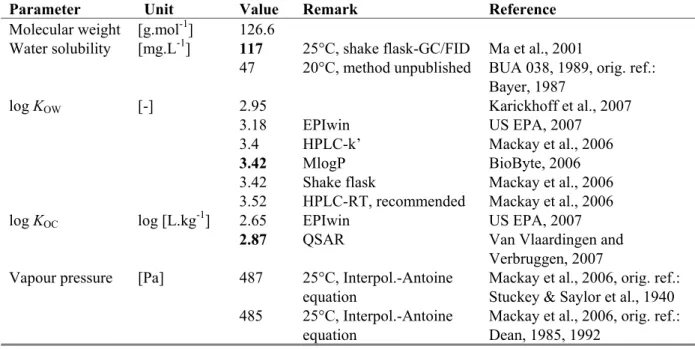
Table 4. Physico-chemical properties of o-chlorotoluene.
Parameter Unit Value Remark Reference
Molecular weight [g.mol-1] 126.6
Water solubility [mg.L-1] 117 25°C, shake flask-GC/FID Ma et al., 2001
47 20°C, method unpublished BUA 038, 1989, orig. ref.: Bayer, 1987
log KOW [-] 2.95 Karickhoff et al., 2007
3.18 EPIwin US EPA, 2007
3.4 HPLC-k’ Mackay et al., 2006
3.42 MlogP BioByte, 2006
3.42 Shake flask Mackay et al., 2006
3.52 HPLC-RT, recommended Mackay et al., 2006
log KOC log [L.kg-1] 2.65 EPIwin US EPA, 2007
2.87 QSAR Van Vlaardingen and Verbruggen, 2007
Vapour pressure [Pa] 487 25°C, Interpol.-Antoine
equation
Mackay et al., 2006, orig. ref.: Stuckey & Saylor et al., 1940
485 25°C, Interpol.-Antoine
equation Dean, 1985, 1992
Parameter Unit Value Remark Reference
486 mean of
uation geometric
Interpol. Antoine eq for 25°C given above
309 US EPA, 2007 , 2007 elting point C] . ref.: Boiling point [°C] 159 006 . ref.:
Henry’s law const. [Pa.m3.mol-1] 362 25°C, van ‘t Hoff equation Roberts, 2001
447 EPIwin, bond method 7
, 2007 EPIwin, 25°C 427 25°C Karickhoff et al. M [° -35.8 Mackay et al., 2006 -35.4 BUA 038, 1989, orig Rathjen, 1975 Mackay et al., 2 159 BUA 038, 1989, orig Rathjen, 1975 Staudinger and
970 20°C BUA 038, 1989, orig. ref.:
Bayer, 1987 US EPA, 200
494 EPIwin, group method US EPA, 2007
273 Karickhoff et al.
3.1.3
Behaviour in the environment
t occur under environmentally relevant conditions. In water,
3.1.4
Bioconcentration and biomagnification
o-chlorotoluene. The calculated bioconcentration
able 5. Overview of bioaccumulation data for o-chlorotoluene.
eference
Hydrolysis of o-chlorotoluene does no
volatilisation is the main removal process. EPIwin (US EPA, 2007) indicates o-chlorotoluene as not readily biodegradable.
There are no experimental bioaccumulation data for factor is given in Table 5.
T
Parameter Unit Value Remark R
BCF (fish) [L.kg-1] 56.53 EPIwin US EPA, 2007
161 QSAR Van Vlaardingen and Verbruggen, 2007
MF g.kg-1] 1 value
B [k Default
3.1.5
Human toxicological threshold limits and carcinogenicity
, o-chlorotoluene is not
nd dog is available (OECD-SIDS, 2000). The US-EPA has derived a
by The following R-phrases are assigned to o-chlorotoluene: R20, R51/53
classified as being a carcinogen. A NOEL of 20 mg.kgbw-1 for rat a
Reference Dose (RfD) of 0.02 mg.kgbw-1day-1 based on the NOEL for rats with an AF of 1000. RIVM has also derived a TDI of 0.02 mg.kgbw-1day-1 in 1996 (Slooff et al., 1996). This value of
0.02 mg.kgbw-1day-1 will be used as TDI in this report. A TCA of 775 µg.m-3 was derived Rademaker et al. (1993).
3.2
m-Chlorotoluene
3.2.1
Identity
CH3
Cl
Figure 2. Structural formula of m-chlorotoluene. Table 6. Identification of m-chlorotoluene.
Parameter Value
Common/trivial/other name m-chlorotoluene, 3-chlorotoluene
Chemical name 1-chloro-3-methylbenzene
CAS number 108-41-8
EC number 203-580-5
SMILES code c(cccc1Cl)(c1)C
3.2.2
Physico-chemical properties
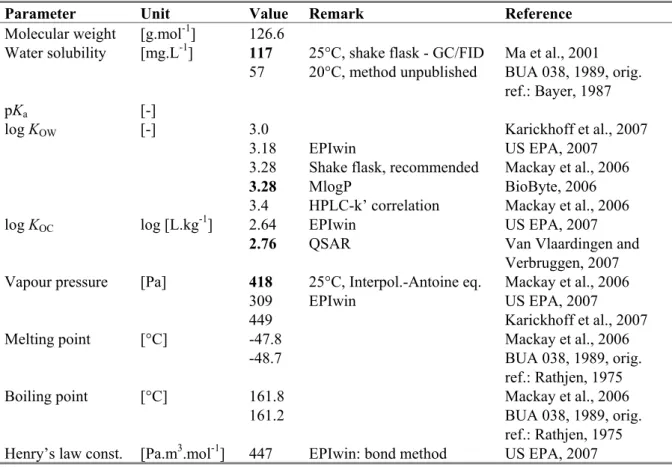
Table 7. Physico-chemical properties of m-chlorotoluene.
Parameter Unit Value Remark Reference
Molecular weight [g.mol-1] 126.6
Water solubility [mg.L-1] 117 25°C, shake flask - GC/FID Ma et al., 2001
57 20°C, method unpublished BUA 038, 1989, orig.
ref.: Bayer, 1987
pKa [-]
log KOW [-] 3.0 Karickhoff et al., 2007
3.18 EPIwin US EPA, 2007
3.28 Shake flask, recommended Mackay et al., 2006
3.28 MlogP BioByte, 2006
3.4 HPLC-k’ correlation Mackay et al., 2006
log KOC log [L.kg-1] 2.64 EPIwin US EPA, 2007
2.76 QSAR Van Vlaardingen and Verbruggen, 2007
Vapour pressure [Pa] 418 25°C, Interpol.-Antoine eq. Mackay et al., 2006
309 EPIwin US EPA, 2007
449 Karickhoff et al., 2007
Melting point [°C] -47.8 Mackay et al., 2006
-48.7 BUA 038, 1989, orig.
ref.: Rathjen, 1975
Boiling point [°C] 161.8 Mackay et al., 2006
161.2 BUA 038, 1989, orig.
ref.: Rathjen, 1975
Parameter Unit Value Remark Reference
496 EPIwin: group method US EPA, 2007
314 Karickhoff et al., 2007
800 20°C BUA 038, 1989, orig.
ref.: Bayer, 1987
452 MW x VP / WS
3.2.3
Behaviour in the environment
Hydrolysis of m-chlorotholuene does not occur under environmentally relevant conditions. In water, volatilisation is the main removal process. EPIwin (US EPA, 2007) indicates m-chlorotoluene as not readily biodegradable.
3.2.4
Bioconcentration and biomagnification
There are no experimental bioaccumulation data for m-chlorotoluene. The calculated bioconcentration factor is given in Table 8.
Table 8. Overview of bioaccumulation data for m-chlorotoluene.
Parameter Unit Value Remark Reference
BCF (fish) [L.kg-1] 56.53 EPIwin US EPA, 2007
122 QSAR Van Vlaardingen and Verbruggen, 2007
BMF [kg.kg-1] 1 Default value
3.2.5
Human toxicological threshold limits and carcinogenicity
The following R-phrases are assigned to m-chlorotoluene: R20, R51/53, m-chlorotoluene is not classified as being a carcinogen. For m-chlorotoluene no TDI or TCA is available.
3.3
p-Chlorotoluene
3.3.1
Identity
CH3
Cl
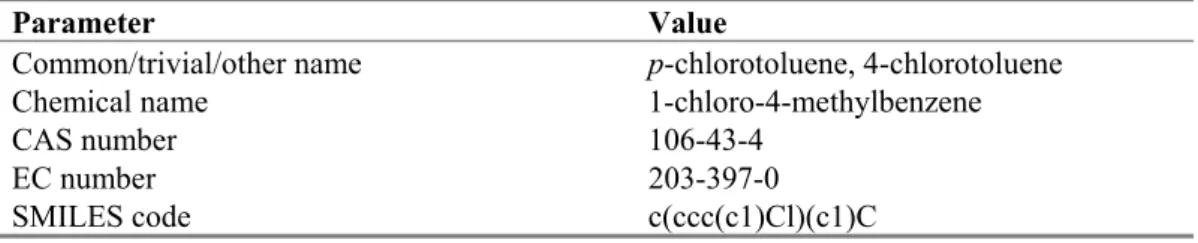
Figure 3. Structural formula of p-chlorotoluene. Table 9. Identification of p-chlorotoluene.
Parameter Value
Common/trivial/other name p-chlorotoluene, 4-chlorotoluene
Chemical name 1-chloro-4-methylbenzene
CAS number 106-43-4
EC number 203-397-0
3.3.2
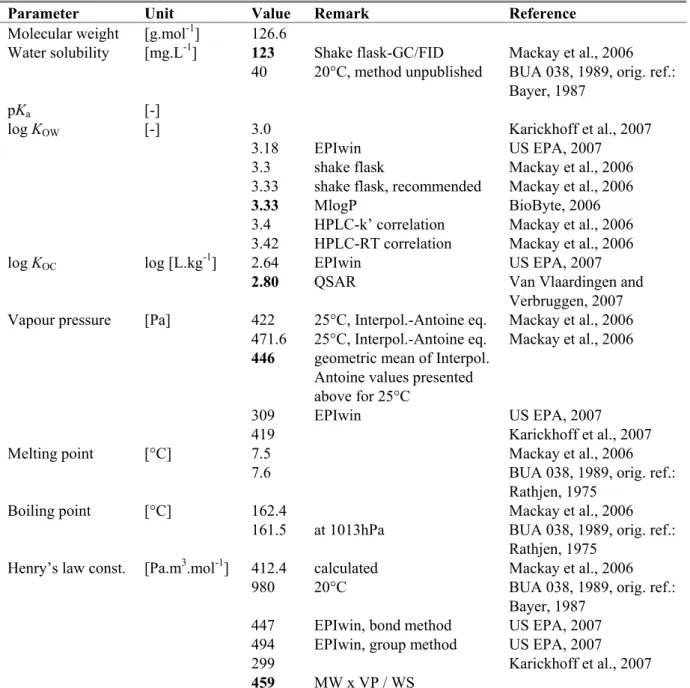
Physico-chemical properties
Table 10. Physico-chemical properties of p-chlorotoluene.
Parameter Unit Value Remark Reference
Molecular weight [g.mol-1] 126.6
Water solubility [mg.L-1] 123 Shake flask-GC/FID Mackay et al., 2006
40 20°C, method unpublished BUA 038, 1989, orig. ref.:
Bayer, 1987
pKa [-]
log KOW [-] 3.0 Karickhoff et al., 2007
3.18 EPIwin US EPA, 2007
3.3 shake flask Mackay et al., 2006
3.33 shake flask, recommended Mackay et al., 2006
3.33 MlogP BioByte, 2006
3.4 HPLC-k’ correlation Mackay et al., 2006
3.42 HPLC-RT correlation Mackay et al., 2006
log KOC log [L.kg-1] 2.64 EPIwin US EPA, 2007
2.80 QSAR Van Vlaardingen and Verbruggen, 2007
Vapour pressure [Pa] 422 25°C, Interpol.-Antoine eq. Mackay et al., 2006
471.6 25°C, Interpol.-Antoine eq. Mackay et al., 2006
446 geometric mean of Interpol. Antoine values presented above for 25°C
309 EPIwin US EPA, 2007
419 Karickhoff et al., 2007
Melting point [°C] 7.5 Mackay et al., 2006
7.6 BUA 038, 1989, orig. ref.:
Rathjen, 1975
Boiling point [°C] 162.4 Mackay et al., 2006
161.5 at 1013hPa BUA 038, 1989, orig. ref.:
Rathjen, 1975
Henry’s law const. [Pa.m3.mol-1] 412.4 calculated Mackay et al., 2006
980 20°C BUA 038, 1989, orig. ref.:
Bayer, 1987
447 EPIwin, bond method US EPA, 2007
494 EPIwin, group method US EPA, 2007
299 Karickhoff et al., 2007
459 MW x VP / WS
3.3.3
Behaviour in the environment
Hydrolysis of p-chlorotholuene does not occur under environmentally relevant conditions. In water, volatilisation is the main removal process. EPIwin (US EPA, 2007) indicates p-chlorotoluene as not readily biodegradable.
3.3.4
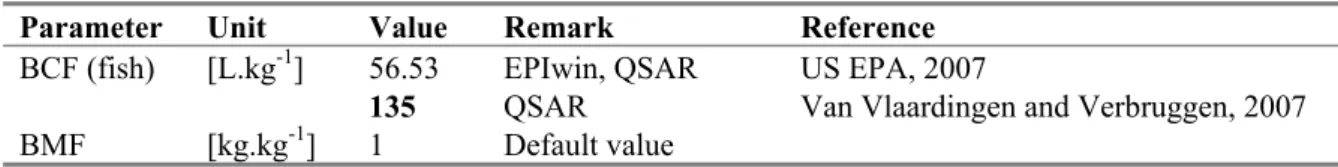
Bioconcentration and biomagnification
There are no experimental bioaccumulation data for p-chlorotoluene. The calculated bioconcentration factor is given in Table 11.
Table 11. Overview of bioaccumulation data for p-chlorotoluene.
Parameter Unit Value Remark Reference
BCF (fish) [L.kg-1] 56.53 EPIwin, QSAR US EPA, 2007
135 QSAR Van Vlaardingen and Verbruggen, 2007
BMF [kg.kg-1] 1 Default value
3.3.5
Human toxicological threshold limits and carcinogenicity
The following R-phrases are assigned to p-chlorotoluene: R20, R51/53, p-chlorotoluene is not classified as being a carcinogen. For p-chlorotoluene no TDI or TCA is available.
4
Derivation of environmental risk limits
4.1
Trigger values
This section reports on the trigger values for ERLwater derivation (as demanded in WFD framework).
Table 12. o-Chlorotoluene: collected properties for comparison to MPC triggers.
Parameter Value Unit Method/Source Derived at section
Log Kp,susp-water 1.87 log [L.kg-1] KOC × fOC,susp1 KOC: 3.1.2
BCF 161 [L.kg-1] 3.1.4 BMF 1 [kg.kg-1] 3.1.4 Log KOW 3.42 [-] 3.1.2 R-phrases 20, 51/53 [-] 3.1.5 A1 value - [µg.L-1] DW standard - [µg .L-1] 1 f
OC,susp = 0.1 kgOC.kgsolid-1(EC, 2003).
o o-chlorotoluene has a log Kp, susp-water < 3; derivation of MPCsediment is not triggered. o o-chlorotoluene has a log Kp, susp-water < 3; expression of the MPCwater as MPCsusp, water is not
required.
o o-chlorotoluene has a log Kow > 3; assessment of secondary poisoning is triggered.
o o-chlorotoluene has no R classification for which an MPCwater for human health via food (fish) consumption (MPChh food, water) needs to be derived.
Table 13. m-Chlorotoluene: collected properties for comparison to MPC triggers.
Parameter Value Unit Method/Source Derived at section
Log Kp,susp-water 1.76 log [L.kg-1] KOC × fOC,susp1 KOC: 3.2.2
BCF 122 [L.kg-1] 3.2.4 BMF 1 [kg.kg-1] 3.2.4 Log KOW 3.28 [-] 3.2.2 R-phrases 20, 51/53 [-] 3.2.5 A1 value - [µg.L-1] DW standard - [µg.L-1]
1 fOC,susp = 0.1 kgOC.kgsolid-1(EC, 2003).
o m-chlorotoluene has a log Kp, susp-water < 3; derivation of MPCsediment is not triggered. o m-chlorotoluene has a log Kp, susp-water < 3; expression of the MPCwater as MPCsusp, water is not
required.
o m-chlorotoluene has a log Kow > 3; assessment of secondary poisoning is triggered.
o m-chlorotoluene has no R classification for which an MPCwater for human health via food (fish) consumption (MPChh food, water) needs to be derived.
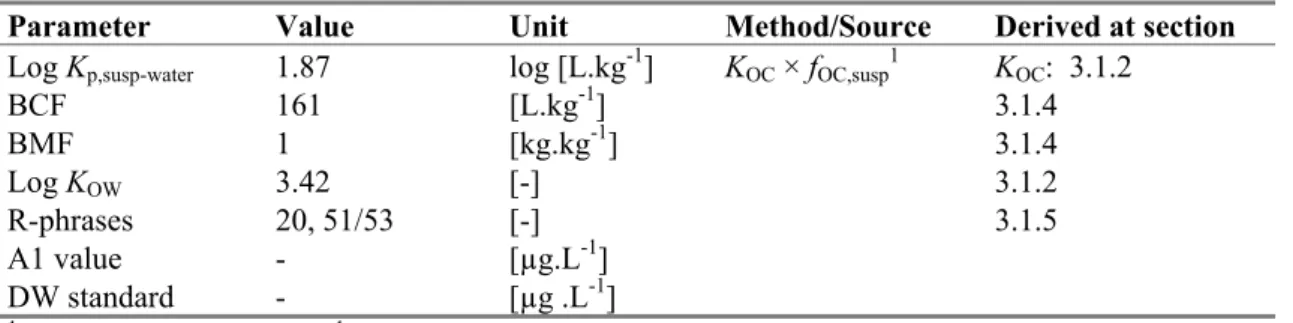
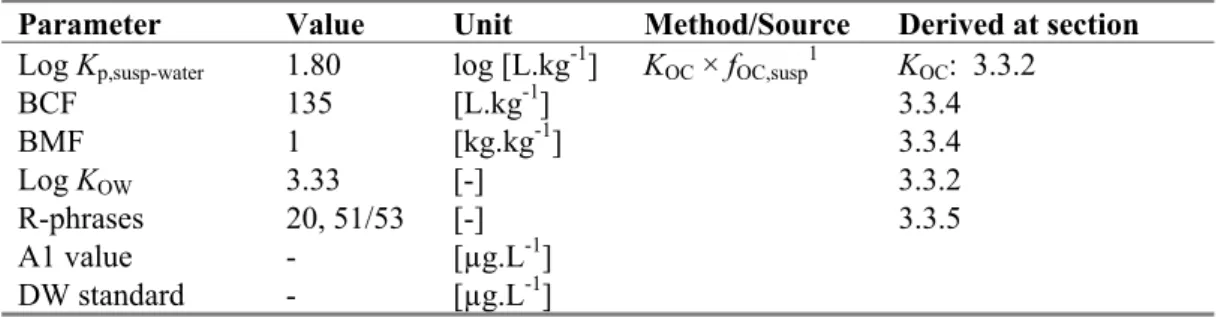
Table 14. p-Chlorotoluene: collected properties for comparison to MPC triggers.
Parameter Value Unit Method/Source Derived at section
Log Kp,susp-water 1.80 log [L.kg-1] KOC × fOC,susp1 KOC: 3.3.2
BCF 135 [L.kg-1] 3.3.4 BMF 1 [kg.kg-1] 3.3.4 Log KOW 3.33 [-] 3.3.2 R-phrases 20, 51/53 [-] 3.3.5 A1 value - [µg.L-1] DW standard - [µg.L-1]
1 fOC,susp = 0.1 kgOC.kgsolid-1(EC, 2003).
o p-chlorotoluene has a log Kp, susp-water < 3; derivation of MPCsediment is not triggered. o p-chlorotoluene has a log Kp, susp-water < 3; expression of the MPCwater as MPCsusp, water is not
required.
o p-chlorotoluene has a log Kow > 3; assessment of secondary poisoning is triggered.
o p-chlorotoluene has no R classification for which an MPCwater for human health via food (fish) consumption (MPChh food, water) needs to be derived.
4.2
Aquatic compartment
4.2.1
Aquatic toxicity data
Detailed toxicity data for all chlorotoluenes are tabulated in Appendix 2. No complete basesets (algae, Daphnia, fish) are available for the respective isomers. Considering the datasets, ERLs cannot be derived for the individual compounds. Based on the valid studies, the data indicate, however, that there are no large differences in toxicity between the three substances. For example, for the crustacean,
o-chlorotoluene has a NOEC value of 0.14 mg.L-1 and p-chlorotoluene has NOEC values of
0.32 mg.L-1, 0.56 mg.L-1 and 1 mg.L-1. Also, the difference between log Kow of the three isomers is at most 0.14. Assuming that the mechanism of toxicity is narcosis, this small difference in log Kow supports the observation of similar toxicity for the three isomers. It should be noticed that there is very little data for m-chlorotoluene and therefore we cannot be absolutely certain that the toxicity of this isomer is indeed similar to that of the other two isomers. m-Chlorotoluene is however produced in minor amounts as compared to the other two isomers. As indicated in section 1.3, the isomeric mixtures produced consists mainly of o-, and p-chlorotoluene and the concentration of m-chlorotoluene in the environment is therefore also expected to be much lower than that of the other two isomers. If the toxicity of the m-isomer would be higher as compared to the other two isomers, this would then be of limited influence on the total toxicity of the isomeric mixture in the environment. Therefore it is considered justified that all data for the three substances are pooled to derive one set of environmental risk limits which applies to the total concentration of the three isomers. An overview of the selected freshwater toxicity data for the chlorotoluenes is given in Table 15. Only limited reliable marine toxicity data have been collected (Table 16). Unbounded values are also presented in Table 15. These values are only indicative of relative insensitivity of a tested taxon and are not used for derivation of the ERLs.
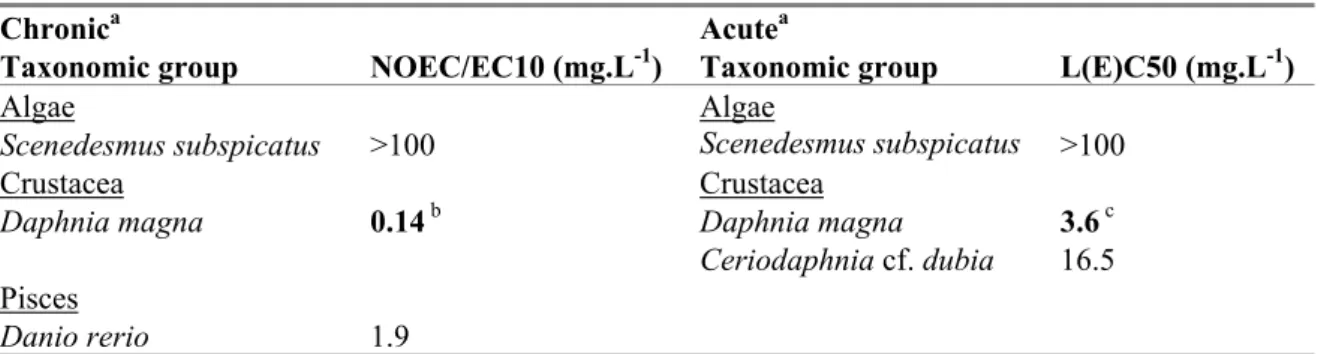
Table 15. Chlorotoluene: selected freshwater toxicity data for ERL derivation.
Chronica Acutea
Taxonomic group NOEC/EC10 (mg.L-1) Taxonomic group L(E)C50 (mg.L-1)
Algae Algae
Scenedesmus subspicatus >100 Scenedesmus subspicatus >100
Crustacea Crustacea
Daphnia magna 0.14 b Daphnia magna 3.6 c
Ceriodaphnia cf. dubia 16.5
Pisces
Danio rerio 1.9
a For detailed information see Appendix 2. Bold values are used for ERL-derivation. b Lowest 21 d NOEC
c Lowest 48 h LC50
Table 16 Chlorotoluene: selected marine toxicity data for ERL derivation.
Chronica Acutea
Taxonomic group NOEC/EC10 (mg.L-1) Taxonomic group L(E)C50 (mg.L-1)
Bacteria
Vibrio fischeri 5.7 a
a Geometric mean of 6.34, 4.92 and 5.92 mg.L-1.
4.2.2
Treatment of fresh- and saltwater toxicity data
Only limited reliable marine data are available therefore freshwater and marine data are pooled for ERL derivation.
4.2.3
Mesocosm studies
No mesocosm studies are available for chlorotoluenes.
4.2.4
Derivation of MPC
waterand MPC
marine4.2.4.1 MPCeco, water and MPCeco, marine
There is no complete reliable base set of L/EC50 values, but the absence of an acute LC50 for fish is compensated for by the chronic NOEC. The trophic level of the lowest LC50 is included in the trophic levels of the NOEC/EC10s and there are three NOECs representing three trophic levels (algae,
Daphnia and fish). Therefore an assessment factor of 10 is applied to the lowest value of 0.14 mg.L-1
for Daphnia magna. The MPCeco, water is: 0.14 / 10 = 0.014 mg.L-1 = 14 µg.L-1
Based on the same arguments as for the MPCeco, water, the MPCeco, marine is derived with a factor of 100 on the NOEC of 0.14 mg.L-1 for D. magna. There are no additional marine species to reduce the assessment factor, because Vibrio fischeri has the same life form and feeding strategy as freshwater bacteria. Therefore the MPCeco, marine is 1.4 µg.L-1.
4.2.4.2 MPCsp, water and MPCsp, marine
The chlorotoluenes have log Kow values > 3, thus assessment of secondary poisoning is triggered. To derive the MPCsp, water the NOEL of 20 mg.kgbw-1.day-1 for o-chlorotoluene as given in section 3.1.5 for a three months repeated dose study can be converted into a NOEC using a conversion factor. Since
no age of the animals was given, the lower conversion factor of 10 is used as a worst case scenario. This approach gives a NOEC of 200 mg.kgfood. This NOEC can be extrapolated to an MPCoral, mammal using an assessment factor of 90 for a three months study: 200 / 90 = 2.22 mg.kgfood-1. With the BCF of 161 L.kg-1 and BMF1 of 1 for o-chlorotoluene, the final MPCsp, water is: 2.22 / (161 * 1) = 0.014 mg.L-1 = 14 µg.L-1.
The MPCsp, marine is derived with an extra BMF2. Since the log Kow is lower than 4.5 the BMF2 is 1. Therefore the MPCsp, marine is equal to the MPCsp, water: 14 µg.L-1.
4.2.4.3 MPChh food, water
Derivation of MPChh food, water for the chlorotoluenes is not triggered (Table 12, Table 13, and Table 14).
4.2.4.4 Selection of the MPCwater and MPCmarine
The MPCsp, water and the MPCeco, water have the same value, therefore, the MPC water is 14 µg.L-1 The lowest MPCmarine is the MPCeco, marine: 1.4 µg.L-1
4.2.5
MPC
dw, waterNo A1 value or DW standard are available for the chlorotoluenes. With the TDI for o-chlorotoluene of 0.02 mg.kgbw-1day-1 an MPCdw, water, provisional can be calculated with the following formula:
MPCdw, water, provisional = 0.1.TLhh.BW / Uptakedw where the TLhh is the TDI, BW is a body weight of 70 kg, and uptakedw is a daily uptake of 2 L. The MPCdw, water, provisional becomes: 0.1 * 0.02 * 70 / 2 = 0.07 mg.L-1 = 70 µg.L-1.
4.2.6
Derivation of MAC
ecoThe MACeco is based on the lowest L(E)C50 value available. Assuming that the chronic NOEC for fish is indicative that fish are not the most sensitive species group, there is a complete base set, a known mode of action and the most sensitive species is included in the dataset. Therefore, an assessment factor of 10 is applied. It should also be noted that the acute to chronic ratio of 26 for Daphnia is quite high. There are currently no data to further analyse this observation. The MACeco is: 3.6 mg.L-1/10 = 0.36 mg.L-1 = 360 µg.L-1.
The MACeco, marine is set a factor of 10 lower than the MACeco, water because there are no additional marine species to reduce the assessment factor. Vibrio fischeri has the same life form and feeding strategy as freshwater bacteria and is therefore not considered as an additional marine species. The MACeco, marine is 36 µg.L-1.
4.2.7
Derivation of NC
The NCwater is set a factor of 100 lower than the MPCwater: 0.14 µg.L-1. The NCmarine is: 0.014 µg.L-1.
4.2.8
Derivation of SRC
eco, waterFor calculation of the SRCeco, water, the geometric mean of the acute and chronic water toxicity data in Table 15 and 16 has been calculated. Unbounded values (<) have not been used for this calculation. The geometric mean of the acute data divided by 10 is 0.70 mg.L-1 which is higher than the geometric mean of the chronic data of 0.52 mg.L-1. Therefore, the SRC
eco, water is 0.52 mg.L-1 = 5.2 x 10² µg.L-1. The SRCeco, water is valid for the freshwater and the marine environment.
4.3
Sediment
The log Kp, susp-water values of the chlorotoluenes are below the trigger value of 3, therefore, ERLs are not derived for sediment.
4.4
Soil
4.4.1
Soil toxicity data
No suitable experimental data on toxicity to soil organisms are available for the chlorotoluenes.
4.4.2
Derivation of MPC
soil4.4.2.1 MPCeco, soil
The MPCeco, soil is calculated from the MPCeco, water using the equilibrium partitioning method (van Vlaardingen and Verbruggen, 2007). For this calculation the geometric mean of the log Koc for o-, m-, and p-chlorotoluene is used (2.81). For the Henry constant, the value of 362 Pa.m3.mol-1 is selected since this is the only experimentally derived value. The calculated MPCeco, soil is 0.54 mg.kgdwt-1 = 5.4 x 10² µg.kgdwt-1, based on Dutch standard soil.
4.4.2.2 MPChuman, soil
The MPChuman, soil is based on the TDI of 0.02 mg.kgbw-1 for o-chlorotoluene (see section 3.1.5). Since the TDI is for o-chlorotoluene, the physico-chemical parameters for o-chlortoluene have been used for this calculation. Specific human intake routes are allowed to contribute to 10% of the human
toxicological threshold limit. Four different routes contributing to human exposure have been considered: consumption of leafy crops, root crops, mild and meat (see INS-guidance section 3.3.6). Uptake via root crops was determined to be the critical route. The MPChuman, soil is calculated to be 0.42 mg.kgdwt-1 = 4.2 x 10² µg.kgdwt-1, based on Dutch standard soil.
4.4.2.3 Selection of the MPCsoil
The lowest MPCsoil is the MPChuman, soil: 0.42 mg.kgdwt-1Dutch standard soil. Thus the MPCsoil is 0.42 mg.kg-1.
4.4.3
Derivation of NC
soilThe NC is set a factor of 100 lower than the MPC. The NCsoil is 4.2 µg.kgdwt-1 for Dutch standard soil.
4.4.4
Derivation of SRC
eco, soilSince no toxicity data are available for the soil compartment the SRCeco, soil has been calculated from the SRCeco, water using equilibrium partitioning. The SRCeco, soil is 20 mg.kgdwt-1.
4.5
Groundwater
4.5.1
Derivation of MPC
gw4.5.1.1 MPCeco, gw
Since groundwater-specific ecotoxicological information is absent, the derived ERLs for surface water based on ecotoxicological data are taken as substitute. Thus, MPCeco, gw = MPCeco, water = 14 µg.L-1.
4.5.1.2 MPChuman, gw
The MPCdw,water, provisional is 0.07 mg.L-1. This value is lower than the MPCeco, gw, therefore an MPChuman, gw should be derived from the MPCdw,water, provisional. As described in section 2.2 water treatment is currently not taken into account. Therefore the MPChuman, gw = MPCdw, water = MPCdw,water, provisional : 0.07 mg.L-1 = 70 mg.L-1.
4.5.1.3 Selection of the MPCgw
The final MPCgw is the lowest MPCgw derived, the MPCeco, gw of 14 µg.L-1.
4.5.2
Derivation of NC
gwThe NC is set a factor 100 lower than the MPCgw: 0.14 µg.L-1.
4.5.3
Derivation of SRC
eco, gwThe SRCeco, gw is set equal to the SRCeco, water: 0.52 mg.L-1 = 5.2 x 10² µg.L-1.
4.6
Air
4.6.1
Derivation of MPC
eco, airSince no data on the ecotoxicity of monochlorobenzenes are available, no MPCeco, air can be derived.
4.6.2
Derivation of MPC
human, airThe MPChuman, air is set at the same value as the TCA derived by Rademaker et al. (1993): 775 µg.m-3.
4.6.3
Selection of MPC
airThe only available value of the routes included is the MPChuman, air (775 µg.m-3). Therefore, the MPCair for the chlorotoluenes is 775 µg.m-3 = 7.8 x 10² µg.m-3.
4.6.4
Derivation of NC
airThe MPCair divided by 100 is the NCair: 7.8 µg.m-3.
4.7
Comparison of the derived ERLs with monitoring data
Monitoring data for o-chlorotoluene presented by the Dutch Association of River Water Companies (RIWA; www.riwa.org) as well as by the Dutch Ministry of Transport, Public Works and Water
Management (VenW; www.waterstat.nl) do not show any occasion where the concentration of o-chlorotoluene exceeded the detection level of 0.01-0.03 µg.L-1 over the years 2001 – 2007. For the other chlorotoluenes, no monitoring data are available. On the basis of the data for o-chlorotoluene it can be concluded that the ERLs derived in this report, which are all higher than the detection limit, will most likely not be exceeded either.
5
Conclusions
In this report, the risk limits Negligible Concentration (NC), Maximum Permissible Concentration (MPC), Maximum Acceptable Concentration for ecosystems (MACeco), and Serious Risk
Concentration for ecosystems (SRCeco) are derived for the total of o-chlorotoluene, m-chlorotoluene and p-chlorotoluene in water, groundwater, soil and air. No risk limits were derived for the sediment compartment because the trigger to derive such limits is not reached.
The ERLs derived, are based on a pooled dataset and, since they are sum values, apply to the total of chlorotoluenes discussed in this report. The ERLs were obtained are summarised in the table below.
Table 17. Derived sum MPC, NC, MACeco, and SRCeco values for o-, m-, and p-chlorotoluene.
ERL Unit MPC NC MACeco SRCeco
Fresh water a µg.L-1 14 0.14 3.6 x 10² 5.2 x 10²
Drinking water b µg.L-1 70 n.a. n.a. n.a.
Marine water µg.L-1 1.4 0.014 36 5.2 x 10²
Soil µg.kgdwt-1 4.2 x 10² 4.2 n.a. 2.0 x 10⁴
Groundwater µg.L-1 14 0.14 n.a. 5.2 x 10²
Air µg.m-3 7.8 x 10² 7.8 n.a. n.a.
a From the MPC
eco, water, MPCsp, water and MPChh, food, water the lowest one is selected as the ‘overall’ MPCwater. b The exact way of implementation of the MPC
dw, water in the Netherlands is at present under discussion. Therefore, the
MPCdw, water is presented as a separate value in this report.
References
Bayer. 1987. Interne messungen der Bayer AG: Wasserlosilichkeit und Dampfdruck van o- und
p-Chlortoluol. Interneberechnungen der Bayer AG: log Pow und Henry-Konstante. Leverkusen:
Bayer AG.
Biobyte. 2006. Bio-Loom for Windows Biobyte Corp., Claremont, USA.
BUA 038. 1989. Chlorotoluenes. Basel, GDCh (Gesellschaft Deutscher Chemiker)-Advisory Committee on existing chemicals of environmental relevance. BUA Report 38.
European Commission (Joint Research Centre). 2003. Technical Guidance Document in support of Commission Directive 93/67/EEC on Risk Assessment for new notified substances, Commission Regulation (EC) No 1488/94 on Risk Assessment for existing substances and Directive 98/9/EC of the European Parliament and of the Council concerning the placing of biocidal products on the market. Part II. Ispra, Italy: European Chemicals Bureau, Institute for Health and Consumer Protection. Report no. EUR 20418 EN/2.
ICBR. 2007. Rijnstoffenlijst 2007. International Commission for the Protection of the Rhine. Report no 161nl.
IUCLID. 2000. Datasheet for chlorotoluene. European Chemicals Bureau.
Karickhoff SW, Carreira LA, Hilal SH. 2007. SPARC on-line calculator. version 3.1. http://ibmlc2.chem.uga.edu/sparc/index.cfm: US EPA, University of Georgia.
Klimisch H-J, Andreae M, Tillmann U. 1997. A systematic approach for evaluating the quality of experimental toxicological and ecotoxicological data. Reg. Toxicol. Pharmacol. 25, 1-5.
Lepper P. 2005. Manual on the Methodological Framework to Derive Environmental Quality Standards for Priority Substances in accordance with Article 16 of the Water Framework Directive
(2000/60/EC). 15 September 2005 (unveröffentlicht) ed. Schmallenberg, Germany: Fraunhofer-Institute Molecular Biology and Applied Ecology.
Ma JHY, Hung H, Shiu WY, Mackay D. 2001. Temperature dependence of the aqueous solubility of selected chlorobenzenes and chlorotoluenes. J. Chem. Eng. Data 46, 619–622.
Mackay D, Shiu WY, Ma KC. 2006. Physical-chemical properties and environmental fate. Handbook. Second edition ed. Chapman and Hall/ CRCnetBase.
OECD-SIDS. 2000. 2-Chlorotoluene. UNEP publications, Paris.
Rademaker BC, Guinee EP, Van de Plassche EJ. 1993. Derivation of preliminary maximum permissible concentrations of volatile compounds in air. Bilthoven, the Netherlands: National Institute for Public Health and the Environment (RIVM). Report no. 679101009.
Rathjen H. 1975. Chlorkohlenwasserstoffe, aromatische, kernchlorierte. Ullmanns Encyklopädie der technischen Chemie. Weinheim: Verlag Chemie. p. 509-515.
Slooff W, Bont PFH, Hesse JM, Van der Poel P. 1996. Exploratory report chlorotoluenes. Bilthoven, the Netherlands: National Institute for Public Health and the Environment (RIVM). Report no. 601503004.
Staudinger J, Roberts PV. 2001. A critical compilation of Henry’s law constant temperature
dependence relations for organic compounds in dilute aqueous solutions. Chemosphere 44, 561– 576.
US EPA. 2007. EPI Suite™. version 3.2. Washington, DC, U.S.A.: U.S. Environmental Protection Agency (EPA) Office of Pollution Prevention Toxics and Syracuse Research Company (SRC). Van de Plassche EJ, Polder MD, Canton JH. 1993. Derivation of maximum permissible concentrations
for several volatile compounds for water and soil. Bilthoven, the Netherlands: National Institute for Public Health and the Environment (RIVM). Report no. 679101008.
Van Vlaardingen PLA, Verbruggen EMJ. 2007. Guidance for the derivation of environmental risk limits within the framework of the project ‘International and National Environmental Quality
Standards for Substances in the Netherlands’ (INS). Bilthoven, the Netherlands: National Institute for Public Health and the Environment (RIVM). Report no. 601782001.
VROM. 2004. Regeling milieukwaliteitseisen gevaarlijke stoffen oppervlaktewateren. Staatscourant 22 December 2004, no. 247.
Appendix 1. Detailed aquatic toxicity data
Table A1.1. Acute toxicity of o-chlorotoluene to freshwater organisms.Species Species properties Analysed Test
type Substance purity Test water pH Temp. Hardness CaCO3
Exp
time Criterion Test endpoint Value Ri Notes Reference
[°C] [mg.L-1] [mg.L-1]
Algae
Scenedesmus subspicatus strain 8681 SAG,
10000/ml N Sc am 8 24 72h EC50 growth >100 2 1 Kühn and Pattard, 1990
Crustacea
Daphnia magna <24 h, 0.315-0.630 mm N S tw 7.6-7.7 20-22 286 24 h EC50 immobility 74 3 4 Bringmann and Kühn, 1977b
Daphnia magna <24 h, Strauss, IRCHA N S am 8.0±0.2 20 250.2 24 h EC50 immobility 41 3 4 Bringmann and Kühn, 1982
Daphnia magna <24 h, IRCHA N Sc - am 8.0±0.2 25±1 250 24 h LC50 mortality 20 3 2 Kühn et al., 1989
Daphnia magna <24 h, 0.315-0.630 mm N S tw 7.6-7.7 20-22 286 24 h EC0 immobility 46 3 4 Bringmann and Kühn, 1977b
Daphnia magna <24 h, Strauss, IRCHA N S am 8.0±0.2 20 250.2 24 h EC0 immobility 19 3 4 Bringmann and Kühn, 1982
Daphnia magna <24 h, IRCHA N Sc - am 8.0±0.2 25±1 250 24 h LC0 mortality 9 3 2 Kühn et al., 1989
Pisces
Leuciscus idus melanotus N S - tw 7--8 20±1 255 48 h LC50 mortality 78 3 3,4 Juhnke and Lüdemann, 1978
Leuciscus idus melanotus N S - tw 7--8 20±1 255 48 h LC0 mortality 11 3 3,4 Juhnke and Lüdemann, 1978
1 solubility limit
2 photoperiod 9:15 light:dark with fluorescent light 3 test according to Mann, 1976
Table A1.2. Acute toxicity of m-chlorotoluene to freshwater organisms.
Species Species properties Analysed Test
type Substance purity Test water pH Temp. Hardness CaCO3 Exp time Criterion Test endpoint
Value Ri Notes Reference
[°C] [mg.L-1] [mg.L-1]
Pisces
Poecilia reticulata 2-3 month old N R am 22 25 7 d LC50 mortality 18 3 1 Könemann, 1981
1 covered with glass
Table A1.3. Acute toxicity of p-chlorotoluene to freshwater organisms.
Species Species properties Analysed Test
type Substance purity Test water pH Temp. Hardness CaCO3
Exp time Criterion Test
endpoint
Value Ri Notes Reference
[°C] [mg.L-1[ [mg.L-1]
Crustacea
Daphnia magna < 48 h Y S am 22±1 100 48 h EC50 immobility 3.6 2 1 Hermens et al., 1984
Daphnia magna 48 h EC50 immobility 2.5 4 2 Dearden et al., 2000
Ceriodaphnia cf. dubia < 24 h Y Sc >97% 7.7 23±1 65.2 48 h EC50 immobility 16.5 2 4 Rose et al., 1998
Daphnia carinata < 24 h Y S 20±1 48 h EC50 immobility 1.11 4 2,4 Khalil, 1998 in Warne, 1999
Pisces
Pimephales promelas LC50 mortality 5.9 4* 2 Dearden et al., 2000
Poecilia reticulata 2-3 month old N R am 22 25 14 d LC50 mortality 5.9 3 3 Könemann, 1981
Pimephales promelas 7-14 d LC50 mortality 5.9 4* 2 Zhao et al., 1993
1 test according to NEN 6501. 6502 2 cited in reference
3 covered with glass
Table A1.4. Acute toxicity of o-chlorotoluene to marine organisms. Species Species properties Analysed Test type Substance purity Test water
pH Temperature Salinity Exp time
Criterion Test endpoint Value Ri Notes Reference
[°C] [‰] [mg.L-1]
Bacteria
Vibrio fischeri 30 min EC50 bioluminescense 4.7 2 1 Sixt et al., 1995
Vibrio fischeri S am 5-8 20 5 min EC50 bioluminescense 5.92 2 1,2 Casseru, 1985 in Kaiser and Ribo, 1988
Vibrio fischeri S am 5-8 20 15 min EC50 bioluminescense 6.06 2 1,2 Casseru, 1985 in Kaiser and Ribo, 1988
Crustacea
Nitocra spinipes N S nw 7.8 10 or 21 7 96h LC50 45 3 3,4 Bengtsson and Tarkpea, 1983
Pisces
Alburnus alburnus N S nw 7.8 20-22 7 96h LC50 7.8 3 4 Bengtsson and Tarkpea, 1983
1 cited in reference
2 freshly reconstituted bacterial medium 3 temperature not clear in description 4 static test, not closed and not measured
Table A1.5. Acute toxicity of m-chlorotoluene to marine organisms.
Species Species
properties Analysed Test type Substance purity Test water pH Temperature Salinity Exp time Criterion Test endpoint Value Ri Notes Reference
[°C] [‰] [mg.L-1]
Crustacea
Nitocra spinipes N S nw (filtered) 7.8 10 or 21 7 96h LC50 25 3 1,2 Bengtsson and Tarkpea, 1983
1 temperature not clear in description 2 static test, not closed and not measured
Table A1.6. Acute toxicity of p-chlorotoluene to marine organisms. Species Species properties Analysed Test type Substance purity
Test water pH Temp. Salinity Exp
time
Criterion Test endpoint Value Ri Notes Reference
[°C] [(‰] [mg.L-1]
Bacteria
Vibrio fischeri 30 min EC50 bioluminescense 6.5 2 1 Sixt et al., 1995
Vibrio fischeri N S 20 15 min EC50 bioluminescense 17 2 4 Zhao et al., 1993
Vibrio fischeri S am 5-8 20 5 min EC50 bioluminescense 6.34 2 1,2 Casseru, 1985 in Kaiser and Ribo, 1988
Vibrio fischeri S am 5-8 20 15 min EC50 bioluminescense 7.28 2 1,2 Casseru, 1985 in Kaiser and Ribo, 1988
Vibrio fischeri S am 5-8 15 5 min EC50 bioluminescense 4.92 2 1 Kaiser et al., 1985, in Kaiser and Ribo, 1988
Vibrio fischeri S am 5-8 15 15 min EC50 bioluminescense 5.79 2 1 Kaiser et al., 1985, in Kaiser and Ribo, 1988
Vibrio fischeri S am 5-8 15 30 min EC50 bioluminescense 7.28 2 1 Kaiser et al., 1985, in Kaiser and Ribo, 1988
Crustacea
Nitocra spinipes N S nw (filtered) 7.8 10 or 21 7 96h LC50 15 3 3,4 Bengtsson and Tarkpea, 1983
1 cited in reference
2 freshly reconstituted bacterial medium 3 temperature not clear in description 4 static test, not closed and not measured
Table A1.7. Chronic toxicity of o-chlorotoluene to freshwater organisms. Species Species properties Analysed Test type Substance purity Test water pH Temp. Hardness CaCO3 Exp time
Criterion Test endpoint Value Ri Notes Reference
[°C] [mg.L-1] [mg.L-1]
Bacteria
Pseudomonas putida N Sc am 7.0 25 81.2 16 h NOEC growth 15 3 1,2,9,10 Bringmann and Kühn, 1977a, 1979, 1980b
Cyanophyta
Microcystis aeruginosa N Sc am 7.0 27 55 8 d NOEC growth 31 3 1,2,3,9,10 Bringmann and Kühn, 1978a,b
Protozoa
Chilomonas paramaecium N Sc am 6.9 20 74.6 48 h NOEC growth >40 3 1,4,10 Bringmann et al., 1980
Entosiphon sulcatum Stein N Sc am 6.9 25 75.1 72 h NOEC growth >80 3 1,4,10 Bringmann, 1978, Bringmann and Kühn, 1979, 1980b
Uronema parduczi Chatton-Lwoff N Sc am 6.9 25 75.1 20 h NOEC growth >80 3 1,4,10 Bringmann and Kühn, 1980a
Algae
Scenedesmus quadricauda N Sc am 7.0 27 55 8 d NOEC growth >100 3 1,3,10 Bringmann and Kühn, 1977a, 1978a,b, 1979, 1980b
Scenedesmus subspicatus N Sc am 7.7-9.3 24 72h EC10 growth >100 2 Kuhn and Pattard, 1990
Crustacea
Daphnia magna <24 h, IRCHA Y R - am 8.0±0.2 25±1 250 21 d NOEC reproduction and app.
first offspring 0.27 3 6,7 Kühn et al., 1989
Daphnia magna <24 h, IRCHA Y R - am 8.0±0.2 25±1 250 21 d NOEC reproduction and app.
first offspring 0.14 2 6,5 Kühn et al., 1989
1 toxicity threshold is used as a NOEC 2 NOEC reported as TGK
3 light intensity 2800 lm; pH not adjusted 4 1.5*104 cells.mL-1
5 value based on measured concentrations 6 photoperiod 9:15 light:dark with fluorescent light
7 nominal concentration; analysed concentration < 80% of the nominal concentration; renewal three times a week 8 value is the average of the two values reported for Kuhn et al. (1989)
9 TGK = Toxische Grenzkonzentration; defined as concentration where 3-5% inhibition occurs 10 dilution ranges not prepared properly
Table A1.8. Chronic toxicity of m-chlorotoluene to freshwater organisms.
Table A1.9. Chronic toxicity of p-chlorotoluene to freshwater organisms.
Species Species
properties Analysed Test type Substance purity Test water pH Temp. Hardness CaCO3
Exp
time Criterion Test endpoint Value Ri Notes Reference
[°C] [mg.L-1] [mg.L-1]
Crustacea
Daphnia magna < 24 h Y R am 19±1 16 d EC50 reproduction 0.58 2 1,3 Hermens et al., 1984
Daphnia magna < 24 h Y R am 19±1 16 d NOEC reproduction 0.32 2 1,3 Hermens et al., 1984
Daphnia magna < 24 h Y R am 19±1 16 d LC50 mortality 1.6 2 1,3 Hermens et al., 1984
Daphnia magna < 24 h Y R am 19±1 16 d NOEC mortality 1 2 1,3 Hermens et al., 1984
Daphnia magna < 24 h Y R am 19±1 16 d EC50 growth 1.7 2 1,3 Hermens et al., 1985
Daphnia magna < 24 h Y R am 19±1 16 d NOEC growth 0.32 2 1,3 Hermens et al., 1985
Daphnia magna < 24 h Y R am 19±1 16 d EC50 reproduction 1.3 2 1,3 De Wolf et al., 1988
Daphnia magna < 24 h Y R am 19±1 16 d NOEC reproduction 0.56 2 1,3 De Wolf et al., 1988
Daphnia magna < 24 h Y R am 19±1 16 d NOEC growth 0.32 2 1,3 De Wolf et al., 1988
Pisces
Danio rerio 24 h old eggs Y R 99 rw 7.4-8.4 210 28 d NOEC growth+hatch 1.9 2 2 Van Leeuwen et al., 1990
1 DSW used
2 renewal 3 times a week; concentrations were measured just before and after renewal, results given as mean measured concentration (60% of nominal) 3 value based on nominal concentration, measured concentration between 80% and 110% of nominal
Appendix 2. Detailed terrestrial toxicity data
Table A2.1. Toxicity of o-chlorotoluene to terrestrial organisms.Species Species
properties Soil type Analysed Substance purity pH o.m. Clay T Exp. time Criterion Test endpoint Result test soil Result std. Soil Ri Notes Reference
[%] [%] [°C] [mg.kgdw-1] [mg.kgdw-1]
Macrophyta
Avena sativa N 14 d EC50 biomass 89 4 1,2 OECD-SIDS 2000
Brassica rapa N 14 d EC50 biomass >1000 4 1,2 OECD-SIDS 2000
1 result based on nominal concentration
Appendix 3. References used in the appendices
Bengtsson B-E, Tarkpea M. 1983. The acute aquatic toxicity of some substances carried by ships. Mar Pollut Bull 14: 213-214.
Bringmann G. 1978. Investigation of biological harmful effects of chemical substances which are classified as dangerous for water on protozoa. Z.Wasser-Abwasser-Forsch. 11: 210-215. Bringmann G, Kühn R. 1977a. Limiting Values for the Damaging Action of Water Pollutants to
Bacteria (Pseudomonas putida) and Green Algae (Scenedesmus quadricauda) in the Cell Multiplication Inhibition Test. Z.Wasser-Abwasser-Forsch. 10: 87-98.
Bringmann G, Kühn R. 1977b. Results of the Damaging Effect of Water Pollutants on Daphnia magna. Z.Wasser-Abwasser-Forsch. 10: 161-166.
Bringmann G, Kühn R. 1978a. Limiting Values for the Noxious Effects of Water Pollutant Material to Blue Algae (Microcystis aeruginosa ) and Green Algae (Scenedesmus quadricauda). Vom Wasser 50 : 45-60.
Bringmann G, Kühn R. 1978b. Testing of Substances for Their Toxicity Threshold: Model Organisms
Microcystis (Diplocystis) aeruginosa and Scenedesmus quadricauda.
Mitt.Int.Ver.Theor.Angew.Limnol. 21: 275-284.
Bringmann G, Kühn R. 1979. Comparison of Toxic Limiting Concentrations of Water Contaminants Toward Bacteria, Algae and Protozoa in the Cell-Growth Inhibition Test. G.I.Haustechnik Bauphysik Umwelttech 100: 249-252.
Bringmann G, Kühn R. 1980a. Determination of the Biological Effect of Water Pollutants in Protozoa. II. Bacteriovorous Ciliates. Z.Wasser-Abwasser-Forsch. 13: 26-31.
Bringmann G, Kühn R. 1980b. Comparison of the Toxicity Thresholds of Water Pollutants to Bacteria, Algae, and Protozoa in the Cell Multiplication Inhibition Test. Water Res. 14: 231-241.
Bringmann G, Kühn R. 1982. Results of Toxic Action of Water Pollutants on Daphnia magna Straus Tested by an Improved Standardized Procedure. Z.Wasser-Abwasser-Forsch. 15: 1-6.
Bringmann G, Kühn R, Winter A. 1980. Determination of the Biological Effect From Water Pollutants to Protozoa. III. Saprozoic Flagellates. Z.Wasser-Abwasser-Forsch. 13: 170-173.
De Wolf W, Canton JH, Deneer JW, Wegman RCC, Hermens JLM. 1988. Quantitative structure-activity relationships and mixture-toxicity studies of alcohols and chlorohydrocarbons:
reproducibility of effects on growth and reproduction of Daphnia magna. Aquat. Toxicol. 12: 39-49.
Dearden JC, Cronin MTD, Zhao Y-H, Raevsky OA. 2000. QSAR studies of compounds acting by polar and non-polar narcosis: an examination of the role of polarisability and hydrogen bonding. Quant. Struct.-Act. Relat. 19: 3-9.
Hermens J, Canton H, Janssen P, de Jong R. 1984. Quantitative structure-activity relationships and toxicity studies of mixtures of chemicals with anaesthetic potency: Acute lethal and sublethal toxicity to Daphnia magna. Aquat. Toxicol. 5: 143-154.
Hermens J, Broekhuyzen E, Canton H, Wegman R. 1985. Quantitative structure activity relationships and mixture toxicity studies of alcohols and chlorohydrocarbons: effects on growth of Daphnia
magna. Aquat. Toxicol. 6: 209-17.
Juhnke I, Lüdemann D. 1978. Results of the Investigation of 200 Chemical Compounds for Acute Fish Toxicity with the Golden Orfe Test. Z.Wasser-Abwasser-Forsch. 11: 161-164.
Kaiser KLE, Ribo JM. 1988. Photobacterium phosphoreum toxicity bioassay. II. Toxicity data compilation . Toxic Assess Internat J 3: 195-237.
Khalil M. 1998 Modelling the toxicity of non-polar narcotics to Daphnia carinata by using quantitative structure-activity relationships. MSc thesis, University of Technology Sydney, Australia.