The Netherlands
RIVM letter report 2020-0003 R.C. Sprong et al.
Colophon
© RIVM 2020
Parts of this publication may be reproduced, provided acknowledgement is given to the: National Institute for Public Health and the Environment, and the title and year of publication are cited.
DOI 10.21945/RIVM-2020-0003 R.C. Sprong (author), RIVM
A.D. van den Brand (author), RIVM N.G.F.M. van der Aa (author), RIVM B.M. van de Ven (author), RIVM A.S. Bulder (author), RIVM Contact:
Corinne Sprong
Department of Food Safety corinne.sprong@rivm.nl
This investigation was performed by order, and for the account, of the Ministry of Public Health, Welfare and Sports, within the framework of the program 5.1
This is a publication of:
National Institute for Public Health and the Environment, RIVM
P.O. Box1 | 3720 BA Bilthoven The Netherlands
Synopsis
Combined exposure to nitrate and nitrite via food and drinking water in The Netherlands
People ingest nitrate and nitrite via food and drinking water. These substances occur naturally in fruit and vegetables and drinking water can become polluted with them. Nitrate and nitrite may, furthermore, be added to meat products and cheese as preservatives.
In the human body, nitrate can be partially converted into nitrite, which can be harmful to human health. This is why the quantity of nitrate ingested has to be added to the nitrite ingested to produce the ‘combined intake’.
RIVM has estimated this combined intake for the Dutch population for the first time. This estimate indicates that the combined intake of nitrate and nitrite may be higher than desirable, but there is insufficient data available to be able to ascertain exactly how high it is.
People primarily ingest nitrate and nitrite via vegetables (mostly leaf vegetables) and fruits. Vegetables and fruits contain a lot of healthy substances and the positive effect of these substances on health is greater than the potentially harmful effects of nitrite, so there is no reason to eat less vegetables and fruits.
To be able to make better calculations, more data is needed on nitrate and/or nitrite in vegetables and fruits. And on nitrate and nitrite that occur naturally in meat rather than being added artificially. It is,
moreover, important to know more about the degree to which nitrate in the human body is converted into nitrite.
There are options to keep the intake of nitrate and nitrite as low as possible: to keep the nitrate concentrations in drinking water and drinking water sources as low as possible, and to reduce the maximum permitted levels of these substances as preservatives.
Keywords: nitrate, nitrite, preservative, food additive, contaminant, combined exposure, dietary exposure
Publiekssamenvatting
Gecombineerde blootstelling aan nitraat en nitriet via voedsel en drinkwater in Nederland
Mensen krijgen nitraat en nitriet binnen via voedsel en via drinkwater. Deze stoffen komen van nature voor in groente en fruit. Drinkwater kan met deze stoffen zijn vervuild. Ook mogen nitraat en nitriet als
conserveermiddel worden toegevoegd aan vleesproducten en kaas. Nitraat kan het in het lichaam deels worden omgezet in nitriet. Nitriet kan schadelijk zijn voor de gezondheid. Daarom moet de hoeveelheid nitraat die we binnenkrijgen, worden opgeteld bij die van nitriet. Dit heet een gecombineerde inname.
RIVM heeft voor het eerst deze gecombineerde inname geschat voor de Nederlandse bevolking. Deze schatting wijst er op dat de gecombineerde inname van nitraat en nitriet hoger is dan gewenst. Er zijn echter niet genoeg gegevens beschikbaar om vast te stellen hoe hoog deze inname precies is.
Mensen krijgen vooral nitraat en nitriet binnen via groente (het meest via bladgroenten) en fruit. Groente en fruit bevatten veel goede stoffen. Het effect van de goede stoffen op de gezondheid is groter dan de mogelijk slechte effecten van nitriet. Er is daarom geen reden om minder groente en fruit te eten.
Om een betere berekening te kunnen maken, moeten er meer gegevens komen voor nitraat en/of nitriet in groente en fruit. En ook voor nitraat en nitriet in vlees waaraan deze stoffen niet zijn toegevoegd maar van nature aanwezig zijn. Daarnaast is het belangrijk meer te weten over de mate waarin nitraat in het lichaam wordt omgezet wordt naar nitriet. Er zijn mogelijkheden om de inname van nitraat en nitriet zo laag mogelijk te houden: het zo laag mogelijk houden van het nitraatgehalte in drinkwater en drinkwaterbronnen en het verlagen van de toegestane hoeveelheden van deze stoffen als conserveermiddel.
Kernwoorden: nitraat, nitriet, conserveermiddel, voedseladditief, contaminant, gecombineerde blootstelling, blootstelling via voeding
Contents
1 Summary — 9
2 Introduction — 13
3 Summary of methods used — 15 4 Summary of results — 17
4.1 Mean exposure estimates — 17
4.2 Main contributors to exposure — 18
4.3 Nitrosamine formation — 18
5 Additional analysis of the main contributors to the exposure — 21 5.1 Contaminants — 21 Fruits — 25 Sensitivity analysis — 25 5.2 Drinking water — 28 5.3 Food additives — 28
6 Possible refinement options and mitigation measures — 33
6.1 Contaminants — 33
6.2 Drinking water — 34
6.3 Food additives — 35
7 Conclusions and recommendations — 37
7.1 Conclusions — 37
7.2 Recommendations for refinement of exposure assessment — 37
7.3 Options for reduction of exposure — 37
8 Acknowledgements — 39
9 References — 41
10 Appendix A Contribution of food categories, sub categories and individual foods to the combined exposure of nitrate and nitrite. — 45
1
Summary
The human population is exposed to nitrate and nitrite from different dietary sources that naturally contain these compounds (e.g. vegetables and fruits), drinking water and foods to which nitrate and nitrite can be added as food additives (preservatives), such as meat products and cheese.
In food products and in the human body, nitrate can be converted to nitrite, which can cause adverse effects by increasing the formation of methemoglobin. High levels of methemoglobin in blood can result in a reduced oxygen transport to tissues. Additionally, exposure to nitrite can result in the formation of nitrosamines in the gastrointestinal tract. Some of these nitrosamines are classified as probably, or highly likely carcinogenic to humans.
To assess the total exposure to nitrite, the conversion of nitrate to nitrite has to be taken into account (combined exposure). Therefore, the nitrate exposure was expressed as nitrite equivalents, using the median (0.023) of a range of conversion factors for the conversion of nitrate to nitrite in the body (0.008-0.07) and taking into account the uncertainty around this median conversion factor.
RIVM performed a combined exposure assessment of nitrate and nitrite from all dietary sources, including drinking water, for the Dutch
population aged 1-79 years at the request of the Ministry of Public Health, Welfare and Sports. Since nitrate concentrations in drinking water vary between different regions, RIVM performed an exposure assessment using different scenarios regarding the concentration of nitrate in drinking water:
• National annual mean scenario: A scenario using the national mean concentration of nitrate and nitrite in drinking water (4.7 mg/nitrate ion/L and 0.005 mg nitrite ion/L).
• Regional high nitrite scenario: A scenario using the national mean nitrate concentration (4.7 mg nitrate ion/L) and the highest regional mean nitrite concentration in drinking water (0.03 mg nitrite ion/L).
• Regional high nitrate scenario: A scenario using the highest regional mean nitrate concentration in drinking water (35 mg nitrate ion/L) and the national mean nitrite concentration (0.005 mg nitrite ion/L).
• Worst case scenario: A scenario using the legal limit for nitrate in drinking water (50 mg nitrate ion/L) and the national mean nitrite concentration in drinking water(0.005 mg nitrite ion/L). This scenario was added as in some regions the nitrate
concentration in drinking water may equal the legal limit in the future due to fertilisation practices.
The results of the combined exposure assessment were used to define options for refining future exposure assessments of nitrate and nitrite and possible risk mitigation measures.
The mean combined exposure to nitrate and nitrite (expressed as nitrite-equivalents) exceeded the acceptable daily intake (ADI) of nitrite of 0.07 mg/L with at least a factor 1.4 in all scenarios and for all
populations.
The scenario using the national mean concentration of nitrate and nitrite in drinking water was used for further analysis, because this scenario best reflects the actual situation for most Dutch people. It should be noted that the relative contribution of foods will be somewhat lower in the scenarios with higher nitrate or nitrite concentrations in drinking water; foods will however always remain the main contributor.
Vegetables and fruits contributed most to the mean exposure (60% in the scenarios using a nitrate concentration of 4.7 mg/L in drinking water). For some vegetables and fruits, only a limited number of measurements were available, and/or a high percentage of nitrate and nitrite concentrations were below the level of quantification, which could be partly due the use of analytical methods with a low sensitivity. In the exposure assessment, concentrations below the level of quantification were assigned values that equalled half the value of the level of quantification. Recalculations by assuming that these vegetables and fruits had a concentration of zero (sensitivity analysis) showed that about half of the contribution of vegetables and fruits was explained by these nitrite concentrations for which high uncertainty exists. This introduced uncertainty around the combined exposure and the contribution of vegetables and fruits to the combined exposure. Other contributions of foods in which nitrate and nitrite occur as contaminants to the combined exposure were: grains (5%), tubers (5%), milk and milk products (2%), fish and fish products (1%), and nuts and seeds (0.2%). Unprocessed meat and meat products to which no nitrate and nitrite were added as food additives contributed 15% to the exposure. The occurrence data for these foods probably included the higher concentrations of meat products to which nitrate and nitrite were added as food additives, due to incorrect coding of foods in the
occurrence database of the European Food Safety Authority (EFSA). For example a cured sausage could have been coded as pork in the
occurrence database. This could have led to an overestimation of the exposure assessment and as such to an overestimation of the
contribution of contaminants to this exposure assessment.
The contribution of drinking water varied from 3% for the scenario in which the nitrate concentration in drinking water equalled the annual country mean value, to 14% in regions with a high nitrate concentration in drinking water. The high nitrate concentrations occur mostly in
groundwater in sandy regions with large inputs of nitrogen because of intensive agricultural practice in the previous decennia. In these regions, additional treatment steps in the production of drinking water are
necessary to guarantee a nitrate concentration below the drinking water limit value of 50 mg/L.
without exceeding the legal limit for drinking water, the contribution of drinking water to the combined exposure can be substantial. This underpins the importance to keep levels of nitrate in drinking water and its sources as low as possible.
The use of nitrate and nitrite as food additives contributed 9% to the total exposure. Lowering of the maximum permitted levels set for these food additives and thus the concentrations of nitrate and nitrite in food can contribute to lowering the exposure to nitrate and nitrite. Nitrate and nitrite serve a unique preserving function in foods to prevent botulism. Therefore, a total exclusion of nitrate and nitrite as food additives is as of yet not an option. Reducing the maximum permitted levels of nitrate and nitrite in meat products is however possible without impairing the microbiological safety of these products.
The largest estimated contribution to the combined exposure to nitrate and nitrite are thus from vegetables and fruits. Yet, the European Food Safety Authority (EFSA) concludes that the benefits of vegetable and fruit consumption outweigh the estimated exposure to nitrate from vegetables, which is unlikely to result in appreciable health risks. Therefore, the Netherlands Nutrition Centre does not advise to limit the consumption of vegetables. RIVM agrees with this view.
In conclusion, combined dietary exposure assessment including all relevant dietary sources and relevant scenarios for regional differences, is the preferred method to assess the risk of nitrate and nitrite.
However, due to the limitations of the data currently available, there are many uncertainties that hamper an accurate exposure assessment. The results do indicate that the combined exposure to nitrate and nitrite is of potential concern. Therefore, a refinement of the exposure assessment is recommended. This can be done with more occurrence data on nitrite in vegetables and fruits and nitrate in vegetables other than leafy vegetables and fruits, generated using more sensitive analytical
methods. In addition, better occurrence data for unprocessed meat and meat products are required. As the category products to which nitrate and nitrite were added as food additives was one of the main
contributors to the exposure, reducing the maximum permitted limits of nitrate and nitrite for their use as food additives can be a possible first mitigation option to reduce the nitrate and nitrite intake.
2
Introduction
Nitrate and nitrite are intermediates of nitrogen metabolism in plants. As such, they naturally occur in vegetables and fruits. Fertilization practices with nitrate-containing fertilizers not only increase the concentration of nitrate and nitrite in plants, but also increase their concentrations in ground water as a result of washing out from the soil. As a consequence, nitrate and nitrite can be present in drinking water. Another source of nitrate and nitrite in food are food additives. Sodium and potassium salts of nitrate and nitrite are authorized as food additives, primarily to
maintain the microbiological safety of and to preserve several types of foods.
In food products and in the human body, nitrate can be converted to nitrite, which can cause adverse effects by increasing the formation of methemoglobin. High levels of methemoglobin in blood can result in a reduced oxygen transport to tissues. Additionally, exposure to nitrite can result in the formation of nitrosamines in the gastrointestinal tract. Some of these nitrosamines are classified as probably, or highly likely
carcinogenic to humans (EFSA 2017a and EFSA 2017b).
The acceptable daily intake (ADI) for these compounds is 3.7 mg nitrate ion/kg bw/day and 0.07 mg (or 70 µg) nitrite ion/kg bw/day (SCF, 1997; EFSA, 2017b). Preferably, risk of nitrate and nitrite should be assessed based on endogenous nitrosamine formation. However, this is yet not possible, due to a lack of informative studies on nitrosamines formation and nitrite and nitrate intake. Therefore, EFSA based the ADI of nitrate and nitrite based on other available effects. The ADI for nitrite is based on a doubling of the background methemoglobin concentration. While this effect is not clinically significant, EFSA regarded doubling background hemoglobin levels as markers of exposure which increase prior to clinical manifestation of adverse effects. According to EFSA sensitive markers of exposure is an established approach and is more protective than using adversity per se (EFSA 2017b). EFSA checked the derived ADI, by calculating the amount of endogenously formed nitrosamines using available range of conversion factors and a formula proposed/established by Health Canada (Health Canada, 2013). The derived ADI did not result in a margin of exposure (MoE) larger than 10,000 for the formation of nitrosamines (EFSA 2017b). EFSA therefore concluded that the ADI is sufficiently protective. It should be noted that due to uncertainties, conservative assumptions were made (e.g. all nitrite is converted to the most toxic nitrosamines, which is physiologically not realistic), which could have resulted in a conservative ADI.
The ADI for nitrate is based on hypertrophy of the adrenal zona glomerulosa (ESFA 2017a). Ideally, the ADI of nitrate should also be based on methemoglobin formation, but insuffient data were available to do so (EFSA 2017a). For the conversion of nitrate to nitrite in the human body, a range of conversion factors is available (0.008 – 0.07). These different conversion factors were obtained from diverse and differing populations and EFSA considered that to reflect the uncertainties in the underlying data and inter-individual variability in conversion,it was
appropriate to use a range of values for the conversion percentage (ERSA 2017a). EFSA calculated what the ADI of nitrate would be using the ADI for nitrite and the available range of conversion factors. This resulted in a range of ADIs varying from 1.05 to 9.4 mg nitrate ion/kg bw/day.
Therefore EFSA concluded that previously established ADI of 3.7 mg/kg bw/day is still accurate (EFSA 2017a).
Nitrate and nitrite levels in food and drinking water are regulated by different legal frameworks: the contaminants regulation (EC No 1881/2006), the drinking water directive (Drinkwaterbesluit 2011; EU Council Directive 98/83/EC; WHO 2017) and the food additives regulation (EC No 1333/2008). Usually, risk assessment by EFSA is performed for nitrate and for nitrite within the context of a single regulation or directive, not taking into account the exposure via sources regulated in other legal frameworks. Recently, EFSA did perform the risk assessments for nitrate and nitrite from all dietary sources. EFSA noted that the intake of nitrate and nitrite from food additive use did not exceed the respective ADIs of nitrate and nitrite. However, when considering all dietary sources, the mean and highest exposure to both nitrate and nitrite for infants, toddlers and children exceeded the ADI (EFSA 2017a and EFSA 2017b).
EFSA assessed this aforementioned intake of nitrate and nitrite separately as single substances. Yet, this single substance risk assessment of nitrate and nitrite can result in an underestimation of the risk of these
substances because of the conversion of nitrate to nitrite in the human body. For a risk assessment, it is therefore appropriate to combine not only all dietary sources, like EFSA did, but also to combine the exposure of these two compounds. Such a combined exposure assessment that overarches different legal frameworks can provide risk managers with a better insight into the most effective mitigation measures.
At the request of the Dutch Ministry of Public Health, Welfare and Sport, RIVM assessed the combined exposure to nitrate and nitrite of the Dutch population (1-79 years) from all dietary sources, while accounting for uncertainties in the conversion of nitrate to nitrite. In addition, the differences in nitrate and nitrite concentration in Dutch drinking water regions were accounted for, because in a few regions, the drinking water limit was exceeded occasionally. This differed from the approach used by EFSA, that used the average nitrate and nitrite concentration in drinking water in Europe (EFSA 2017a and EFSA 2017b). We have described the combined exposure assessment for the Dutch situation in an article (van den Brand et al., 2020). In the present report, the main results and conclusions of our previous study are summarized and additional results are presented. Options for refining future exposure assessments and for mitigation measures to lower the intake are described. As mitigation options depend on the applicable legal frameworks, the results are described in accordance with these, i.e. results for
unintentionally/naturally present nitrate and nitrite in food are described under ‘contaminants’, results for nitrate and nitrite in drinking water are described under ‘drinking water’ and nitrate and nitrite intentionally added to/present in food are described under ‘food additives’.
3
Summary of methods used
1Data sources and model settings used in the combined exposure assessment of nitrate and nitrite in our publication (Van den Brand et al., 2020) are summarized in Table 1 and Table 2, respectively. Exposure was assessed using the Monte Carlo Risk Assessment tool version 8.2 (https://MCRA.rivm.nl).
Table 1. Data sources used in the combined exposure assessment of nitrate and nitritea
Input data Data source
Food consumption
data Dutch National Food Consumption Survey (2012-2016)
Occurrence data
Food KAP database years 2012-2017; EFSA opinions
nitrate and nitrite b,c
Drinking water Dutch monitoring program Rewab (years
2012-2017)
Food additives Survey in meat products from the Netherlands Food and Consumer Product Safety Authority (NVWA; 2018); EFSA opinions nitrate and nitrite EFSAb,c
Recipe data Dutch food conversion modeld
Processing factors
nitrate Literature data
e,f,g,h
Nitrate to nitrite
conversion factorh Median 0.023, range 0.008-0.07
i a van den Brand et al. (2020)
b EFSA opinion on nitrate (2017a) c EFSA opinion on nitrite (2017b) d van Dooren et al., 1995 e Leszczynski et al., 2009 f Meah et al., 1994 g Ekart et al., 2013
h Dejonckheere et al., 1994
i A conversion factor of 0.023 was used to express nitrate exposure in
nitrite-equivalents. This factor was the median of the conversion range 0.008-0.07 as established by EFSA (EFSA, 2017a).
Table 2. Model settings used in the combined exposure assessment of nitrate and nitritea
Model component Setting
Left-censored data Medium bound scenario: substitution
with half the value of the level of quantification (LOQ)
Exposure Model Chronic exposure using the logistic
normal normal (LNN) modelb, with age
as co-variable; Cumulative exposure
Uncertainty quantification 100 cycles, 10000 iterations
Food consumption data Bootstrappingc
Occurrence data Bootstrapping
Processing factors Bootstrapping
Nitrate to nitrite conversion Random sampling from distribution in each uncertainty cycled
a van den Brand et al. (2020)
b This model corrects the variation in long-term exposure between individuals for the
within individual variation (Goedhart et al., 2012)
c The bootstrapping approach resamples data (with replacement) from the original
dataset to obtain a resampled set data. This approach quantifies uncertainties due to the limited sampling size. By repeating this process many times, one obtains a large number of resampled data sets, which may be considered as alternative data sets that might have been obtained during sampling from the population of interest. In the present calculation, we performed an uncertainty analysis using 100 resample cycles with 10000 iterations.
d The uncertainty around the conversion factor of nitrate to nitrite was accounted for
by using a randomly drawn factor from the conversion factor uncertainty distribution in each of the 100 uncertainty cycles.
To address regional differences in the nitrate and nitrite concentrations in drinking water, four exposure scenarios were performed;
1. National annual mean scenario: A scenario using the national mean concentration of nitrate and nitrite in drinking water (4.7 mg/nitrate ion/L and 0.005 mg nitrite ion/L).
2. Regional high nitrite scenario: A scenario using the national mean nitrate concentration (4.7 mg nitrate ion/L) and the highest regional mean nitrite concentration in drinking water (0.03 mg nitrite ion/L).
3. Regional high nitrate scenario: A regional scenario using the highest regional mean nitrate concentration in drinking water (35 mg nitrate ion/L) and the national mean nitrite concentration (0.005 mg nitrite ion/L).
4. Worst case scenario: A scenario using the legal limit for nitrate in drinking water (50 mg nitrate ion/L) and the national mean nitrite concentration (0.005 mg nitrite ion/L) in drinking water. This scenario was added because in some regions the nitrate concentration in drinking water may equal the legal limit in the future.
4
Summary of results
This chapter summarizes our results (van den Brand et al., 2020).
4.1 Mean exposure estimates
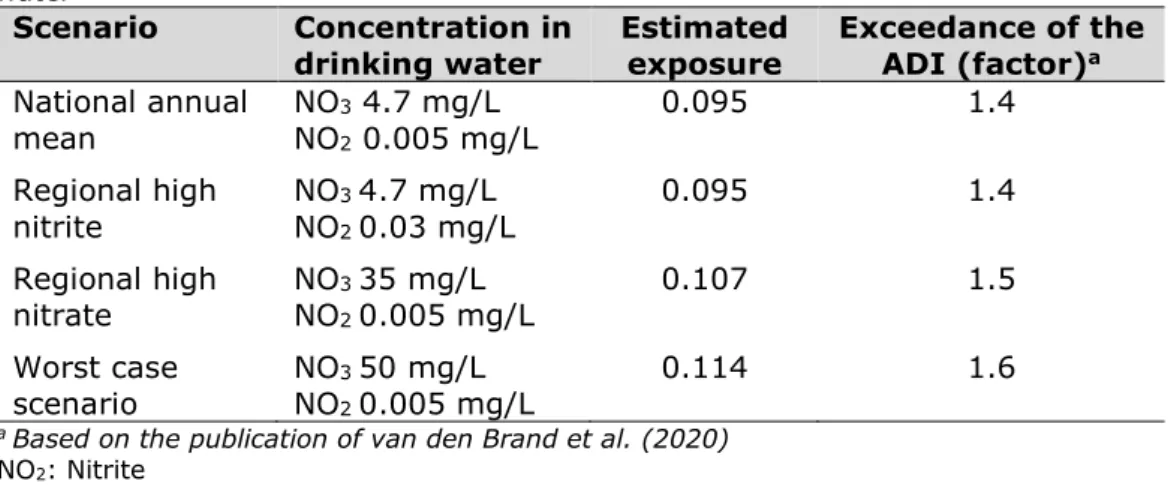
In all exposure scenarios, the mean combined exposure to nitrate and nitrite, expressed as nitrite equivalents, across the Dutch population (1-79 years), exceeded the ADI of 70 µg nitrite ion/kg bw/day. Depending on the assessment scenario the ADI was exceeded by a factor 1.4 to 1.6 (Table 3).
Table 3. Mean estimated combined exposure to nitrate and nitrite (in mg/kg bw/d) and exceedance of the acceptable daily intake (ADI) of 70 µg nitrite ion/kg bw/day by the mean combined exposure to nitrate and nitrite from all dietary sources (contaminant in food and drinking water and due to use as food additives) and across the Dutch population aged 1-79 years, obtained in four exposure scenarios differing in nitrate and nitrite concentrations in drinking water
Scenario Concentration in
drinking water Estimated exposure Exceedance of the ADI (factor)a
National annual mean NONO32 4.7 mg/L 0.005 mg/L 0.095 1.4 Regional high nitrite NONO3 2 4.7 mg/L 0.03 mg/L 0.095 1.4 Regional high nitrate NONO3 2 35 mg/L 0.005 mg/L 0.107 1.5 Worst case scenario NONO3 2 50 mg/L 0.005 mg/L 0.114 1.6
a Based on the publication of van den Brand et al. (2020) NO2: Nitrite
NO3: Nitrate
Exposure was highest in young children and decreased with age. The mean combined exposure in children aged 1 year was 248 µg nitrite ion/kg bw/day in the scenario with the national annual mean nitrate and nitrite concentration in drinking water. This exposure exceeded the ADI with a factor 3.5.
Van den Brand et al. (2020) took the uncertainty around the nitrate to nitrite conversion factor into account. The results shown in Table 3 were obtained using a conversion factor of 0.023 to express nitrate exposure in nitrite-equivalents. This factor was the median of the conversion range 0.008-0.07 as established by EFSA (EFSA, 2017a). The
uncertainty around the conversion factor is due to unknown individual variability in nitrate to nitrite conversion. In the exposure assessment of van de Brand et al. (2020), this uncertainty around the conversion factor was quantified by sampling randomly from that range in each of 100 uncertainty runs. These are runs in which the exposure is
recalculated using randomly drawn occurrence data and consumption data. This resulted in a confidence interval around the exposure
estimate. Sensitivity analysis performed by van den Brand et al. (2020) showed that the outer limits of this confidence interval were dominated by the conversion factor. This means that the lower limit of the
confidence interval may represent a group of the population with a low nitrate to nitrite conversion. Even this lower limit of exposure estimates exceeded the ADI for nitrite. It should be noted that the range of
conversion factors was wide and more research is warranted to reduce uncertainties around the conversion factor in future assessments.
4.2 Main contributors to exposure
The highest contribution of all dietary sources to the combined exposure resulted from vegetables and fruits with 41% and 18%, respectively in the scenario using the national annual mean nitrate and nitrite
concentration in drinking water. Other contributions of food in which nitrate and nitrite occurs as a contaminant were grains (5%), tubers (5%), milk and milk products (2%), fish and fish products (1%) and nuts and seeds (0.2%).
The contribution of drinking water to the combined exposure of nitrate and nitrite was 3% in the scenario with the national annual mean nitrate and nitrite concentration in drinking water. If we assume that the
concentration nitrate would equal the legal limit of nitrate in drinking water (the worst case scenario), the contribution of drinking water to the total exposure would increase to 19%. An increased nitrite concentration in drinking water only resulted in a negligible shift in contribution between the different dietary sources.
The use of nitrate and nitrite as food additives resulted in a contribution of 9% to the combined exposure in the scenario with the national annual mean nitrate and nitrite concentrations in drinking water.
Unprocessed meat and meat products in which nitrate and nitrite are not authorised as food additive contributed for approximately 15% to the combined exposure of nitrate end nitrite. We used EFSA occurrence data for those foods. EFSA explained that the high concentrations in those foods could be the result of a possible missclassification due to incorrect coding of meat products in which nitrate and nitrite are allowed as food additives (EFSA 2017a, 2017b). Literature data showed lower nitrate and nitrite concentrations in unprocessed meat and meat products without additives (Iacumin et al. 2019; Larsson et al. 2011; Temme et al. 2011; Lee 2018). Inclusion of these EFSA data could have led to an overestimation of the combined exposure and an overestimation of the contribution of contaminants to this exposure.
4.3 Nitrosamine formation
Nitrosamines can be formed endogenously upon digestion of nitrate and nitrite. Based on the highest estimated mean combined dietary exposure (0.25 mg nitrite/kg bw/day in children aged 1 year) in scenario 1
reflecting the national annual mean nitrate and nitrite concentrations in drinking water, an endogenous production of 8.4 × 10⁻⁷ mg
(BMDL10) for the most potent nitrosamine (0.027 mg
N-nitrosodimethylamine/kg bw/day for liver neoplasms) is divided by this intake, a margin of exposure (MoE) of 32.000 is obtained. An MoE above 1.000 is considered of low concern for public health (EFSA 2012). The calculated MoE for the mean and P95 intake was however less than 10.000 when considering a high conversion of nitrate to nitrite in this age group. Also, Zeilmaker et al. (2010) showed that the consumption of a nitrate-rich meal together with nitrosable amines from fish led only to a marginal increase in cancer risk due to nitrosamine formation.
5
Additional analysis of the main contributors to the exposure
In this chapter, results from a more in-depth analysis of the main contributors to the combined exposure to nitrate and nitrite are presented. This additional analysis focussed on foods driving the exposure.
The scenario using the national annual mean concentration of nitrate and nitrite in drinking water was used for the in-depth analysis, because this scenario best reflects the actual situation for the majority of the Dutch population. The annual mean is the scenario with the lowest combined exposure to nitrate and nitrite. It should be noted that, in the scenarios with higher nitrate and/or nitrite concentrations in drinking water, the contribution of foods is lower, but foods still will remain relevant sources of exposure, see Table S3 of the supplementary materials by van den Brand et al. 20202 for more information.
5.1 Contaminants
Of all food sources containing nitrate and nitrite, vegetables and fruit contributed most to the total combined exposure to nitrate an nitrite, with approximately 60% (van den Brand et al., 2020), and are therefore discussed in more detail below.
5.1.1 Vegetables
Vegetables contributed for 41% to the combined exposure to nitrate and nitrites, of which 17% can be attributed to nitrate and 24% to nitrite. Only vegetable categories with a contribution of 5% or more to the combined exposure are discussed in this section, i.e. leafy vegetables (12%), fruiting vegetables (16%) and brassica (6%). For a complete overview of vegetable categories and individual foods, see Appendix A. Leafy vegetables are known for their high nitrate content and their contribution of nitrate to the combined exposure was higher than that of nitrite (Table 4). It should be noted that the contribution of nitrite to the combined exposure via the consumption of leafy vegetables was driven by substitution of non-detect samples with a value equaling half the value of the LOQ. The LOQs ranged from 0.7 to 25.0 mg/kg (Table 5). For nitrate in leafy vegetables, the percentage of left-censored data was small (Table 6).
2 Link to supplemental data:
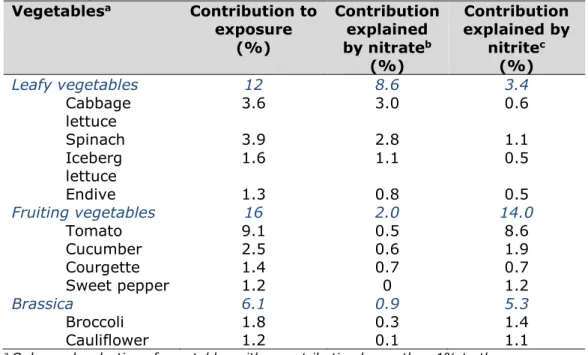
Table 4. Contribution of leafy vegetables, fruiting vegetables and brassica to the combined exposure to nitrate and nitrite.
Vegetablesa Contribution to exposure (%) Contribution explained by nitrateb (%) Contribution explained by nitritec (%) Leafy vegetables 12 8.6 3.4 Cabbage lettuce 3.6 3.0 0.6 Spinach 3.9 2.8 1.1 Iceberg lettuce 1.6 1.1 0.5 Endive 1.3 0.8 0.5 Fruiting vegetables 16 2.0 14.0 Tomato 9.1 0.5 8.6 Cucumber 2.5 0.6 1.9 Courgette 1.4 0.7 0.7 Sweet pepper 1.2 0 1.2 Brassica 6.1 0.9 5.3 Broccoli 1.8 0.3 1.4 Cauliflower 1.2 0.1 1.1
a Only a sub selection of vegetables with a contribution larger than 1% to the
combined exposure is shown.
b Part of the contribution to exposure explained by the presence of nitrate in
vegetables.
c Part of the contribution to exposure explained by the presence of nitrite in
vegetables.
Regarding fruiting vegetables, their contribution to the combined
exposure was dominated by nitrite (14%) rather than nitrate (2%; Table 4), although the nitrite concentration of vegetables was considered to be relatively low (EFSA 2008). As shown in Table 5, high uncertainty
existed for the nitrite concentration of fruiting vegetables, because the mean concentration was based on a small number of fruiting vegetables, which were all below the LOQ. Thus, the high contribution of fruiting vegetables largely depended on substitution of samples below the LOQ with a value that equals half of the value of the LOQ. Table 5 also indicates that the range of LOQs in fruiting vegetables is quite large and that the mean nitrite concentration used in the assessment was
dominated by the highest LOQ of 25 mg/kg.
The contribution of brassica to the exposure was also driven by nitrite (Table 4) and was also based on a small number of nitrite
Table 5. Number of measurements (N), percentage left-censored data, the limits of quantification (LOQ), minimum analytical value (minimum), maximum
analytical value (maximum) and mean concentrations of nitrite in vegetables
and fruits used in the assessmenta
Foodb N %
left-censored data c
LOQ
mg/kg Minimum mg/kg Maximum mg/kg Mean
d
mg/kg Leafy vegetables
Fresh spinach 42 88 0.7-22.9 < LOQ 27.5 4.2
Spinach, othere 99 65 1-40.0 < LOQ 86.5 5.7
Fresh lettuce 90 96 0.7-25.0 < LOQ 372.0 9.5
Iceberg lettuce 19 90 0.7-22.9 < LOQ 113.0 7.7
Fruiting vegetablesf 14 100 10-25.0 < LOQ < LOQ 11.4
Brassicaf 1 100 25.0 < LOQ < LOQ 12.5
Fruitf 19 84 25.0 < LOQ 2.4 2.9
a Van den Brand et al. (2020)
b Data were obtained from EFSA (2017b).
c Percentage of samples below the limit of qualification (LOQ).
d Mean concentration used in the exposure assessment as described by van den
Brand et al. (2020). Samples with a concentration below the limit of quantification (LOQ) were assigned a concentration equal to half the value of the LOQ (medium-bound).
e Preserved, frozen or deepfrozen.
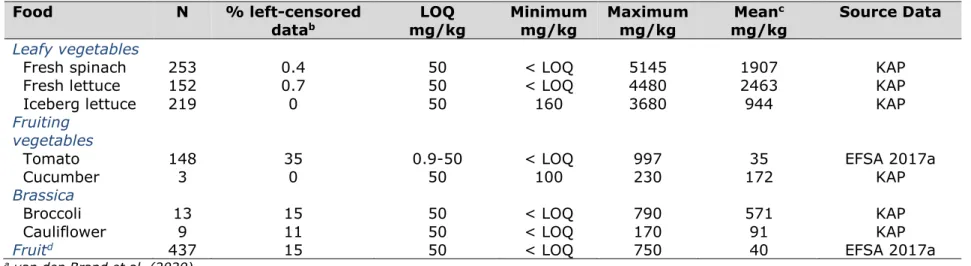
Table 6. Number of measurements (N), the percentage left-censored data, the limits of quantification (LOQ), minimum analytical value (minimum), maximum analytical value (maximum) and mean concentrations of nitrate in vegetables and fruits used in the
assessmenta
Food N % left-censored
datab mg/kg LOQ Minimum mg/kg Maximum mg/kg Mean c
mg/kg Source Data Leafy vegetables
Fresh spinach 253 0.4 50 < LOQ 5145 1907 KAP
Fresh lettuce 152 0.7 50 < LOQ 4480 2463 KAP
Iceberg lettuce 219 0 50 160 3680 944 KAP
Fruiting vegetables
Tomato 148 35 0.9-50 < LOQ 997 35 EFSA 2017a
Cucumber 3 0 50 100 230 172 KAP
Brassica
Broccoli 13 15 50 < LOQ 790 571 KAP
Cauliflower 9 11 50 < LOQ 170 91 KAP
Fruitd 437 15 50 < LOQ 750 40 EFSA 2017a
a van den Brand et al. (2020)
b Percentage of samples below the limit of quantification (LOQ).
c Mean concentration used in the exposure assessment as described by van den Brand et al. (2020). For the assessment, mean concentrations
were obtained using the middle bound scenario in which values below the LOQ are substituted with a value equal to half the value of the LOQ.
5.1.2 Fruits
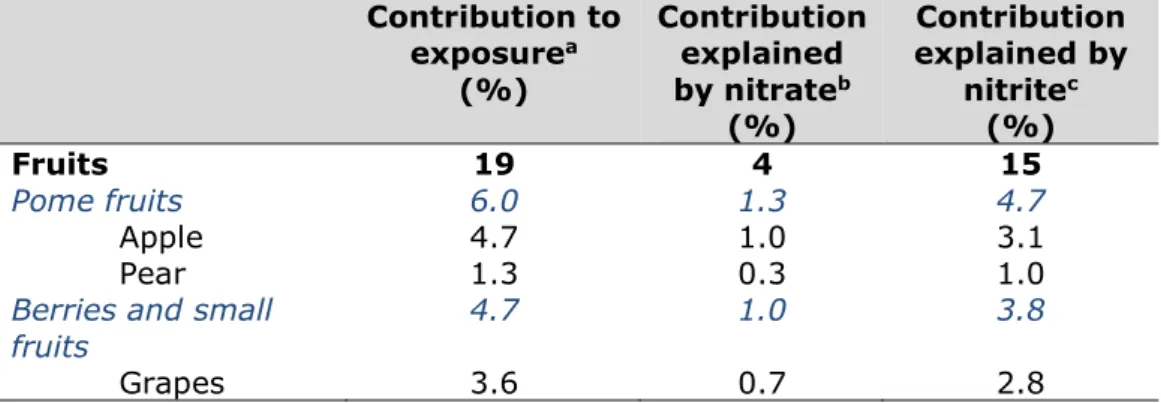
Fruits contributed for 19% to the combined exposure to nitrate and nitrite, of which 4% can be attributed to nitrate and 15% to nitrite. Pome fruits (6%; particularly apple) and berries and small fruit (5%; particularly grapes) contributed most (Table 7). Other fruit categories, such as citrus fruits, stone fruits and other types of food contributed less than 5% to the combined exposure. For more details, see Appendix A. In the exposure assessment, both nitrate and nitrite concentrations were aggregated to the fruit level and were not further specified at the product level (Table 5 and 6). It should be noted that Boon et al. (2009) and Geraets et al. (2014) reported a large variation in nitrate
concentrations in specific fruits (e.g. nitrate concentrations in orange of 0.2 mg/kg, in apple of 33 mg/kg, in grapes of 41 mg/kg, in strawberry of 133 mg/kg and in papaya of 400 mg/kg). Aggregated concentrations of nitrate and nitrite at the fruit level therefore introduced uncertainty in the exposure assessment.
The contribution of nitrite to the combined exposure is larger than that of nitrate (Table 7). The mean nitrite concentration in fruits is based on a small sample size (n=19) with a large percentage of left-censored data (Table 5). This also introduced an uncertainty around the concentration of nitrite in fruits, which subsequently contributed to uncertainty in nitrite exposure due to fruits.
Table 7. Contribution of pome fruits and berries and small fruits to the combined exposure to nitrate and nitrite
Contribution to exposurea (%) Contribution explained by nitrateb (%) Contribution explained by nitritec (%) Fruits 19 4 15 Pome fruits 6.0 1.3 4.7 Apple 4.7 1.0 3.1 Pear 1.3 0.3 1.0
Berries and small
fruits 4.7 1.0 3.8
Grapes 3.6 0.7 2.8
a Only a sub selection of vegetables with a contribution larger than 1% to the
combined exposure is shown.
b Part of the contribution to exposure explained by the presence of nitrate in fruits. c Part of the contribution to exposure explained by the presence of nitrite in fruits.
5.1.3 Sensitivity analysis
The additional analysis of the results, as described in the previous two sections, showed that the nitrite contributions of the risk drivers fruiting vegetables, brassica and fruit (together contributing for about 30% to the combined exposure) are based on a limited number of samples of which a large percentage is below the LOQ. Thus, the contribution of these food categories was driven by substitution of left-censored data with a value that equals half of the value of the limit of quantification. LOQs could be as high as 25 mg/kg, whereas much lower LOQs were also reported for leafy vegetables (e.g. 0.7 mg/kg; Table 2).
A sensitivity analysis was performed to study the impact of the use of these uncertain data in the combined exposure assessment. For this, lower bound mean nitrate and nitrite concentrations were used for fruiting vegetables, brassica and fruits in the exposure assessment. When using lower bound concentrations, left-censored data are assumed to have a concentration of 0 mg/kg. Exposure estimates were calculated for the scenario using the average national mean concentration of nitrate and nitrite in drinking water (4.7 mg/nitrate ion/l and 0.005 mg nitrite ion/l). Figure 1 shows the outcome of this sensitivity analysis for the mean and P95 exposure, expressed as a fraction of the ADI. In the sensitivity analysis, the exposure estimates were reduced by a factor 1.5 (Figure 1). This means that the exposure estimated by van den Brand et al. (2020) could have been overestimated by up to a factor 1.5 if the real concentrations in non-detect samples had been zero. Nonetheless, also when assuming that these samples do not contain nitrite, the mean exposure of 1-10 year olds still exceeded the ADI between 1.8-fold and 1.fold in this analysis. The mean exposure of the whole population 1-79 year olds only exceeded the ADI (2-fold) when assuming a high conversion from nitrite to nitrite (upper part of the error bars in Figure 1). All P95 estimates were still above the ADI.
In this sensitivity analysis, vegetables contributed about 30% to
exposure, meat in which food additives are not allowed 22%, fruit 11%, food additive use 14% and drinking water 4%. For unprocessed meat and meat products in which food additives are not allowed, the occurrence data as reported by EFSA was used in this study (EFSA 2017a and 2017b). These concentrations were however more in line with levels reported in processed meat (van den Brand et al., 2020). This may be a consequence of misclassification of these products, or incorrect coding of analytical data. This uncertainty can result in a potential overestimation of the actual exposure by unprocessed meat and meat products. It may also have led to an overestimation of the total exposure.
Figure 1. Results of the sensitivity analysis of the impact of uncertain risk drivers fruiting vegetables, brassica and fruits on the combined exposure to nitrate and nitrite. The blue line represents the exposure estimates obtained with the scenario using the average national mean concentration of nitrate and nitrite in drinking water (4.7 mg/nitrate ion/L and 0.005 mg nitrite ion/L). The red line represents the results of the sensitivity analysis using the same scenario, but with a different assumption for the concentration of nitrate and nitrite in
samples below the limit of quantification (0 in stead of half the value of the limit of quantification). The combined exposure to nitrate and nitrite is expressed as the percentage of the acceptable daily intake (ADI) of nitrite of 0.07 mg/kg. The green line indicates exposure at the ADI. Bullet points represent results obtained with a median nitrate to nitrite conversion of 0.023. Upper bars represent the upper confidence interval, reflecting a high nitrate to nitrite conversion, lower bars represent the lower confidence interval, reflecting low nitrate to nitrite conversion. 0 100 200 300 400 500 600 1 10 20 30 40 50 60 70 79 Ex po su re ex pr es sed a s p er cen ta ge of t he ADI age (years)
Mean exposure
national mean scenario sensitivity analysis exposure at ADI 0 150 300 450 600 750 900 1 10 20 30 40 50 60 70 79 Ex po su re ex pr es sed a s p er cen ta ge of t he ADI age (years)
P95 exposure
national mean scenario sensitivity analysis exposure at ADI
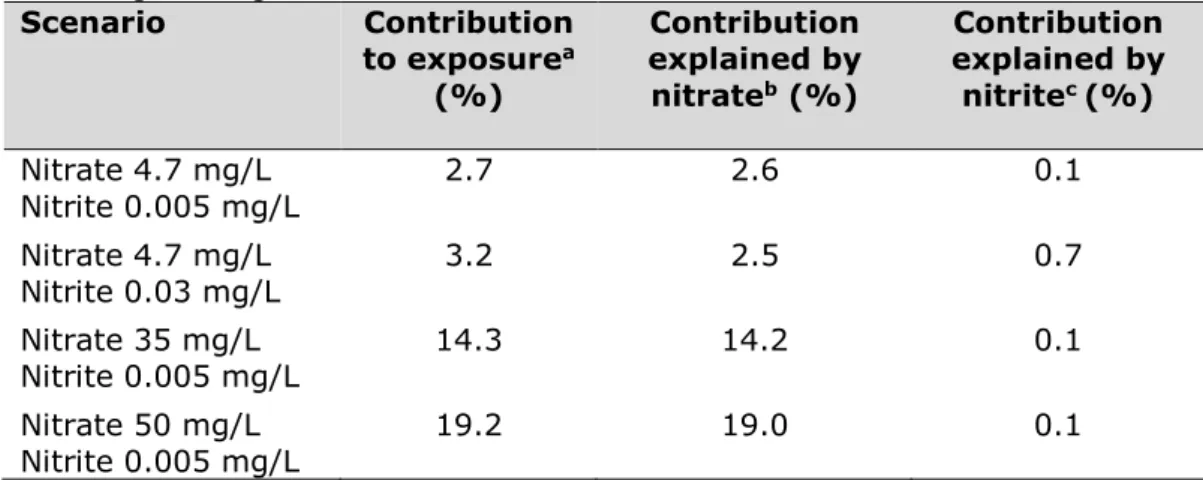
5.2 Drinking water
Table 8 shows that the total combined exposure to nitrate and nitrite by drinking water is dominated by the nitrate concentration in drinking water.
Table 8. Contribution of drinking water to the combined exposure to nitrate and nitrite estimated from all dietary sources for the four different scenarios
concerning drinking water
Scenario Contribution to exposurea (%) Contribution explained by nitrateb (%) Contribution explained by nitritec (%) Nitrate 4.7 mg/L Nitrite 0.005 mg/L 2.7 2.6 0.1 Nitrate 4.7 mg/L Nitrite 0.03 mg/L 3.2 2.5 0.7 Nitrate 35 mg/L Nitrite 0.005 mg/L 14.3 14.2 0.1 Nitrate 50 mg/L Nitrite 0.005 mg/L 19.2 19.0 0.1
a Contribution of both nitrate and nitrite in drinking water to the combined exposure
to nitrate and nitrite.
b Part of the contribution to exposure explained by nitrate. c Part of the contribution to exposure explained by nitrite. 5.3 Food additives
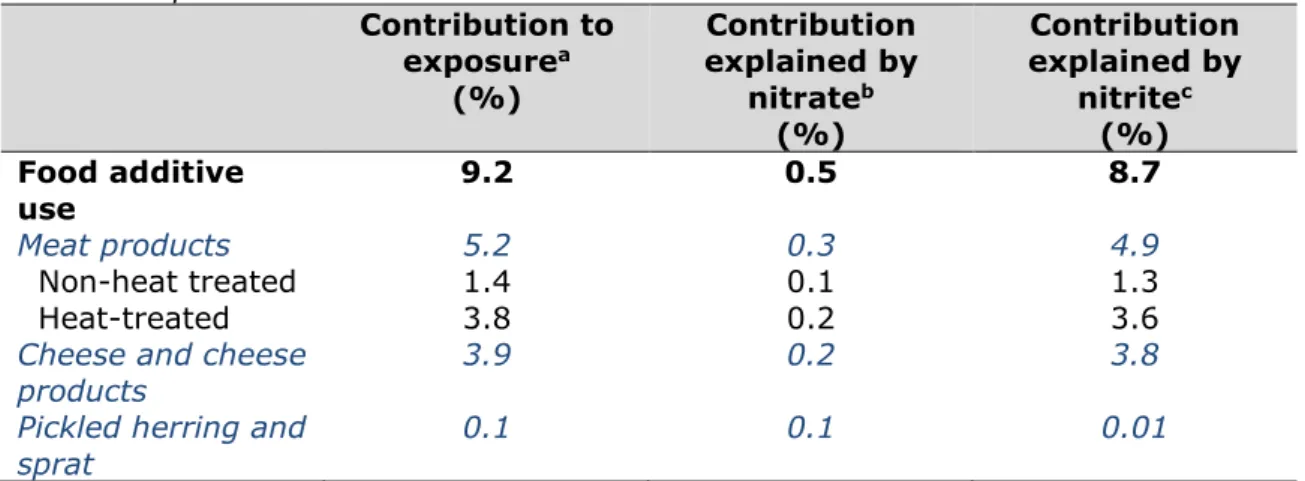
The contribution from food additive use to the total combined exposure to nitrate and nitrite from all dietary sources was 9%. Nitrite dominated the contribution from food additives (Table 9). The highest contribution of food additive use is accounted for by the meat products category, of which heat-treated meat products (predominantly sausages, ham and paté) contributing more than non-heat treated meat products (dry sausages and bacon; Table 9). The second main contributor to combined exposure was ‘cheese and cheese products’ (particularly Gouda 48+, data not shown). Although only nitrate is authorized for use as a food additive in cheese, also nitrite is measured in cheese (Table 10), most likely due to in situ nitrate to nitrite conversion.
Table 9. Contribution of nitrite and nitrate from food additive use to the combined exposure of nitrate and nitrite
Contribution to exposurea (%) Contribution explained by nitrateb (%) Contribution explained by nitritec (%) Food additive use 9.2 0.5 8.7 Meat products 5.2 0.3 4.9 Non-heat treated 1.4 0.1 1.3 Heat-treated 3.8 0.2 3.6
Cheese and cheese
products 3.9 0.2 3.8
Pickled herring and
sprat 0.1 0.1 0.01
a Only a sub selection of vegetables with a contribution larger than 1% to the
combined exposure is shown.
b Part of the contribution to exposure explained by the presence of nitrate in
vegetables.
c Part of the contribution to exposure explained by the presence of nitrite in
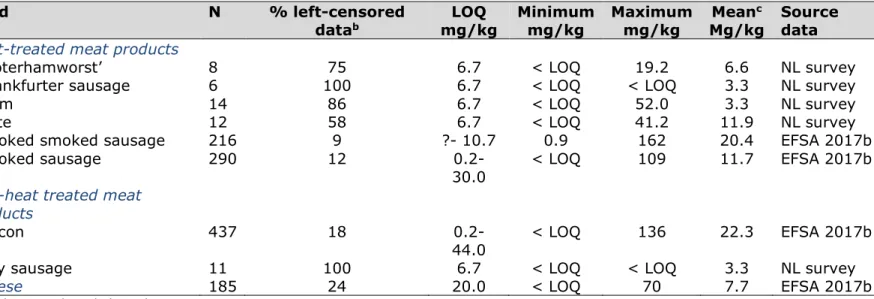
Table 10. Number of measurements (N), the percentage left-censored data, the limits of quantification (LOQ) minimum analytical value (minimum), maximum analytical value (maximum) and mean concentrations of nitrite in meat products and cheese used in the assessmenta
Food N % left-censored
datab mg/kg LOQ Minimum mg/kg Maximum mg/kg Mean c
Mg/kg Source data Heat-treated meat products
‘Boterhamworst’ 8 75 6.7 < LOQ 19.2 6.6 NL survey
Frankfurter sausage 6 100 6.7 < LOQ < LOQ 3.3 NL survey
Ham 14 86 6.7 < LOQ 52.0 3.3 NL survey
Pate 12 58 6.7 < LOQ 41.2 11.9 NL survey
Cooked smoked sausage 216 9 ?- 10.7 0.9 162 20.4 EFSA 2017b
Cooked sausage 290 12
0.2-30.0 < LOQ 109 11.7 EFSA 2017b
Non-heat treated meat products
Bacon 437 18
0.2-44.0 < LOQ 136 22.3 EFSA 2017b
Dry sausage 11 100 6.7 < LOQ < LOQ 3.3 NL survey
Cheese 185 24 20.0 < LOQ 70 7.7 EFSA 2017b
a van den Brand et al. (2020).
b Percentage of samples below the limit of quantification.
c Mean concentration used in the exposure assessment as described by van den Brand et al. (2020). For the assessment, mean concentrations
were obtained using the middle bound scenario in which values below the LOQ are substituted with a value equal to half the value of the LOQ.
Table 11. Number of measurements (N), the percentage left-censored data, the limits of quantification (LOQ), minimum analytical value (minimum), maximum analytical value (maximum) and mean concentrations of nitrate in meat products and cheese used in the
assessmenta
Food N %
left-censored datab mg/kg LOQ Minimum mg/kg Maximum mg/kg Mean c
Mg/kg Source data Heat-treated meat products
‘Boterhamworst’ 8 13 7.4 < LOQ 22.1 12.8 NL survey
Frankfurter sausage 6 33 7.4 < LOQ 25.2 12.7 NL survey
Ham 14 86 7.4 < LOQ 216.7 19.2 NL survey
Pate 12 0 7.4 15.2 51.1 29.2 NL survey
Cooked smoked sausage 214 1 1-40.1 < LOQ 155.0 52.9 EFSA
2017b Cooked sausage (fresh an
lightly cooked) 189 21 ?-54.0 < LOQ 130.0 37.3 2017b EFSA
Non-heat treated meat products
Bacon 910 6 1-220.0 < LOQ 240.0 53 EFSA
2017b
Dry sausage 11 27 7.4 < LOQ 98.5 29.1 NL survey
Cheese 348 14 0.1-110.0 < LOQ 80.9 19.9 EFSA
2017b
a van den Brand et al. (2020)
b Percentage of samples below the limit of quantification
c Mean concentration used in the exposure assessment as described by van den Brand et al. (2020). For the assessment, mean concentrations
6
Possible refinement options and mitigation measures
The most important result of the combined exposure assessment for nitrate and nitrite is that mean lifelong exposure of the Dutch population aged 1-79 years exceeded the ADI of nitrite with approximately 1.4 fold in the scenario using the national mean concentrations of nitrate and nitrite in drinking water (van den Brand et al., 2020). The additional sensitivity analysis described in the present report (section 5.1.3), however indicated that combined exposure could have been
overestimated by a factor 1.5 due to the likely overestimation of the exposure from vegetables and fruits. Despite this, the ADI was still exceeded in children, adolescents and high consumers when it was assumed that samples with a concentration below the LOQ had the value of zero. However, due to these and other uncertainties in the exposure assessment, we cannotdraw firm conclusions regarding the risk of the combined exposure assessment. The results do indicate that the combined exposure of nitrate and nitrite potentially exceeds the ADI. Therefore, possibilities for the refinement of the exposure
assessment and reduction of the exposure following from the results are presented for all dietary sources.
6.1 Contaminants
The combined exposure to nitrate and nitrite from dietary sources, excluding drinking water and food additive use, was highest for vegetables and fruits. EFSA concluded in its opinion on nitrate in
vegetables, that the estimated exposures to nitrate from vegetables are unlikely to result in appreciable health risks and concluded that the recognized beneficial effect of the consumption of vegetables and fruits prevails (EFSA 2008). Also, the Netherlands Nutrition Centre does currently not advice to limit the consumption of nitrate-rich vegetables (Voedingscentrum, 2014). RIVM agrees with this view.
The results from the additional analysis described in section 5.1.3 showed that contributions of some risk driving vegetables and fruits are based on uncertain nitrate and nitrite concentrations in fruit and nitrite concentrations in vegetables (predominantly leafy vegetables, brassica and fruiting vegetables), due to a limited number of measurements, a high percentage of values below the level of quantification (left-censored data) and the use of analytical methods with a low sensitivity. Given these uncertainties and the fact that the estimated exposure to nitrate and nitrite exceeds the ADI, it is necessary to refine the exposure assessment. Given the findings in the sensitivity analysis, our suggestions to refine the exposure assessment are to focus on the reduction of these uncertainties by collecting more detailed information on the concentration of nitrate and nitrite in fruits, fruiting vegetables and fruit products using analytical methods with a high sensitivy (low LOQ). This would facilitate refined exposure assessments in the future, which would help to decide on the need and possibilities for mitigation measures to reduce the exposure within the contaminants framework. Although vegetables and fruits contain both nitrate and nitrite, the latter compound is generally present in smaller amounts. As a consequence,
the contribution of vegetables and fruits to nitrite exposure is sometimes ignored and/or considered of limited relevance for combined exposure (e.g. EFSA 2010b). As such, less attention is paid to nitrite in vegetables and fruits in national monitoring programs. More data for fruits could be obtained by increasing the number of analysed samples. For vegetables, where a large number of products are already sampled for monitoring of nitrate (e.g. 114 samples were available for nitrate measurement in tomato vs 14 samples for nitrite measurement in fruiting vegetables), it means that products sampled for nitrate analysis could also be used for nitrite analysis. A larger sample size would also allow for more refined probabilistic modelling of lefts-sensored data as suggested by EFSA in its report on the management of left-censored data in dietary exposure assessment of chemical substances (EFSA 2010b).
6.2 Drinking water
The national mean nitrate and nitrite concentrations from the Dutch drinking water stations we used (van den Brand et al., 2020) were far below the (inter)national drinking water limits (Drinkwaterbesluit 2011; EU Council Directive 98/83/EC; WHO 2017). This resulted in a
contribution of drinking water to the combined exposure of nitrate and nitrite of approximately 3%, predominantly due to the presence of nitrate in drinking water. Nitrate concentrations in drinking water differ between regions, varying from levels below the LOQ (0.2 mg/L) to 48 mg/L, with a highest annual regional mean of 35 mg/L. Using this highest regional mean in the exposure assessment, the contribution of drinking water to the combined exposure increased to 13%. For the scenario with nitrate present at the legal limit of 50 mg/L in drinking water, the contribution of drinking water to the combined exposure increased to 19% (van den Brand et al., 2020).
The European legal limit of 50 mg nitrate/L is based on the WHO guideline value for nitrate in drinking water (EU Council Directive
98/83/EC, WHO 2017). This guideline value was set to be protective for the health of the most sensitive subpopulation, i.e. bottle-fed infants. WHO based their guideline value on the absence of adverse health effects (methaemoglobinaemia and thyroid effects) at concentrations below 50 mg/L in epidemiological studies. Although the WHO guideline value is based on short-term effects, it is assumed to be protective for long-term effects and in other population groups, such as older children. However, these other population groups are exposed to other sources of nitrate and nitrite. As a rule of thumb, a contribution of drinking water not more than 20% of the ADI (or the tolerable daily intake for
contaminants) is used for the derivation of drinking water limits, to allow for other sources contributing to exposure (WHO 2017). Therefore, we expressed the exposure to nitrate and to nitrite due to drinking water also as a percentage of the ADI in the scenario using the drinking water limit of 50 mg/L for nitrate, and the national annual mean of nitrite (0.005 mg/L). In this scenario, the mean exposure to nitrate equalled 25% of the ADI of this substance (Table 12). The mean exposure to nitrite, equalled 0.2% of the ADI of nitrite (Table 12). The mean combined exposure to nitrate and nitrite equalled 30% of the ADI of
may not fully protect the older populations by taking background from dietary sources insufficiently into account.
The high nitrate concentrations occur mostly in groundwater in sandy regions with large inputs of nitrogen because of intensive agricultural practice in the previous decennia. Since 1985, the Netherlands has established action programs to reduce the emissions of and impacts on nitrogen to air, groundwater and surface waters. These action programs led to a clear decrease in the net surplus of nitrogen in agricultural areas and its subsequent leaching to groundwater. However, in some regions nitrate concentrations in groundwater used for the production of
drinking water are still elevated up to levels above 50 mg/L (van Loon and Fraters, 2016; Claessens et al. 2017). In these regions, additional treatment steps in the production of drinking water are necessary to guarantee a nitrate concentration below the drinking water limit of 50 mg/L. This is not in line with the ambition of the Water Framework Directive (Directive 2000/60/EC): to avoid deterioration of the waters that are used for the production of drinking water, and thereby to reduce the level of treatment required for the production of drinking water. The current combined exposure assessment to nitrate and nitrite underpins this need.
Table 12. Estimated intake of nitrate and nitrite from drinking water only expressed in mg/kg bodyweight per day and as a percentage of the acceptable daily intake (ADI).
Concentration in drinking water (mg/L) Mean exposure from drinking water (mg/kg bw per day) ADI (mg/kg bw per day) % of the ADI Nitrate 50 mg/L 0.9 3.7 25 Nitrite 0.005 mg/L 0.0001 0.07 0.2
Combined exposure 0.021 (nitrite
equivalents) 0.07 30
6.3 Food additives
The contribution of nitrate and nitrite from food additive use to the combined exposure to nitrate and nitrate was 9%. The combined exposure from food additive use equalled 12% of the ADI.
Although only nitrate is authorized for use as a food additive in cheese (EC No 1333/2008), also nitrite was detected in cheese (Table 10 and Table 11) most likely as a consequence of nitrate to nitrite conversion in the product. The contribution of the nitrite content of cheese to the combined exposure was higher than the nitrate content: 3.8% versus 0.2% (Table 6). Similar to cheese, nitrite was also present in herring, while only the use of nitrate is authorized. It is therefore important to be aware of the conversion of nitrate to nitrite in such products, and to include the nitrite concentrations in these products in risk assessments of nitrate and nitrite.
Generally, possibilities to reduce dietary exposure of substances via the framework of food additives are straightforward and can be achieved by
reducing the maximum permitted levels of the food additives. However, nitrate and in particular nitrite serve a unique preserving function in foods to prevent the neurotoxin formation by Clostridium botulinum. This toxin can cause the severe disease botulism. Therefore, a total exclusion of nitrate and nitrite as food additives is as of yet not an option, since there are no permitted alternatives to prevent C.
botuliunum and its neurotoxin formation. Currently the actual use levels
in the EU generally equal the maximum permitted levels (FCEC, 2016). However, lower maximum permitted levels for nitrate and nitrite in meat products are possible without impairing the microbiological safety of these products (FCEC, 2016). This is also illustrated by the fact that maximum permitted levels for nitrate and nitrite in meat products have been lower in Denmark as compared with the EU for the last decade without any reports on botulism. For cheese, nitrate is used to reduce spoilage and blistering, but alternative methods are available that result in the same effect (e.g. centrifugation). Therefore for cheese, reduction of the maximum permitted levels or even elimination may also feasible. Another authorised use of nitrate is to conserve pickled herring and sprat. It is not known by us whether maximum permitted levels could be decreased for this use. It should be noted that considering the relative small contribution of nitrate and nitrite as food additives to the total exposure to these compounds, a reduction of their use as food additives will only result in a minor decrease of the total exposure to these
compounds. The effect of lowering maximum permitted levels to the Danish legal limits could be investigated by using Danish analytical data for meat products.
7
Conclusions and recommendations
7.1 ConclusionsIn our previous publication on this subject, we concluded that a combined dietary exposure assessment including all relevant dietary sources and including scenarios for regional differences in nitrate and nitrite concentrations in drinking water, provides a better exposure estimate compared to separate assessments for nitrate and nitrite. An analysis of most important contributors to the exposure can then
provide risk managers with insights on which mitigation measures would be most effective to reduce the exposure to nitrate and nitrite (van den Brand et al., 2020). The additional analysis underpins this conclusion. The results of the additional analysis presented in the present report also indicate that the combined exposure to nitrate and nitrite from all relevant dietary exposure may potentially exceed the ADI but due to large uncertainties the exposure estimate may be overestimated. Therefore, we cannot draw firm conclusions regarding the risk of the combined exposure assessment. To obtain a better exposure
assessment, refinement is recommended.
7.2 Recommendations for refinement of exposure assessment
Based on our conclusions, we recommend that all future exposure assessments for nitrate and nitrite:
• Take into account the combined exposure to the two substances; • Include all relevant dietary sources, thus overarch legal
frameworks;
• Include scenarios for regional differences in drinking water. For a refined exposure assessment, the following input data is required:
• More occurrence data for nitrite in vegetables and fruits using analytical methods with a high sensitivity;
• More occurrence data for nitrate in vegetables (other than leaf vegetables) and fruits, using analytical methods with a high sensitivity;
• More occurrence data for unprocessed meat and meat products
without nitrate and nitrite as food additives, with extra controls on food coding for these products with suspiciously high levels in the European database;
•
More information with respect to a more accurate conversionfactor for the conversion of nitrate to nitrite.
7.3 Options for reduction of exposure
Based on the results, the following considerations for mitigation of exposure to nitrate and nitrite can be put forward:
• Contaminants:
Collection of the above mentioned occurrence data will help in better determining the need and possibilities for mitigation measures for foods with unintentional/natural presence of nitrate and nitrite. Mitigation options may be limited due to
foods. In addition, because of their beneficial effects, it is
important that mitigation measures do not limit the consumption of vegetables and fruits.
• Drinking water:
Given the finding that high nitrate concentrations in drinking water, even below the legal limit for nitrate in drinking water, resulted in a relevant contribution to the combined exposure to nitrate and nitrite, it is important to keep levels of nitrate in drinking water and its sources, as low as possible.
• Food additives:
The category products to which nitrate and nitrite were added as food additives was one of the main contributors to the total combined exposure (9%). Lowering the use of nitrate and nitrite as food additives, i.e. lowering the current maximum permitted levels for nitrate and nitrite, is an available first measure that can contribute in lowering the total exposure to nitrate and nitrite, albeit to a small extend. Lowering maximum permitted levels has been shown to be feasible for meat products without impairing the microbiological safety as demonstrated in Denmark, and in cheese as other technologies can be used to reduce bacterial contamination.
8
Acknowledgements
The authors wish to gratefully acknowledge Marja Beukers (RIVM) for her help with the additional sensitivity analysis and Anton Rietveld (RIVM), Suzanne Jeurissen (RIVM) and Polly Boon (RIVM) for their helpful comments during the review of this report.
9
References
Boon PE, Bakker MI, Van Klaveren JD and Van Rossum CTM 2009 Risk assessment of the dietary exposure to contaminants and pesticide residues in young children in the Netherlands. RIVM Report
35007002/2009
Claessens JM, Van der Aa NGFM. Groenendijk P, Renaud L (2017). Effecten van het landelijk mestbeleid op de grondwaterkwaliteit in grondwaterbeschermingsgebieden. RIVM Bilhoven.
Rapportnummer 2016-0199.
Dejongheere W, Steurbaut W, Drieghe S, Verstraete R and Braeckman H 1994 Nitrate in food commodities of vegetable origin and the total diet in Belgium (1992-1993). Microbiologie-Aliments-Nutrition, 12, 359-370.
Directive 2000/60/EC of the European Parliament and of the Council of 23 October 2000 establishing a framework for Community action in the field of water policy.
Drinkwaterbesluit dd 23 May 2011
https://wetten.overheid.nl/BWBR0030111/2011-07-01" \l "Hoofdstuk3"
EFSA ANS Panel 2017a Re-evaluation of potassium nitrate (E 251) and sodium nitrate (E 252) as food additives. EFSA Journal,
15(6):4787, 123 pp
https://efsa.onlinelibrary.wiley.com/doi/epdf/10.2903/j.efsa.2017. 4787
EFSA ANS Panel 2017b Re-evaluation of potassium nitrite (E 249) and sodium nitrite (E 250) as food additives. EFSA Journal,
15(6):4786, 157 pp
https://efsa.onlinelibrary.wiley.com/doi/epdf/10.2903/j.efsa.2017. 4786
EFSA CONTAM Panel 2008 Nitrate in vegetables. The EFSA Journal, 689- 1-79
http://www.efsa.europa.eu/sites/default/files/scientific_output/file s/main_documents/689.pdf
EFSA 2012 Statement on the applicability of the margin of exposure approach for the safety assessment of impurities which are both genotoxic and carcinogenic substances added to food/feed. EFSA J.
10(3):2578. https://www.efsa.europa.eu/en/efsajournal/pub/2578
Ekart K, Hmelak Gorenjak A, Madorran E, Lapanje S and Langerholc T 2013 Study on the influence of food processing on nitrate levels in vegetables. EFSA supporting publication: EN-514, 150 pp
EU Commission Regulation No 1333/2008 of the European Parliament and of the Council of 16.12.2008 on food additives: OJ L 354,
31.12.2008 p16
http://data.europa.eu/eli/reg/2008/1333/2020-07-02
EU Commission Regulation No 1881/2006 of 19 December 2006 setting maximum levels for certain contaminants in foodstuffs https://eur-
lex.europa.eu/legal- content/EN/TXT/PDF/?uri=CELEX:02006R1881-20180319&from=EN