Netherlands Environmental Assessment Agency (MNP), P.O. Box 303, 3720 AH Bilthoven, The Netherlands; Tel: +31-30-274 274 5; Fax: +31-30-274 44 79; www.mnp.nl/en
MNP Report 771404006/2007
Sustainable production and consumption
An assessment for the Netherlands
Th. Aalbers, C. Brink, E. Drissen, A. Faber, D. Nijdam, T. Rood, K. Vringer, H.C. Wilting
Contact: Corjan Brink NMD
corjan.brink@mnp.nl
This research was carried out on behalf of The Environmental Assessment Agency, project M/771404, sustaining the projects ‘Sustainability Outlook, Netherlands in a sustainable world’ (M/500084/01/AA) and ‘Environmental Balance 2007’ (M/500081/01/BG).
© MNP 2007
Parts of this publication may be copied under the condition that the source is credited: the Netherlands Environmental Assessment Agency, the title of the publication and the year.
Abstract
Sustainable production and consumption
An assessment for the Netherlands
Poverty, climate change and loss of biodiversity are among the key issues in relation to global sustainable development. The Netherlands is tightly embedded in a global network of economic relations as well as environmental effects: domestic consumption and production patterns affect environmental pressure not only within the country, but also abroad. This report explores the nature and quantity of economic and environmental embedding of the Netherlands in the world. Following from surveys, support for policy measures is identified and explored. It concludes by the notion that sustainability problems have an increasingly global character, but that the inverse is also true: it makes sense to take up responsibilities to improve the environment in other parts of the world.
Rapport in het kort
Duurzame productie en consumptie
Een evaluatie voor Nederland
Armoede, klimaatverandering en verlies van biodiversiteit zijn cruciale factoren voor mondiale duurzame ontwikkeling. Nederland is stevig ingebed in een mondiaal netwerk van economische relaties en van milieueffecten: binnenlandse consumptie- en productiepatronen beïnvloeden de milieudruk in Nederland, maar ook daar buiten. Dit rapport verkent de aard en omvang van de mondiale inbedding van Nederland in termen van zowel economie als milieu. In combinatie met resultaten van enquêtes worden vervolgens enkele beleidsmogelijkheden ten aanzien van duurzaamheid verkend. De conclusie is dat duurzaamheidsproblemen in toenemende mate een mondiaal karakter hebben, maar dat complementair daaraan ook lokale oplossingsgerichte activiteiten een gunstige effect kunnen hebben op milieu en duurzaamheid in andere delen van de wereld.
Trefwoorden: productie, consumptie, globalisering, maatschappelijk verantwoord ondernemen, enquêtes
Contents
Summary... 7
1 Introduction ... 11
2 Extent and distribution of economic prosperity and environmental pressure ... 13
2.1 Economic development and differences in the world ... 13
2.2 Distribution of the global environmental pressure: greenhouse gases and land use... 19
2.3 Globalization and sustainability ... 23
3 Dutch consumption and sustainability... 25
3.1 Introduction ... 25
3.2 Private consumption by Dutch citizens ... 25
3.3 Physical developments in consumption by Dutch citizens... 26
3.4 Environmental pressure from Dutch private consumption... 28
4 Dutch production and sustainability... 31
4.1 Trends in Dutch production... 31
4.2 Shift to services ... 32
4.3 Technological development and eco-efficiency ... 33
4.4 Globalizing Dutch production and consumption... 35
5 Perceptions and actions by citizens and companies... 39
5.1 Perceptions and actions by citizens ... 39
5.2 Perceptions and actions by companies ... 41
5.3 Civil policy support ... 45
5.4 The perspectives on the future by citizens and companies... 51
6 Conclusions... 53
6.1 The Netherlands in a global context ... 53
6.2 Consumption, environmental pressure and behavioural change ... 54
6.3 Production, environmental pressure and corporate social responsibility ... 55
6.4 Policy implications ... 56
Appendix 1: OECD trend scenario... 63
Appendix 2: World perspectives... 65
Development of the world perspectives ... 65
Description of the world perspectives in the surveys ... 66
Summary
Sustainable development is said to be achieved when the quality of life can be maintained with a certain minimum standard for that quality of life in existence throughout the world. On the one hand, this calls for an ongoing balance in the quality between the planet, people and profit, while on the other hand, the quality of life will have to be improved, particularly for the world’s poorest people. This report focuses on the consequences of Dutch economic developments (consumption and production) on sustainability. Referred to in particular here are the problems of climate change and the loss of biodiversity, which undermine the continuity of the quality of the planet in such a manner that continuation of the other developments is at risk.
The Netherlands is economically embedded in a global context: domestic consumption is fed by imported products and production within the country, while national production not only nourishes domestic consumption, but also contributes to exports for consumption abroad. As a result, environmental pressure related to Dutch consumption and production is spread throughout the world.
The Netherlands is one of the countries in the world with the highest level of income per capita. As a result, the current level of per capita greenhouse gas emissions related to Dutch consumption is almost 2.5 times the global average level. Greenhouse gas emissions occur directly during the use of products by the consumer; however, to a large extent (currently 55%) they also occur during the production of consumer goods and services. These so-called indirect greenhouse gas emissions partly occur within the geographical borders of the Netherlands, but also partly abroad. This comes, for example, because the Dutch consumption also consists of imported products, the production of which causes emissions abroad. As a result of an expected substantial increase in the private consumption expenditures in the Netherlands in the coming decades, greenhouse gas emissions related to Dutch consumption will also increase. However, mainly because of the improved energy efficiency of production processes and products, the increase in emissions is less than the increase in consumption expenditures.
Because the Netherlands is a densely populated country where land is scarce, land used for Dutch consumption takes place abroad. As a result, Dutch consumption contributes to the problems that are coupled with the use of land elsewhere in the world, for example loss of biodiversity. The per capita land use for Dutch consumption is about the same as the average per capita land use in the world (0.8 hectares per capita), which is relatively low in comparison with other rich countries. The level of per capita land use is also expected to increase in the coming decades, which will lead to more land use abroad, in particular to satisfy the higher demand to wood. Land use increases less than consumption expenditures as a result of efficiency improvements in food production.
Environmental pressure related to Dutch industrial production, with reference to many environmental themes, is becoming increasingly disconnected from economic growth, indicating a trend towards greening of the industry. Whereas GDP in the Netherlands increased by almost 45% between 1990 and 2005, the associated CO2 emissions increased only by approximately 18%. The main driver for this process of disconnection between economic growth and environmental pressure has been the increasing efficiency of Dutch production due to technological developments and learning-by-doing. Other trends relevant for the environmental pressure of production, but to a smaller extent than the technological change, are:
(i) a shift in the economy from manufacturing to services, which are less polluting than the traditional manufacturing sectors, and
(ii) globalisation: as with increasing imports and the relocation of business activities to other countries, the environmental pressure related to production also shifts abroad. Currently, greenhouse gas emissions related to imports and exports are more or less in balance, but forecasts indicate that in the future greenhouse gas emissions abroad related to imports will be larger than domestic emissions for exports.
Although many Dutch citizens indicate that they are prepared to contribute to environmental solutions, for example, for climate change, and to make some (modest) financial sacrifices, only very few people are voluntarily willing to make behavioural changes for the public environmental benefit. The costs associated with changing behaviour (not only the financial cost, but also the cost involved with loss of comfort, convenience and breaking routines), are too high for the change to take place voluntarily. Citizens expect the government to take measures in order to actualise behavioural changes, for example, by enforcing standards or taxes. With respect to climate change, there is a level of support from a majority of the population in the Netherlands and other European countries for policy measures with which an approximate 10% reduction in CO2 emissions can be achieved. People are also prepared to pay the additional costs required to achieve this reduction, preferably via a limited general increase in (electricity) prices compensating for energy-saving measures by manufacturers. The level of support for changing eating patterns in order to reduce loss of biodiversity, e.g. a reduction in consumption of meat or dairy products induced by a tax, does not represent a majority.
Multinational firms are subject to relatively high public pressure and scrutiny from NGOs, which possibly explains high levels of involvement with various global sustainability issues, such as child labour, low wages and poor working conditions. Dutch multinationals generally score high on international sustainability benchmarks. In order to further improve these scores, companies will require government to realise a level playing field on sustainability issues, which ensures their competitiveness in relation to other firms in the Netherlands and preferably in other parts of the world as well. Furthermore, taking up entrepreneurial responsibility in the production chain can assist in making this chain more sustainable, because it will help companies to make specific choices leading to more sustainable products. In small- and medium-sized enterprises, corporate social responsibility (CSR) chiefly involves activities internal to the firm, often related to personnel matters. Voluntary environmental measures are not applied very often, presumably because of relatively high efforts (in terms of time and money) in relation to the main activities of the firm.
As indicated above, many Dutch citizens and companies indicate that they are willing to (financially) contribute to solutions to tackle climate change, but only very few are willing to make their own behavioural changes for public environmental benefit. Both citizens and companies expect the government to take the initiative to solve important environmental issues in order to deal with this discrepancy. In the assessment described in this report, four main policy lines are set out in the context of climate change and biodiversity loss:
• Use is made of the willingness-to-pay by consumers to have tax measures ensure endowments required for specific or general environmental policy measures.
• Routine behaviour can be addressed in specific cases (see in parentheses) by imposing strict obligatory regulations (unwillingness), showing alternative perspectives (lack of knowledge) or lowering barriers (high transaction cost).
• If individual firms are reluctant to make their production processes more sustainable and more transparent, covenants (agreements) can be useful in calling for collective action where individual action would not be acceptable to firms. For laggards, stricter regulation will often be needed. An international level playing field for firms will require international institutions that are responsible for harmonising regulation and setting up criteria for sustainability of production chains.
• In order to transfer small-scale initiatives to large-scale effects, credible international governance structures will also be necessary.
1
Introduction
Sustainable development is said to be achieved when the quality of life can be maintained with a certain minimum standard for that quality of life in existence throughout the world. On the one hand, this calls for an ongoing balance in the quality between the planet, people and profit, while on the other hand, the quality of life will have to be improved, particularly for the world’s poorest people. In its Second Sustainability Outlook (MNP, 2008 forthcoming), the Netherlands Environmental Assessment Agency (MNP) focused on three problems related with each other: poverty, climate change and loss of biodiversity. Tackling poverty manifests itself in the challenges involved in bringing the quality of life to an acceptable level for many (MNP, 2008 forthcoming). Climate change and the loss of biodiversity undermine the continuity of the quality of the planet in such a manner that continuation of the other developments is at risk.
A worldwide social swing will be necessary in order to achieve – or get as close as possible to – the internationally established goals for poverty (Millennium Development Goals), climate change (the 2-degrees goal) and biodiversity (reducing the rate of loss of species). The challenge of achieving the proposed goals involves tackling poverty, which would result in attaining an acceptable quality of life for everyone, and subsequently applying technology and changes in consumption patterns to absorb the additional demand for energy and land, among other things. Up until now, the use of technology has considerably increased efficiency, but not sufficiently enough to compensate for the increase in the global use of energy and land. Policy options for addressing the three correlated problems are formulated in the sustainability outlook by the MNP. The policy options can result in policy measures that should lead to a change of behaviour by civilians and companies, and consequently to lowering environmental pressure.
This report serves as a background document for the Second Sustainability Outlook (MNP, 2008 forthcoming) and the Environmental Balance 2007 (MNP, 2007)1 and it has been focused on the impact of the Dutch economic developments (consumption and production) on climate change en biodiversity in the rest of the world. This report examines developments that took place in recent decades as well as looking at the developments forecasted for the coming decades up to 2040. The level of support for behaviour change by companies and consumers needed to reach the goals established as much as possible is also covered. A trend scenario that is founded on the baseline of the second Environment Outlook by the OECD (see Appendix 1) was used for the prospectus on future developments. The level of support for a number of policy options is also addressed in the report. The report starts with a comparison of the Netherlands with other countries in the world on several aspects that are relevant for a sustainable development. The focus in environmental assessments is often on the environmental pressure that occurs within the geographical borders of a country. Production in the Netherlands is, however, not only meant for domestic consumption, but for an important part also for the export. Furthermore, Dutch consumption includes imported products, the production of which
1
causes environmental pressure abroad. Therefore, the analysis in this report is not limited to the environmental pressure within the Netherlands, but also includes the environmental pressure abroad that is related to Dutch consumption. As a result, the report deals with the sustainability of Dutch consumption and production from two different points of view: consumption and production. Consumption directly causes environmental pressure, i.e. during consumption itself, but also indirectly, i.e. during the production of the consumer goods.
2
Extent and distribution of economic prosperity and
environmental pressure
2.1 Economic development and differences in the world
2.1.1 Global disparity in economic growth
The world GDP has increased 3% a year since 1975. However this increase is not equally distributed across all world regions. With a GDP growth of more than 9% a year, China has the most spectacular economic growth of all the large countries. India and a few countries in Southeast Asia also vigorously grew in recent decades. European economic growth chiefly remained behind in the growth of the world economy. This is not only due to the stagnant economic development since 1990 in Eastern Europe and the states of the former Soviet Union, but also of the lower growth in Western Europe, where the average annual growth fell more than 0.5% behind the annual growth rate of the world GDP. The annual growth rate in Sub-Saharan Africa and South America was somewhat lower than the world growth rate, but higher than the annual growth rate in Western Europe.
The share of Western Europe in the world economy decreased from more than 36% in 1975 to less than 30% in 2006. Other regions that lost some share in world GDP were South America, Sub-Saharan Africa and Eastern Europe, where the share of the latter region fell considerably. China has more than doubled its share in the world economy from 2.5% in 1975 to 5.5% in 2006. Other countries in Asia also increased their share in world GDP: between 1975 and 2006, the share of Asia increased from 19% to 28%. In the same period, the contribution of the United States increased from 25% to 27%. The share of the United States in the world GDP is more than ten times the share of Africa (2.5% both in 1975 and in 2006).
Besides differences between regions with respect to growth and size of the economies, there are also differences with respect to growth and size of the population in the various regions. The annual growth rate of the world population was 1.5% in the past three decades. In most rich countries the population growth was less than growth rate of the world population, in particular in Western Europe and Japan, where the population increased with less than 0.5% a year. The population size in Eastern Europe and the European former Soviet states even decreased between 1975 and 2006. In contrast, in some poorer regions the population growth was higher than the growth rate of the world population. The population in Sub-Saharan Africa increased with more than 2.7% a year since 1975. The highest population growth occurred in Western Asia (the Middle East), where the population increased with almost 3% a year. As a consequence, whereas the annual economic growth rate in Sub-Saharan Africa and South America is higher than the annual growth rate in Western Europe, the growth rate of GDP per capita was higher in Western Europe, because the population growth was relatively low in this region. The growth rate of GDP per capita was just slightly above zero in Sub-Saharan Africa, which was even lower than the per capita growth rate in Eastern Europe and the former Soviet Union.
2.1.2 The influence of culture on economic development
While a large number of Asian countries have had lofty economic growth in recent years, the growth in other developing regions remains stagnant, particularly in Sub-Saharan Africa. Such differences in economic growth frequently correlate with differences in the share of private investments, in the knowledge and education levels (human capital) as well as differences in the degree to which they conduct trade with other countries (Levine and Renelt, 1992). Roughly speaking, it can be said that Sub-Saharan African countries invest too little in the scope and quality of their human and physical capital; and along with that, they have too few potential markets for their production because they do not conduct enough trade with other countries (see Porter, 1990). The low trade volume is perhaps related to the fact that a large number of African countries do not lie on the coast and therefore have no harbours at their disposal (The World Bank, 2004; Sachs, 2005). Then again, investments in knowledge through education are partially negated by death from diseases such as malaria, AIDS and tuberculosis (Sen, 2004). Investing in health and education care is consequently a condition for economic development.
There is less insight concerning the influence of political and cultural aspects upon economic growth. Even though there is nothing explicit about the influence of political stability, corruption and democratic rights on economic growth (Levine and Renelt, 1992), a (strongly) negative influence that these aspects have on economic growth is not ruled out, particularly in Sub-Saharan Africa. The influence of culture on economic development was already described by Weber at the beginning of the twentieth century (Weber, 1905). There are indications that values such as honesty, austerity, work ethic, trust and a sense of enterprise have influence upon economic growth. However, a direct relationship between culture and economic growth has not been found (The World Bank, 2004). There are indications that a relationship exists between prosperity and cultural changes, but the causality is conversely true: growing prosperity leads to cultural changes. Furthermore, these changes are dependent on the original culture (Inglehart and Baker, 2000).
2.1.3 Quality of life, personal satisfaction and the Human Development
Index (HDI)
GDP gives an indication for people’s consumption possibilities. Consumption is one of the factors that influence the quality of life. Quality of life is determined by possibilities available to people to provide a satisfactory form to their lives (Robeyns and Van der Veen, 2007). Higher prosperity and subsequently a higher consumption level increases the quality of life. However, consumption is not the only factor that influences the quality. According to the British economist, Layard, the main factors that influence the quality of life are health, relationships and employment (even unpaid work) (Layard, 2003). Even though a higher income increases the possibilities available to people to give their life form and subsequently contribute to the quality of life, this does not by definition lead to an increased average happiness (Veenhoven and Hagerty, 2006). International research found that people with an income higher than approximately $15,000 do not become easily more satisfied from extra income (Inglehart, 1997). In rich countries where the basic necessities of life are met, relative income is more important than absolute income. Most people want to be at least as well off as the neighbours (Keeping up with the Joneses). When peer group income as well as one’s own income increase to an equal degree, there is hardly any effect on the sense of satisfaction (Layard, 2003).
Quality of life is unevenly distributed in the world. Many people in Africa, as well as in large parts of China and India, are unable to meet the basic necessities of life. In contrast, with the growing middle class in China and India there is a greater need for cars, and many Europeans have more need for leisure time. The United Nations Development Programme (UNDP) developed the Human Development Index (HDI) in the 1990s, which gives an indication of the developmental status for all countries. This index is an aggregation of the indices of life expectancy, educational level and GDP per capita of a country, known as ‘purchasing power’. HDI can be seen as a proxy for the quality of life, even though this highly aggregated index does not comprise many aspects of the quality of life, such as environment, nature, leisure time, human rights and political participation. HDI also gives no indication for the differences found within countries. HDI score is the highest in a number of western countries, among which the Netherlands. HDI provides a broader impression of a country’s welfare than does the GDP, which only reflects a country’s economic production. The components of HDI are discussed further in the following sections.
2.1.4 Global differences in real disposable income
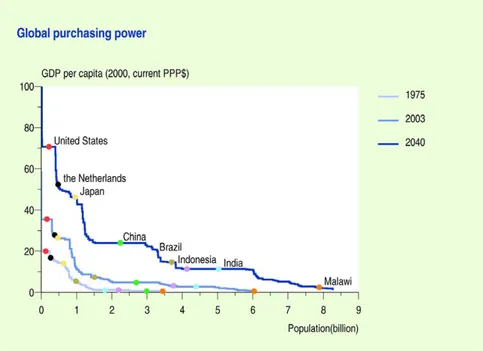
Real disposable income – purchasing power – is one of the three gauges in the Human Development Index, along with educational level and life expectancy. It is the measure of citizens’ material standard of living. Purchasing power is often expressed in purchasing power parity (PPP), a measure that takes the price differences for a number of basic goods into account, which allows for a comparison of the standard of living in different countries. A comparison of countries based on PPP shows great differences in purchasing power (Figure 2.1).
Figure 2.1 Comparison of the purchasing power over the world in 1975, 2003 and 2040. The Netherlands and some typical countries are pinpointed
Economic prosperity is not evenly distributed between countries. As indicated above, since 1975 there have large disparities in the rate of economic growth in various regions. According to the trend scenario (see Appendix 1), differences will continue to exist in the coming decades. As a consequence, there will be disparities in the development of real disposable income. In particular in China, there will be a substantial growth in real disposable income up to 2040. The United States is the richest of the larger countries in the world and shall also hold that position in 2040 (see Figure 2.1). Currently, 20% of the world population lives in the most prosperous countries that together have a share of over 85% in the world GDP.
A more precise measure for determining the disparity in real disposable income is the Gini Index. The Gini Index is a measure of disparity, with a value between 0 (income is equally distributed) and 1 (all incomes go to one person or group). A higher Gini Index therefore means that the differences in incomes are larger. The Gini Index on a global scale (based on differences between average per capita income in individual countries) fell from 0.62 to 0.53 between 1975 and 2003.2 According to the basis scenario, it shall fall further to 0.45 in 2040. The differences among countries have therefore decreased during the past three decades and the forecast is that they shall decrease further in the coming four decades. The disparity in income decreases particularly because poor countries in Southern Asia, such as China, India, Vietnam and Indonesia, have a vigorous increase in incomes in the past three decades of more than 3.5% a year. Whereas the per capita income in the poor Southern Asian region strongly increased in the past three decades, it did hardly increase in the other poor region, Sub-Saharan Africa. The growth in per capita income also lagged behind in Latin America and Eastern Europe, where most countries held a middle position in 1975. Although the Gini Index decreases, it is only the very populous region of Southern Asia that can reduce the gap with the rich regions Northern America, Western Europe, Australia and Japan.
The aforementioned data are based on a comparison of a country’s average incomes. The distribution of income within countries is also important for the distribution of prosperity, which, according to UNDP (2004), varies greatly among countries. The differences in incomes are the greatest in African and Latin American countries. China, Russia and the United States occupy the middle position. In South Asian countries such as India, Pakistan and Bangladesh, the differences in incomes are approximately the same as in the Netherlands. The smallest differences in incomes can be found in the Scandinavian countries, Japan, Belgium and a few Central European countries (Hungary, Czech Republic and Slovakia).3 There is no direct relationship between the level of the average incomes and the degree of the distribution of incomes. Income inequality has risen in most countries and regions in the past two decades (IMF, 2007). According to the IMF-report, technological progress and financial globalization cause income inequality to increase, whereas trade globalization mitigate income inequality.
During the UN Conference on Environment and Development in 1992 in Rio de Janeiro, it was established that there can be no sustainable development as long as the quality of life severely improves for the people who live under extremely impoverished conditions. The solution of poverty
2
This result is in line with Milanovic (2005) when he uses a similar concept to calculate the Gini-coefficient (Concept 2).
3
and hunger is one of the most significant sustainability problems. Poverty is a relative concept. An income at the poverty level in the Netherlands is approximately $18,000 - PPP (also see Appendix 3), with which a Dutch consumer can just barely keep pace with the Dutch society. This amount is an ample income for the average Zambian, generally speaking. The World Bank uses an income of $1 a day as a reference in formulating the Millennium Development Goals, for which this is the level for extreme poverty: less than $1 a day means hunger. In 2001, 1.1 billion people lived under the poverty level. In most countries the average per capita income is well above this level, but in many countries there are large groups within the population that live in extreme poverty. E.g., more than 70% of the population in Zambia, Nigeria and Mali still lives under the poverty level.
Evidently, the distribution of real disposable income of families worldwide, across the different consumption categories is not heavily dependent on the level of income. With a high average real disposable income in a country, the relative expenditures for food are low, while on the average, the expenditures for education, health care and financial business services are higher (Figure 2.2).
Figure 2.2 The share of the private consumption that is spent on services and food for 66 countries (collectively, 75% of the world population)
2.1.5 Life expectancy and education level
Along with purchasing power, education level and life expectancy are also significant gauges for HDI. Figure 2.3 shows the distribution of life expectancy in 2004 across different countries. This shows that in a number of African countries, such as Zambia and Zimbabwe, the average life expectancy is currently lower than 40 years, whereas life expectancy in Japan is more than twice as high at 82 years. The differences in child mortality rate are also great. In most of the developed countries this is far below 10 children for every 1,000 births, while child mortality in some Sub-Saharan African countries comes out to be above 150. In Sierra Leone, one in six children born there dies in the first year. On the average, the second child dies before its fifth year, and the third shall not become older than 45. Significant causes of this are the lack of basic health care, malnutrition, lack of clean drinking water and HIV/AIDS (MNP, 2008 forthcoming, chapter 2).
Figure 2.3 Life expectancy of the world population
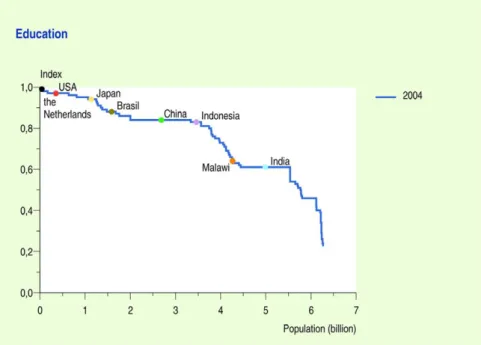
There have been great advances in the area of education worldwide. The percentage of illiterate adults has been reduced from 44% in 1970 to 21% in 2000 (UNESCO, 2002). Great advancements have taken place particularly in Sub-Saharan Africa, North Africa, South and West Asia and the Middle East. These regions had a high percentage of illiteracy in the 1970s, which has since been lowered by almost 50%. Figure 2.4 shows the distribution of education level in 2004 among different countries. Burkina Faso, Niger and Mali have the lowest education levels.
Figure 2.4 Education level of the world population
2.2 Distribution of the global environmental pressure:
greenhouse gases and land use
2.2.1 Global greenhouse gas emission resulting from consumption
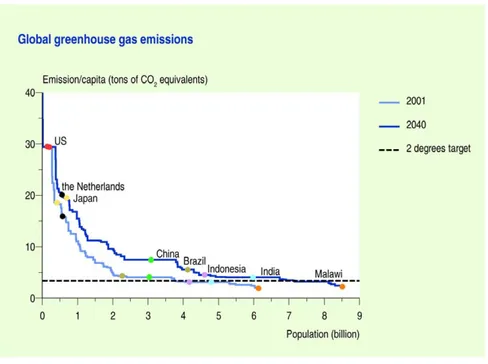
As a result of the increase in energy use, global emissions of greenhouse gases have increased substantially. The global average per capita greenhouse gas emissions, however, have decreased from 6.9 ton CO2-equivalents in 1970 to 6.7 ton CO2-eq. in 2001. Consumption contributes to greenhouse gas emissions directly (emissions from energy use) as well as indirectly (emissions during the production of consumer goods). In the trend scenario, the average greenhouse gas emission per capita increases between 2001 and 2040 by approximately 16% (0.4% per year). Due to the growth in world population, the total greenhouse gas emission in the world increases about 65% (1.3% a year). The European goal is to limit global temperature increase to 2 degrees. The Netherlands have subscribed to this goal. In order to accomplish this goal in 2050, in 2040 no more than 3.5 tons of CO2-eq. per capita of the world population can be emitted, in comparison with the approximate 6.7 tons of CO2 in 2001 (see Figure 2.5). The consumption-related emissions per capita are the highest in the richest countries in the world, including the Netherlands. In the OECD countries, but also in countries such as China and Brazil, the consumption-related emissions are currently more than the 3.4 ton CO2-eq. per person. This shall be the case for almost all countries in 2040. Consequently, a substantial effort towards a policy is necessary to prevent a severe climate change.
Figure 2.5 Greenhouse gas emissions for the world from private and government consumption, for 2001 and 2040 4
The total greenhouse gas emissions from the United States amounted to almost 20% of the global emissions in 2005, in contrast to approximately 11% for the European Union. In particular, the emissions from China, however, are rapidly increasing. In 2006, China surpassed the United States as the country with the greatest CO2 emissions in the world, which is, according to the trend scenario, also forecasted to remain so in the coming decades.
The Gini Index can also be applied to measure the distribution of global greenhouse gas emissions in the same manner that it is applied for the distribution of global prosperity. The Gini Index for consumption-related greenhouse gas emissions decreases from 0.42 in 2001 to 0.38 in 2040, reducing the disparity among countries in greenhouse gas emissions per capita. This trend corresponds with the trend toward more equality in income. The richer countries particularly have high consumption-related emissions per capita. Even though the differences in greenhouse gas emissions per capita shall be reduced, inhabitants of richer countries shall still release ten times more greenhouse gas emissions on average than inhabitants of poor countries.
In 2001, the level of per capita greenhouse gas emissions for consumption in the Netherlands was almost 2.5 times the global average level, and also higher than the average level in Western Europe, although the difference with the level in Western Europe is rather small (6%). In Northern America, Japan and Australia, the per capita emissions were larger than in the Netherlands. Per dollar spent on consumption, however, the greenhouse gas emissions were relatively low in the Netherlands. It was
4
See Wilting and Vringer (2007) for a description of the methodology for calculating greenhouse gas emissions and land use per capita.
smaller only in Norway, Denmark and Japan, mainly as a result of differences in the consumption pattern. In the United States, the level of greenhouse gas emissions per dollar spent on consumption were approximately 7% higher than in Western Europe and in Canada, Australia and New Zealand it was even higher. The highest level was found for the states of the former Soviet Union, where the emissions per dollar spent on consumption were in 2001 approximately 10 times higher than in the Netherlands.
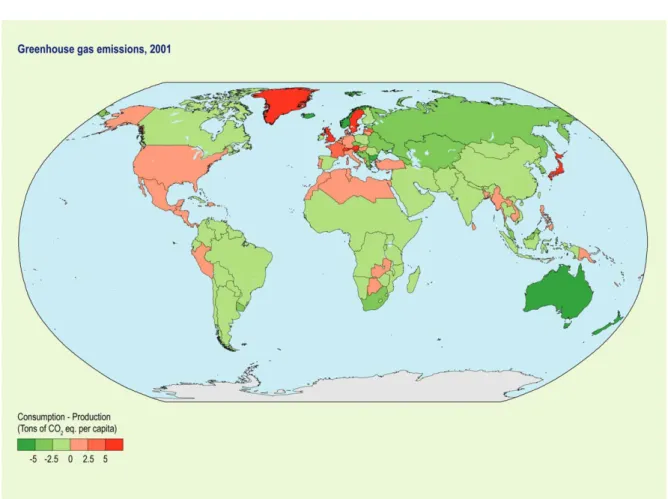
As indicated before, the consumption of imported goods in a country causes emissions abroad during the production of these goods. On the other hand, the production of commodities for the export causes emissions in a country that are related to consumption abroad. For the Netherlands it is so that greenhouse gas emissions from the production in the country that is intended for the exports are at the same level as the consumption-related emissions abroad. For many industrialized countries, however, domestic emissions for exports are lower than the emissions for consumption-related imports. It is expected that the Netherlands will become a net-exporter of greenhouse gas emissions in the future too. To the contrary, countries like China, Brazil, Russia as well as Australia and Canada have higher emissions caused by export production than what occurs abroad for their own consumption (Figure 2.6). Among the things that cause this are the extensive emissions from agriculture in Australia and CO2 emissions from coal-fired power stations in China.
Figure 2.6 Difference between greenhouse gas emissions for consumption (incl. import) and production (incl. export) in 87 countries/regions (2001; ton CO2-eq. per capita)
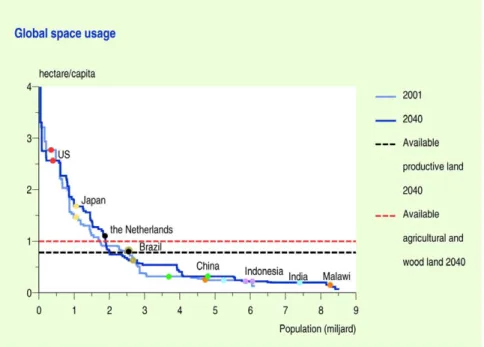
2.2.2 Global land use resulting from consumption
For the consumption of food and wood products land is required. As a result of an increasing demand for land for agricultural purposes, the pressure on biodiversity will increase. Land use is strongly related to the level of consumption: richer countries generally take up more land in the world than poorer countries. These differences are, however, smaller than the differences in greenhouse gas emissions. The majority of land use is related to food production (particularly diary and meat), clothing and wood (MNP, 2006). Land use in richer countries is generally more efficient and more intense than land use in poorer countries. Between 2001 and 2040, the total global use of land for agriculture increases by 10% as a result of a growing world population and in particular an increasing level of per capita food consumption in developing countries. As a result of a substantial improvement of the agricultural productivity in developing countries the global increase in land use is much lower than the population growth in this period of 45%. The use of land for wood production will increase by almost 70 percent, which causes total land use for consumption to increase by approximately 20%, from 5.9 billion hectares to almost 7.2 billion hectares.
Figure 2.7 Land use resulting from consumption for the Netherlands and the world, for 2001 and 2040
Currently, worldwide 5 billion hectares are used for agricultural activities. With a world population of 6 billion people this is an average of 0.8 hectares per person. The entire amount of productive agricultural land that is globally available is 7 billion hectares. With world population increasing to 9 billion in 2040, the potential for productive agricultural land is almost 0.8 hectares per person in 2040 (including grasslands; see dotted reference line in Figure 2.7). This includes the current agricultural land supplemented with potentially productive agricultural land, including large sections of the tropical rain forests and tropical grasslands. Terrains, such as deserts, glacial areas, coniferous forests and tundra in northern cold zones, such as Siberia, have a very low level of production for agriculture and are not taken into account. Parts of these non-productive terrains are currently dedicated to wood production. The increase in the demand for wood products can theoretically be met by making use of
these less productive regions (which means an additional 2 billion hectares of land available). Taking into account this additional area, the potential for land use is almost 1.0 hectares per capita in 2040. However, managing these less productive regions is very uncertain. In view of the forecasted increase in food consumption, in particular the pressure on tropical biodiversity will increase. A severe increase in productivity is needed in order to limit the pressure on the remaining natural areas.
The Gini Index as measurement for the distribution of global land use amounts to 0.49 in 2001. This value is higher than that of the distribution of global greenhouse gas emissions in this year. The global distribution of land use remains more or less the same in the trend scenario; in the trend scenario the Gini Index increases to 0.51 in 2040. Land use is less strongly correlated with income than greenhouse gas emissions are. The per capita land use for the Dutch consumption is about the same level as the average per capita land use in the world (0.8 hectares in 2001). In Northern America the per capita land use for consumption is more than three times higher and in Australia and New Zealand it is almost ten times higher due to the use of low-productive pasture land. The Dutch consumption is relatively efficient with respect to land use: per dollar spent on consumption land use is lower than in all other regions, except for Japan. Apart from Australia and New Zealand, in OECD countries land use per dollar spent on consumption is lower than other countries.
2.3 Globalization and sustainability
‘Globalization’ is a process that refers to the increasingly greater scale, pace and impact of global social interactions (Held and McGrew, 2002). Communities across the whole world come into contact with each other to a greater degree and influence each other through ideas, institutions and power relations. On a global scale, this leads to increasing dependence among cultures and economies. This can lead to greater economic advantages, but also perhaps to large-scale changes in the organization of societies. To a strong degree, globalization is fed by technological possibilities, such as in the past decade particularly via the internet (Castells, 1996). The globalization process has impact on the worldwide and national socio-economic relationships, on the distribution of political power, on the role of the nation state, and on issues concerning sustainability.
The increasing social interaction is not universal: large segments of the world population stand on the sidelines of the globalization process. This is often related to a shortage of technological or economic opportunities, but also at times globalization is explicitly rejected because of an association with the increasing influence of foreign cultures. The anti-globalization movement is the most prominent example of this, but also more extreme ‘closed communities’ movements keep themselves on the sidelines or position themselves as being flatly opposed to other cultures (zie ook Huntington, 1993). Globalization is therefore also not a balanced global development: it often leads to greater economic growth, but also to an increasing dependence on interaction with other cultures.
Globalization is not a clear concept and there are different perspectives to differentiate regarding the nature and the extent of globalization. In a broad sense, the sceptical approach, the hyper-globalizing approach and the transforming approach are frequently distinguished (Held et al., 1999; Huynen et al., 2005). The sceptics pose that the nature and extent of globalization are strongly exaggerated and that international interrelationship have always existed. The hyper-globalizationists pose that globalization is indeed a new phase in history that is characterized by a process of erosion of the role of nation states. The transformationalist’s proposition is that globalization is a new process, but continues to
build upon historical developments that have been in progress for a long time. Furthermore, it is acknowledged that the level of interrelationship in the global network has reached a historically high level.
In order to understand the relationship between globalization and sustainability, a distinction can be made in the nature of the problem on the one side and the nature of the solution on the other. At first, globalization changes the nature of environmental problems. Global problems are becoming increasingly more important and have increasingly more impact on our daily lives; consider, for instance, climate change, the exchange of plant and animal species across the world and the increasing amount of over-fishing in the oceans. More so than many other problems, large-scale environmental problems reflect the limits of globalization processes and are therefore not only a result of, but have also become a factual and significant trademark of globalization. Second, an increasingly greater pressure on the social cohesion develops in societies though migration flows and through cultural exchange, media and travel. On the one hand, this leads to mutual understanding among cultures, but on the other hand, it frequently leads to further demarcation of what is ‘mine’ as well, resulting in cultural fragmentation. Third, globalization is influenced by the economic order in the world. It is not easy to assess the nature of these influences: some highlight the growth in capital flow and increase in density of the global economic network, others question whether an increasing integration of the world economy can be demonstrated. Economic globalization remains limited to the OECD countries to a great extent, and within this order, nation states remain the dominant economic players. Furthermore, international institutions, such as the World Bank and the WTO do have regulating power, but always within the contexts of the authority given to them by the nation-states.
Along with the problem, the globalization process also alters the possibilities to reach solutions for sustainability. Since developments abroad can have an impact at home, the inverse is also true: it makes sense for a citizen to take action on behalf of the environment, because embedding in the global network translates this action into impact elsewhere in the world. In order to facilitate this process, international governance structures and institutions will have to be better geared to deal with the main sustainability issues. The primary challenge for this task is to strengthen the credibility of the current international structures, which is now often said to favour the richest and most powerful countries and corporations (see, among many others, Klein, 2000; Hertz, 2001). A change in the international governance structures is not only necessary for a credible approach to global sustainability problems, but also to take into account the ideas of both sceptics and proponents of globalization.
Additionally, various international frameworks give attention to various subsectors of sustainability by means of institutions and multilateral or bilateral agreements. The challenge of this task is to integrate these subsectors. As of now, environmental agreements can still conflict with WTO trade agreements, for example, an import embargo of protected species that conflicts with the WTO’s free trade principle. Moreover, the adoption of the precautionary principle from the environmental perspective is often not shared from the perspective of trade promotion. Furthermore, a credible sanction regime is also needed for countries that ignore agreements. However, in actual practice this is difficult, because it can cause infringement of the states’ independence and can entail an erosion of democratic national interests. In addition, the formation of the agreements, institutions and the sanction regimen would have to take the sceptics as well as the proponents of liberal globalization into account.
3
Dutch consumption and sustainability
3.1 Introduction
The Netherlands is among one of the richest countries in the world. The high level of consumption per capita in the Netherlands consequently causes high environmental pressures. In order to achieve the EU 2-degrees goal, emissions of greenhouse gases (GHG) from Dutch consumption should be reduced by a factor five in 2040, assuming an even distribution of greenhouse gas emissions per world population capita in 2040. The emissions per capita for countries like India and China should stabilize to reach the 2-degrees goal. The efforts to achieve such a reduction for the Netherlands would have to be severe.
3.2 Private consumption by Dutch citizens
Dutch consumption consists of all goods and services that are consumed by private households and the government. This section looks at the national and international issue of private consumption by Dutch citizens. Government consumption is not included here. The size of private consumption by Dutch citizens is closely related to the size of the population and the real disposable income per capita. Between 1950 and 2000, the Dutch population has increased from 10 million to 16.3 million inhabitants; further growth to 17 million inhabitants is predicted for 2040. This is an increase of 70% in 90 years. Along with the population growth, other demographic developments also have their influences on the extent of the consumption-related environmental pressure. One of the most significant demographic changes that affect the environmental pressure is the declining number of people per household (3.9 in 1950, 2.3 in 2005 and a forecast of 2.0 in 2040). The decline in household size has, however, a limited effect on environmental pressure compared with the effect of population growth and the growth of real disposable income.
The growth of real disposable income per capita has resulted in almost a quadrupling of actual private consumer expenditures per capita in the past 50 years, an average annual increase of 2.7%. According to the OECD trend scenario, the private consumption per capita shall more than double between now and 2040 (Figure 3.1).
Figure 3.1 Private per capita consumption by the Dutch for the period of 1950-2040 (price indexed expenditures) according to the reference scenario.
3.3 Physical developments in consumption by Dutch citizens
The Dutch consumption pattern has drastically changed in recent decades. Compared with 1950, the share of consumption of private and public transport, leisure time and holidays as well as household goods has increased considerably. Relatively less is spent on food, housing and clothing, even though absolute expenditures have also increased. These trends are forecasted to continue in the future.
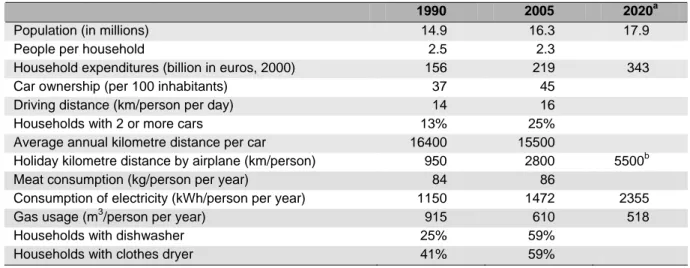
From an analysis of household consumption it appears that use of gas, use of electricity, transport and food together cause more than 70% of total greenhouse gas emissions and 60% of total land use (Nijdam et al., 2005). Changes in the consumption pattern (1990-2005) are reflected in a number of physical consumption indicators (Table 3.1). The increase for a large number of these indicators is related to the steady reduction in prices, particularly of electrical devices and appliances.
Less than half of the Dutch population went on holiday in the 1960s, of which less than half went abroad. Currently more than 80% of the Dutch population goes on holiday, on the average twice a year. In 1969 the average distance to and from the holiday destination was approximately 700 kilometres. In 1990 approximately 1900 kilometres were travelled for holidays and this rose to approximately 3700 kilometres in 2005. Extrapolation of this trend further increases the average distance travelled to more than 6000 kilometres in 2020 and 9500 kilometres in 2040 (Mulder et al., 2007a). The share of holiday kilometres travelled in an airplane increased to 50% in 2005, and is expected to climb further to 90 percent in 2020 (Mulder et al., 2007a).
Table 3.1 Development of population, income and some physical indicators of consumption.
1990 2005 2020a
Population (in millions) 14.9 16.3 17.9
People per household 2.5 2.3
Household expenditures (billion in euros, 2000) 156 219 343
Car ownership (per 100 inhabitants) 37 45
Driving distance (km/person per day) 14 16
Households with 2 or more cars 13% 25%
Average annual kilometre distance per car 16400 15500
Holiday kilometre distance by airplane (km/person) 950 2800 5500b
Meat consumption (kg/person per year) 84 86
Consumption of electricity (kWh/person per year) 1150 1472 2355
Gas usage (m3/person per year) 915 610 518
Households with dishwasher 25% 59%
Households with clothes dryer 41% 59%
a
Estimates according to the Trend scenario (see Appendix 1) b
Estimates based on (Mulder et al., 2007a)
The increase in expenditures on private and public transport and holidays is expressed in the increase of car ownership and the annual amount of kilometres travelled per person. Merely 1 in 18 households had a car in 1950; in 1990, there were 0.9 cars per household and this had increased to an average of more than one car per household in 2005. The prediction for 2040 is an increase in car ownership to 1.2 cars per household, along with a further reduction in household size. The total number of kilometres travelled by car had increased just about 20% between 1990 and 2005. Cars have become somewhat more efficient, but the cars themselves have become heavier and more luxurious (air-conditioned), which has counteracted the gain in efficiency (MNP, 2006). The CO2 emissions from personal transport have increased by 10% per capita between 1990 and 2005.
The transition from coal to natural gas for household heating took place between 1960 and 1975. There was a doubling of energy usage for household heating and hot water in the same period. With the implementation of central heating, people started to heat more rooms rather than just the living room. Gas usage fell since 1980, mainly because of improved insulation of dwellings and use of more efficient boilers. Carbon dioxide emissions from gas use fell by 15% per capita between 1990 and 2005 as a result.
In contrast to gas usage, consumption of electricity continues to increase. Consumption of electricity per capita increased about 30% between 1990 and 2005. This is mainly caused by the increase in the number of electrical appliances; in recent years particularly dishwashers, clothes dryers and computers. The availability of more efficient appliances has not decreased household consumption of electricity. The increase in the number of devices has become too great for this to occur. The need for convenience has led to more and more electronic appliances and devices.
Although relatively less is spent on food in recent decades, the expenditures have increased in an absolute sense. This increase is due to products with higher added value, such as pre-sliced vegetables, salads and ready-to-eat meals. Expenditures on ready-to-eat meals have more than quadrupled in the past decade. Seasonal fruit and vegetables have largely been replaced by out of
season products, cultivated in greenhouses or transported from southern countries. Meat consumption increased by 40% between 1975 and 1995 and has virtually stabilized since then. The expenditures on ‘eating out’ have also continually increased. Currently, approximately one-third of expenditures on food are spent in cafes, restaurants, cafeterias and other establishments. The forecast is that this share shall increase to 40% in 2020 (CPB/MNP/RPB, 2006).
3.4 Environmental pressure from Dutch private consumption
3.4.1 Greenhouse gas emissions
More than 70% of the total greenhouse gas emissions from consumption in 2000 were caused by consumption of gas and electricity, transport and food (Nijdam et al., 2005). This environmental pressure takes place partially in the Netherlands, partially abroad. The development of environmental pressure resulting from household consumption expenditures is related to the increase in the volume of consumption, production efficiency and the composition of the consumption pattern.
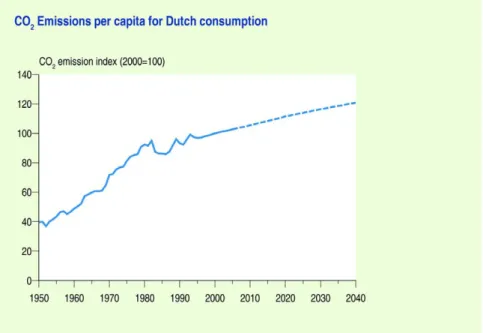
Figure 3.2 CO2 emissions per capita resulting from private consumption in the Netherlands
from 1950-2040 (2000 = 100)
The emission of CO2 per capita has increased by 160% since 1950 (Figure 3.2). The forecast in the trend scenario is that this increase levels off. It is expected that in 2040 an emission will be reached 20% higher than in 2005. A significant portion of these emissions takes place during the manufacture of consumer goods (more than 55% in 2000). Changes in the consumption pattern hardly influence these so-called indirect emissions. The CO2 emissions increase less rapidly than the consumer expenditures because of efficiency improvements during production. Additionally, direct energy usage in households (electricity, gas and car fuels) increases less than total household expenditures. The portion of the CO2 emissions related to direct energy usage is expected to decrease from 40% in
2005 to 30% in 2040 as a result of improvements in electrical devices and transport, and from further insulation of dwellings. In the period of 1980 to 2000, there was an annual decrease of 1.4% per year in CO2 emission per euro spent, due to efficiency improvements. The assumption in the trend scenario is a further annual reduction of 1.5% up to 2040.
3.4.2 Land use
Land use is strongly correlated with the level of consumption: richer countries generally appropriate a greater amount of land per person in the world than poorer countries. These differences, however, are less great than with the emission of greenhouse gas emissions (Figure 2.7), because land use in richer countries is generally more efficient and more intensive than land use in poorer countries.
The total land use dedicated to consumption for all of the Netherlands has increased approximately 7% between 1990 and 2004, which was far below the increase of household expenditures. Without the efficiency improvements in agriculture and food production, the land use for consumption would have been 20% higher in 2004. Per capita land use was in 1990 and 2004 approximately at the same level. Currently, the use of land, necessary for Dutch private consumption, is approximately four times the size of the Netherlands itself. Approximately 45% of this area is used for the production of food, 55% relates to the production of wood, which is to an increasing extent intended for paper products, e.g. for packaging. The Netherlands is a densely populated country where land is scarce. As a consequence, the land use for Dutch consumption to a large extent takes place abroad (Figure 3.3). Dutch consumption therefore contributes to the problems that are coupled with the increasing use of land elsewhere in the world, for example loss of biodiversity.
Land use for Dutch consumption is approximately 0.8 hectares per person. This is lower than in other rich countries in the world (Figure 2.7), which can be attributed to the use of land with high agricultural productivity, in the Netherlands as well as abroad. The trend scenario predicts an increase in land use for Dutch consumption by 2040, leading to more land use abroad. In particular, the land use for wood and paper products is expected to increase. Although consumer expenditures in the Netherlands for food also are expected to increase, the agricultural acreage for food consumption is expected not to increase by 2040. Higher expenditures are mainly related to the higher added values of food and to a lesser extent to the volume of food consumed (Mulder et al., 2007b). Moreover, agricultural productivity is expected to increase (Eickhout et al., 2006).
Figure 3.3 Land use by Dutch citizens in 2000. Land use of less than 50,000 hectares is not represented (Rood et al., 2004)
In the trend scenario, land use for Dutch consumption is expected to increase to approximately 1.0 hectares per person by 2040. In addition to the trend scenario, the Dutch government aims at an increasing use of biomass for energy purposes in 2040. This will lead to an additional land use of 0.1 hectare per capita. Currently, wood production for Dutch consumption mainly originates from regions with low-productive land. If the future increase in demand for wood is met by wood from these areas, this will result in biodiversity loss in these areas, but this will not compete with global food production. If, however, the increasing demand for wood and biomass will be imported from tropical areas, this will result to a loss in tropical biodiversity and will compete with the production of food.
4
Dutch production and sustainability
4.1 Trends in Dutch production
The Netherlands’ gross domestic product (GPD) doubled between 1970 and 2005 with an average volume growth of 2.6% per year. This growth is expected to continue for the coming decades. The estimate is that GDP will increase by approximately 2% per year by 2040. GDP growth is significant related to the strong increase of the added value from commercial services (averaging 3.6% per year between 1970 and 2005). Along with this, the share of the commercial services in total gross added value increased from 38% to 51% in this period.
Figure 4.1 1970-2005-2040 GDP shares based on production sectors (volume, basic prices). Sources: CBS and (CPB/MNP/RPB, 2006)
The increase in the share of services (including government and transport) to the GDP is also expected to continue in the coming decades, and shall account for approximately 80% of the Dutch GDP in 2040 (Figure 4.1). Moreover, the service sector shall also provide approximately 80% of the employment in the Netherlands in 2040.
Greenhouse gas emissions have increased less intensively than production has, because of technological developments. Whereas the GDP in the Netherlands grew almost 45% between 1990 and 2005, CO2 emissions from production in the Netherlands increased approximately 18% (Figure 4.2). The trend scenario forecasts a near doubling of the GDP until 2040, while the CO2 emissions
from production shall increase approximately 29%. The shift to services, technological development and globalization all have an effect on the development of the Dutch production sectors and the development of the production-related environmental pressure in the Netherlands as well as abroad. The following sections shall further address these developments.
Figure 4.2 The changes in CO2 emissions from production, represented by the economic growth
(reference line), changing economic sectoral composition (structure effect) and changing environmental intensity of the economy (efficiency effect), 1990-2040.
4.2 Shift to services
In terms of job opportunities as well as of added value (contribution to the GDP), the share of services in the Dutch economy has vigorously increased at the expense of the share of industry and agriculture. This shift to services, which is occurring worldwide, is based on various factors (Schettkat and Yocarini, 2003). First, labour productivity in the service sector increases less rapidly than in industry and agriculture. Many services are labour-intensive and client-specific, which limits the possibilities for automation or further specialization (Suijker et al., 2002). Second, with increasing incomes, the demand for services increases more rapidly than the demand for goods. Finally, industries increasingly outsource their service activities to specialized companies in the service sector, or they divest divisions of the original company, which subsequently continue as an independent company in the service sector. Activities that used to be performed by the companies in the industry themselves, and which were therefore included in the statistics for industry, are included in the statistics for business service sector after outsourcing (Suijker et al., 2002). Consequently, there is no question of an actual shift in the economy, but of a statistical artefact (Schenk and Theeuwes, 2002).
Figure 4.3 1990-2005-2040 shares of CO2 emissions based on production sectors.
Sources: CBS and (CPB/MNP/RPB, 2006).
While the share of the services in the GDP increases (Figure 4.1) the share in the CO2 emissions are forecasted to decrease in the coming decades (Figure 4.3). The share remains limited because the services, with the exception of the transport sector, are relatively energy-efficient. The consumption of electricity by the service sectors contributes indirectly to the CO2 emissions; in 2003 the service sector accounted for approximately 25% of the entire consumption of electricity in the Netherlands. The share of CO2 emissions by the energy companies increased intensely between 1990 and 2005, and shall increase to 50% for 2040 according to the scenario.
The CO2 emissions increase less severely than economic production. The shift to services contributes merely a small part to this because it doesn’t replace industrial production, but rather it augments it. Moreover, a greater efficiency improvement can be realized with the manufacture of goods than with services. Lastly, the service sector itself also generates environmental pressure, chiefly due to the use of transport and energy.
4.3 Technological development and eco-efficiency
Technological developments in production sectors often lead to a reduction in detrimental emissions. Environmental policy provides a significant motive for such environmental technological developments, through stimulating the diffusion of technological applications or by giving incentive for innovation. Setting standards can also play a role by establishing emission standards through which the development of less environmentally friendly technology is either curbed or forbidden. In some cases a win-win situation can occur from this: as a result of strict regulation, environmental gain
can be achieved on the one hand, while on the other hand, companies can increase their competitiveness through innovation (Porter and Van der Linde, 1995).
Along with regulation, innovation and diffusion procedures are also encouraged through the implementation of economic stimulation such as subsidies, quota and fiscal advantages that provide advantages to environmentally friendly, as opposed to environmentally polluting, technologies. Market-based policy instruments are frequently preferred because of their efficiency, but the effectiveness is strongly related to the design of the instrument (Jaffe et al., 2002). An important instrument for stimulating innovations is investing in research and development (R and D). Among the levels of R&D investments by the OECD countries, the Netherlands is somewhere in the middle range; and the level of the EU in its entirety is substantially lower than that of the US or Japan. With the comparison of investments in environmental research, in contrast, the Netherlands scores relatively well (Figure 4.4).
Figure 4.4 Public investments in environmental R&D (2004) for the EU 15, in dollars per capita, based on figures from Eurostat and OECD. No figures are available for Italy and Luxemburg.
To a great extent, the fact that the environmental pressure related to production has increased less severely than the production itself can be attributed to technological reduction measures. Technological measures have led to a decrease in acidification emissions (absolute decoupling of economic growth and environmental pressure). CO2 emissions still increase, however, this is much less severe than it would have been without the advancements in technology. Technological measures do not always turn out to be sufficient to achieve actual reductions in CO2 emissions. Though, robust reductions have been achieved for other greenhouse gases by applying technological measures.
The reduction costs per unit of emission are decreasing through technological developments over time, such that emission reductions continue to become cheaper (MNP, 2006). The learning effects from more stringent standards, and by insisting on the diffusion of environmentally friendly technology, can lead to not only substantial reductions, but also to decreased costs per reduction unit. These learning effects often result in greater results than the approach of using the first cheap reduction measures conceived, selecting an ad hoc ‘easy solution’, leaving the more inconvenient and therefore more expensive measures postponed to some future date.
4.4 Globalizing Dutch production and consumption
4.4.1 Interrelationship of the Netherlands in the global economy
Free and liberalized international trade is important for the development of a small open economy such as the Dutch economy. The Dutch economy is becoming increasingly more closely interrelated with other economies in the world. One manner this is manifesting itself is in the vigorous increase of trade flows in recent years: between 1970 and 2005 the import as well as the export of goods has grown more robustly than the entire Dutch economy. Additionally, export has more rapidly increased than import, respectively averaging 5.2% and 4.5% per year, causing the balance of trade surplus to increase to more than 7.5% of the GDP in 2005 (CPB, 2007). Internationally seen, the Netherlands is a large exporter: the Netherlands wasplaced sixth on the World Trade Organization’s ranking list of largest exporters in the world in 2005, with a share of almost 4% of the entire export (WTO, 2006).
Dutch manufacturers can sell their products abroad for a good price. The Netherlands gained more than 30% of its GDP in 2003 through export; this share has hardly changed since 1990. The share in export for industry is approximately 50% of its entire market, which is greater than the approximate 15% of the service sector, which focuses more on the domestic market. Service markets are, however, becoming continually more international-oriented. On the other hand, import provides a greater supply and lower prices of products for the Dutch consumer. Directly imported goods make up 16% of household consumption.
The Netherlands trades chiefly with European countries (Figure 4.5). More than 80% of the exported goods go to other European countries. The share of Asia has increased vigorously in recent decades, mainly because of the growth in China’s share in the entire import from 0.2% in 1970 to almost 8% in 2005. The shares of Africa, Central America and South America in the entirety of trade flows remain limited to a few per cents. Additionally, the Netherlands has a significant role as transit country to the European hinterland. A share of the import is then again directly exported without the Netherlands needing to do much to it. This re-export has created an increasingly greater portion of the total export in the Netherlands since the 1980s (approximately 40% in 2005). This involves products from China to an increasing degree. Two thirds of the Dutch import from China is directly exported again.