CIRCULAR ECONOMY:
MEASURING INNOVATION IN THE
PRODUCT CHAIN
Policy Report
José Potting, Marko Hekkert, Ernst Worrell
and Aldert Hanemaaijer
Circular economy: Measuring innovation in the product chain
English translation of the report ‘Circulaire economie: Innovatie meten in de keten’ © PBL Netherlands Environmental Assessment Agency
The Hague, 2017
PBL publication number: 2544
Corresponding author
jose.potting@pbl.nl
Authors
José Potting1, Marko Hekkert2, Ernst Worrell2 and Aldert Hanemaaijer1 1 PBL Netherlands Environmental Assessment Agency
2 Copernicus Institute of Sustainable Development, Utrecht University
Acknowledgements
Marc Pruijn and Tjeerd Meester (Ministry of Infrastructure and the Environment); Mattheüs van de Pol (Ministry of Economic Affairs); Mandy Willems (Rijkswaterstaat); Jurgen
Ganzevles, Frank Dietz, Ton Manders, Trudy Rood and Alexander van der Vooren (PBL); Dorith Vermunt, Deborah Kuppens and Hümeyra Izol (UU)
Graphics
PBL Beeldredactie
Production coordination
PBL Publishers
Parts of this publication may be reproduced, providing the source is stated, in the form: Potting J, Hekkert M, Worrell E and Hanemaaijer A, (2016). Circular Economy: Measuring innovation in product chains. PBL Netherlands Environmental Assessment Agency, The Hague.
PBL Netherlands Environmental Assessment Agency is the national institute for strategic policy analysis in the field of environment, nature and spatial planning. We contribute to improving the quality of political and administrative decision-making by conducting outlook studies, analyses and evaluations in which an integrated approach is considered paramount. Policy relevance is the prime concern in all our studies. We conduct solicited and unsolicited research that is both independent and scientifically sound.
Contents
F I N D I N G S . . . 4
F U L L R E S U L T S . . . 9
1
INTRODUCTION
9
1.1 About this study 11
1.2 Approach 11
1.3 Report structure 13
2
CONCEPTUAL FRAMEWORK
14
2.1 Goals for the transition towards a circular economy 14
2.2 CE Transition and innovation 16
2.3 Measuring progress of CE transitions 19
3
CASES
23
3.1 Plastic packaging 23
3.2 Electrical and electronic equipment 27
3.3 Circular Economy Green Deals 28
3.4 Circular Economy Best Practices 33
4
DISCUSSION
37
4.1 CE transition and innovation 37
4.2 Circular economy indicators 37
4.3 CE progress in the Netherlands and internationally 39
4.4 Support for the circular economy indicators 40
5
CONCLUSIONS
41
FINDINGS
At the request of the Dutch Ministry of Infrastructure and the Environment, PBL Netherlands Environmental Assessment Agency and Utrecht University have explored ways to measure progress of a transition towards a circular economy in product chains. This study focuses on identifying what needs to be measured, rather than how measuring should be carried out. We developed a conceptual framework about the role of innovation in circular economy transitions (CE transitions) in product chains, and applied it to a number of cases. The framework and case applications serve to determine what type of information is needed to measure the progress of CE transitions in product chains.
The second Dutch coalition government under Prime Minister Mark Rutte aims to establish a circular economy. The Dutch Ministry of Infrastructure and the Environment describes a circular economy as an economic system based on the reusability of products and product components, recycling of materials, and on conservation of natural resources while pursuing the creation of added value in every link of the system. The government wants to promote the CE transition through better closing of product and material chains.
This study targets product chains. A product chain tracks products from the extraction of natural resources to waste treatment after they have been discarded. Recovering materials from a discarded product often requires large amounts of energy, and pollution and mixing of materials reduces their quality which means that very often recycled (secondary) materials cannot be applied again for the same type of product. Frequently, these materials do find an application in other products with lower quality requirements. Therefore, a material chain may be longer than a single product chain.
In a circular economy, the materials recycled from a discarded product ideally retain their original quality so that they can be applied again in a similar product. As a result, no additional natural resources are needed to produce materials, and discarded products no longer become waste. This ultimate circularity, in which a product chain is closed because the materials can be applied over and over again (Figure 1), is probably not feasible in practice. It is, however, the ideal situation which CE transitions aspire to bring about.
More circularity is better for the environment
Several circularity strategies exist to reduce the consumption of natural resources and materials, and minimise the production of waste. They can be ordered for priority according to their levels of circularity (Figure 1). Smarter product manufacturing and use, for example by product sharing, are generally preferred over extending the lifetime of products, because this product being used for the same product function or more users being served by one product (strategy with high circularity). Lifetime extension is the next option and is followed by recycling of materials through recovery. Incineration from which energy is recovered has the lowest priority in a circular economy, because it means the materials are no longer available to be applied in other products (low-circularity strategy). As a rule of thumb, more circularity equals more environmental benefits.
A higher level of circularity of materials in a product chain means that those materials remain in the chain for a longer period, and can be applied again after a product is
discarded, preferably retaining their original quality. As a result, in principle, fewer natural resources are needed to produce new materials required for manufacturing products and for their subsequent use. Avoided resource extraction and production of materials benefit the environment. There are of course exceptions to this rule of thumb. For example, making a product chain more circular may lead to increased natural resource consumption, usually in the form of (fossil) fuels. This occurs in chemical recycling of contaminated plastics which usually requires relatively large amounts of energy to decompose the material to its initial
building blocks, and then synthesise these building blocks back into material (back-to-monomer recycling). Another example is intensifying product use, by facilitating access to the use of a product (i.e. product sharing or multi-functional products), which may lead to unintended additional forms of use. Car-sharing may motivate people without cars to opt for driving in situations they formerly would not have. It is advisable to examine the possibilities of rebound or secondary effects, but generally speaking, more circularity in a product chain leads to reduced consumption of natural resources and materials, and consequently to fewer environmental effects brought about by that product chain, as well as in related product chains.
Three types of innovation in product chains
CE transitions may need innovation and socio-institutional change. Innovation can take place in technology, product design and revenue models. Socio-institutional change involves reviewing written and unwritten rules, customs and beliefs. Three types of CE transitions may be distinguished with regard to the use of technology in product chains:
1. CE transitions in which the emergence of specific, radically new technology is central and shapes the transition. This means radical innovation in core technology, i.e. the specific technology around which a product is centred. Socio-institutional change is needed to
give the new technology a place in society. A typical example is the recent emergence of bioplastic which has already secured its place.
2. CE transitions in which socio-institutional change is central and where technological innovation plays a secondary role (incremental innovation in core technology). A good, perhaps somewhat extreme example is that of packaging-free shops.
3. CE transitions in which socio-institutional change is central, but are facilitated by enabling technology. An example is the transition to what has become known as the sharing economy. This transition from owning a product to purchasing its services primarily involves socio-institutional change, but this is not possible without information technology to link service providers and users.
There is a major difference between the type 3 transition on the one hand, and types 1 and 2 on the other. In contrast to types 1 and 2, achieving a type 3 transitions needs enabling technology of a generic character, such as information technology, or new materials. Type 3 transitions are promoted by technology development in other areas of knowledge than those specific to a given product chain.
When monitoring progress towards a circular economy, it matters which type of CE transition is envisaged and what roles are being played by socio-institutional change and innovation. Besides innovation in technology supporting the three types of CE transitions, this report also looks at innovation in product design and revenue models.
Radical technological innovation not always needed for CE transitions
This report evaluates a large number of cases in which CE transitions in product chains are central. For each case, the study establishes the circularity strategies, the role of socio-institutional change (changes in written and unwritten rules, customs and beliefs) and the role of innovation in technology, product design and revenue model. The evaluations show that radical technological innovation is mainly of interest for recycling. In most cases, this involves adapting an existing recycling technique to the specific quality requirements of the product in question, following a process of incremental technological innovation. Such adaptations may demand substantial efforts from the companies involved, but they can be made by using existing technological knowledge. When the focus is on radically new technology, the situation for CE transitions is rather different, because radical innovations emerge from a fundamentally new knowledge base and lead to a substantially different product. Successful implementation of radical technological innovation requires a context that supports innovation. We call this the building of a new Technological Innovation System. Incremental technological innovations arise from existing knowledge for which technological innovation systems are already present. These systems simply need to be adapted. Radical technological innovation is easier to monitor than incremental technological innovation, since the emergence of a new innovation system is far more conspicuous than adaptations to an existing innovation system.
Socio-institutional change largest challenge for CE transitions
According to the CE Best Practices’ and CE Green Deals’ practical cases, recycling usually involves high-grade application of recovered materials into new products and converting biomasswaste for useful applications. Generally, recycling does not lead to substantial changes in products which would require socio-institutional change in the form of revisions to written and unwritten rules, and questioning customs and beliefs. These cases under the CE Best Practices and CE Green Deals usually face relatively small obstacles and there is no need for a radical change in the regulatory framework of laws and policies. Nor do they trigger profound changes to our cognitive structures (our understanding of how the world works and what is considered normal), and our normative framework (that which is
considered legitimate). However, more radical socio-institutional change is needed throughout the product chain when aiming at strategies for higher levels of circularity. Sharing washing machines and clothes dryers in Dutch apartment buildings, one of the evaluated hypothetical cases, would require a change in the mindset of residents, since at present, privately owned appliances are common in the Netherlands. When sharing involves a usage and service contract, there is an additional requirement for a certain level of
organisation of the (association of) owners. Manufacturers and retailers will also need to take planned action geared towards these issues. CE transitions based on higher circularity
strategies call for more radical socio-institutional change throughout the whole product chain than transitions based on lower circularity strategies. Such changes are difficult to monitor.
Measuring CE transitions requires focus on their processes and effects
The evaluation of the roles of innovation and socio-institutional change in CE transitions is used to determine the type of information needed to measure the progress of CE transitions in product chains. It is advisable to distinguish between a transition process and its effects. The process includes all the steps needed to realise a CE transition. The effects are the results of the process with regard to circularity, the environment and the economy. The development of a measuring protocol for the CE transition process would be a beneficial improvement, since until now no clear and workable method has been available. The European Environment Agency (EEA) has already formulated a set of questions to assess circularity efforts, addressing the consumption of natural resources and materials, the use of products and waste treatment issues. These questions focus on the progress of the CE transition at the national level. However, this report deals with CE transitions in individual product chains. Therefore, in this study, the questions of the EEA are adapted to enable the measurement of individual product chains. The study is complemented with additional questions about the CE transition process and the effects on the environment and the economy. Table 1 summarises the questions for monitoring the progress of CE transitions in product chains. These questions are relevant to all types of innovation and socio-institutional change, though strategies for high-level circularity will provide different answers from low-level circularity strategies. High-low-level circularity strategies more often require socio-institutional changes throughout the product chain, and innovation in product design and revenue model, whereas low-level strategies more often rely on technological innovation.
Circular economy goes beyond recycling
At present, of all waste generated in the Netherlands about 93% is processed effectively for new uses, with 79% of that volume corresponding to recycling. However, most recycling concerns low-grade solutions, and the consumption of natural resources is still high. Moves forward should preferably include a shift to high-grade material recycling, and substantially higher volumes of product reuse. Almost all the CE Green Deal and CE Best Practice cases examined here, aim at increased volume or higher grade recycling. Along with recycling, other circularity strategies are frequently followed, such as in the lease-a-jeans case and one concerning furniture restoration. However, the strong focus on recycling remains remarkable. This is acceptable as long as recycling is high grade, and the recycled material retains its original quality. The upcycling of biomass waste into useful products also fits in this recycling strategy. However, a more ambitious CE transition towards substantially lower resource and material consumption and less generation of waste will preferably be based on
high-circularity strategies, such as smarter manufacturing and use of products, and extending the lifetime of products and product components. Recycling alone, and low-grade recycling in particular, is still closely related to a linear economy.
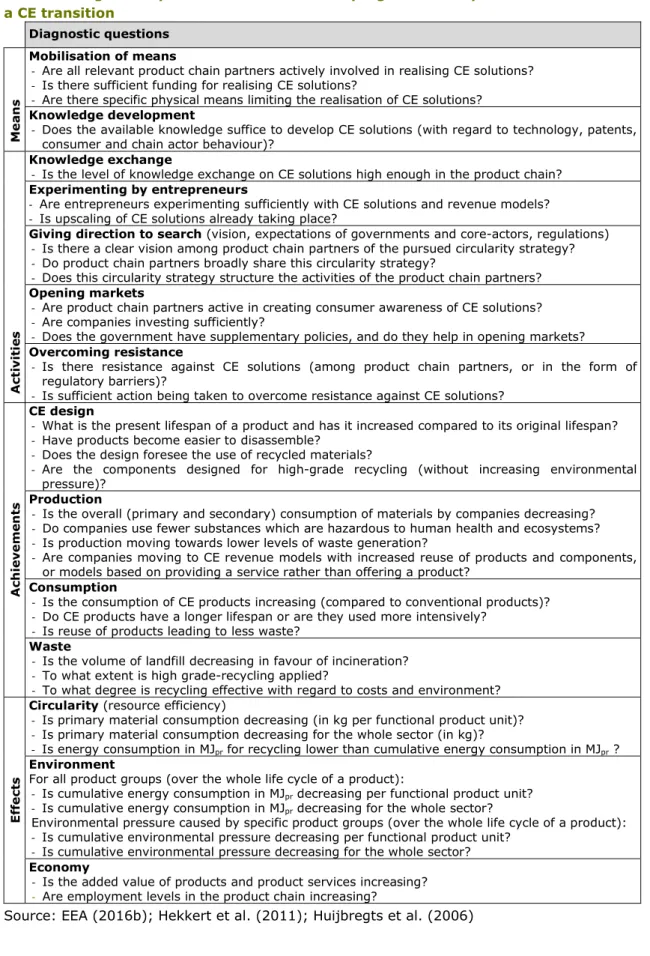
Table 1: Diagnostic questions to measure the progress of the process and effects of a CE transition Diagnostic questions M ean s Mobilisation of means
- Are all relevant product chain partners actively involved in realising CE solutions? - Is there sufficient funding for realising CE solutions?
- Are there specific physical means limiting the realisation of CE solutions?
Knowledge development
- Does the available knowledge suffice to develop CE solutions (with regard to technology, patents, consumer and chain actor behaviour)?
A ct iv it ie s Knowledge exchange
- Is the level of knowledge exchange on CE solutions high enough in the product chain?
Experimenting by entrepreneurs
- Are entrepreneurs experimenting sufficiently with CE solutions and revenue models? - Is upscaling of CE solutions already taking place?
Giving direction to search (vision, expectations of governments and core-actors, regulations)
- Is there a clear vision among product chain partners of the pursued circularity strategy? - Do product chain partners broadly share this circularity strategy?
- Does this circularity strategy structure the activities of the product chain partners?
Opening markets
- Are product chain partners active in creating consumer awareness of CE solutions? - Are companies investing sufficiently?
- Does the government have supplementary policies, and do they help in opening markets?
Overcoming resistance
- Is there resistance against CE solutions (among product chain partners, or in the form of regulatory barriers)?
- Is sufficient action being taken to overcome resistance against CE solutions?
A ch ie ve m en ts CE design
- What is the present lifespan of a product and has it increased compared to its original lifespan? - Have products become easier to disassemble?
- Does the design foresee the use of recycled materials?
- Are the components designed for high-grade recycling (without increasing environmental pressure)?
Production
- Is the overall (primary and secondary) consumption of materials by companies decreasing? - Do companies use fewer substances which are hazardous to human health and ecosystems? - Is production moving towards lower levels of waste generation?
- Are companies moving to CE revenue models with increased reuse of products and components, or models based on providing a service rather than offering a product?
Consumption
- Is the consumption of CE products increasing (compared to conventional products)? - Do CE products have a longer lifespan or are they used more intensively?
- Is reuse of products leading to less waste?
Waste
- Is the volume of landfill decreasing in favour of incineration? - To what extent is high grade-recycling applied?
- To what degree is recycling effective with regard to costs and environment?
E
ffe
ct
s
Circularity (resource efficiency)
- Is primary material consumption decreasing (in kg per functional product unit)? - Is primary material consumption decreasing for the whole sector (in kg)?
- Is energy consumption in MJpr for recycling lower than cumulative energy consumption in MJpr ? Environment
For all product groups (over the whole life cycle of a product):
- Is cumulative energy consumption in MJpr decreasing per functional product unit?
- Is cumulative energy consumption in MJpr decreasing for the whole sector?
Environmental pressure caused by specific product groups (over the whole life cycle of a product): - Is cumulative environmental pressure decreasing per functional product unit?
- Is cumulative environmental pressure decreasing for the whole sector?
Economy
- Is the added value of products and product services increasing? - Are employment levels in the product chain increasing?
FULL RESULTS
1 Introduction
The second government under Prime Minister Mark Rutte specified aspirations towards a circular economy in its 2012 Coalition Agreement. The Dutch Ministry of Infrastructure and the Environment (Ministry of IenM) (IenM) describes it as an economic system based on the reusability of products and materials and on conservation of natural resources while pursuing the creation of value in every link of the system (Ministry of IenM, 2013). Product reuse and material recycling promote conservation because fewer natural resources have to be
extracted for the production of new materials. It also means less waste is generated and fewer harmful substances are released into the soil, water and air. In addition, it creates a shift from the use of grey to green resources and energy.
The idea of a circular economy is enthusiastically received in the Netherlands and abroad (Ganzevles et al., 2016). It is seen as a logical alternative to a linear economy. In a linear economy, natural resources are extracted to produce new (primary or virgin) materials which in turn are used to manufacture products that are incinerated or dumped in a landfill after use (Ministry of IenM, 2013, 2014, 2015a).
The Netherlands does not have a linear economy. The Dutch economic system lies somewhere between a linear and a circular economy (Figure 1.1). At present, of all waste generated in the Netherlands, about 93% is processed effectively for new uses, with 79% of the processed volume corresponding to recycling. However, most recycling concerns low-grade solutions, and the consumption of natural resources is still high. Moves forward should preferably include a shift to high-grade systems for material recycling, and substantially higher volumes of product reuse. The national government wants to promote a transition to a circular economy (CE transition) by closing product and material chains more effectively (Ministry of IenM, 2013, 2014, 2015a).
A product chain includes all steps from extraction of raw materials up to the processing of the discarded product as waste. Recycling materials from a discarded product might be energy intensive, and the recycled materials often cannot be applied again for the same type of product because they are of lower quality due to material mixing and contamination. This is why recycled materials are mostly applied to manufacture products with lower quality requirements, such as road foundation layers in which typically construction and demolition waste is processed. A material chain can therefore be longer than a single product chain. In a circular economy, the materials from a discarded product ideally maintain their original quality so they can be applied again in the same type of product. As a result, no natural resources are needed for the production of new materials, and discarded products no longer become waste. This ultimate circularity, in which a product chain is closed because the materials can be applied over and over again (Figure 1), is probably not feasible in practice. It is, however, the ideal situation which CE transitions aspire to bring about.
Different product chains will require different forms of transition towards a circular economy. This is partly due to the diversity of product properties in terms of their function, durability, and composition. These properties may in turn prompt different CE transition goals. This means that CE transition processes can vary greatly with regard to the roles of innovation (in technology, product design and revenue model), and socio-institutional change (in the behaviour of consumers and other actors, and in laws and regulations). The following two examples illustrate this point.
− In the Netherlands, a deposit-refund system is in place for PET bottles larger than 0.5 litres. Collection and recycling of these bottles is relatively effective, because it concerns the waste stream of a single material (OVAM, 2015). A CE transition goal regarding PET bottles might be to revert to the situation before 2006, when large PET bottles were not recycled into secondary PET, but cleaned and refilled (Milieucentraal, 2015). The
appropriate technology already exists, but its reintroduction requires a change in the mind-set of companies, and maybe also in national policies. The organisations involved want to cancel the current deposit-refund system, arguing that it is expensive and laborious (Mileucentraal, 2015), although they did commit to increasing the proportion of recycled PET in their bottles (Framework Agreement Packaging, 2013-2022 2012, 2013). At present, the government is leaving the issue to the initiative of companies, albeit subject to the conditions set forth in 2013 in the Framework Agreement Packaging 2013-2022.
− Waste Electrical and Electronic Equipment (WEEE) should be recycled through the
organisations Wecycle and ICT Milieu. In practice, however, they only collect about 30% of all discarded equipment. About 80-90% of what they collect is recycled (ICT Milieu, 2014; Wecycle, 2016). Records show that approximately 30% of all electrical and electronic equipment is disposed of in otherwise documented ways, with large household appliances in particular going directly to recycling stations. A further 10% of discarded equipment is exported for reuse and roughly 10% ends up as residual waste (Huisman et al., 2012). There are no data on the destination of the remaining 20%.
This means there is considerable scope for improving the current collection of WEEE. A CE transition goal could be a different revenue model in which electrical and electronic equipment remains the property of the manufacturers and is returned to them at the end of the equipment’s service life. This stimulates the manufacturer to design and
manufacture products in ways that favour repair, component reuse and material recycling. It also gives both manufacturers and consumers a more active role in WEEE-collection. This revenue model, however, also calls for a new cooperation agreement between manufacturer and consumer to ensure good service and careful use of electrical and electronic equipment.
1.1 About this study
The Ministry of Infrastructure and the Environment is interested in knowing how much progress has been made in the transition from linear to circular product chains. This includes the CE transition process as well as its effects on the consumption of natural resources and materials (i.e. circularity), the environment and the economy. Numerous measuring instruments and indicators are currently available to monitor the effects on circularity, the environment and the economy (MVO-Netherlands, 2015; RIVM, 2016; CBS et al., 2014 and EEE, 2016a). However, the challenge lies in compiling the multitude of indicators into a manageable set that adequately reflects the effects of a CE transition. Measuring progress of the CE transition process is more difficult. There are, after all, large differences across product chains and their CE transition goals with regard to innovation, required efforts or resistance from actors in the product chain and other socio-institutional factors.
The Ministry of Infrastructure and the Environment has asked PBL to investigate how progress towards a circular economy, which includes both the CE transition process and its effects, can be measured in an individual product chain. PBL has researched this question together with Utrecht University. In this study, we focus on identifying what needs to be measured, rather than how measuring efforts should be carried out. We have developed a conceptual framework for circular economy transitions in product chains, and applied it to a large number of cases. The framework and its application evaluate the role of innovation in CE transitions. This is instrumental for the next step of determining what type of information is needed to measure the progress of CE transitions in product chains.
1.2 Approach
The conceptual framework is based on the 2005 policy evaluation scheme of the Netherlands Court of Audit (Figure 1.2). Since 1991, Dutch ministries are bound by law to periodically evaluate the results of their policies. The policy evaluation scheme is relevant for all
deliberate initiatives towards CE transitions, including those where the government does not play an active role because these also operate towards achieving specifically set transition goals.
The policy evaluation scheme drawn up by the Netherlands Court of Audit (NCA, 2005) is based on the generic policy process. Each policy process consists of four aspects (means, activities, achievements, and effects), which can also be considered process stages (input, throughput, output, and outcome). A policy process starts with setting the policy goal, which, for our purposes, is the CE transition goal for a given product chain. It specifies the aspired achievement needed to realise the transition (CE achievement goals), and preferably also the desired effects on circularity, the environment and the economy (CE effect goals).
A core CE achievement goal within each CE transition is to consume fewer natural resources and new materials in product chains, in other words, to achieve a higher level of circularity. Examples of circularity strategies are high-grade material recycling or product reuse. A circularity strategy can require cooperation from consumers and other chain actors, and adjustments to certain laws and regulations, financing, technology use, product design, revenue model and other matters. If these 'means' are not available at the beginning of the policy process for transition, they may be included as goals, and 'activities' need to be planned to meet the goals. Means, activities and achievements are the main elements of the CE transition process in this study. Unlike the policy evaluation scheme (applied to the policy process), here we distinguish between the process to achieve a CE transition and the effects of the CE transition process on circularity, the environment and the economy.
A policy evaluation investigates if the intended policy outputs (achievements) have been delivered and the desired policy effects have been realised (effectiveness evaluation), and whether the cost of the entire policy process is reasonable or not (efficiency evaluation) (NCA, 2005). This study focuses on measuring policy achievements and effects. In other words, it is an effectiveness evaluation, complemented with an examination of activities and means, including chain actors and innovation and budget issues. Means, activities and achievements together constitute the CE transition process. An evaluation of the progress of CE transitions in product chains needs to address both the process itself and its effects on circularity, the environment and the economy.
Innovation plays a special role in CE transitions. Though often associated with technology, in CE transitions in product chains innovation also applies to product design and revenue models. For all three types of innovation to gain a foothold, socio-institutional change might first be needed. In this study, we evaluate the roles played by these types of innovations and socio-institutional change in CE transitions in product chains. This is necessary to be able to determine, in the next step, the type of information needed to measure the transition’s progress.
The conceptual framework is the result of integrating the relevant literature, and linking the joint and complementary expertise of the authors. It has been further strengthened by the interaction with its application to a large number of cases in which CE transitions in specific product chains are central. First, hypothetical circularity strategies are formulated and evaluated for two product groups, plastic packaging and electrical and electronic equipment. Then, we identify and evaluate the circularity strategies adopted in two sets of practical cases, 36 CE Green Deals and 32 CE Best Practices, covering a wide range of product chains. The evaluations show whether different circularity strategies for CE transitions in a range of product chains lead to differences in the call for innovation and socio-institutional change. National government officials who are involved in circular economy policies have agreed to discuss the conceptual framework and its applications, and have provided valuable feedback to further refine our model. Please refer to the Colophon for individual acknowledgements.
1.3 Report structure
The conceptual framework is described in Chapter 2. In Chapter 3, the framework is applied to a series of hypothetical and practical cases. Chapter 4 discusses the results of Chapters 2 and 3, and also reflects on the framework's relevance for progress towards a circular economy in the Netherlands and in other countries, seen in the context of international policy. Chapter 5 rounds off the report and presents the conclusions.
2
C
onceptual
framework
The Dutch national policy programme From Waste to Resource (Ministry of IenM, 2013) and the European Commission's action plan for a circular economy (EC, 2015) highlight the importance of being able to measure the progress towards a circular economy. Until now, no generally accepted methods have been devised (EEA, 2016b), but the European Commission has announced a framework for measuring the progress in its CE Action Plan (EC, 2015). It is to be developed by the European Commission together with the European Environment Agency (EEA) and the European Statistical Office (Eurostat) in consultation with the Member States. The question of how to measure CE progress has become relevant in the Netherlands in the context of the recently released government-wide CE policy programme A circular economy in the Netherlands by 2050 (Ministry of IenM, 2016a), and the CE advice ‘Working on a circular economy: No time to lose’ (Werken aan een circulaire economie: Geen tijd te verliezen) published recently by the Social and Economic Council of the Netherlands (SER, 2016).
2.1 Goals for the transition towards a circular economy
The Dutch Government recently released the Government-wide CE policy programme A circular economy in the Netherlands by 2050 (Ministry of IenM, 2016a), coordinated by the Ministry of Infrastructure and the Environment, which is the successor of the former policy programme From Waste To Resources (VANG). The Ministry wants to achieve a number of core CE goals with the programme (Ministry of IenM, 2013; 2014; 2015):• Reduced consumption of natural resources, sustainable resource extraction, and security of supply of resources;
• Less waste, less emissions, more natural capital; • More earning power, more jobs.
A higher level of circularity of materials in product chains means that, in principle, smaller amounts of natural resources are needed for the production of new (primary or virgin) materials. The avoided material production benefits the environment. In practice, however, increasing the circularly of one product chain may lead to less circularity in another. For example, increased application of recycled materials in one product chain might result in fewer recycled materials being available for application in other product chains (Ganzevles et al., 2016). Making a product chain more circular could also require more natural resources, often in the form of fossil fuels. This occurs in chemical recycling of highly contaminated plastic through recycling in which the material is decomposed to its initial building blocks, and then these building blocks are synthesised back into material again (back-to-monomer recycling). This usually requires more energy than producing new plastic. Furthermore, intensifying product use by facilitating access or multiple functionality might lead to an unintended additional increase in product use. For example, car-sharing may motivate people without cars to opt for driving in situations they formerly would not have . It is advisable to examine the possibilities of secondary or rebound effects, but, as a rule of thumb, more circularity in a product chain leads to reduced consumption of natural resources and production of new materials, and consequently has fewer environmental effects
(Ganzevles et al., 2016).
Various approaches, known as R-strategies, have been developed to achieve less resource and material consumption in product chains and make the economy more circular. Several R-lists exist (CE and MVO, 2015; EMF, 2013; RLI, 2015; Vermeulen et al., 2014). In this study,
we have used the R-list represented in Figure 2.1. All R-lists resemble each other and differ mainly in the number of circularity strategies they put forward. They typically present a range of strategies ordered from high circularity (low number) to low circularity (high R-number). R0 and R1 strategies decrease the consumption of natural resources and materials applied in a product chain by less product being needed for delivering a same function. Therefore, R0 and R1 are generally also considered circularity strategies, even though they do not necessarily involve increasing the reuse of products and components, or reapplication of recycled materials.
The available R-lists all elaborate on the Ladder van Lansink which establishes a priority order for waste treatment methods. The name is derived from a government resolution which was adopted in 1979. Since then, it has played an important role in Dutch policies on waste treatment, similar to the marked influence of the waste hierarchy on an international level (EC, 2010). The R-list in Figure 2.1 is a combination of the R-lists drawn up by Rli (2015) and Vermeulen et al. (2014). It enables the formulation of circularity strategies in which the primary function of a product is maintained. Figure 2.2 shows the points in a product chain where different circularity strategies are relevant, and the chain actors who play a role in those strategies.
2.2 CE Transition and innovation
Sustainability transitions often involve a radically different organisation of societal services, such as the supply of energy, transport and food production and distribution. A typical element in sustainability transitions is socio-institutional change, that is, the changes in regulations, customs, standards, manufacturing practices and consumer behaviour.
Sustainability transitions are frequently induced by radical technological innovations though, and therefore often labelled as technological transitions (Geels, 2002). The socio-institutional changes, however, typically make sustainability transitions more complex. After all, a
radically different organisation of societal services quickly calls for changes in legislation and policy, in the cognitive structures that underpin people's perception of the world and sense of what is normal, and in the normative frameworks that define what people consider legitimate (Fuenfschilling and Truffer, 2013).
CE transitions differ from most other sustainability transitions in their focus on change from a linear to a circular application of natural resources and materials. Three types of CE
transitions can be distinguished with regard to the use of technology in product chains: 1. CE transitions in which the emergence of a specific, radically new technology is central
and shapes the transition (radical innovation in core technology). Socio-institutional change is needed to give the new technology a place in society. A typical example is the recent emergence of bioplastic which has already secured its place.
2. CE transitions in which socio-institutional change is at the forefront and technology is not as dominant as in type 1 transitions. Technological innovation plays a minor role or no
role at all (incremental innovation in core technology). A good, perhaps somewhat extreme example is that of the packaging-free shops.
3. CE transitions in which socio-institutional change is central, but which are facilitated by enabling technology. An example is the transition to what has become known as the sharing economy. This transition from owning a product to purchasing its services
primarily involves a socio-institutional change, but this is not possible without information technology to link service providers and users.
The major difference between the type 3 transition on the one hand, and types 1 and 2 on the other hand, is that the enabling technology needed for type 3 is generic. There is thus no need for specific technological innovation to achieve a type 3 transition. Type 3 transitions are promoted by technology development in other areas of knowledge than those specific to a given product chain. For monitoring progress towards a circular economy, it matters which type of CE transition is being aspired.
Type 1: CE transitions in which radically new technology is central
Radically new technology arises from a fundamentally new knowledge base (Shaz and Maw, 2012). The central role of radically new technology leading to a fundamentally different product, features a transition as a struggle between existing and new technology, and between the vested interests around existing technology and challengers and new entrants in the field (Chandy and Tellis, 2000; Penna and Geels, 2012; Shaz and Maw, 2012; Smink et al., 2013). Radically new technology is often expensive, suffers from technical
imperfections and usually deviates from various socio-institutional rules and norms (Smink et al., 2014). Existing technology, on the other hand, enjoys the advantage of large-scale application and has network benefits and is therefore often cheap and, after years of co-evolution, perfectly adjusted to various socio-institutional structures (Kemp, 1994; Unruh, 2000). The interests around existing technology are considerable, and established players act strategically to protect their positions. This unequal struggle is difficult to win by radically new technology (Wilson, 2012).
Hekkert et al. (2007) suggest that radically new technology should go through the process of building-up the same perfect socio-institutional embedding as existing technology enjoys. The establishment of the Technological Innovation System they have put forward is a time-consuming and risky process, which largely accounts for the slow and uncertain progress of technological transitions. For monitoring, it needs to be identified to what extent a new technological innovation systems has been built-up. If the development of radically new technology to manufacture a substantially different product takes place under a new
Technological Innovation System, the results will be perfectly distinguishable from the output of existing technology with its conventional products and innovation systems.
Type 2 and 3: CE transitions in which socio-institutional change is central
Radically new technology is less relevant for transitions in which socio-institutional change is central. Such transitions can usually rely on simply adapting existing technology. This kind of incremental technological innovation, leading to modifications to existing products, leans on the existing knowledge base and takes place within an existing innovation system. They do not need a completely new innovation system to be built up. For example, it is possible to design, without fundamentally new knowledge, a washing machine that lasts longer, is easier to repair and can be readily disassembled at the end of its lifespan. This is technologically far less invasive than developing a radically new technology, leading to a fundamentally different product grounded in a fundamentally new knowledge base and within a new innovation system.
CE transitions around incremental technological innovation lead to adaptations to an existing product within an existing innovation system. Consequently, this makes the adapted
products less easy to distinguish from their previous versions. After all, there is little
technological difference between the old and the new product, and no new innovation system has had to be built. Here, to keep track of progress, the subtle changes in existing innovation
systems need to be monitored, rather than the development of distinct new innovation systems.
Characteristic for all three types of CE transitions is a change in the innovation direction from a linear to a circular application of materials. This distinguishes CE transitions from most other sustainability transitions in which radical technological innovation is often central, but the circular application of materials hardly plays a role.
The innovation literature speaks about directionality failure (Weber and Rohracher, 2012). This refers to the situation where the course of innovation does not correspond to the
ambitions of society. The current economy has, for example, a strong focus on cost reduction and functionality improvement for consumers, and hardly addresses the issue of making consumption of resources and materials more efficient.
The innovation literature also talks about coordination failure (Weber and Rohracher, 2012; Wieczorek and Hekkert, 2012). It concerns the problem for economic operators to find each other and work out joint solutions to problems. This is important for CE transitions, since the reuse of products and their components and the recycling of materials require more
cooperation between economic actors than in linear chains. The central question is how companies, other organisations and consumers together can best set up a circular system. Socio-institutional inertia makes CE transitions complex. The biggest obstacle to CE transition is socio-institutional lock-in (Unruh, 2000) in existing ways of consuming, producing and doing business. Monitoring the CE transition process should provide insight into the development of new chain relationships.
According to Linder and Williander (2015), a circular revenue model requires technological expertise to close the product chain. However, in circular revenue models, the majority of risks to business investment are attributable to socio-organisational obstacles. Linder and Williander do not distinguish between core technology and enabling technology, or between different circular revenue models. Nor do they address the issue of product design.
Innovations in enabling technology, product design and revenue model can be important to facilitate socio-institutional change.
In this study, we conceptualise the role of innovation, particularly that of technological innovation, in the circular economy by evaluating its importance for strategies whose circularity ambitions range from high to low (R0 to R8). We expect to find that radical technological innovation plays an important role in less ambitious circularity strategies (closer to R8), and is less relevant in more ambitious circularity strategies (closer to R0). For the latter, we also expect to see crucial functions performed throughout the product chain by socio-institutional change and by innovations in enabling technology, revenue model and product design (Figure 2.3). We will evaluate this in more detail, for a number of cases, by relating their transition goals to whether innovation and socio-institutional change is a radical (dominant) feature, of secondary importance (clearly present without dominating the
process) or hardly relevant (occupying a subordinate role or none at all).Technology of secondary importance or hardly important both belong to incremental innovation.
2.3 Measuring progress of CE transitions
Which circularity strategies are more appropriate to reduce the consumption of resources and materials and the generation of waste? Figure 2.1 shows the priority order, indicating that smarter product manufacture and use (R0-R2) are preferred over product lifespan extension (R3-R7). Material recycling and energy recovery from incineration and anaerobic digestion (R8-R9) have the lowest priority. Each of these circularity strategies places different demands on socio-institutional change and innovation in core or enabling
technology, product design and revenue model. The policy achievements required to realise a successful CE transition can cover the entire product chain from resource extraction and processing, material production through product manufacturing and product use, to the collection and processing of discarded products.
At present there is no systematic method in place to measure the progress of CE transition processes, and their effects on circularity, the environment and the economy. The European The European Environment Agency (EEA, 2016b) only measures CE transition processes to a limited extent, not covering means, activities or effects on the environment and the
economy, but focusing only on achievements and effects in relation to circularity. The agency frames diagnostic questions, such as:
• Does the consumption of primary materials decrease in absolute terms? • Does the design take reuse and recycling into account?
• Is the proportion of hazardous substances in products decreasing? • Are products used more often or for longer periods of time? • Do materials retain their value and undergo high-grade recycling?
In principle, the EEA (2016b) also focuses on the progress of CE transitions, but only at the national level. The study presented here is not really concerned with the national level, but examines CE transitions in individual product chains. It builds on the approach of the EEA (2016b), with modifications to enable the measuring of individual product chains, and it is complemented with diagnostic questions covering the entire CE transition process and the effects on the environment and the economy.
It is useful to evaluate CE transitions by measuring progress before (ex ante), during (ex durante) and after (ex post) the transition process. An ex ante evaluation is relevant to explore whether proposed CE transitions actually have potential to bring about the intended CE effects. In other words, whether they are in accordance with the CE transition goals described in Section 2.1. An evaluation of CE Green Deals, the voluntary agreements between government and social partners to remove obstacles for CE transitions, shows that such ex ante evaluations are hardly ever conducted. A brief analysis of five selected CE Green Deals shows that several may not produce positive CE effects. Under these CE Green Deals, achieving increased circularity in certain product chains could actually lead to less circularity in others (Ganzevles et al., 2016). Ex durante evaluation is important to monitor whether a CE transition process follows the planned route, and leads to the desired effects. Ex post evaluations should determine whether the effects of the CE transition process are in accordance with the set goals, and whether they actually are the result of the transition activities and the accomplished achievements or were produced by external factors.
Measuring progress of CE transitions means gathering quantitative or semi-quantitative data and compiling them into indicators which provide meaningful information. Quantitative indicators can, in principle, be expressed in a single figure (by addition, subtraction, multiplication, division, or calculating averages). Semi-quantitative indicators are often binary (e.g. yes or no), but may also be arranged in classes, such as "all, many, few, none" or “red, yellow, green”. Semi-quantitative indicators can be compiled by tallying items into classes. Quantitative and semi-quantitative information and indicators are relevant for the three evaluation types, although semi-quantitative material will be more prominent in measuring the CE transition process than in measuring the CE effects.
The CE transition process consists of means, activities and achievements. Information on means can help to determine what is necessary to achieve the CE goal, such as the choice of actors, and the amount of financing. Information about activities provides insight into
whether all relevant actors are indeed engaged in those activities which should bring about the pursued CE achievements and CE effects. Achievement information indicates whether the activities have actually led to the pursued achievements, such as a shift in circularity
strategy. Table 2.1 lists the questions used to gather information about the CE transition process. Much of this information is difficult to measure (see Section 2.2 for details), and must be provided by the actors in the product chain itself.
Chapter 1 mentions the large number of indicators of environmental effects in use today. The large number is partly due to the diversity of specific methods to measure indicators for given environmental questions (Swanborn, 1987), and partly to the broad spectrum of environmental questions for which effect indicators exist. To keep measuring of the
environmental effects of product chains manageable, the notion of Cradle-to-Grave Primary Energy Consumption has often been proposed as a proxy for other environmental effects (Huijbregts et al., 2006). Several studies have shown that there is a strong correlation between cradle-to-grave primary (fossil) energy consumption and other environmental effects. At the same time, there are considerable uncertainties, though within product chains these can often be explained (Huijbregts et al., 2006; Pascual González, 2016). One of these uncertainties concerns the low correlation between cradle-to-grave primary (fossil) energy consumption and toxic emissions from chemicals production. For some products it may therefore be appropriate to include indicators for specific environmental effects, but in
principle, cradle-to-grave energy consumption seems suitable as a generic proxy for environmental effects over the lifespan of a product. Cradle-to-grave energy consumption must be measured for the individual product and for the corresponding sector as a whole, to prevent the figure from dropping at the level of the single item, while it increases at the level of the product sector.
Energy consumption in the recycling process, including collection, transport and production of recycled material, has also been proposed as an adequate proxy for circularity. Obviously, in recycling processes energy consumption should also be measured per product unit and for the sector as a whole. In addition, cradle-to-grave consumption of natural resources needs to be quantified per product unit and for the sector as a whole. These serve as a measure of circularity.
To get insight into the economic value of a circular economy, an obvious move is to look at existing economic indicators, focussing on a circular economy. Monitoring should cover at least added value, employment, patents and investments in a circular economy.
The diagnostic questions in Table 2.1 are relevant to all CE transitions, and do not depend on the followed circularity strategy. However, changes to some questions are expected to be more marked for the higher circularity strategies in which a bigger role is played by socio-institutional change and innovations in enabling technology, product design and revenue model. Accordingly, other questions are expected to undergo noticeable changes for the lower circularity strategies in which the dominant role is assigned to innovation in core technology.
Table 2.1: Diagnostic questions to measure the progress of the process and effects of a CE transition Diagnostic questions M ean s Mobilisation of means
- Are all relevant product chain partners actively involved in realising CE solutions? - Is there sufficient funding for realising CE solutions?
- Are there specific physical means limiting the realisation of CE solutions?
Knowledge development
- Does the available knowledge suffice to develop CE solutions (with regard to technology, patents, consumer and chain actor behaviour)?
A ct iv it ie s Knowledge exchange
- Is the level of knowledge exchange on CE solutions high enough in the product chain?
Experimenting by entrepreneurs
- Are entrepreneurs experimenting sufficiently with CE solutions and revenue models? - Is upscaling of CE solutions already taking place?
Giving direction to search (vision, expectations of governments and core-actors, regulations)
- Is there a clear vision among product chain partners of the pursued circularity strategy? - Do product chain partners broadly share this circularity strategy?
- Does this circularity strategy structure the activities of the product chain partners?
Opening markets
- Are product chain partners active in creating consumer awareness of CE solutions? - Are companies investing sufficiently?
- Does the government have supplementary policies, and do they help in opening markets?
Overcoming resistance
- Is there resistance against CE solutions (among product chain partners, or in the form of regulatory barriers)?
- Is sufficient action being taken to overcome resistance against CE solutions?
A ch ie ve m en ts CE design
- What is the present lifespan of a product and has it increased compared to its original lifespan? - Have products become easier to disassemble?
- Does the design foresee the use of recycled materials?
- Are the components designed for high-grade recycling (without increasing environmental pressure)?
Production
- Is the overall (primary and secondary) consumption of materials by companies decreasing? - Do companies use fewer substances which are hazardous to human health and ecosystems? - Is production moving towards lower levels of waste generation?
- Are companies moving to CE revenue models with increased reuse of products and components, or models based on providing a service rather than offering a product?
Consumption
- Is the consumption of CE products increasing (compared to conventional products)? - Do CE products have a longer lifespan or are they used more intensively?
- Is reuse of products leading to less waste?
Waste
- Is the volume of landfill decreasing in favour of incineration? - To what extent is high grade-recycling applied?
- To what degree is recycling effective with regard to costs and environment?
E
ffe
ct
s
Circularity (resource efficiency)
- Is primary material consumption decreasing (in kg per functional product unit)? - Is primary material consumption decreasing for the whole sector (in kg)?
- Is energy consumption in MJpr for recycling lower than cumulative energy consumption in MJpr ? Environment
For all product groups (over the whole life cycle of a product):
- Is cumulative energy consumption in MJpr decreasing per functional product unit?
- Is cumulative energy consumption in MJpr decreasing for the whole sector?
Environmental pressure caused by specific product groups (over the whole life cycle of a product): - Is cumulative environmental pressure decreasing per functional product unit?
- Is cumulative environmental pressure decreasing for the whole sector?
Economy
- Is the added value of products and product services increasing? - Are employment levels in the product chain increasing?
3 Cases
This chapter evaluates a large number of cases in which CE transitions in product chains are central. We investigate, in particular, the roles of socio-institutional change and innovation in these cases. In parallel with the conceptual framework, hypothetical circularity strategies have been drawn up and evaluated for two product groups: plastic packaging and electrical and electronic equipment. In addition, circularity strategies (Figure 2.1) are identified and evaluated for two sets of practical cases, 36 CE Green Deals (CE GDs) and 32 CE Best Practices (CE BPs) with CE transitions taking place in a range of specific product chains. The evaluation of the cases is based on an examination of socio-institutional change and the three types of innovation to determine whether they play a dominant role (radical
innovation), are clearly present without dominating the process, or occupy a subordinate role or none at all (incremental innovation). The evaluation distinguishes between the roles of innovation in core technology, enabling technology, product design and revenue model.
3.1 Plastic packaging
3.1.1 Existing situation
In 2014, the demand for plastics in the Netherlands totalled 1.95 million tons, of which 39.5%, 0.77 million tons, for use in packaging (PlasticsEurope, 2014/2015; PlasticsEurope, 2015). PlasticsEurope (2014/2015, 2015), claims 45% of used packaging in the Netherlands would have been recycled, and according to Nedvang figures (2015), 50% would have been recycled in 2014.1 Nedvang monitors the collection and recycling of plastic packaging (and other packing materials), and is funded by the packaging industry (producers and importers of packaged products) through the Packaging Waste Fund.
In line with the Dutch government decision on package waste management (Besluit Beheer Verpakkingen (2014)), the packaging industry is responsible for the collection and recycling of packaging waste. PET bottles larger than 0.5 litres are collected for recycling by soft drink retailers within a deposit-refund system (Ministry of IenM, 2016b). Other plastic packaging from households has been collected through the Plastic Heroes collection system since 2008. This system is also funded by the packaging industry through the Packaging Waste Fund. In the Plastic Heroes system, plastic packaging waste is collected through separation at the source (in 360 municipalities) or separation from residual waste (in 48 municipalities). Separation at the source means people put plastic packaging waste in Plastic Heroes bags which are then collected at their homes, or people take the plastic waste to on-street Plastic Heroes containers. Of the municipalities that previously used separation at the source only, 36 now combine the practice with further separation of residual plastic packaging
waste(KIVD, 2014a; Nedvang, 2014; Plastic Heroes, 2015). Figure 3.1 shows the figures for demand, collection and recycling of plastic packaging.
1This is probably an overestimate caused by the monitoring method. Nedvang (2015) bases its percentage on absolute
quantities of plastic packaging being recycled as a proportion of the total volume on the Dutch market. The market volume figures used by Nedvang come from self-reporting by packaging companies which put more than 0.05 million tons of packaging on the market, and for other companies estimates are made. The total market volume is nearly 40% lower than the Dutch demand for plastics used in packaging as calculated by PlasticsEurope (2015a, b). This difference does not seem to be explained by Dutch exports of plastic packaging (Nedvang, 2014). The quantities of recycled plastic packaging waste are based entirely on self-reporting by municipalities, collecting companies, and waste processors for recycling and incineration of plastic packaging in the Netherlands. The Human Environment and Transport Inspectorate (ILT) reviews data on recycled packaging from household waste and has evaluated this data as valid and reliable (Nedvang 2015). Nedvang (2014; 2015) does not make statements about the reliability of its reports on recycled industrial waste. Figure 3.1 shows the figures.
3.1.2 Circularity strategies for plastic bottles
Every year, Dutch consumers use nearly one and a half billion (1.5 E9) soft drink bottles made of polyethylene terephthalate (PET). There is a deposit-refund on plastic bottles larger than 0.5 litres, which can be returned to the retailers (Ministry of IenM, 2016b). In 2013, 0.02 million tonnes of returnable PET bottles were recycled (Nedvang, 2014). As yet, there is no deposit-refund on plastic bottles of 0.5 litres or smaller. The website of the Ministry of Infrastructure and the Environment (Ministry of IenM, 2016b) reported that from January 2016 an experimental trial would be run with a ‘return premium’ on small PET bottles. At present, after collection the large PET bottles are shredded, upon which the fragments are cleaned and melted, before being transformed into granules which can be applied for making new PET bottles, or other products such as jerry cans, sweaters, toys, chairs, pipes and tubes (Plastic Heroes, 2015). In 2012, the proportion of recycled PET in PET bottles was approximately 18%. Current technology can achieve a proportion of 40-60% in multi-layer or laminated bottles (WRAP, 2005).
Upon signing the Framework Agreement Packaging 2013-2022 (2013) with the Dutch
government, the packaging industry has promised to increase the proportion of mechanically recycled PET in bottles to 25%. The agreement sets 2018 as the deadline for operating with the highest possible proportion of recycled PET in bottles. This means figures of at least 23% of mechanically recycled PET in small bottles and 28% in large bottles. To achieve this, the volume of PET bottles collected for recycling needs to go up, probably through some form of post-collection sorting procedure (R8 in Table 3.1).
The Agreement leaves the initiative to the packaging industry under the conditions of the Extended Producer Responsibility scheme. Soft drink producers and retailers consider the deposit-refund or premium system to be rather expensive, and prefer to collect and recycle plastic bottles together with other plastic waste. Until 2006, large PET bottles were not recycled but refilled (Milieucentraal, 2015). This alternative could be re-introduced for large and small PET bottles (R3b in Table 3.1), but this requires a change in the mind-set of soft drink producers (switching to cleaning and refilling), and to some extent also in the attitude of retailers (more collection) and consumers (returning more bottles). Consumers could also
clean plastic bottles themselves and re-fill them, for example through a system in which retailers set up refill stations (R3 in Table 3.1). The technology for these systems already exists, but implementation requires changes in the chain of logistics, particularly for the soft drink producers and retailers. In addition, producers and retailers cannot be held responsible for how well consumers clean their plastic bottles. So this probably also requires a change in regulations on food safety and quality. These changes can be avoided, however, if
consumers are willing to prepare their own drinks by using powdered drink mixes and carbon dioxide cartridges (R0 in Table 3.1). This is in fact the procedure followed by soft drink producers, and occasionally also by the hospitality sector in their drinks dispensers.
Technology for smaller volumes aimed at the individual consumer has been around for quite some time, and, while market-wide introduction must be coupled to a big change in logistics, the move will provide advantages for consumers, producers and retailers with regard to transport and space. Producers could distinguish themselves from others and attract end keep customers by designing a soft drink preparation system and associated packaging for powdered drink mixes and carbon dioxide cartridges, all under a single brand. The three variants all lead to significant reductions (R3a and R3b), or even the complete phasing out (R0) of PET bottle production. Similar circularity strategies are appropriate for bottles used for other liquid foodstuffs.
3.1.3 Circularity strategies for other types of plastic packaging
The focus in this section is on the packaging of other food types. The present system of collection and (low-grade mechanical) recycling of plastic packaging can be continued (R8b in Table 3.1) or further developed into high-grade mechanical recycling (R8a in Table 3.1). The mix of many types of contaminated plastics that is currently collected by Plastic Heroes for sorting at their facilities, should be source-separated straightaway into clean plastic fractions for high-grade recycling. Technology for mechanical waste separation at the source is available, and being improved to achieve better separation and cleaner fractions.
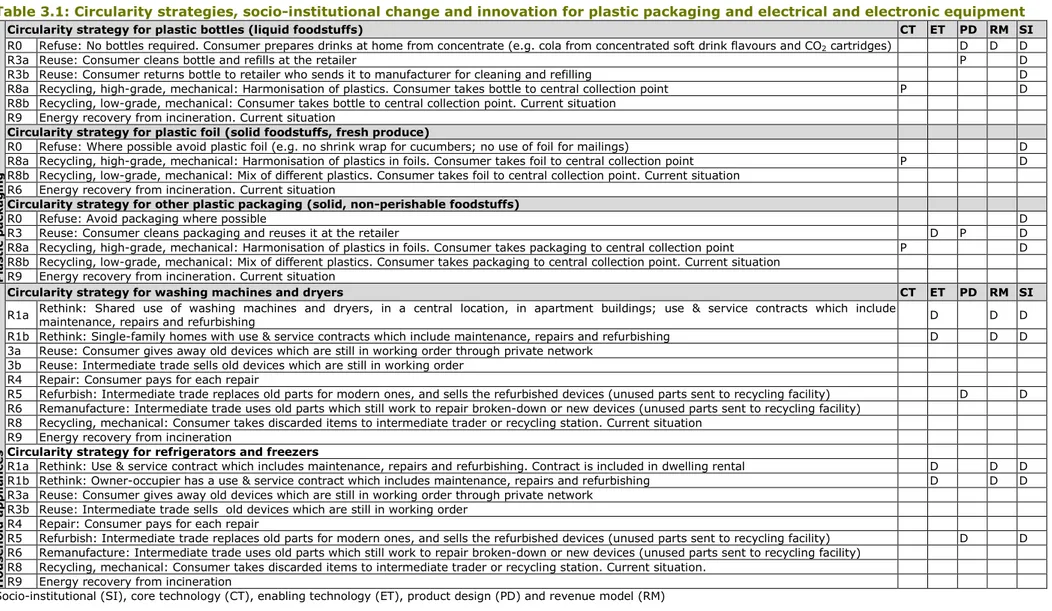
Table 3.1: Circularity strategies, socio-institutional change and innovation for plastic packaging and electrical and electronic equipment P las ti c p ack ag in g
Circularity strategy for plastic bottles (liquid foodstuffs) CT ET PD RM SI
R0 Refuse: No bottles required. Consumer prepares drinks at home from concentrate (e.g. cola from concentrated soft drink flavours and CO2 cartridges) D D D
R3a Reuse: Consumer cleans bottle and refills at the retailer P D
R3b Reuse: Consumer returns bottle to retailer who sends it to manufacturer for cleaning and refilling D
R8a Recycling, high-grade, mechanical: Harmonisation of plastics. Consumer takes bottle to central collection point P D
R8b Recycling, low-grade, mechanical: Consumer takes bottle to central collection point. Current situation R9 Energy recovery from incineration. Current situation
Circularity strategy for plastic foil (solid foodstuffs, fresh produce)
R0 Refuse: Where possible avoid plastic foil (e.g. no shrink wrap for cucumbers; no use of foil for mailings) D
R8a Recycling, high-grade, mechanical: Harmonisation of plastics in foils. Consumer takes foil to central collection point P D R8b Recycling, low-grade, mechanical: Mix of different plastics. Consumer takes foil to central collection point. Current situation
R6 Energy recovery from incineration. Current situation
Circularity strategy for other plastic packaging (solid, non-perishable foodstuffs)
R0 Refuse: Avoid packaging where possible D
R3 Reuse: Consumer cleans packaging and reuses it at the retailer D P D
R8a Recycling, high-grade, mechanical: Harmonisation of plastics in foils. Consumer takes packaging to central collection point P D R8b Recycling, low-grade, mechanical: Mix of different plastics. Consumer takes packaging to central collection point. Current situation
R9 Energy recovery from incineration. Current situation
H o u se h ol d a p p li an ce s
Circularity strategy for washing machines and dryers CT ET PD RM SI
R1a Rethink: Shared use of washing machines and dryers, in a central location, in apartment buildings; use & service contracts which include maintenance, repairs and refurbishing D D D R1b Rethink: Single-family homes with use & service contracts which include maintenance, repairs and refurbishing D D D 3a Reuse: Consumer gives away old devices which are still in working order through private network
3b Reuse: Intermediate trade sells old devices which are still in working order R4 Repair: Consumer pays for each repair
R5 Refurbish: Intermediate trade replaces old parts for modern ones, and sells the refurbished devices (unused parts sent to recycling facility) D D R6 Remanufacture: Intermediate trade uses old parts which still work to repair broken-down or new devices (unused parts sent to recycling facility)
R8 Recycling, mechanical: Consumer takes discarded items to intermediate trader or recycling station. Current situation R9 Energy recovery from incineration
Circularity strategy for refrigerators and freezers
R1a Rethink: Use & service contract which includes maintenance, repairs and refurbishing. Contract is included in dwelling rental D D D
R1b Rethink: Owner-occupier has a use & service contract which includes maintenance, repairs and refurbishing D D D
R3a Reuse: Consumer gives away old devices which are still in working order through private network R3b Reuse: Intermediate trade sells old devices which are still in working order
R4 Repair: Consumer pays for each repair
R5 Refurbish: Intermediate trade replaces old parts for modern ones, and sells the refurbished devices (unused parts sent to recycling facility) D D R6 Remanufacture: Intermediate trade uses old parts which still work to repair broken-down or new devices (unused parts sent to recycling facility)
R8 Recycling, mechanical: Consumer takes discarded items to intermediate trader or recycling station. Current situation. R9 Energy recovery from incineration
Socio-institutional (SI), core technology (CT), enabling technology (ET), product design (PD) and revenue model (RM) Rating: D=dominant, P=present, empty cell=hardly present/no presence