DECARBONISATION OPTIONS
FOR THE DUTCH INDUSTRIAL
GASES PRODUCTION
M. Cioli, K.M. Schure, D. van Dam
26 March 2021
Decarbonisation options for the Dutch industrial gases production
© PBL Netherlands Environmental Assessment Agency; © TNO The Hague, 2021
PBL publication number: 3719
TNO project no. 060.47868 / TNO 2021 P12327
Authors
M. Cioli, K.M. Schure and D. van Dam
Acknowledgements
We thank Marcel Weeda (TNO) for valuable input related to the production and consumption of hydrogen. Freddy Koetse (Air Products) and Jaap Oldenziel (Air Liquide) are acknowledged for reviewing this report.
MIDDEN project coordination and responsibility
The MIDDEN project (Manufacturing Industry Decarbonisation Data Exchange Network) was initiated and is also coordinated and funded by PBL and TNO. The project aims to support industry, policymakers, analysts, and the energy sector in their common efforts to achieve deep decarbonisation. Correspondence regarding the project may be addressed to:
D. van Dam (PBL), Dick.vanDam@pbl.nl, or S. Gamboa (TNO), Silvana.Gamboa@tno.nl. This publication is a joint publication by PBL and TNO Energy Transition and can be
downloaded from: www.pbl.nl/en. Parts of this publication may be reproduced, providing the source is stated, in the form: M. Cioli, K.M. Schure and D. van Dam (2021). Decarbonisation options for the production of industrial gases. PBL Netherlands Environmental Assessment Agency and TNO Energy Transition, The Hague.
PBL Netherlands Environmental Assessment Agency is the national institute for strategic policy analysis in the fields of the environment, nature and spatial planning. We contribute to improving the quality of political and administrative decision-making by conducting outlook studies, analyses and evaluations in which an integrated approach is considered paramount. Policy relevance is the prime concern in all of our studies. We conduct solicited and
unsolicited research that is both independent and scientifically sound.
TNO Energy Transition has a twofold mission: to accelerate the energy transition and to strengthen the competitive position of the Netherlands. TNO conducts independent and internationally leading research and we stand for an agenda-setting, initiating and supporting role for government, industry and NGOs.
This report was reviewed by Air Products and Air Liquide. PBL and TNO remain responsible for the content. The decarbonisation options and parameters are explicitly not verified by the companies.
Contents
Summary 5
INTRODUCTION
7
1
INDUSTRIAL GAS PRODUCTION
8
1.1 Introduction to the industrial gases industry in the Netherlands 8 1.2 Production locations of industrial gases in the Netherlands 9
1.3 Companies overview 12
2
INDUSTRIAL GAS PRODUCTION PROCESSES
14
2.1 H2, CO and syngas production 14
2.2 O2, N2 and Argon production 21
3
INDUSTRIAL GAS PRODUCTS AND APPLICATIONS
24
3.1 Hydrogen market 24
3.2 Carbon monoxide market 26
3.3 Carbon dioxide market 27
3.4 Oxygen market 27
3.5 Nitrogen market 28
3.6 Argon market 28
4
OPTIONS FOR DECARBONISATION
29
4.1 Feedstock/fuel substitution: Hydrogen from biomass 30
4.2 Process design: Electrolysis 34
4.3 Process design: Thermal decomposition of methane 36
4.4 Carbon capture and storage (CCS) 38
4.5 Carbon capture and utilisation (CCU) 44
4.6 Oxygen, Nitrogen and Argon: Green electricity consumption 45
5
DISCUSSION
46
6
REFERENCES
48
FINDINGS
Summary
The industrial gases (hydrogen, oxygen, nitrogen, argon, carbon monoxide) sector produces widely adopted commodity chemicals that are used in many industrial sectors. In this report we discuss the production processes of hydrogen, nitrogen, oxygen and argon, and focus on decarbonisation options for hydrogen. The production of oxygen, nitrogen and argon is powered by electricity, and does therefore not generate direct carbon emissions.
Hydrogen and carbon monoxide
In the Netherlands, most of the hydrogen is produced by refineries and chemical companies for own use on-site. This ‘captive’ hydrogen production is described in the MIDDEN reports related to these specific industries. Only two EU ETS registered companies are primarily dedicated to the production of hydrogen: Air Liquide Industrie B.V. (Air Liquide) and Air Products Nederland B.V. (Air Products). The scope of the hydrogen production in this report is these ‘merchant’ gas producers. The hydrogen is sold mostly to refineries and chemical industry companies in The Netherlands.
The sites of Air Liquide and Air Products have a combined capacity of about 260 kilotonnes (kt) of produced hydrogen per year (excluding hydrogen present in gas mixtures such as syngas) and generate about 1.6 million tonnes (Mt) direct CO2 emissions. Air Liquide has
hydrogen production facilities located in the Botlek area and in Bergen op Zoom.
Additionally, Air Liquide operates several energy production facilities in the Rotterdam Botlek area and delivers steam to various (chemical) industry companies. Air Products produces hydrogen in the Botlek area.
Hydrogen and carbon monoxide (CO) are produced mainly by steam methane reforming (SMR), delivering, depending which product is required, pure hydrogen, pure carbon
monoxide or syngas which is composed mainly by CO and hydrogen. In this process, natural gas is used both as feedstock and fuel. Natural gas as a feedstock is catalytically reformed, with the addition of steam, into synthetic gas, or syngas. It is an energy-intensive process due to the fact that it is a highly endothermic reaction, and its energy demand is supplied by the combustion of natural gas (or refinery gas) as fuel. CO and hydrogen can be separated from the syngas and purified. Another hydrogen production process applied in the
Netherlands and described in this report is autothermal reforming (ATR).
Decarbonisation options for the hydrogen production industry in this report are focused on four main types of technology. Firstly, hydrogen can be produced by electrolysis of water, which, when using renewable electricity, is referred to as green hydrogen. The production of green hydrogen by electrolysis depends mainly on the availability of renewable electricity, prices of electricity, and capital and operational costs for the required electrolysers.
Secondly, hydrogen can be produced using various types of biomass. Currently, the available capacity for sustainable biomass in the Netherlands is estimated between 27-75% of the hydrogen production demand for these applications. Thirdly, an alternative hydrogen production process is that of thermal methane decomposition, which produces also carbon black. Finally, the adoption of carbon capture technology and storage (CCS) in combination with current hydrogen production technologies results in the production of low-carbon hydrogen, which in the Netherlands is also referred to as blue hydrogen.
Oxygen, nitrogen and argon
Oxygen, nitrogen and argon are typically produced on a large-scale with the cryogenic distillation process. This technology is based on the liquefaction of atmospheric air in order to separate, through multi-column distillation, the different components that have a different boiling point. In such an air separation unit (ASU), the air compression step is estimated the most energy-intensive. The process is fully electric and the decarbonisation of the production of oxygen, nitrogen and argon is therefore relying on the decarbonisation of the electricity production.
Air Liquide, Air Products, Linde Gas and Gasunie own air separation units, which are located in industrial areas such as Rotterdam, Terneuzen and IJmuiden, as well as close to natural gas extraction locations in the northeast of The Netherlands.
FULL RESULTS
Introduction
This report describes the current situation for the production of industrial gases in the Netherlands and the options and preconditions for its decarbonisation. The study is part of the MIDDEN project (Manufacturing Industry Decarbonisation Data Exchange Network). The MIDDEN project aims to support industry, policymakers, analysts, and the energy sector in their common efforts to achieve deep decarbonisation. The MIDDEN project will update and elaborate further on options in the future, in close connection with the industry.
Scope
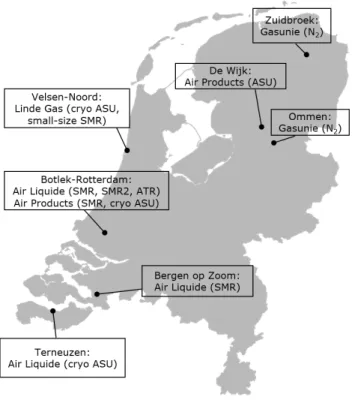
This report will focus on the production of industrial gases in the Netherlands. Main production locations include:
• For hydrogen (H2), carbon monoxide (CO) and syngas:
o Air Liquide Industrie B.V. in the Botlek area (Rotterdam, Zuid-Holland) and in Bergen op Zoom (Noord-Brabant).
o Air Products Nederland B.V. in the Botlek area (Rotterdam, Zuid-Holland). • For nitrogen (N2), oxygen (O2), and argon (Ar):
o Air Liquide in Terneuzen (Zeeland).
o Linde Gas Benelux B.V. at TATA Steel’s site in Velsen-Noord. o Air Products in De Wijk.
o Gasunie in Ommen and Zuidbroek. Processes include:
• For hydrogen, CO and syngas production: Steam Methane Reforming (SMR) and Autothermal Reforming (ATR).
• For nitrogen, oxygen and argon production: Cryogenic Distillation Air Separation Unit (cryo ASU).
The main decarbonisation options (all related to hydrogen, CO and syngas production) are: • Carbon Capture Utilisation and Storage (CCUS),
• Hydrogen from biomass, • Biogas reforming, • Water electrolysis,
• Thermal Decomposition of Methane.
Reading guide
Chapter 1 gives a general introduction to the industrial gases production industry in the Netherlands and describes the relevant actors involved in this sector. In chapter 2 we
describe the current situation of industrial gases production processes in the Netherlands and in chapter 3 we describe the relevant products to these processes. Options for
decarbonisation are systematically quantified and evaluated in chapter 4. The feasibility and requirements of those decarbonisation options are discussed in chapter 5.
1 Industrial gas
production
1.1 Introduction to the industrial gases industry in the
Netherlands
Industrial gases (hydrogen, oxygen, nitrogen, argon, carbon monoxide) are among the most widely adopted commodity chemicals since they are used in many industrial sectors. In 2008, the global industrial gases market reached a turnover of USD 52 billion (33 billion EUR) within production and consumption in the steel industry, chemical and pharmaceutical industries, electronic devices, solar cells, glass and food. The Dutch industrial gas market is highly dominated by a few major players that produce the largest share of the market volume: Air Liquide, Air Products, Linde AG and Gasunie.
1) Using an energy density of 120 GJ (lower heating value, LHV) per tonne hydrogen. Which companies produce hydrogen in The Netherlands?
The production of hydrogen in Dutch industry is divided over several industrial
subsectors: the fertiliser industry, steam cracking, refineries, the biofuels industry and the production of industrial gases itself. Furthermore, hydrogen is also present in fuel gas from steam crackers and coke oven gas. For the purpose of this report, the focus is on the industrial gas producers (producing ‘merchant hydrogen’: Air Liquide and Air
Products). Nevertheless, the decarbonisation options are related to production processes and are (at least partially) also applicable to hydrogen production processes beyond the industrial gas producers. Hydrogen production by the fertiliser industry, the steam crackers, the chlor-alkali industry, the refineries and the biofuels industry (‘captive hydrogen’ production) is briefly described in the corresponding MIDDEN reports, that can be found at middenweb.nl. On top of that, small volumes of hydrogen are produced at decentralised methane reformers or electrolysers. Those volumes are estimated to be negligible in comparison to the aforementioned industrial gas producers.
Recent information about the volumes of all hydrogen production in The Netherlands can be found in DNVGL (2019) and Weeda & Segers (2020). Total production of hydrogen within The Netherlands is estimated at 1.5 Mt or about 178 PJ (LHV)1) in 2019 (DNVGL,
2019; Weeda & Segers, 2020). This number includes hydrogen present in mixture gases. A more detailed breakdown of the hydrogen production in The Netherlands, by feedstock, application or industrial cluster, can be found in Weeda & Segers (2020).
1.2 Production locations of industrial gases in the
Netherlands
1.2.1 Hydrogen and carbon monoxide: Air Liquide and Air Products
The ‘merchant’ hydrogen producers are active in two main areas: Air Liquide and Air Products in the Botlek area (Rotterdam) and Air Liquide in Bergen op Zoom. The location of the production plants is shown in Figure 1. The hydrogen is mainly used to upgrade refinery products and as feedstock for chemicals production.
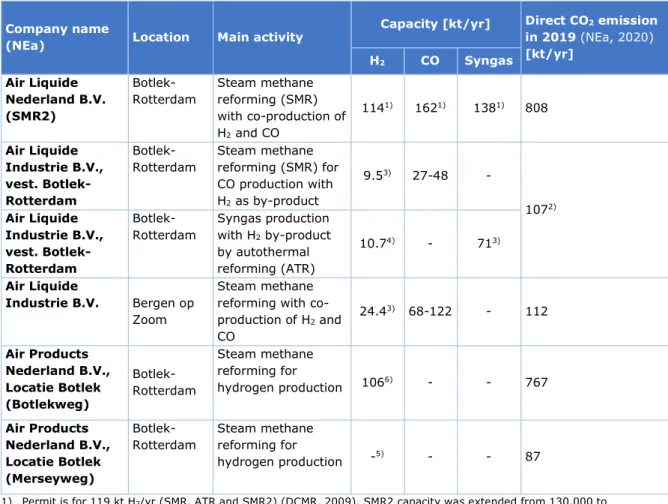
The capacities of Air Liquide and Air Products, reported for 2019, are shown in Table 1, with the respective CO2 emissions retrieved from the NEa database published in 2020. It is
important to note that the production capacities describe the potential production capacity of the plants, not necessarily the actual produced amounts.
Figure 1 Production locations of the main industrial gas producers in the Netherlands. Abbreviations are explained in Tables 1 and 2.
Table 1 Overview of the EU ETS registered hydrogen production facilities owned by Air Liquide and Air Products in the Netherlands.
Company name
(NEa) Location Main activity
Capacity [kt/yr] Direct CO2 emission
in 2019 (NEa, 2020) [kt/yr] H2 CO Syngas Air Liquide Nederland B.V. (SMR2)
Botlek-Rotterdam Steam methane reforming (SMR) with co-production of H2 and CO 1141) 1621) 1381) 808 Air Liquide Industrie B.V., vest. Botlek-Rotterdam
Botlek-Rotterdam Steam methane reforming (SMR) for CO production with H2 as by-product 9.53) 27-48 - 1072) Air Liquide Industrie B.V., vest. Botlek-Rotterdam Botlek-Rotterdam Syngas production with H2 by-product by autothermal reforming (ATR) 10.74) - 713) Air Liquide Industrie B.V. Bergen op Zoom Steam methane reforming with co-production of H2 and CO 24.43) 68-122 - 112 Air Products Nederland B.V., Locatie Botlek (Botlekweg) Botlek-Rotterdam Steam methane reforming for hydrogen production 1066) - - 767 Air Products Nederland B.V., Locatie Botlek (Merseyweg) Botlek-Rotterdam Steam methane reforming for hydrogen production -5) - - 87
1) Permit is for 119 kt H2/yr (SMR, ATR and SMR2) (DCMR, 2009). SMR2 capacity was extended from 130,000 to
145,000 Nm3/hr (which is 114 kt H2/yr using 0.0899 kg/Nm3 for H2) (DCMR, 2016). Yearly allowed hydrogen
production amounts to 98 kt H2/yr, which corresponds to a maximum load factor of approximately 7500 hours or
85% given the hourly production value. This is without any CO delivery. Permit is further for 190 kt CO and 162 kt syngas, which translates to 162 kt CO and 138 kt syngas assuming maximum load.
2) The emission of these plants (SMR and ATR) is reported together under “Air Liquide Industrie B.V., vest. Botlek-Rotterdam” in emission database (NEa, 2020).
3) M. Weeda, personal communication (2019). Capacities may refer to permitted capacities and are not necessarily actual production levels.
4) According to Air Liquide H2 production at full syngas production is 13,583 Nm3/hr. This is 10.7 kt/y at 0.0899
kg/Nm3 and 8760 hrs of operation.
5) The Merseyweg-plant is currently out of use pending final decisions on this plant (M. Weeda, personal communication (2020)).
6) Permit for Air Products Botlekweg states a capacity of 134,000 Nm3 hydrogen per hour (Staatscourant, 2009), or
106 kt/y at 8760 hours of operation.
The CO production of the Air Liquide facilities in Botlek and Bergen op Zoom is estimated based on EIGA (2013) that states a typical CO/H2 massratio range of 2.8-5. SMR2 is a
flexible plant that primarily produces hydrogen, but can also deliver CO. It can be noticed that CO2 emission of the Air Products’ hydrogen plant is higher than the one of Air Liquide
even though it has a lower capacity. However, there may be a difference in the actual production of the sites and in the input gas composition (refinery gas and/or natural gas). Both SMR2 from Air Liquide and the SMR from Air Products use refinery gas from the ExxonMobil refinery.
Apart from the facilities included in the table above, Air Liquide owns co-generation plants (Combined Heat and Power, CHP) that cause CO2 emissions registered in the EU ETS. These
facilities include Pergen, Enecal and Eurogen and relate to steam and electricity production in the Botlek and Pernis area. Appendix A describes these facilities and their emissions. A map from Botlek and Pernis which includes these facilities is found in Figure 2.
Figure 2 Location of the discussed entities in Botlek and Pernis. Adapted from the Facts & Figures of Port of Rotterdam (Port of Rotterdam, 2016)
1.2.2 Nitrogen, oxygen, argon: Air Liquide, Air Products, Linde, Gasunie
Production capacities for other industrial gases than hydrogen and carbon monoxide are summarised in Table 2. ASU plants do not produce direct CO2 emissions since the total
energy requirement is supplied by electricity. The plant in De Wijk supplies the nitrogen to local natural gas extraction facilities employed by the NAM (Air Products, 2020).
Table 2 Overview of the air separation unit (ASU) facilities of the main producers in the Netherlands, including the location and description of the main activity.
Company Location Main activity Production capacity O2 [Mt/y] N2 [Mt/y] Ar [kt/y]
Air Liquide Industrie B.V.
Terneuzen Cryogenic Distillation
ASU 0.441) 1.62) 242) Air Products Nederland B.V. Botlek-Rotterdam Cryogenic Distillation ASU 1.23) 4.22) - Air Products Nederland B.V. De Wijk (De Wolden) Cryogenic Distillation ASU 0.082) 0.294) -
Linde Gas Velsen-Noord Cryogenic Distillation
ASU 0.635) 2.75) 322)
Gasunie Ommen Nitrogen production
- 1.66) -
Gasunie Zuidbroek Nitrogen production
- 0.186) -
1) 1200 t oxygen per day (Air Liquide, personal communication, 2019).
2) Estimated by using a N2/O2 and Ar/O2 mass ratio of 3.6 and 0.05 respectively (see Section 2.2).
3) Smith & Klosek (2001)
4) 800 t nitrogen per day (Air Products, personal communication, 2020). 5) Keys et al. (2019)
1.3 Companies overview
1.3.1 Air Liquide
Air Liquide Industrie B.V. is part of Air Liquide, a multinational founded in 1902, present in 80 countries and having about 67,000 employees (Air Liquide, 2020).
In the Netherlands, Air Liquide started production and sale of industrial gases in 1931. Air Liquide Nederland B.V., Enecal B.V., Eurogen B.V., Maasvlakte Energie B.V., Air Liquide Technische Gassen B.V., and Pernis Energie B.V. are 100% participations of Air Liquide Industrie B.V. (Air Liquide Industrie, 2018).
Currently, in the Netherlands, the company has around 400 employees and more than 30,000 customers, supplying most of their industrial gases through 2,225 km of underground pipeline, a network from Bergen (Mons) (Belgium) to Rotterdam (Air Liquide, 2020a). Air Liquide Industrie B.V. has a production capacity of about 150 kt of pure hydrogen annually and a production capacity of carbon monoxide of about 300 kt per year. In the country, the company presents four facilities for the hydrogen production situated in Botlek-Rozenburg and Bergen op Zoom area as described in Figure 1. Moreover, the company has several “on-site” non-cryogenic air separation units, where a small amount of pure oxygen is required. In Terneuzen, a large-scale cryogenic air separation unit is running that produces a large amount of oxygen, nitrogen and argon as described in Table 2. In 2017, Air Liquide Industrie B.V. achieved an annual net turnover of EUR 195.8 million, with a total net profit after taxation of EUR 28.2 million (Air Liquide Industrie, 2018).
1.3.2 Air Products
Air Products Nederland B.V. was founded in 1967 in Utrecht and it started its business with the industrial gas production for petrochemical companies in the Rijnmond region. It is part of the US based corporation Air Products and Chemicals, Inc.
Air Products Nederland has a production capacity of about 100 kt of pure hydrogen annually. The company operates a steam methane reformer unit for the hydrogen production situated in the Botlek-Rozenburg area, as shown in Figure 1. This plant uses refinery gas of
ExxonMobil as feedstock. A second steam methane reformer unit is currently not in use. Furthermore, Air Products Nederland B.V. has a cryogenic air separation unit in Botlek with a maximum capacity of about 3500 short tons per day or 1.16 (metric) Mt per year of pure gaseous oxygen (Smith & Klosek, 2001, p. 121). Currently, in the Netherlands, the company employs around 200 employees and has an annual net turnover of EUR 248.7 million with EUR 22.1 million of net profits (Air Products Nederland B.V., 2018).
1.3.3 Other actors
Linde Gas Benelux has its headquarters in Schiedam and has several air separation units in IJmuiden (on the site of TATA’s steel plant), where liquid air is separated by cryogenic distillation (Linde Gas Benelux, 2018) to produce oxygen for steel manufacturing. Its ASU plant on TATA Steel’s site produces almost 0.9 billion Nm3 (0.63 Mt) of pure oxygen annually
and 3.3 billion Nm3 (2.7 Mt) of gaseous nitrogen (Keys, Van Hout, & Daniels, 2019). Linde
Gas also produces a small volume of hydrogen at the TATA site by SMR, but it is negligible in comparison to the aforementioned hydrogen producers. Linde’s industrial gases production in the Botlek area was terminated at the end of 2017. Currently, in the Botlek region, Linde Gas is active in the distribution of CO2through pipelines to greenhouses in the Westland,
Lansingerland and Delfgauw (OCAP, 2019).
Another important nitrogen producer in the Netherlands is Gasunie, a Dutch natural gas infrastructure and transportation company that owns the Dutch gas transmission network
with a total length of over 12,000 kilometres. The company owns and operates four stations in which nitrogen can be added to imported high-calorific gas in order to decrease its calorific value and make it appropriate for domestic infrastructures. At two of these installations, Wieringermeer and Pernis, Gasunie adds nitrogen to the imported gas. Gasunie purchases nitrogen from other parties, at least Air Products, Linde Gas and Tata Steel (Gasunie, 2019, pp. 51, 56). At Ommen and Zuidbroek, it produces its own nitrogen from air. In 2018, Gasunie has a nitrogen capacity of 377,000 m3/h with two production plants located in
Zuidbroek (16,000 m3/h) and Ommen (146,000 m3/h), and two conversion plant located in
Wieringermeer (215,000 m3/h) and Pernis (45,000 m3/h) (GTS, 2015). Specifics of these
2 Industrial gas
production processes
2.1 H
2, CO and syngas production
In the Netherlands, hydrogen production by industrial gas producers is dominated by the Steam Methane Reforming (SMR) process, where natural gas and steam react to produce H2
and, depending on the presence or absence of a water gas shift reactor, carbon monoxide (CO) (in case of SMR). For the production of raw syngas (H2 and CO mixture), Autothermal
Reforming (ATR) is the most widely used technology, since it presents the highest efficiency in terms of energy required and carbon dioxide emitted. An alternative method to produce syngas is the Partial Oxidation technology (POX), where hydrocarbons are partially oxidised instead of reformed, but to our knowledge this process is not applied on an industrial scale in the Netherlands and therefore not discussed in further detail.
As described on page 8, also a large amount of hydrogen is produced as ‘captive’ hydrogen in refineries and chemical companies, by catalytic reforming of naphtha and by gasification of heavy residues (Weeda & Segers, 2020). This production is not taken into account in this report, but discussed in MIDDEN reports related to the refineries and specific chemical companies.
2.1.1 Steam methane reforming (SMR)
In the steam reforming process, hydrocarbons are catalytically converted into hydrogen and carbon monoxide by reaction with steam. It is considered the most common mechanism to produce pure hydrogen. Typically, natural gas (NG) is adopted as a feedstock since it is one of the most cost-effective hydrocarbons (examples of other hydrocarbons are naphtha, LPG, refinery gases). For material limits, the reformer output temperature can reach up to 1200 °C.
Depending on the feedstock consumed, the amount of steam and the enthalpy change of the reaction varies. According to literature, this process has a conversion efficiency between 74– 85% LHV (Nikolaidis & Poullikkas, 2017). IEA reports 76% (Base Case in Table 2 of IEAGHG, 2017). This number does not include re-use of waste heat, which is in practice an important feature in the design of an SMR. This technology has a potential capacity that can range between 1,350 and 18,000 kg/h of hydrogen (around 11.9–158 kt/y) (Air Liquide, 2018) and a production yield of 3.4 mol H2 /mol NG (Jakobsen & Åtland, 2016).
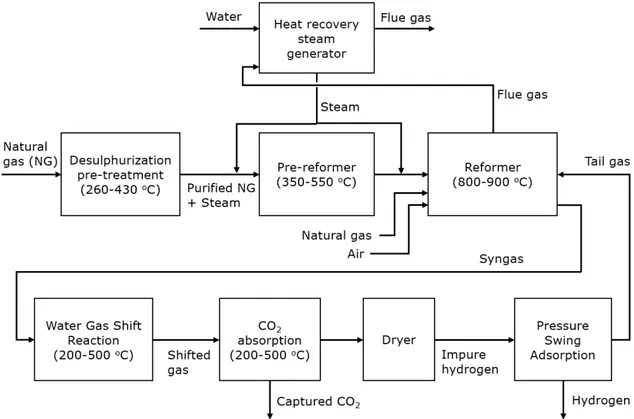
The overall SMR process is composed of five main steps which can be recognised in almost all of the large-scale hydrogen production facilities: natural gas pre-treatment, natural gas reforming, water gas shift, carbon capture and hydrogen separation. A flow chart of the process is shown in Figure 3.
Figure 3 Schematic overview of the production process of H2 using the Steam
Methane Reforming process (partially based on information from Air Liquide, 2021).
Natural gas pre-treatment
Before entering into the reformer reactor, the feedstock needs to be purified to avoid corrosion or deposition issues during the reaction. Natural gas (NG) needs just
desulphurisation as a pre-treatment process (Liu, Song, & Subramani, 2009), in order to decrease the amount of sulphur components. The inner tube catalysts are very sensitive to this component and even with a small variation of sulphur amount the overall efficiency of the reaction can decrease significantly (Dunleavy, 2006). In the pre-treatment step, the NG firstly passes through a flash drum, where all the liquids are removed. Then, a small amount of hydrogen is used to blow the organic sulphur out from the main stream and to release H2S
as a residual component. The H2S molecule is adsorbed in a zinc oxide bed and zinc sulphide
is formed as a result of the reaction, which finally, is removed as solid waste (Molburg & Doctor, 2003). The temperature of this process is between 260–430 °C and the pressure is around 50 bar.
Natural gas reforming
After the purification process, natural gas goes through the reforming step, which is divided into two main parts: pre-reforming and methane reforming.
In the pre-reforming reactor, the heaviest hydrocarbons are transformed into methane prior to the main reforming reactor. This occurs into a low-temperature adiabatic steam reforming unit within a nickel catalyst bed with operation temperature from 350–550 °C (Liu, Song, & Subramani, 2009). A gas heated reformer (GHR) is generally used as a pre-reformer since it has also the function of heat exchanger, cooling the methane reforming products (syngas) prior to the water gas shift reactors.
The steam reforming reaction is the next step and is highly endothermic, meaning energy is needed in order to convert the methane (CH4) and steam (H2O) into hydrogen (H2) and
carbon monoxide (CO). Since natural gas is mainly composed of methane, we focus on methane reforming, which is described by the following equation:
𝐶𝐶𝐻𝐻
4+ 𝐻𝐻
2𝑂𝑂 → 𝐶𝐶𝑂𝑂 + 3𝐻𝐻
2, with an enthalpy change of
∆𝐻𝐻 = +206.28 kJ/mol.
Several reactor tubes filled with nickel-based catalysts enable the reforming reaction while the methane and steam pass through them, with the heat necessary for the activation provided by a furnace in which methane fuel is burnt with air and tail gas recycled according to the following equation:
𝐶𝐶𝐻𝐻
4+ 2𝑂𝑂
2→ 𝐶𝐶𝑂𝑂
2+ 2𝐻𝐻
2𝑂𝑂,
withΔ𝐻𝐻 = −802.2 kJ/mol 𝐶𝐶𝐻𝐻
4.
The optimal operating temperature is between 800–950 °C and the pressure around 20–25 bar (IEAGHG, 2017; Voldsund, Jordal, & Anantharaman, 2016). The steam-carbon (S/C) ratio should be around 3–4 since lower values can partially cause carbon deposition on the catalyst surface, and the conversion yield is positively affected by a high S/C ratio (Liu, Song, & Subramani, 2009). On the other hand, a low S/C ratio is preferred from energy efficiency and economic point of view. The upper-temperature limit is due to material limitations which cannot withstand higher temperature than 1200–1300 °C.
Water gas shift reaction (WGSR)
In combination with the steam reforming reaction, the water-gas shift reaction (WGSR) constitutes the conversion process of carbon monoxide and water vapour into carbon dioxide and hydrogen. The reaction is described below by the equation:
𝐶𝐶𝑂𝑂 + 𝐻𝐻
2𝑂𝑂 → 𝐶𝐶𝑂𝑂
2+ 𝐻𝐻
2, with
Δ𝐻𝐻 = −41.16 𝑘𝑘𝑘𝑘/𝑚𝑚𝑚𝑚𝑚𝑚.
Here, additional hydrogen is extracted from the water in the steam accompanying the process. The reaction occurs at relatively low temperatures and usually takes place in two steps, a high-temperature shift (HTS) and a low-temperature shift (LTS). In the HTS, around 80% of CO is converted, with an inlet temperature between 350–550 °C. In the LTS, at temperatures from 190 to 250 °C, the CO mole fraction is reduced to 0.2–0.4 % (Liu, Song, & Subramani, 2009). The lower limit is determined by the water dew point of the gas.
Hydrogen separation
We consider hydrogen purification through Pressure Swing Adsorption (PSA), since more than 85% of the current hydrogen production units use PSA technology (Liu, Song, & Subramani, 2009). The reforming product, purified by the CO2 and cooled down to 25 °C,
pass through an adsorption column at high pressures letting through pure hydrogen while adsorbing the other impurities (CH4, CO, CO2, O2 and a small amount of H2). In order to
restore the adsorption column, the pressure is lowered to atmospheric pressure leading to release the impurities from the adsorption material. Typical adsorbents are silica gel, alumina, activated carbon and zeolite (Voldsund et al., 2016). This technology operates at a pressure between 20–60 bar and ambient temperature. Hydrogen is then purified with a pressure drop of 1–2 bar. The purified gas, called “tail gas”, exits the PSA unit with a
pressure between 1–2 bar. A PSA unit typically has a hydrogen recovery rate between 60-95 % with a purity of 99% (Voldsund et al., 2016).
Carbon capture
After the WGS reaction, the carbon dioxide component is separated from the shifted syngas prior to the hydrogen purification (IEAGHG, 2017). To the best knowledge of the authors, carbon capture after the WGS is applied by Air Liquide and Air Products. The captured CO2 is
sold to e.g. horticulture greenhouses and soda manufacturing industry. Although the CO2 is
captured, the emissions are nevertheless included in the emission statistics under EU ETS; captured emissions are only excluded when the CO2 is stored in a long-term storage facility
(like in CCS) (NEa, 2014).
It is assumed that the CO2 capture is done using the absorption method, which is the most
commercially mature technology. This method is characterised by the use of a liquid solvent in order to remove the CO2 from the main stream. The solvent can be chemical or physical.
Chemical solvents require heat to react with CO2 and absorb it since the reaction must occur
quickly into a relatively small reactor. MDEA, MEA, TEA and potassium carbonate are
solvents typically used for the chemical CO2 capture. Physical solvents do not react with CO2,
but they dissolve it, requiring less energy than chemical solvents (Voldsund et al., 2016). According to several studies, the use of MDEA as solvents can lead to a separation of 95% of CO2 from the main products with a purity of above 99% (Voldsund et al., 2016). A drying
step is required to remove water from the syngas which originates from the CO2 absorption
step.
A summary of the material and energy flows based on two different cases (with and without CO2 capture) and two sources can be found in Table 3.
Table 3 Summary of the material and energy flows for the SMR process, based on different cases and sources.
Reference IEAGHG (2017); base case (no CO2capture)
IEAGHG (2017); standard case with
CO2 capture using
MDEA (1A)2)
Jakobsen & Åtland (2016)3)
Raw materials Unit ratio [t/t H2]
Natural gas feed 2.9 2.9 2.6
Water 6.6 6.8 7.21)
Air PM PM 15.8
By-products Unit ratio [t/t H2]
CO2 captured 0 5.2 6.4
CO2 emitted 9.0 4.1 2.4
Energy Specific consumption [GJ/t H2]
Natural gas as fuel 22.4 27.4 21.7
Electricity 0.48 2.1 2.6
Total primary energy required
23.64) 32.74) 28.24)
1) Water consumption does not include cooling water used in the process and generated by the process. 2) MDEA absorption is used as CO2 separation unit and it is applied to the reformed gas (after reformer) with an
efficiency of 90%.
3) For optimized process at 950 oC reforming temperature.
4) Conversion factors to primary energy are: 1 GJ steam = 1.11 GJp; 1 GJ natural gas = 1 GJp; 1 GJ electricity = 2.5
GJp (RVO, 2020).
The reforming process is the most energy-intensive part of the entire production process, which is not surprising, since the methane reforming is highly endothermic, and a high amount of energy is required that is provided by the combustion of fuel in the furnace. In the hydrogen production process, CO2 is produced in two ways:
1. Flue gas from fossil fuel combustion 2. After the WGS reaction.
The first amount of CO2 is the part emitted by the plant and released into the atmosphere,
while the second is in the described configuration removed and captured from the shifted gas through an absorption CO2 unit with a capture efficiency of 90-95%.
2.1.2 Cogeneration of hydrogen and carbon monoxide
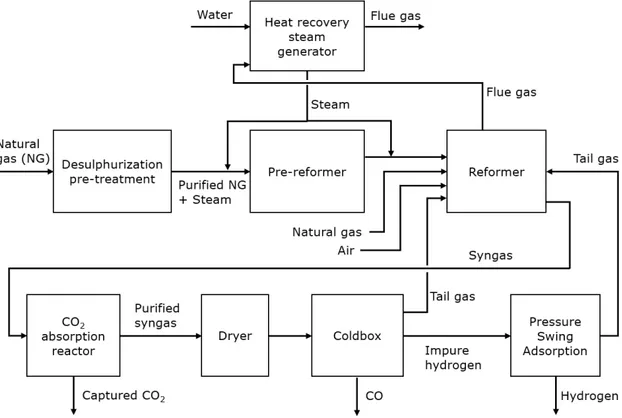
Hydrogen and carbon monoxide can be co-produced through the same SMR process aforementioned, together with steam and carbon dioxide as by-products. The two main differences in this process, compared with the standard SMR, are the dryers and ColdBox unit and the absence of the WGS reactor. A schematic of the process is shown in Figure 4.
Figure 4 Schematic overview of the co-production process of hydrogen and carbon monoxide using cogeneration of hydrogen and carbon monoxide (partially based on information from Air Liquide, 2021).
The raw syngas leaving the reforming step is fed into the absorber column where CO2 is
washed out from the syngas by a counter-current flow of lean solvent. The treated raw H2
contains 0.26% CO2 after the removal step. The absorbed CO2 is sent to the stripper column,
where the rich solvent flowing down from the top of the column is stripped of its CO2 by the
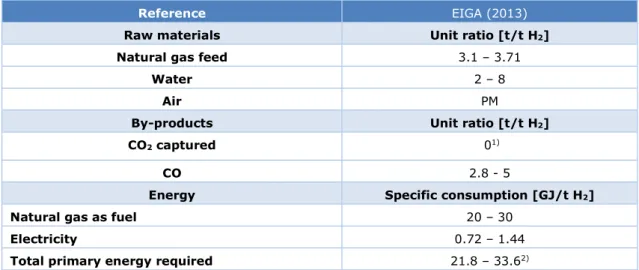
vapour generated from the reboiler. In order to separate the carbon monoxide from the process gas, the ColdBox uses a cryogenic distillation process that can obtain high purity CO (>95%). The feed gas is pre-treated to remove impurities which will freeze at cryogenic temperatures encountered in the process. It is then partly condensed in heat exchangers and flashed in a syngas drum before being purified step by step through distillation columns. According to the European Industrial Gases Association (EIGA), this so-called HyCO process enables a very flexible plant operation with a co-production yield that ranges from 0.20 to 0.36 kg H2/kg CO (EIGA, 2013). The raw syngas from the reformer stream is sent directly to the
CO2 removal unit to maintain a high CO/H2 ratio. As of 2013, a typical HyCO plant can produce
3,000-3,600 Nm3 of hydrogen per tonne of feedstock (EIGA, 2013).
Typical mass and energy flow parameters are taken from the EIGA report (EIGA, 2013) and shown in Table 4.
Table 4 Raw materials, by-products, and energy for the co-production of H2 and CO
with HyCO process.
Reference EIGA (2013)
Raw materials Unit ratio [t/t H2]
Natural gas feed 3.1 – 3.71
Water 2 – 8
Air PM
By-products Unit ratio [t/t H2]
CO2 captured 01)
CO 2.8 - 5
Energy Specific consumption [GJ/t H2]
Natural gas as fuel 20 – 30
Electricity 0.72 – 1.44
Total primary energy required 21.8 – 33.62)
1) No CO2 absorption is assumed in this process. However, CO2 may be captured in a similar way as with the SMR.
The CO2 component in the raw syngas (after SMR) may be removed and captured through absorption with an
efficiency of up to 90%.
2) Conversion factors to primary energy are: 1 GJ steam = 1.11 GJp; 1 GJ natural gas = 1 GJp; 1 GJ electricity = 2.5
GJp (RVO, 2020).
2.1.3 Autothermal Reforming Method (ATR)
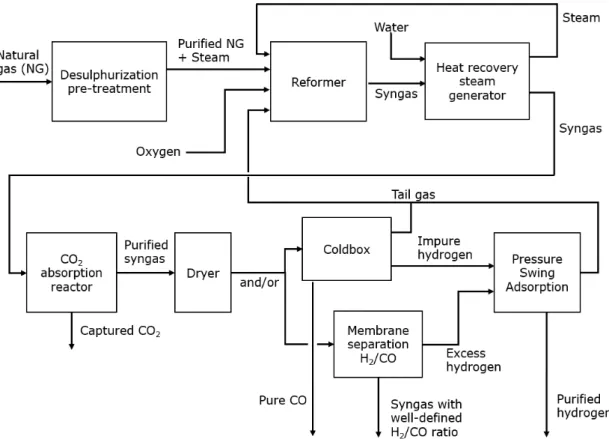
The Autothermal Reforming technology (ATR), schematically shown in Figure 5, is a process for syngas production, by partially oxidizing natural gas with oxygen and steam and then reforming it catalytically (Air Liquide, 2018a). The shown production process allows for variable production of syngas composed of hydrogen and carbon monoxide, in various composition ratios.
Figure 5 Schematic overview of the production process of syngas, carbon monoxide and hydrogen using the Autothermal Reforming process (based on information from Air Liquide, 2021).
After the desulphurisation step, the feed gas (natural gas) is heated and optionally pre-reformed before entering the ATR reactor at 30 to 100 bar via the burner. In the first reaction area, the feed gas reacts with oxygen (partial oxidation) and steam to produce syngas. Successively, the raw syngas passes through a catalyst bed inside the same reactor for further methane reforming in order to achieve a high conversion yield. Finally, the syngas is cooled in a process gas boiler, generating high-pressure steam which can be exported or used for power generation. The syngas can be used as feedstock for various synthesis processes, including methanol and Fischer-Tropsch synthesis. Steam methane reforming and partial oxidation takes place simultaneously, as described by the equation:
𝐶𝐶
𝑛𝑛𝐻𝐻
𝑚𝑚+
1
2 𝑛𝑛𝐻𝐻
2𝑂𝑂 +
1
4 𝑛𝑛𝑂𝑂
2→ 𝑛𝑛𝐶𝐶𝑂𝑂 + (
𝑚𝑚
2 +
𝑛𝑛
2)𝐻𝐻
2Using methane as feedstock (n=1 and m=4), the thermal efficiency is evaluated around 60-75%, with optimum operation parameters in the reactor of 700 °C inlet temperature, ratio S/C=1.5 and O2/C=0.45 (Ersöz, 2008). This process can achieve a syngas yield of 2.5 to 4.0
Nm3/Nm3 natural gas (NG fuel is included) and oxygen consumption of 0.15 to 0.25 kg/Nm3
syngas (Air Liquide, 2018a).
After the reformer and heat recovery, the syngas is subject to CO2 absorption and a drying
step to remove water. The syngas can then be treated in a ColdBox process or by membrane separation. The ColdBox allows for high-purity CO, while in the membrane separation
process a well-defined H2/CO ratio can be achieved. Any excess hydrogen is purified by PSA
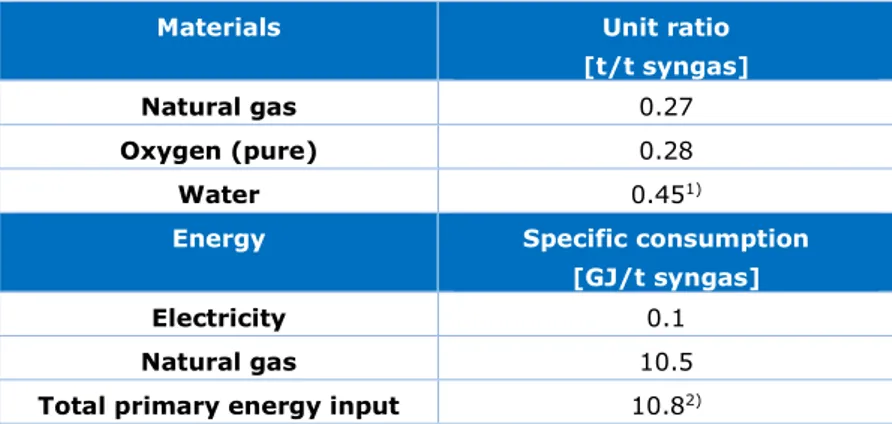
The inputs for the syngas production process, as shown in Table 5, were based on data collected in the report of Jakobsen & Åtland (2016). These data exclude the membrane separation and Coldbox.
Table 5 Material and energy input for syngas production with ATR process
(Jakobsen & Åtland, 2016). The used composition of syngas is 56% CO, 32% CO2,
11% H2, 0.6% CH4 (mass percentages).
Materials Unit ratio [t/t syngas]
Natural gas 0.27
Oxygen (pure) 0.28
Water 0.451)
Energy Specific consumption [GJ/t syngas]
Electricity 0.1
Natural gas 10.5
Total primary energy input 10.82) 1) Water consumption does not include cooling water used in the process.
2) Conversion factors to primary energy are: 1 GJ steam = 1.11 GJp; 1 GJ natural gas = 1 GJp; 1 GJ electricity =
2.5 GJp (RVO, 2020).
Since the syngas and CO are the only carbon-containing output streams, no CO2 is assumed
to be emitted from the ATR process.
2.2 O
2, N
2and Argon production
Oxygen and nitrogen, with argon as a by-product, are produced by air-separation units (ASU). The technology can be divided into two main technologies: cryogenic distillation for large amounts of air, and the non-cryogenic technologies, for small scale production, which separate air at ambient temperatures through a process called pressure swing adsorption (PSA), or polymeric membranes. This report will focus on the cryogenic distillation.
2.2.1 Cryogenic Separation
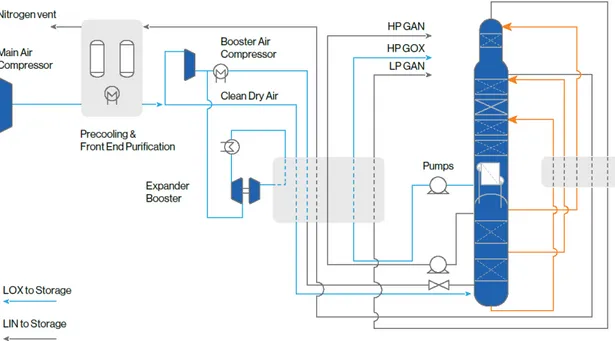
The cryogenic air separation unit (ASU) is considered the most effective technology for the production of a high amount of pure oxygen, nitrogen and a small amount of argon. The process is based on the different boiling points of the air components, which are achieved by cooling down the atmospheric air to liquefy it. The liquefaction of a large part of air is necessary in order to start the separation of air components, reaching the operational temperature and pressure below the critical point which is around Tcrit= -140.7 °C (132.5 K)
and Pcrit= 37.7 bar (3.77 MPa) (Linde, 2019). Figure 6 illustrates a standard cryogenic
distillation plant that produces gaseous oxygen, gaseous and liquid nitrogen and argon (Air Liquide, 2017).
Figure 6 Overview of a standard cryogenic air separation plant by distillation. Retrieved from Air Liquide (2017). The only main outputs are high-pressure gaseous oxygen (HP GOX), high-pressure gaseous nitrogen (HP GAN),
low-pressure gaseous nitrogen (LP GAN). LOX and LIN refer to liquid oxygen and liquid nitrogen, respectively.
Air compression and cooling
The process starts with the flow of atmospheric air through filters that remove dust and other particles harmful to the process. Then strong compression of the stream occurs through the adoption of alternate steps of compressors and heat exchangers. The heat obtained by the increase of pressure is transferred to a counter current water stream which is chilled by the cold gaseous mix recycled from distillation columns, to decrease the temperature to ambient temperatures or below. At the end of this stage, the air is
compressed to around 670 kPa and reach a temperature of around 160 °C (Ebrahimi et al, 2015).
Air purification
The second step is characterized by the purification of air from carbon dioxide and water vapour since during cryogenic distillation they can form solid contaminants that can negatively affect the entire process. Water vapour is condensed and removed by a direct contact cooler and liquid separation of the stream, while carbon dioxide and other hydrocarbons are removed by a molecular sieve pre-purification unit.
Cold production and internal product compression
After the purification process, the air stream is further compressed by an air booster
compressor in order to reach the pressure of around 1,210 kPa and a temperature of 110 °C. The air-cooling method here is represented by the expansion of the gas which decreases its pressure in order to reach the cryogenic temperature necessary for the further distillation. This process is accomplished by an expansion turbine that produces mechanical energy from the expansion for driving a process compressor or another energy-consuming machine. Moreover, pumped pure oxygen and nitrogen from distillation columns are warmed to ambient temperature or just below by the application of a multi-stream high-pressure heat exchanger.
Cryogenic distillation of air
The most important part of an air separation unit is the separation of air components into distillation columns. A double-column rectification system composed by a high-pressure (HP) columns installed below a low-pressure (LP) column which are connected by a condenser and evaporator. Partially condensed air flows at the bottom of the HP column and it rises up letting cold gaseous nitrogen, with a lower boiling point than oxygen (-196 °C), to reach the top column, while liquid air is collected in the perforated trays. At the LP column, the oxygen-enriched liquid is then separated into pure oxygen streams and nitrogen waste gas at the top column.
The connection between the two columns is characterized by the condenser/evaporator which liquefies gaseous nitrogen at top HP column against boiling pure oxygen at the bottom of LP column (with a purity higher than 99%) (Burdyny & Struchtrup, 2010). For large scale production of several thousand tonnes of oxygen needed by the oxy-fuel process, the current work requirement is 220 kWh/tonne O2 based on the analysis of Seltzer et al. (Seltzer, Fan,
& Hack, 2007) and 245 kWh/tonne O2 according to Hong et al. (Hong, et al., 2009). The
amount of energy required depends also on the production volume. For an oxygen production between 500 and 1000 tonnes, the work required by cryogenic distillation lies between 280 and 340 kWh/tonne O2 (Hong, et al., 2009).
Argon production
The production of argon occurs within a “side arm” column, which receives a feed vapour from the low-pressure column with the maximum argon concentration (between 10 to 20%), and the lowest nitrogen concentration (Agrawal, Auvil, Choe, & Woodward, 1990). This column enables the collection of gaseous argon at the top of the column, condensing oxygen at the bottom that is successively recirculated into the distillation column. Although argon is less than 1% of the air composition, the typical argon recovery rate in a large ASU may exceed 95% (Agrawal et al., 1990).
The input and output flows and energy use, as described by several sources, are listed in Table 6.
Table 6 Input and output flows for production of industrial gases by cryogenic air separation, normalised to 1 t O2 produced.
Raw materials [t/t O2] Source
Air 5.3 Ebrahimi et al., 2015
Cooling water 18.9 Ebrahimi et al., 2015
By-products [t/t O2]
Nitrogen 4.0 Ebrahimi et al., 2015
Argon 0.05 Ebrahimi et al., 2015
Specific energy consumption
[GJ/t O2]
Electricity 0.6 – 1.8 Air Liquide, 2018
Total primary energy required for utilities
1.5 – 4.51)
1) Conversion factors to primary energy are: 1 GJ steam = 1.11 GJp; 1 GJ natural gas = 1 GJp; 1 GJ electricity = 2.5
GJp (RVO, 2020).
Of the separation process, air compression is the most energy-demanding step since a strong increase in pressure (101.3 kPa – 650 kPa) is required for the distillation column.
3 Industrial gas
products and
applications
Industrial gases are widely requested due to their several applications in a wide range of industries. The most widely used industrial gas is nitrogen. Oxygen is the second most widely used industrial gas, with a global production in 2006 of 440 million tonnes (Gasworld, 2007). The global production of hydrogen was estimated in 2010 to be between 45 and 50 million tonnes, of which 7.8 million tonnes (17.3–15.6%) was produced in Europe (WEC, 2019). CO2
is captured in the hydrogen production facilities. Therefore, we have added the application of CO2 in this overview as well.
3.1 Hydrogen market
The total European hydrogen consumption in 2010 was estimated to be 7 Mt (CertifHy, 2015; Mulder, Perey, & Moraga, 2019). The production of hydrogen in The Netherlands was estimated to be about 0.8 Mt during the early 2010s (CE Delft, 2018). Recent estimates are larger, about 0.97 Mt1 when including only pure hydrogen, and 1.5 Mt when including
hydrogen present in gas mixtures (Weeda & Segers, 2020; DNVGL, 2019).
As described before on page 8, the produced hydrogen can be divided into ‘captive’ and ‘merchant’ production. Captive production is usually part of a larger process and used on-site, e.g. ammonia production and in refineries. Merchant hydrogen is produced by industrial gas producers and sold to third parties. 64% of the total European hydrogen is produced on-site by and for large consumers in the chemical industry, and another 27% is produced as a by-product in chemical production such as crackers (CertifHy, 2015).
In terms of consumption, the current hydrogen application is dominated by ammonia production and refinery feedstock, together more than two-thirds of the total hydrogen production in The Netherlands.
Other applications include the reduction of iron in metal processing. For this sector, the hydrogen consumption reached 0.7 million tonnes in Europe and a market share of around 10%, with an annual consumption per single plant of up to 720 tonnes/year (Mulder, Perey, & Moraga, 2019). Other non-energy-related applications of hydrogen are the production of synthetic materials (plastics, polyester, nylon) and hydrogenation of fats and vegetable oils in food industry, while energy-related applications are mainly represented by production of high-temperature heat for industrial processes (chemical, steel or oil refinery sector) and production of electricity in flexible power stations (combined cycle gas turbine or future fuel-cell plant). The hydrogen production facilities discussed in this report do presently (2020) not produce their hydrogen for these applications (M. Weeda, personal communication, 2020).
A detailed breakdown by application is shown in Table 7 (Weeda & Segers, 2020).
Table 7 Dutch hydrogen production by application type. Source: Weeda & Segers (2020)
Producing hydrogen by steam methane reforming based on natural gas (‘grey’ hydrogen) is currently the cheapest option. According to the World Energy Council (2019), the production cost for hydrogen using mature technology is between EUR 1 and EUR 1.5 per kilogram of H2
(WEC, 2019). CO2 is currently captured partially (around 45% on the total emitted in the
process) and the cost of the CCS technology varies depending on the supply-chain aspects. An average production cost for ‘blue’ or low-carbon hydrogen is estimated around 1.5 EUR/kg. However, production costs are expecting to increase for both production routes due to the increase of natural gas price. On the other hand, ‘green’ and ‘import’ hydrogen (‘import’ means generated using renewable energy generated outside the country and then imported) have an opposite trend since, with technology development and rise of renewable electricity production, by around 2030 these sustainable pathways is expected to reach the same cost range as ‘blue’ route (2–3 EUR/kg) (CE Delft, 2018). Figure 7 describes an overview of the trends of different type of hydrogen in terms of total supply-chain costs.
Figure 7 Overview projected trends of integral supply-chain costs of three different hydrogen pathways (CE Delft, 2018).
Currently, hydrogen from electrolysis is present as by-products of the chlor-alkali process for the production of chlorine and sodium hydroxide. Otherwise, no industrial-scale volumes of hydrogen production by water-electrolysis takes place in The Netherlands by 2021. As mentioned above, the produced hydrogen is used as an industrial gas for non-energetic applications. Hydrogen is also used as fuel for transport applications. Beyond 2030, hydrogen may play a larger role in Dutch industry as a fuel for high- and low-temperature process heat and possibly for power generation. Furthermore, it is considered as a possible replacement of natural gas for heating purposes in the built environment and as transport fuel for heavy duty vehicles and buses. According to this scenario, depending on the production route taken into consideration by the government, experts predict an important growth of hydrogen market towards 2030 by 0.6 Mt/yr (72 PJ/yr) (CE Delft, 2018), although the scenarios differ as to how large the future role of hydrogen as fuel is (Detz, Lenzman, Sijm, & Weeda, 2019; Mulder, Perey, & Moraga, 2019).
3.2 Carbon monoxide market
Carbon monoxide is an industrial gas that has many applications in bulk chemicals manufacturing. Over 90% of carbon monoxide is used in the form of synthesis gas, so in coexistence with hydrogen, to produce methanol. The rest is consumed directly for the production of phosgene, acrylic acid, acetic acid, dimethylformamide, propionic acid, pivalic acid, and many other copolymers. According to “Global Carbon Monoxide Market Research Report 2017” (QYResearch, 2017), its global market value was estimated around 2,790 million USD and it is expected to grow at 3,219 million USD by 2022. In addition, the global production of carbon monoxide reached about 3,757 Gt in 2016, with a growth of 23% by 2022. The global production market of this industrial gas is dominated by Linde Gas, Air Liquide, Air Products and Praxair with a total share of 63% in 2016 (QYResearch, 2017).
3.3 Carbon dioxide market
The carbon dioxide is gradually gaining more importance in the Dutch market, and instead of being simply emitted into the atmosphere, it can represent a product to supply to other companies. The global CO2 demand is estimated to be about 250 Mt in 2020 (IEA, Putting
CO2 to use, 2019), mainly for urea production and Enhanced Oil Recovery (EOR). Other than these, the largest end-user of ‘merchant’ carbon dioxide is the beverage industry, which uses this gas to carbonated soft drinks, beer and wine and to prevent bacterial growth.
Figure 8 Growth in global CO2 demand (left); breakdown of demand in 2015 (right).
Copied from (IEA, Putting CO2 to use, 2019)
The greenhouse horticulture sector also represents also an important end-user of CO2. It is
used in greenhouses as a fertiliser to enhance growth. In 2015, around 1.3 Mt of CO2 was
supplied to Dutch greenhouses, of which 60% is provided through exhaust gases of CHP plants while 40% is supplied via pipelines or by trucks from external sources (Mikunda, Neele, Wilschut, & Hanegraaf, 2015). According to Mikunda et al., 80% of the total CO2
exported for greenhouses in the Netherlands is supplied by OCAP CO2 B.V., a 100%
subsidiary of Linde Gas. The current CO2 sources of OCAP are the Shell Refinery and the Alco
bioethanol plant (Khandelwal & van Dril, 2020).
A potential future application for CO2 could be the use in methanol production. Currently,
BioMCN already adds CO2 into the methanol production process as it has an excess of
hydrogen in the process. Depending on the energy balance of this process, it may be applied on a large scale in the future, as methanol can act as a building block for basically any organic chemical (M. Weeda, personal communication, 2020).
3.4 Oxygen market
The overall global oxygen consumption in 2006 was 440 million tonnes (Gasworld, 2007), and it has maintained a constant growth of 5-6% (Gasworld, 2007). In Western Europe, there was an important oxygen supply growth of 46% from 1995 to 2005 due to a rapid establishment of ASU facilities in the area, but it currently grows by less than 1% annually. Unfortunately, there is no specific data available about the total volume of oxygen consumed in the Netherlands, but if we observe the current production capacity of the three main gas
companies, we assume a market share of minimally 0.6% of the global production (approximately 2.5 Mt in 2017).
The steel industry represents the largest end-user industry sector, which consumes 48% of the global oxygen demand (580 kt/day). In this sector, the oxygen is used to enrich air for the increase of combustion temperature and energy efficiency, and to replace coke with other combustible materials (Gasworld, 2007). The annual oxygen consumption by the Dutch steel industry (Tata Steel IJmuiden) is estimated to be 0.9 billion Nm3 or 0.63 Mt (Keys, Van
Hout, & Daniels, 2019, p. 12).
The second main consumer of oxygen is the chemicals industry, which includes refineries, petrochemicals, agrochemicals, pharmaceuticals, polymers, pigments and oleochemicals. This sector represents 19% of the global oxygen consumption with 40% of this is produced on-site (Gasworld, 2007). The oxygen is used in large quantity for coal gasification to generate synthesis gas or to enrich air feed for catalytic cracking in refineries.
3.5 Nitrogen market
Although we have not found information about the total nitrogen market in the Netherlands, global information can be used to give a broad view on this matter. In 2017, the global industrial nitrogen market was valued at EUR 13.5 billion with an increase expected for 2020 to EUR 18 billion (Research and Markets, 2019).
The industrial nitrogen has different applications that differ depending on its phase. Gaseous nitrogen is used mainly for the ammonia production and as shield gas thanks to its inert property. Liquid nitrogen has its main application for the cooling systems due to its low cost. In the Netherlands, industrial nitrogen has an additional fundamental application by being added to high-calorific natural gas imported from Norway and Russia in order to decrease its calorific value and make the natural gas appropriate for domestic infrastructures. An increase in nitrogen demand is expected due to an increase of high-calorific gas import and a
reduction of Groningen gas extraction. Gasunie in 2017 increased its high calorific natural gas demand by 11% through the nitrogen application. In 2018, the total amount of nitrogen available from the national pipeline network for this purpose reached 627,000 m3/h (reserve
capacity included) (Gasunie, 2019).
3.6 Argon market
Argon is the most abundant, cheapest noble gas. The market of this industrial gas is
expected to annually grow 5.5% from 2018 to 542 million USD in 2023. In 2016, about 700 kt of argon was produced worldwide (Market Research Future, 2019).
The main use of argon is related to the production, processing and fabrication of metals. Argon is a significant shielding gas used during arc welding processes. It is also used as the inert gas in electric light bulbs (when mixed with nitrogen), and for semiconductor
4 Options for
decarbonisation
This chapter will describe potential options to achieve a reduction of energy use and/or CO2
emissions for the production of hydrogen. The final section of this chapter, section 4.6, briefly discusses the use of green electricity for oxygen, nitrogen and argon production, which is the only decarbonisation option of these production processes.
Regarding hydrogen, in a number of plants not only hydrogen is a product of the processes, but also syngas or CO. Decarbonisation options should then in fact also include decarbonised syngas and CO production. This is taken into account for some of the options below, but not for all.
We have determined seven categories along which decarbonisation of a process can be tackled. These are shown in Figure 9.
Figure 9 Categories of CO2 reduction
For the hydrogen production process, we have identified the most important options along those categories, and list them in Table 8. It should be noted that this is not an exhaustive list of options, and additionally, options and their characteristics are likely to develop in the future.
Table 8 Overview of seven categories of decarbonisation options for the hydrogen production industry. The underlined options are addressed in more detail in this chapter.
Category Description Decarbonisation options
1 Fuel substitution Substitution of the current fuel/energy supply
Biogas 2 Feedstock
substitution
Substitution of the current feedstock supply
Hydrogen from biomass 3 Process design Substitution of the current
production process based on a different fuel, feedstock or an entirely different process, to create the same product with energy/emissions reduction
Electrolysis
Thermal decomposition of methane
4 Recycling Recycle of some products or by-products to save
energy/heat consumption from the entire process
5 Product design Reduction of the total product demand or substitution
Possible decline in oil refinery 6 Use of residual
energy
Delivery of steam to surrounding plants (Air Products delivers to Exxon Mobil, Air Liquide to Huntsman, Wilmar and LyondellBasell)
7 CO2 capture and
storage or re-use
Carbon capture and storage processes or capture and direct use of CO2 in another process
CCS to flue gas
CCS to raw syngas before PSA CCS to tail gas after PSA CCU
4.1 Feedstock/fuel substitution: Hydrogen from biomass
The production of hydrogen through biomass is considered a valuable decarbonisation option since CO2 released during biomass gasification process is then absorbed by growing plants
through photosynthesis that represent future biomass feed (Ni, Leung, Leung, & Sumathy, 2006). Hydrogen production processes from biomass can be divided into two main
categories: thermochemical processes such as pyrolysis or steam reforming of bio-oils, gasification, steam gasification, and supercritical water gasification; or biological processes such as biophotolysis of water using green or blue algae, photo-fermentation,
dark-fermentation, and a hybrid reactor system (Ni et al., 2006). The former type of thermo-chemical processes can achieve higher overall efficiency (thermal energy to hydrogen) (>50%) and lower production cost with the disadvantage of formation of char and tar. Biological production requires less conversion energy with less CO2 emissions with the
drawback of a low hydrogen yield (<12 wt%) (Ni et al., 2006). The CO2 emissions from
hydrogen production through biomass are higher than the ones produced by a standard SMR plant because of the higher carbon content of biomass. However, the net carbon emissions using biomass as feedstock can be considered neutral if we considered the amount of CO2
equivalent released by combustion equal to the amount of CO2 recapture by the plants used
to produce the feedstock. It should thus be decided whether this process is the best candidate for using the relatively scarce amount of biomass. Also, it should be investigated
whether the required amount of biomass can be obtained in The Netherlands or whether it can be imported in a cost-effective manner, or whether the required amount is simply too large.
4.1.1 Biogas reforming
One of the options to produce green H2 is through the replacement of natural gas with biogas
during the reforming process and fuel combustion in SMR furnace. This method, despite the non-avoided CO2 emissions, is considered “green” due to its potential to achieve zero or even
negative net carbon emissions (when combined with CCS). The source and production method of the biogas are determinant in the carbon footprint and its potential for sustainable application.
The most important difference between the steam methane reforming process and the biogas steam reforming is the presence of CO2 in the feedstock, which can lead the system to
high sensitivity to carbon formation in the operation regime, which could deposit in the material bed of the reactor. For this reason, an excess of steam supply is necessary and then it can be removed through condensation.
Availability of biogas is one of the challenges of this decarbonisation option. Biogas currently cannot be produced on the scale required for a hydrogen plant, since a typical existing biogas plant can produce around 0.25 Nm3/s, with respect to 25-30 Nm3/s used in a large
scale SMR plant (Yao, Kraussler, Benedikt, & Hofbauer, 2017).
4.1.2 Biomass pyrolysis and steam reforming of bio-oils
Fast pyrolysis of biomass is an alternative option for hydrogen production where a thermal decomposition occurs that transforms biomass into bio-oil with a yield between 70-80% (water included) based on starting mass (Borole, et al., 2017). In absence of air or oxygen, biomass is rapidly decomposed at high temperature (between 400-500 °C) into liquid and gaseous products, without the formation of carbon oxides such as CO and CO2. The bio-oil
product is then finally obtained with a fast cooling step of pyrolysis vapours to below 400 °C (Czernik, Evans, & French, 2007). Hydrogen production from bio-oil feedstock is then carried out using a fluidized bed reactor as a steam methane reforming unit. Theoretically, the overall stoichiometry describes a maximum H2 yield of 17.2% based on the whole bio-oil
weight but this can be increased by around 10% with the application of a WGS reactor (Borole, et al., 2017). This process currently has two disadvantages, which are a low thermal efficiency (around 56%) compared to other standard hydrogen production processes (SMR, ATR), and formation of tar and char that can induce unwanted secondary reactions
decreasing the overall efficiency.
4.1.3 Biomass gasification
This process consists of several steps that transform a carbon-rich solid fuel to syngas with the application of a gasification agent:
- Drying process to remove moisture (150°C);
- Pyrolysis to produce volatiles such as H2, CO, CO2, CH4, tar, etc. (200-650 °C);
- The reaction of volatiles in product gas (700-1000 °C); - The heterogeneous reaction of char (700-1000 °C).
Figure 10 shows a very common and commercialized biomass gasifier that is used for large-scale production. The composition of product gas depends mainly on the gasifier type, biomass fuel and gasification agent.
Figure 10 Overview of a downdraft biomass gasifier (Hannula, 2009).
Typical gasification agents for combustion reaction are O2, H2O, CO2, and H2. In addition, the
heat requirement for gasification reactions is provided by partial oxidation of biomass fuel through heat pipes or circulating bed material depending on the type of gasifier. An N2 free
product gas is necessary for hydrogen production so pure O2 gasification agent is considered
for the combustion reaction (Binder, Kraussler, Kuba, & and Luisser, 2018).
Steam gasification of biomass
Biomass steam gasification is considered an efficient type of the general biomass gasification process described above because less tar and char are produced during the process due to the application of steam as a gasification agent instead of air. The overall steam gasification reaction is described below:
Biomass + Steam → H2+ CO2+ CO + CH4+ light and heavy HC + Tar + H2O + Char The advantages of this process are a higher hydrogen yield reaching values between 50 to 80 g H2/kg of biomass (with temperature varying from 800 to 950 oC) and up to 55 vol.% of
H2 concentration in the output product (Binder, Kraussler, Kuba, & and Luisser, 2018).
Finally, the hydrogen yield increases with the application of steam methane reforming and WGS reaction of the product gas mixture. Figure 11 describes an overview of a biomass steam gasification process.
Figure 11 Overview of the steam gasification process (Hannula, 2009).
4.1.4 Cost of hydrogen production using steam gasification of biomass
The H2 production costs of steam gasification depend on the feedstock price and quantity
required. For the cost assessment, we considered H2 production through biomass gasification
in a dual fluidized bed steam gasification system and gas separation membrane as H2
purification technology. According to Müller et al., steam gasification technology is capable to produce 1 tonne of hydrogen with a reasonable consumption of biomass, 14.2 tonnes, and process water, 0.3 tonnes (Müller, Stidl, Pröll, Rauch, & Hofbauer, 2011). In addition, almost 6 MWe of electricity is required for the production process compared to a standard SMR plant
that has an electricity surplus delivered to the grid. The high consumption depends also to the application of the gas permeation membrane that use electricity to compress H2. The
cost and energy requirement are summarised in Table 9.
CO2 emissions through steam gasification are higher than those of a standard SMR plant
because of the higher carbon content of biomass. However, the net carbon emissions using biomass as feedstock can be considered neutral if we considered the amount of CO2
equivalent released by combustion equal to the amount of CO2 recaptured by the plants used
to produce the feedstock.
Table 9 Techno-economic parameters H2 production through steam gasification
Hydrogen production through steam gasification
Value Comment Source
CO2 emissions
(t CO2/t H2)
21.5 Considering an emission factor of 109.6 kg CO2/GJ as solid biomass and a feed/H2 ratio of 14.2. This direct emission is produced through the combustion of biomass and tail gas recycled in order to supply heat to the gasifier. RVO, 2020a; Müller et al., 2011 Electricity demand [TJ/kt H2]
11.2 This value includes the demand for air compression and product gas compression before membrane separator unit.
Müller et al., 2011
CAPEX
[MEUR2017/kt H2]
2.5 Based on investment cost of EUR 50 million for a 20 kt/yr H2 facility. Müller et al., 2011 OPEX [EUR2017/t H2] 0.05 Assumed 2% of CAPEX