Contact: Arno Swart, RIVM
Dit is een uitgave van:
Rijksinstituut voor Volksgezondheid en Milieu
Postbus 1 | 3720 BA Bilthoven Nederland
1
Dose-response for inhalationIntroductie OPS
1.1 Introduction
In this document we describe how to make the step from exposure, as calculated by the modified OPS simulation (see the main VGO
document), to illness. The step from exposure to illness is made by applying a dose-response model, which gives the probability of illness as a function of exposure dose. There are several issues when applying this paradigm to our situation of continuous application to low doses of inhaled organisms.
Firstly, dose-response relations for enteric micro-organisms are developed for ingestion. We have found no literature references for inhalation, for our main micro-organisms: E. coli, Campylobacter and Staphylococcus. Note that for micro-organisms that are well known to be harmfull following inhalation, dose response relations are known. For example, for Q fever, B. anthracis or Legionella., or viruses such as the Coxsackievirus (Haas, 1999). It is believed that respiratory infection due to enteric pathogens is mainly due to swallowing the ingested organisms (Pillai, 2007). Hence, we will also follow the route via ingestion, in the absence of inhalation models and data. In the literature, the fraction of ingested organisms is not agreed on, rangeing from 10% (Medema, 2004) to 50% (Brooks, 2005). However, those estimates are poorly founded in theory or data.
In order to quantify the amount of inhalation and ingestion, based on characteristics of the human subject (inhalation rate, volume,
mount/nose breathing), and of the pathogen (size-distribution of aerosols, virulence), a dose response relation should be based on
dosimetric principles. The most complete dosimetric model is that of the ICRP (Bailey, 2007, ICRP). The appendix to this document describes in more detail the ICRP model which we use to translate a dose to an ingested amount of organisms. It is a compartemental model, idealising the human alveolar tract (Hofmann, 2011). To give an indication, according to the ICRP model, for an adult male at light exercise, 23% percent of inhaled aerosols of mean diameter of 1 micrometer ends up in the upper airways (ET2 region). Such an individual inhales 1.5 m3/h
air.
Secondly, it is not evident how a received dose should be interpreted. In the case of ingested enteric micro-organisms the dose is usually set by considering a meal with an accompanying portion size and bacterial concentration to derive an instantaneous dose. The dynamics of
infection are on a much shorter timescale than the time between meals, which justifies this assumption. However, in the case of inhalation, the exposure is continuous, and discrete dosing events are hard to define. There has been some work in recent literature on time-dose-response models, taking into account the continuous nature of exposure (Huang, 2009) . We will see however, that the concentration to which a subject is typically exposed is so low, that the dose may be considered very low
(in the order of one organism), and separated by sufficient time to consider them discrete doses.
A third consideration is the impact of immunity. Most dose-response models that are currently applied do not take into account the beneficial effect of boosting of the immunse system by repeated exposure to low doses of a pathogen. However, it has been shown for Campylobacter, that the impact of immunity may be substantial (Havelaar, 2014). Moreover, in our situation we are exactly in the regime where immunity matters: low doses and frequent exposure. We will pay some attention to this issue in our scenario analysis. Due to the large uncertainties in the impact of immunity those analyses will have to be exploratory.
1.2 Exposure assessment
As our model organism we choose Campylobacter, since it is the only pathogenic micro-organism measured in the vincinity of farms. However, only DNA was measured using the PCR technique, and no culturing was performed. Hence, we have no information on the amount of viable organism. For this reason, as a substitute we use the number of living E. coli micro-organisms. It is thought that E. coli may be more resistant than Campylobacter. However, although there are some indications, there is no data to quantify this effect. We have to acknowledge though, that this will bias our results towards higher incidence.
A second reason for choosing Camplylobacter is the availability of dose-response relations, and some knowledge of the impact of immunity. Finally, there is indirect evidence for a significant contribution of Campylobacter infections via an environmental route in the
neighbourhood of poultry holdings. This is further elaborated on in the discussion.
For our scenario we picture individuals located at 100m downwind from a poultry farm. Taking as a E. coli organisms, we have on average 3% positive samples, with 1.5 organism per m3 positive sample (see main
VGO report, Figure 4.1). Hence multiplying a typical breathing rate of 1.5 [m3/hour] for a male in light exercise (ICRP, 1994), with the number
of organisms per cubic meter gives 2.25 organisms per hour, when E. coli are present (3% of the times).
According to the ICRP model for a male subject in light exercise, 23% of the inhaled matter is deposited in the upper airways (Valantin, 2002). From the model presented in (ICRP, 1994) we can derive an equation describing transport from the ET2 (nasal region) to the gastro-intestinal tract (i.e., swallowing),
𝐺𝐺𝐺𝐺(𝑡𝑡) = 𝐷𝐷(1 − exp(−𝜆𝜆𝑡𝑡))
where D is the inhaled dose, and λ=100 per day. As an illustration, after one hour, this model predicts that 98% percent of the deposited matter is swallowed. After 10 minutes, 50% of the dose is swallowed. In one minute, 7 percent of the dose is swallowed. Given the much lower
clearance rates from ET2 to other compartments, we will assume that all organisms are swallowed.
Hence, of the 2.25 organisms per hour, 23% is swallowed, this equals 0.52 organisms. This, we interpret that once every 2 hours a single organism is swallowed. Also including the 3% positive samples yields a single Campylobacter every 67 hours.
1.3 Probability of infection
The probability of infection given ingestion of a single Campylobacter organism is estimated at 0.686 (Teunis, 2005), implying a 68.8% chance of infection every 67 hours. Put another way, there is a
probability of 1/67 of encountering a Campylobacter each hour, and a 68.8% probability of infection, giving a 1% probability of infection each hour.
1.4 Probability of illness
The probability of illness is more problematic, since different models are used in practice. The most prevalent model assumes a probability of 3% for illness given infection (Havelaar, 2000), ignoring dose dependency. In our case, in the presence of extremely low doses, we consider this unrealistic.
Teunis et al., (Teunis, 2005) propose a dose dependent model given by 𝑃𝑃(𝑖𝑖𝑖𝑖𝑖𝑖𝑖𝑖𝑖𝑖𝑖𝑖𝑖𝑖 |𝑖𝑖𝑖𝑖𝑖𝑖𝑖𝑖𝑖𝑖𝑡𝑡𝑖𝑖𝑖𝑖𝑖𝑖) = 1 − (1 + 𝜂𝜂𝐷𝐷)−𝜌𝜌
with 𝜂𝜂= 1. 23 ∗ 106 and 𝜌𝜌= 8. 13 ∗ 10−7 yielding at dose D=1,
𝑃𝑃(𝑖𝑖𝑖𝑖𝑖𝑖𝑖𝑖𝑖𝑖𝑖𝑖𝑖𝑖 |𝑖𝑖𝑖𝑖𝑖𝑖𝑖𝑖𝑖𝑖𝑡𝑡𝑖𝑖𝑖𝑖𝑖𝑖) = 1.14 × 10⁻⁵
Combining this with our estimate of 1% probability of infection per hour yields a probability of illness of 1x10⁻⁷ per hour.
1.5 Effect of immunity
In our scenario, we are in the regime of repeated exposure to low doses, which may induce protective immunity, lowering the overall risk. Little is known of the effects of acquired immunity, since reliable data to
quantify the effects is scarce. Nonetheless in (Havelaar, 2014) an
estimate is made of the impact, depending on dose and frequency. From Figure 1 in this article we find an inflation factor of about 10%, which indicates that the probability of illness in the presence of acquired immunity is a factor ten lower as compared to the calculation in the previous section.
It is thought provoking that the frequent exposure to low doses via the airborne route may actually be protective. At the current level of scientific knowledge, and in the presence of considerable uncertainties, we are not in the position to prove or disprove this hypothesis yet.
1.6 Risk assessment
To assess the magnitude of the number " a probability of illness of 1x10⁻⁷ per hour ", consider working eight hours a day, for 250 days a
year. The probability of at least one illness event is 1 − (1 − 1 × 10⁻⁷)8∗250= 2 × 10⁻⁴
Estimates for the Netherlands are about 100.000 per 17 million inhabitants per year, i.e. 588 per 100.000 inhabitants. Thus in this scenario about 1 in 30 Campylobacter cases is attributable to inhalation. In the presence of immunity, the probability of illness would be about 10% lower, and about 1 in 300 Campylobacter cases would be
attributable to the airborne route.
1.7 Discussion
The quoted numbers of illness cases should be interpreted with care since,
• Working 8 hours a day for 250 days at 100m from a farm is an extreme scenario, meant to illustrate hazards in a risky setting • The exposure estimate is calculated for the centre of the plume,
where concentrations are highest, further away from the plume, concentrations of Campylobacter in the air will be significantly lower.
• The actual inactivation rate of Campylobacter in the air is unknown
However, the scenario is not entirely without merit, considering the following points
• We considered only average exposure, while exposure during peak events can be much higher
• We took data from the measurement days. There will be days in the year with more favourable transmission characteristics (stable atmosphere, high wind speed), when exposure will be elevated
• For subpopulations with enhanced susceptibility (the elderly, immunocompromised), the risk could be higher.
At the very least, the current work shows that infection and illness via the airborne route, in the vicinity of poultry farms is certainly a
possibility. Also note that we consider only infection by Campylobacter here, in reality the airborne route will be relevant for a wider range of pathogens.
As an alternative scenario, somewhat more extreme we may consider the background concentration of E.coli, 100 organisms, dead and alive per cubic meter (VGO main report, Fig 4.1). The difference between dead and alive organisms is about a factor 10.000, which yields 10-2
viable organisms per cubic meter. Compared to the 1.5 organisms at 100m, this is a reduction of a factor 150. Since we are in the low-dose regime where oure calculations are to good approximation linear, this more realistic scenario (but also more uncertain due to the
extrapolations) yields 0.13 illness cases per 100.000 inhabitants. One in 4500 cases would be attributable to the airborne route. Again, this alternative scenario is only indicative, due to great uncertainty. Nonetheless, it gives an indication that airborne transmission is a realistic possibility, not only directly in the neighbourhood of the farm. There are more indications in the literature sugesting that
Campylobacter may cause illness via an environmental pathway. In (Friesema, 2012) the authors show that in 2003, after large scale culling
due to an outbreak of avian influenza, the incidence of campylobacterios declined most in the vicinity of culled farms. This is a strong indication that a non-alimentary route is responsible for part of the disease incidence. Consumption of poultry meat also declined during the outbreak, however, not specifically in the culling area but rather nationwide.
2
References
Bailey, M. R., et al. "Updating the ICRP human respiratory tract model." Radiation protection dosimetry 127.1-4 (2007): 31-34.
Brooks, J. P., et al. "A national study on the residential impact of biological aerosols from the land application of biosolids." Journal of Applied Microbiology 99.2 (2005): 310-322.
Friesema, Ingrid HM, et al. "Poultry culling and campylobacteriosis reduction among humans, the Netherlands." Emerging infectious diseases 18.3 (2012): 466-468.
Haas, Charles N., Joan B. Rose, and Charles P. Gerba. Quantitative microbial risk assessment. John Wiley & Sons, 1999.
Havelaar, A. H., and A. N. Swart. "Impact of Acquired Immunity and Dose‐Dependent Probability of Illness on Quantitative Microbial Risk Assessment." Risk Analysis 34.10 (2014): 1807-1819.
Havelaar, A., de Wit, M., and van Koningsveld, R., 2000. Health burden in the Netherlands (1990-1995) due to infections with thermophilic Campylobacter species. RIVM rapport 284550004, Bilthoven, the Netherlands.
Hofmann, Werner. "Modelling inhaled particle deposition in the human lung—a review." Journal of Aerosol Science 42.10 (2011): 693-724. Huang, Yin, and Charles N. Haas. "Time‐Dose‐Response Models for Microbial Risk Assessment." Risk Analysis 29.5 (2009): 648-661. ICRP, and International Commission on Radiological Protection. ICRP Publication 66: Human Respiratory Tract Model for Radiological Protection. No. 66. Elsevier Health Sciences, 1994.
Medema, G., et al. "Risk assessment of Legionella and enteric pathogens in sewage treatment works." Water Science and Technology: Water Supply 4.2 (2004): 125-132.
Pillai, Suresh D. "Bioaerosols from land-applied biosolids: issues and needs." Water environment research 79.3 (2007): 270-278.
Teunis, P., et al. "A reconsideration of the Campylobacter dose–response relation." Epidemiology and infection 133.04 (2005): 583-592.
Valantin, Jack. "Guide for the practical application of the ICRP human respiratory tract model." Annals of the ICRP 32.1-2 (2002): 17-28.
3
Appendix, Using the ICRP model for dose determination
3.1 Human Parameters
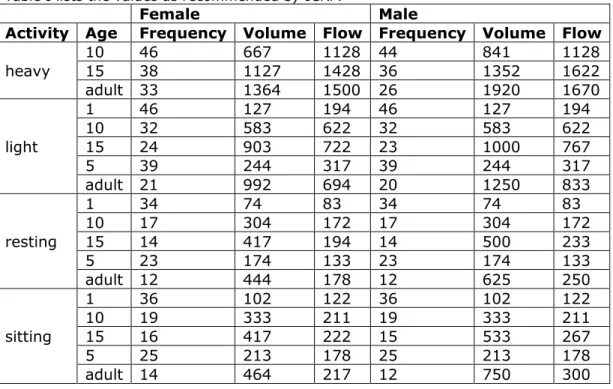
As a first step we need reference values for individuals in the target area, stratified by age, sex, and activity. The values needed are,
• 𝑉𝑉𝑇𝑇, the tidal volume [mL], the amount of air breathed in one inhalation
• 𝑉𝑉̇, the flow rate [mL/s], the rate of air flowing per second
• fR, the respiration frequency [min-1], the number of breaths per minute
• SF, scaling factor for width of airways
Table I lists the values as recommended by ICRP.
Female Male
Activity Age Frequency Volume Flow Frequency Volume Flow heavy 10 15 46 38 667 1127 1128 44 1428 36 841 1352 1128 1622 adult 33 1364 1500 26 1920 1670 light 1 46 127 194 46 127 194 10 32 583 622 32 583 622 15 24 903 722 23 1000 767 5 39 244 317 39 244 317 adult 21 992 694 20 1250 833 resting 1 34 74 83 34 74 83 10 17 304 172 17 304 172 15 14 417 194 14 500 233 5 23 174 133 23 174 133 adult 12 444 178 12 625 250 sitting 1 36 102 122 36 102 122 10 19 333 211 19 333 211 15 16 417 222 15 533 267 5 25 213 178 25 213 178 adult 14 464 217 12 750 300 Table I. Recommended
Table II. Recommended values for the scaling factor (SF) Female Male Age SF 1 2.20 2.20 10 1.26 1.26 15 1.09 1.04 5 1.55 1.55 adult 1.08 1.00
Table III Fraction of total ventilatory airflow passing through the nose, Fn, in nasal augmenters (normal nose breathers) and in mouth breathers.
Level of exertion Nasal augmenter Mouth breather
Sleep 1.0 0.7
Rest 1.0 0.7
Light exercise 1.0 0.4
Heavy exercise 0.5 0.3
3.2 Deposition and clearance
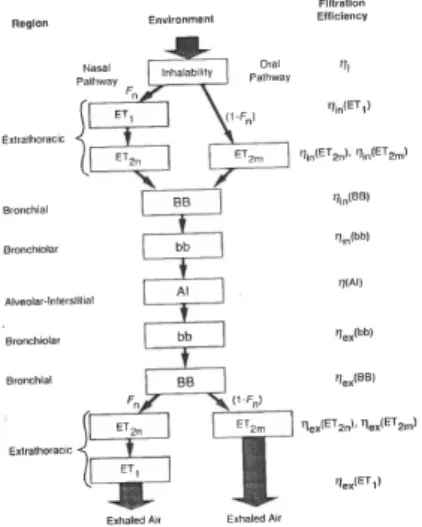
Our focus is pathogens that get inhaled and subsequently swallowed, hereby ending up in the gastro-intestinal (GI) tract, where the usual dose-response relations may be employed. This amounts to calculating firstly the deposition in the extrathoracic (ET) region (see Figure 1), and subsequently clearance via the GI tract.
Figure 1. Summary of anatomical regions in the respiratory tract.
For deposition, the anatomical regions are viewed as a series of filters in sequence (Figure 2).
Figure 2. Schematic representation of the filters of the respiratory tract, during an inhalation-exhalation cycle.
On inhalation, the fraction of the air that reaches filter j is given by 𝜙𝜙𝑗𝑗= ⎩ ⎪ ⎨ ⎪ ⎧ 1 if 𝑗𝑗 = 0 [𝑖𝑖𝑖𝑖𝑒𝑒𝑖𝑖𝑒𝑒𝑖𝑖𝑖𝑖𝑒𝑒𝑖𝑖𝑖𝑖𝑡𝑡] 1 −𝑉𝑉1 𝑇𝑇� 𝜈𝜈𝑘𝑘 𝑗𝑗−1 𝑘𝑘=0 if 1 ≤ 𝑗𝑗 ≤ (𝑁𝑁 + 1)/2 [𝑖𝑖𝑖𝑖ℎ𝑎𝑎𝑖𝑖𝑎𝑎𝑡𝑡𝑖𝑖𝑖𝑖𝑖𝑖] 𝜙𝜙𝑁𝑁−𝑗𝑗+1 if 𝑁𝑁 + 12 < 𝑗𝑗 ≤ 𝑁𝑁 [𝑖𝑖𝑒𝑒ℎ𝑎𝑎𝑖𝑖𝑎𝑎𝑡𝑡𝑖𝑖𝑖𝑖𝑖𝑖]
Here, N is the number of filters (N=7 for the oral pathway, N=9 for the nasal pathway), VT is the tidal volume, and 𝜈𝜈𝑘𝑘 is the volume of filter k. Let 𝐺𝐺𝑗𝑗 be the number of particles arriving at filter j, where 𝐺𝐺0 indicates the number of particles in the environment. The fraction Fn of tidal flow passing through the nasal passage (see Figure 2) given in Table III. The filtration efficiency is defined as
𝜂𝜂𝑗𝑗= 1 −𝐺𝐺𝑗𝑗+1𝐺𝐺 𝑗𝑗
Combining the fractions of air with the filtration efficiency, we calculate the number of particles deposited at filter j as
𝐷𝐷𝑗𝑗= 𝜂𝜂𝑗𝑗𝜙𝜙𝑗𝑗�(1 − 𝜂𝜂𝑘𝑘) 𝑗𝑗−1
𝑘𝑘=0
A little algebra shows that this formula can also be described recursively as 𝐷𝐷1= 𝜂𝜂1(1 − 𝜂𝜂0) = 𝜂𝜂12 𝐷𝐷𝑗𝑗= 𝐷𝐷𝑗𝑗−1𝜂𝜂𝑗𝑗𝜙𝜙𝜙𝜙𝑗𝑗 𝑗𝑗−1 1 − 𝜂𝜂𝑗𝑗−1 𝜂𝜂𝑗𝑗−1
where 𝜂𝜂1= 1 − 𝜂𝜂0 is an imaginary pre-filter also known as ‘inhalability’. This inhalability is modelled as
η_1=0.5[1+e^(-0.06d)]
where d is the aerodynamic diameter.
Now, clearance to the GI tract is only possible from the ET2 region.
Therefore we concentrate on deposition from this region only. From Table 12 of [ICRP 1996] we find for nose breathing the following
expressions for aerodynamic and thermodynamic deposition efficiencies.
𝜂𝜂𝑎𝑎𝑎𝑎= 1 − 1 1 − 5.5 × 10⁻⁵�𝑑𝑑2𝑉𝑉̇𝑛𝑛𝑆𝑆𝑆𝑆 13�1.17 𝜂𝜂𝑡𝑡ℎ= 1 − 𝑖𝑖 −15.1�𝐷𝐷(𝑉𝑉̇𝑛𝑛𝑆𝑆𝑆𝑆1 )−14� 0.538 𝜂𝜂2= �𝜂𝜂𝑎𝑎𝑎𝑎2 + 𝜂𝜂𝑡𝑡ℎ2
Here, 𝑉𝑉̇𝑛𝑛 in [cm3 /s] is the volumetric flow rate through the nose, given by the flow rate (Table I) multiplied by the factor for nose Fn for nose breathing. For any reasonable value for D, around 10-4 to 10-7, (see
Seinfeld en Pandis (2006)) we find that 𝜂𝜂𝑡𝑡ℎ can be safely neglected. Hence, the total deposition becomes
𝜂𝜂2= 1 − 1
1 − 5.5 × 10⁻⁵�𝑑𝑑2𝑉𝑉̇
𝑛𝑛𝑆𝑆𝑆𝑆13�1.17
The intake 𝐺𝐺0 is calculated from the concentration of organisms C [organisms/m3], the breathing rate B [m3/h] and exposure time t [h]: