RIVM report 250911006/2005
Risk assessment of Campylobacter in the Netherlands via broiler meat and other routes M.J. Nauta1, W.F. Jacobs-Reitsma2, E.G. Evers1, W. van Pelt1, A.H. Havelaar1*
1National Institute for Public Health and the Environment (RIVM), P.O. Box 1, 3720 BA Bilthoven
2 Wageningen UR, Animal Sciences Group (ASG), P.O. Box 65, 8200 AB Lelystad
* corresponding author
Microbiological Laboratory for Health Protection e-mail: Arie.Havelaar@rivm.nl
This investigation has been performed by order and for the account of the Ministry of Public Health, Welfare and Sports, the Ministry of Agriculture, Nature and Food Quality, and the Food and Consumer Product Safety Authority, within the framework of project V/250911, CARMA: Campylobacter Risk Management and Assessment.
Het rapport in het kort
Risicoschatting van Campylobacter in Nederland via kippenvlees en andere routes Elk jaar worden mensen ziek door de Campylobacter bacterie. Omdat de overheid wil weten wat zij hier het best tegen kan doen, is dit in het CARMA project onderzocht. Dit rapport beschrijft om te beginnen wat de oorzaken van campylobacterbesmetting zouden kunnen zijn. Direct contact met (huis-)dieren en de consumptie van onverhit voedsel komen naast
kippenvlees als belangrijke bronnen naar voren. Kippenvlees zou een aanzienlijk deel van de ziektegevallen kunnen veroorzaken. Er is een wiskundig model gebouwd om meer inzicht te krijgen in het vóórkomen en de verspreiding van campylobacter in de productieketen van kippenvlees, van de boerderij tot en met de bereiding van het vlees in de keuken thuis. Met het model is ingeschat waar en hoe het best ingegrepen kan worden om campylobacter te bestrijden met als doel het aantal zieken dat erdoor veroorzaakt wordt effectief te
verminderen. Een goede optie lijkt te zijn om zowel het aantal besmette kippen, als de hoeveelheid campylobacters in de kippenmest en op het kippenvlees aan te pakken. Dat kan door extra aandacht te geven aan de hygiëne op de boerderij, door tijdens de slacht het lekken van besmette mest uit de karkassen te verminderen en door het kippenvlees met bijvoorbeeld melkzuur te wassen. Er valt dan een aanzienlijke gezondheidswinst te behalen. Gegarandeerd vers campylobactervrij vlees is alleen mogelijk als al het vlees doorstraald zou worden. De meest doelmatige maatregelen zijn echter alleen vast te stellen als ook economische en maatschappelijke aspecten worden meegenomen. Hiervoor wordt verwezen naar andere rapporten die in het kader van dit CARMA project zijn verschenen.
Trefwoorden: Kwantitatieve microbiologische risicoschatting; ketenmodel; Beheersingsmaatregelen; Blootsstellingsschatting; Epidemiologie
Abstract
Risk assessment of Campylobacter in the Netherlands via broiler meat and other routes Each year numerous people get ill due to the Campylobacter bacterium. Research within the CARMA project aims to advise the Dutch government on dealing with this problem. This report first describes the possible sources of human exposure to campylobacter in the Netherlands. Next to poultry meat, direct contact with (pet and farm) animals and the consumption of raw and undercooked food are identified as important sources. Broiler meat may be the source of many cases of campylobacteriosis. A mathematical model is built to gain insight in the presence and transmission of campylobacter through the broiler meat production chain, from farm to fork. The model is used to assess the effects of interventions to control campylobacter and to reduce the incidence of campylobacteriosis. It shows that a combined approach is promising: reduction of the prevalence of colonised birds and lowering of the numbers of campylobacters in the faeces and on the broiler meat. This may be
achieved by further improvement of farm hygiene, reducing faecal leakage during processing and decontamination of the carcasses with lactate. Implementation of these interventions may result in a considerable public health profit. It is not possible to guarantee fresh
campylobacter free broiler meat, unless the meat is irradiated. To select the most effective interventions, economic and social aspects are included in the analysis. This is described in other reports written within the CARMA project.
Keywords: Quantitative Microbiological Risk Assessment; Farm to fork risk model; Control measures; Exposure assessment; Epidemiology
Contents
Summary 6
1. Introduction 7
2. Campylobacter transmission via routes other than broiler meat 11
2.1 Estimation of the relative importance of Campylobacter transmission routes and risk factors based on a laboratory driven case-control study 11
2.1.1 Introduction and objective 11 2.1.2 Study design 11
2.1.3 Results 13
2.2 Estimation of the relative importance of Campylobacter transmission routes based on exposure assessment 15
2.2.1 Introduction and objective 15 2.2.2 Method 16
2.2.3 Data 18 2.2.4 Results 18
2.3 Exposure assessment versus epidemiology 22 2.3.1 Number of predicted campylobacter cases 22 2.3.2 Relative importance of transmission routes 24 3. Risk Model 29
3.1 Methodology 29 3.1.1 Principle 29
3.1.2 Uncertainty and variabilities 29 3.1.3 Interventions 30
3.1.4 Data sources 31
3.1.5 Model implementation 31
3.1.6 Extrapolation: from model objective to project scope 32 3.2 Model description 32 3.2.1 Overview 32 3.2.2 Processing 34 3.2.3 Cutting 38 3.2.4 Storage 41 3.2.5 Consumer preparation 42 3.2.6 Exposure 45
3.2.7 Ingestion and Dose-response 47 3.2.8 Overview of the risk model 50 3.3 Parameter estimates baseline model 50
3.3.1 Flock and animal prevalence 51 3.3.2 Concentration in the faeces 51 3.3.3 Carcass exterior 53 3.4 Interventions 58 3.4.1 Selection of interventions 58 3.4.2 Evaluated interventions 61 3.4.3 Effects of interventions 62 3.4.4 Alternative scenarios 72 4. Results 75
4.1 Baseline 75 4.2 Interventions 83 4.2.1 Farm 83 4.2.2 Scheduled treatment 85 4.2.3 Processing 86 4.2.4 Consumer 87
4.2.5 Comparison of response measures 88 4.3 Alternative scenarios 90
4.3.1 Input Next and Cfec 90
4.3.2 Variability between birds and flocks 92
4.3.3 Processing model and expert study uncertainty 92 4.3.4 Cutting and storage 96
4.3.5 Consumer food handling 96 4.3.6 Dose-response 97
5. Discussion 99
5.1 Chicken meat as a source of campylobacteriosis 99 5.2 Baseline 100
5.3 Interventions 101 5.4 Alternative scenarios 103 5.5 Uncertainties 105
5.5.1 Expert judgement as data source 105 5.5.2 Extrapolation 108 5.5.3 Relative Risk 108 5.6 Model Validation 111 5.6.1 Processing model 111 5.6.2 Monitoring results 114 5.6.3 Fillet counts 114 5.6.4 Epidemiology 114 5.7 Gaps in knowledge 115 5.8 Model and Methodology 116 5.9 Conclusions 117
References 119
Acknowledgements 125
Summary
Research performed within the CARMA project aims to advise the Dutch government on dealing with the public health burden due to campylobacteriosis. This report first describes the possible sources of human exposure to campylobacter in the Netherlands. For this purpose, results of a laboratory driven case control study is combined with an exposure assessment study. Comparison of these approaches shows a discrepancy in the predicted incidence. Despite some differences in the ranking of sources, not only poultry meat, but also direct contact with (pet and farm) animals and the consumption of raw and undercooked food are identified as important sources by both studies.
Broiler meat may be the source of many cases of campylobacteriosis. A mathematical model is built to gain insight in the presence and transmission of campylobacter through the broiler meat production chain, from farm to fork, including a dose-response relationship. This quantitative microbiological risk assessment model is constructed using the Modular Process Risk Modelling (MPRM) methodology. First, a baseline model describes the 'present'
situation in the Netherlands, for chicken breast fillet and a cross-contaminated salad. Parameter estimates of this model are based on the scientific literature and, when data were lacking, on expert judgement. The model includes some novel aspects compared to
previously published risk assessments of campylobacter in broiler meat. It explicitly includes variability between flocks and between birds and differentiates between numbers of
campylobacters in the faeces and on the carcass. The model dynamics include the basic non-linear dynamics of cross-contamination.
Next, the risk model is used to assess the effects of interventions to control campylobacter and reduce the incidence of campylobacteriosis. A set of interventions is proposed by the risk management in the CARMA project, ranging from the farm to industrial processing and the consumer stage. The effects of these interventions are translated to modified parameter values. Comparison of model outputs (the number of predicted cases) then allows evaluation of the effects of the interventions. It shows that it is not possible to guarantee fresh
campylobacter free broiler meat, unless the meat is irradiated. However, some interventions may yield a considerable lower human incidence of campylobacteriosis. A combined approach is most promising: reduction of the prevalence of (flocks of) colonised birds and a decrease of the numbers of campylobacters in the faeces and on the broiler meat. This may be achieved by further improvement of farm hygiene, reducing faecal leakage during processing and decontamination of the carcasses with lactate. An important finding is that interventions aimed at lowering the concentration of campylobacter may be quite effective, despite the fact that campylobacter is not eliminated. To select the most effective interventions, economic and social aspects are included in the analysis. This is described in other reports written within the CARMA project.
1.
Introduction
This report is part of the CARMA (Campylobacter Risk Management and Assessment) project, a collaborative project of several Dutch research institutes which aims to advise the Dutch government on possible interventions to reduce the number of cases of
campylobacteriosis in the Netherlands. It is a predominantly technical report on the
quantitative ‘farm to fork’ risk model of the broiler chicken production chain as constructed within CARMA, including an analysis of the importance of chicken meat as a route of transmission in comparison with other routes. For details on Campylobacter,
campylobacteriosis and the CARMA project we refer to Havelaar (2001) and Havelaar et al. (2005).
Scope
Broiler chickens are generally regarded as one of the main sources of campylobacteriosis. Campylobacter is frequently found in broiler chickens and on broiler chicken meat. Humans can thus be exposed to campylobacter by the consumption of improperly heated chicken meat or other foods which are cross-contaminated with campylobacter during food preparation of an (accompanying) meal with chicken meat.
The relevance of chicken meat as source of Campylobacter infections is explored first. Next, the scope of the ‘farm to fork’ risk model described in this report is to assess and compare the effects of interventions, aiming to reduce this exposure, all over the broiler chicken meat production chain. Hence, the scope of the model is all Dutch cases of campylobacteriosis originating from the consumption of food contaminated with campylobacter in the
Netherlands, originating from broiler chickens. The model excludes human campylobacter infections of Dutch people acquired abroad. In assessing the number of cases without interventions, consumption of broiler chicken meat of non-Dutch origin is included in the analysis, with the assumption that all the meat can be treated alike, independent of country of origin. However, the interventions will be directed at Dutch broilers and broiler meat only. The impact of this complication is discussed elsewhere (Mangen et al. 2005a).
Model demarcation
Due to restrictions in research time and resources, and additional restrictions in knowledge and data availability, the broiler meat risk model has been restricted to one route of exposure only. A detailed analysis of one route only allows the inclusion of details that may have an important impact on the (non-linear) dynamics of the transmission of campylobacter through the ‘farm to fork’ chain. Finally, the conclusions of this single route are extrapolated to the broader scope as defined above.
Therefore the broiler meat risk model described in chapters 3 and 4 of this report deals with Dutch private home consumers of a salad which is cross-contaminated with campylobacter from chicken breast fillet. It is restricted to meat originating from Dutch processing plants and animals reared in the Netherlands. The food product is chosen because chicken breast
fillet is a raw chicken product which is frequently prepared in Dutch private homes. The presumed route of exposure from chicken breast fillet is cross-contamination, because the fillets are usually cut and cooked. The campylobacters on the fillet are inactivated, but there is a potential for contamination via hands and kitchen equipment. If the
cross-contaminated food is consumed raw (like a salad) the risk of exposure is largest.
The model described in this paper starts at the point where broilers enter the processing plant. A preceding model on the dynamics of Campylobacter on the farm is constructed by partners in the CARMA project (Katsma et al. 2005). Their model provides input to our model on flock prevalence and animal prevalence. Also, results from the farm model are taken into account that are associated with the effects of several risk reducing interventions at the farm. The endpoint of the baseline model is the number of cases of campylobacteriosis in a year in the Netherlands, acquired by salad consumption by the route described above.
General approach
Effects of possible interventions are evaluated by first describing the present situation in the Netherlands (defined as the situation in the year 2000 at the start of the project). Next, the effects of separate interventions on this present situation are evaluated. Here, interventions are incorporated as changes in some model parameter values, and effects are generated as model outputs at the end of the chain model. This allows comparison at the same end point of different types of interventions at different points in the farm to fork chain. Also, the effects of combinations of interventions can be studied.
As the aim of the CARMA project is to advise the governmental risk management by the end of the project, the model uses the best knowledge as available at the moment. We apply a scientific methodology and use the available data and knowledge generated by scientific research. However, if the scientific information is insufficient, ambiguous or absent, we use the opinion of available experts as a best estimate. This implies that the result of our
assessment reflects the best available knowledge at the time, to serve risk management. Although quantitative, the purpose of the model is not to predict correct numbers expressing levels of exposure to campylobacter and illness rates. The primary objective is to compare the effects of (sets of) interventions, based on the available knowledge.
Additionally, modelling is a good tool to structure the available information and to identify important gaps in data and knowledge. Thus it also generate prioritised research questions that need answers to best improve the advice for risk management.
Context
This report is not the first publication on quantitative risk assessment of Campylobacter in broilers. The model builds further on risk assessments performed in Canada (Fazil et al. 1999), the United Kingdom (Hartnett et al. 2002) and Denmark (Rosenquist et al. 2003) and for WHO/FAO (Anonymous 2001, Anderson et al. 2003). In general, the modelling
approach that we apply is more mechanistic than before, and more precisely deals with variability and uncertainty. Also, the model presented in this report is embedded in the CARMA project. It uses input generated elsewhere in the project (Katsma et al. 2005), and gives input to other parts. The final advice to the risk management combines the results
presented here within the results of an analysis of costs (Mangen et al. 2005a) and an analysis of social acceptance of interventions by different groups of stakeholders (Bogaardt 2005). Other routes of exposure, next to chicken meat, are studied by Evers et al. (2004) and Doorduyn et al. (in prep a), as summarized in chapter 2 of this report.
Outline
The main focus of this report is the risk model on campylobacter in broiler meat. In chapter 2 the importance of chicken meat as a source of campylobacteriosis is explored in comparison with other sources, using both an epidemiological approach and a comparative exposure assessment approach. Chapter 3 first describes the methodology applied for the chicken meat risk model. It presents the models constructed for the consecutive stages of the farm to fork chain and the parameter estimates of the baseline model, which represents the present situation in the Netherlands. Then, it describes the baseline scenario and the effects of the selected interventions and a series of alternative scenarios developed to explore the impact of some assumptions and uncertainties in the model. In chapters 4 and 5 modelling results are presented and discussed. Section 5.5 of the discussion particularly deals with uncertainties like those related with the extrapolation of the results to the broader scope of the model. It also gives a list of the ten key simplifying assumptions of the risk assessment, of which the risk management should be aware.
2.
Campylobacter transmission via routes other than
broiler meat
In this chapter attention will be given to all possible transmission routes for Campylobacter. First, a summary of the setup and results of the epidemiological (so called CaSa) study will be given. Second, the same will be done for the comparative exposure assessment. Finally, the two studies will be compared, discussing similarities and differences.
2.1
Estimation of the relative importance of Campylobacter
transmission routes and risk factors based on a laboratory
driven case-control study
This chapter is based mainly on two draft papers on risk factors for endemic gastro-intestinal illness due to Campylobacter jejuni and Campylobacter coli, respectively (Doorduyn et al. in prep a, Doorduyn et al. in prep b) and a report to the ministry of Public Health on risk factors for endemic C. jejuni, congress presentations and workshop proceedings.
2.1.1 Introduction and objective
In the Netherlands, hardly any epidemiological data on risk factors for campylobacteriosis are available. Therefore a large case-control study was conducted to investigate risk factors for endemic human campylobacteriosis (and salmonellosis) in the Netherlands, the so-called CaSa-study. The CaSa-study aimed to quantify the contribution of different risk factors in order to provide quantitative data as input for the risk assessment study CARMA. By doing so, it will be possible to predict the efficiency of control and intervention measures and to identify possible new leads for control strategies. In this chapter we present the results of analyses of risk factors associated with endemic campylobacteriosis due to C. jejuni and preliminary results for C. coli infection.
2.1.2 Study design
Cases
This study was designed as a case-control study and was conducted from April 2002 to April 2003. Cases were culture-confirmed patients with Campylobacter (or Salmonella) infection, identified by the examination of faecal samples submitted to all Regional Public Health Laboratories (RPHL) in the Netherlands. Isolates were sent to the Animal Sciences Group (Lelystad) for confirmation of the species identification by the RPHL.
Controls
Controls (aiming at two per case) were selected from the population registries of 25 municipalities within the service area of the RPHL by frequency matching for age, sex, degree of urbanization and season of the expected numbers of cases.
For the risk factor analysis, only cases and controls that did not travel to foreign countries in the 7 days prior to symptom onset (cases) or completion of the questionnaire (controls) were included.
Questionnaire
The questionnaires for cases and controls included questions regarding food consumption, kitchen hygiene and food processing, contact with animals, occupational exposure, travelling, water recreation activities, recent use of medication (during the previous four weeks) and contact with persons with diarrhoea or vomiting. Cases were questioned about the 7 days prior to symptom onset and controls about the 7 days prior to completion of the
questionnaire. Parents were asked to complete questionnaires for young children.
Population covered
The incidence of culture-confirmed campylobacteriosis was calculated using the total number of cases identified from the RPHL divided by the population covered by these laboratories. The routine surveillance of salmonella, based on a long tradition of sending in all first isolates by all RPHL, has repeatedly shown a coverage of about 64% of the Dutch population.
Campylobacter surveillance since 1995 has been based on weekly enumeration by all RPHL except one, covering 62% of the regular salmonella surveillance. The CaSa-study allowed for adjustment for underreporting and the time each laboratory participated in the study and estimated that the population coverage for campylobacter was 48%.
Statistical analysis
Standard univariate and multivariate logistic regression was used to estimate odds ratios (OR) and their respective statistical significance and confidence intervals. Because of the design of the study, age, sex and urbanization cannot be studied as risk factors in the univariate and multivariate models and are added to the models as adjusting variables only. Age-stratified analyses are necessary to study age-specific risk factors. Missing values were handled using multiple imputation. Thismethod is recommended to avoid bias in analyses of
epidemiological data with missing covariates. The logistic regression results (OR and confidence interval) from five imputed data sets were pooled to obtain a single final result. The population attributable risk (PAR) of each risk factor was calculated based on the multivariate odds ratios as the number of cases attributable to the risk factor divided by the total number of cases. The number of cases attributable to the risk factor was calculated as the total number of cases minus the estimated number of cases if the risk factor was absent, which was estimated by weighing the cases according to their exposure status. Exposed cases were weighed as 1/OR of exposure, non-exposed cases as one. Although each OR is an independent risk in the final multivariate model, going back to the original cases to compute the corresponding PAR causes this PAR to pick up some attributive risk from related
covariates. Therefore, summing-up PAR’s corresponding to individual independent OR’s sums up to a higher value than computed directly for the whole set of risk factors.
2.1.3 Results
Incidence
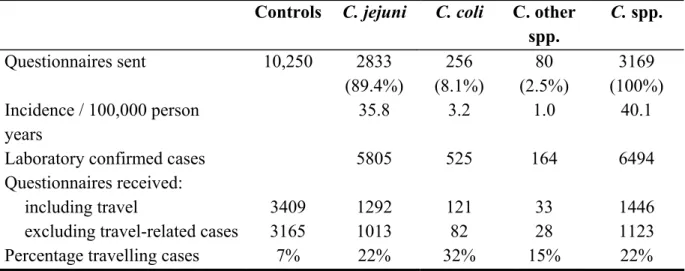
The overall incidence of laboratory confirmed campylobacteriosis, including travel-related cases, estimated from the CaSa-study was 40.1 per 100,000 person years (table 2.1). For the whole of the Netherlands this means about 6500 cases. This takes estimated coverage and underreporting into account as mentioned in the study design-section. About 10% was admitted to a hospital; 22% was travel-related. With 7% of controls travelling within 7 days of completion of their questionnaire this means a population attributable risk (PAR) of 16% for C. jejuni (CI95: 15-17%) and 29% for C. coli (26-30%).
Among cases with a job or attending school, about 75% had been absent. The majority of cases, about 89%, concerned infections by C. jejuni, about 8% C. coli and 2.5% others or unknown species (C. other spp. in table 2.1).
Table 2.1 Campylobacter cases and controls enrolled in the CaSa-study and those responding by returning the questionnaire.
Controls C. jejuni C. coli C. other spp. C. spp. Questionnaires sent 10,250 2833 (89.4%) 256 (8.1%) 80 (2.5%) 3169 (100%) Incidence / 100,000 person years 35.8 3.2 1.0 40.1
Laboratory confirmed cases 5805 525 164 6494
Questionnaires received:
including travel 3409 1292 121 33 1446
excluding travel-related cases 3165 1013 82 28 1123
Percentage travelling cases 7% 22% 32% 15% 22%
Non-response analysis
Non-response analysis was based on data on age, sex and urbanization, available for each case and control approached to fill in the questionnaire. No significant differences were found between those who did and did not fill in the questionnaire. This makes it plausible that a selective response did not play a major confounding role in the epidemiological risk analysis.
Risk factor analysis
The results of the risk factor analysis in table 2.2 refers to that performed for endemic
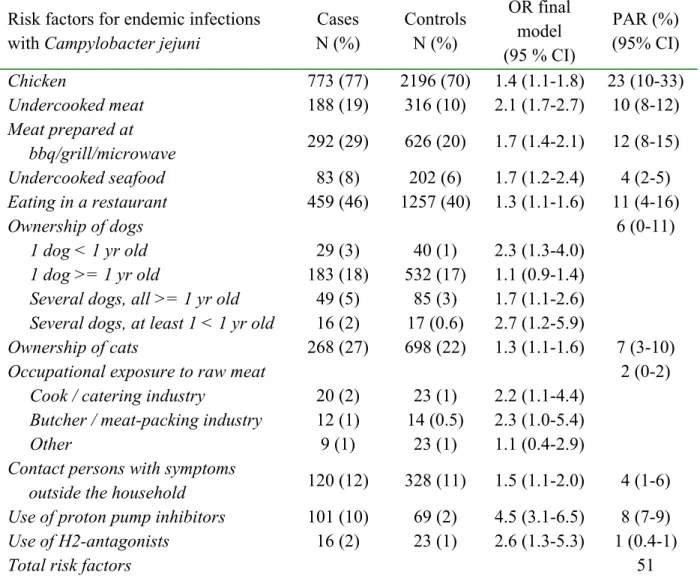
infections with C. jejuni, 1013/1123, i.e. 90% of the Dutch laboratory-confirmed cases. Most risk factors that were significant in the final multivariate model have been previously found. It must be noted that the PAR values in table 2.2 and 2.4 are preliminary. In total, the PAR of the risk factors combined in the final model for C. jejuni, add up to 51%. Chicken
consumption was shown to be the main identified route of transmission (PAR=23%), but a considerable portion was transmitted by pets. Note however that the 95% confidence interval
for chicken consumption is wide, i.e. 10% - 33%. Quite a large risk was related to the use of anti acid-secretory drugs (9%).
Clearly, next to chicken consumption a range of other risk factors were important with a surprising role of undercooked seafood (PAR=4%). However, traditional risk factors like contact with farm animals, raw milk consumption, water recreation and kitchen hygiene could not be shown to have a significant independent contribution to the risk of infection with
C. jejuni. Moreover, supposed risk factors as contact with animal faeces and visiting pets
were more common in controls than in cases (significant OR<1). The consumption of a whole range of foods was (statistically significant) more common in controls than in cases: meat in paste (croquette, sausage roll), fish (especially regular), hard-boiled egg, dairy
products (not raw), salad, fruit, chocolate and nuts. Instead of talking about ‘protective’ foods it might be worthwhile to analyse the food data by distinguishing a one-sided diet from a varied diet and compute the PAR of this hypothetical life-style related risk factor.
Table 2.2 Risk factors for endemic infections with Campylobacter jejuni in the final multivariate model (preliminary results from Doorduyn et al. (in prep a)).
Risk factors for endemic infections with Campylobacter jejuni
Cases N (%) Controls N (%) OR final model (95 % CI) PAR (%) (95% CI) Chicken 773 (77) 2196 (70) 1.4 (1.1-1.8) 23 (10-33) Undercooked meat 188 (19) 316 (10) 2.1 (1.7-2.7) 10 (8-12) Meat prepared at bbq/grill/microwave 292 (29) 626 (20) 1.7 (1.4-2.1) 12 (8-15) Undercooked seafood 83 (8) 202 (6) 1.7 (1.2-2.4) 4 (2-5) Eating in a restaurant 459 (46) 1257 (40) 1.3 (1.1-1.6) 11 (4-16) Ownership of dogs 6 (0-11) 1 dog < 1 yr old 29 (3) 40 (1) 2.3 (1.3-4.0) 1 dog >= 1 yr old 183 (18) 532 (17) 1.1 (0.9-1.4)
Several dogs, all >= 1 yr old 49 (5) 85 (3) 1.7 (1.1-2.6)
Several dogs, at least 1 < 1 yr old 16 (2) 17 (0.6) 2.7 (1.2-5.9)
Ownership of cats 268 (27) 698 (22) 1.3 (1.1-1.6) 7 (3-10)
Occupational exposure to raw meat 2 (0-2)
Cook / catering industry 20 (2) 23 (1) 2.2 (1.1-4.4)
Butcher / meat-packing industry 12 (1) 14 (0.5) 2.3 (1.0-5.4)
Other 9 (1) 23 (1) 1.1 (0.4-2.9)
Contact persons with symptoms
outside the household 120 (12) 328 (11) 1.5 (1.1-2.0) 4 (1-6)
Use of proton pump inhibitors 101 (10) 69 (2) 4.5 (3.1-6.5) 8 (7-9)
Use of H2-antagonists 16 (2) 23 (1) 2.6 (1.3-5.3) 1 (0.4-1)
Total risk factors 51
Preliminary results of the risk analysis of Campylobacter coli show some similarities and differences with that of C. jejuni. One important difference is the absence of a significant role
of chicken. Remarkable, because both C. coli and C. jejuni occur in poultry in a proportion of about 30%/70%, respectively. If survival in food and pathogenicity would be the same, a significant PAR should have been found for chicken for C. coli. The low number of C. coli cases may have caused the OR for chicken consumption to be statistically not significant. However, the role of undercooked meat was significantly higher (PAR= 25%; CI95: 18-29)
and that of meat prepared at barbeque, grill or microwave oven seems slightly higher as well (20%). The role of anti acid-secretory drugs is even larger for getting an infection with C. coli as for C. jejuni (PAR=19%, respectively 9%) Other risk factors for infection with C. coli are food bought at a stall (10%); swimming (17%) and game (5%) and tripe (4%). Ownership of cat or dog or a small kitchen dresser, were significant in the univariate analysis only. A ‘one-sided diet’ comes out as an important risk factor as well for illness due to a C. coli infection. Except for the consumption of chicken, it seems as if potential risk factors for C. coli
appeared more clearly and larger as for C. jejuni. Note, that this is true notwithstanding the fact that the number of C. coli cases is 1/12 that of C. jejuni. This might support the notion of the role of immunity. Exposure to C. coli is assumed to be considerably less frequent than for
C. jejuni, and acquired immunity consequently lower. This may explain why swimming
water comes out so clearly as a risk factor for C. coli and not for C. jejuni. Less immunity to infections with C. coli might also explain why anti acid-secretory drugs contributed
significantly more to C. coli than to C. jejuni infections.
2.2
Estimation of the relative importance of Campylobacter
transmission routes based on exposure assessment
This chapter is based for the main part on a previous report in Dutch, which was written for the CARMA project (Evers et al. 2004).
2.2.1 Introduction and objective
To attribute human campylobacteriosis to different sources and transmission routes, epidemiological methods have mainly been used (See 2.1). Worldwide, a number of case-control studies have been carried out, and many sources have been identified. However, the sources and attributable fractions identified in these studies may differ or may even be conflicting. Some studies, for example, have identified the consumption of chicken meat as a risk factor, whereas other studies have identified this as a protective factor. In case of
Campylobacter the epidemiological approach suffers from low numbers of observations and the absence of one dominant risk factor. Due to a lack of cases in studies addressing the general population the larger case-control studies are laboratory-driven. These enrolled cases are strongly selected with respect to severity or duration of the disease, which in turn is related to age. Selection may also be involved with respect to genetic susceptibility, general health status, medication (anti acid-secretory drugs) and life style.
An alternative method for source attribution is based on risk assessment techniques. With this method, the relative importance of transmission routes is determined by estimating the human
exposure via each of these routes. This new approach is explored here. By using human exposure to Campylobacter as an endpoint, we assume implicitly that the effect of exposure (described by the dose-response relationship) is independent of the route. This alternative method may improve insight as obtained by the traditional epidemiological approach, and will show gaps of knowledge.
2.2.2 Method
Transmission routes
We considered three categories of transmission routes: consumption of food; direct contact with animals; and water. In more detail:
− Consumption of food (raw or prepared): chicken fillet, chicken other, turkey, pig, cattle, milk, sheep, fish from aquaculture, fish from fisheries, shellfish, crustaceans, vegetables, soft fruit, and firm fruit (19 routes in total);
− Direct contact with animals: pet animals (cat, dog, rabbit and small rodents), farm animals (cattle, pig, poultry, goat and sheep) and city farm (also called petting zoo) animals (9 routes in total);
− Water: swimming in indoor pools, swimming in recreational water, consumption of drinking water (3 routes in total).
Foreign travel was not incorporated. It was known that travelling is associated with increased risk of campylobacteriosis. However, calculations of the exposure due to travelling is not feasible due to the large variation in the contamination of possible reservoirs and in the hygiene behaviour of travellers.
Calculation scheme and output
The output of the calculations is the exposure which is expressed as the mean number of campylobacters ingested per person per day, averaged over the whole Dutch human
population. This is calculated per transmission route. The exposure is thus considered at the population level and not per exposure event.
The calculation schemes differ somewhat between categories and transmission routes. One example per transmission route is given below.
For transmission via food consumption, multiply:
- gram food consumed per person per day (population mean); - fraction contaminated products in retail;
- Campylobacter concentration (number/g) in contaminated products in retail; - fraction cross-contamination, in case of preparation.
Raw products are consumed raw, i.e. the product is not heated at any point in time between slaughter and consumption. For raw products, all campylobacters are assumed to survive. Prepared products are heated sometime between slaughter and consumption. If prepared, it is assumed that 0% of the campylobacters survive and transmission is then entirely assigned to cross-contamination prior to preparation. So it is assumed that undercooking can be
For city farms, an example for the direct contact category, multiply: - number of visitors per day;
- 1/(number of inhabitants in the Netherlands); - fraction of contaminated animals;
- number of contacts with animals per person per day in these farms; - probability of contact with faeces given contact with animals; - gram faeces ingested per faeces-contact;
- Campylobacter concentration (number/g) in contaminated faeces.
We account for the different animal species in city farms by using weighted (according to fraction of total animal population per species) mean values for prevalence and concentration. For recreational water, an example for the water category, we distinguished two age
categories (≤ 12 years and >12 years of age) that differ in visiting frequency and water intake. Multiply:
− fraction of the population in the age category;
− visiting frequency (number of visits per person per day); − water intake (litre per visit);
− Campylobacter concentration in the water (number per litre).
The result of this multiplication is added for both age categories to arrive at the mean exposure for the whole Dutch population.
Uncertainty
The calculations are done with point estimates for the parameters: estimates of mean values for a whole year for the whole of the Netherlands. In this study we only consider the
uncertainty in these point estimates. This excludes variability between persons, time and place (e.g. in amounts consumed and prevalences). In the base scenario, we used PERT distributions (see Vose (2000)) for the uncertainty of the point estimates, described by the most likely, minimum and maximum values. In this study, the most likely value is always taken halfway the minimum and maximum value, which implies it is also the mean and the median value. Data are interpreted as the median value of the mean. The uncertainty of the mean is described on absolute or log scale depending on the specific parameter. This is determined by the nature of the measurements, the research field and the size of the uncertainty. Further, in general the uncertainty is taken larger when less data are available and the size of the uncertainty is taken analogous between categories for a specific parameter. To investigate the effect of the chosen base scenario, two alternative scenarios were evaluated also. These are, first, increased uncertainty ranges (doubled for absolute ranges, multiplied by ten for log ranges) and second, use a uniform distribution instead of a PERT distribution.
Calculations
The calculations were done with Monte Carlo simulation: multiply samples from probability density functions that represent the uncertainty of the mean values of the parameters,
Add-inn of Excel), using 10,000 iterations per simulation. This proved to give satisfactory convergence.
2.2.3 Data
Obtaining data proved to be difficult: much information is lacking. When available, literature or other data were used, but for a part of the parameters, rough estimates not based on data had to be used. The estimated uncertainty, especially of the last mentioned category of
parameters, is large. The situation is relatively good for the water transmission routes. Below, the most uncertain parameters are given. Main bottlenecks are, for food routes:
- Campylobacter concentration in food (few studies are available on counts); - probability of cross-contamination (based on only two modelling studies on
Campylobacter and Salmonella on chicken);
- consumption of raw food (the National Food Consumption Surveys are large studies, but in these studies the information on preparation of food is poor);
and, for direct contact with animals:
- contact frequency with animals (rough estimate);
- probability of contact with faeces given contact (rough estimate); - amount of ingested faeces (rough estimate);
- concentration of Campylobacter in faeces (limited data availability of counts); The parameters that especially determine the estimated exposure, as found by simple regression analysis of model output as a function of each parameter separately, are the probability of cross-contamination, the consumption of raw food, the probability of contact with faeces given contact and the amount of ingested faeces.
2.2.4 Results
The results for the base scenario are shown in table 2.3 and fig 2.1. The width of the resulting 95% confidence intervals for the endpoint is usually a factor 100 to 1000. This large
uncertainty implies that in most cases it is not possible to draw conclusions on differences in exposure between transmission routes. Fig 2.1 shows that this analysis did not yield a limited set of dominant transmission routes.
The top 5 of transmission routes is formed by city farm, chicken other (=non-fillet chicken) raw, milk raw, farm animal – goat and sheep and farm animal - poultry. The direct contact routes show a relatively high exposure, especially city farm and farm animals. Pet animals show a moderate score compared to all other routes. For water routes, only recreational water shows a rather high exposure. Within the food routes, raw products usually show higher exposure than prepared products. The four foods with highest exposure are all raw. Then going further down the exposure list, raw and prepared products alternate, but the six foods with lowest exposure are all prepared products. The two prepared foods with highest exposure are chicken-other and chicken fillet.
The routes with highest exposure are all raw foods and direct contact routes. Only after that we find other types: recreational water and prepared food (chicken-other). The three
1.E-10 1.E-08 1.E-06 1.E-04 1.E-02 1.E+00 indo or p ool fish aq uacu lture pre pared shee p pre pare d cattle p repare d vege table s pre pare d pig p repa red crus tace an pr epar ed shell fish raw drinkin g wa ter p.a. small rode nt fish f isher ies p repar ed turk ey p repar ed p.a. rabbi t shell fish p repa red cattle raw p.a. c at firm fru it rawf.a. pig chick en file t pre pare d soft fru it raw chick en ot her pre pared p.a. dog recrea tiona l wa ter veget ables r aw f.a. c attle fish fi sheri es raw f.a. p oultry f.a. goa t&she ep milk r aw chicke n oth er ra w city fa rm Transmission route Me an Cam p yl oba cte r in ge st ion, ce lls per per so n p er day
Figure 2.1. Mean ingestion (median and 95% confidence interval) as a function of transmission route, with parameter uncertainties according to the base scenario.
(table 2.3). The result of this will be determined mainly by the routes with highest exposure. This results in the following (campylobacters pppd):
water: 1.48 x 10⁻³ (= recreational water) food: 4.96 x 10⁻²
direct contact: 8.37 x 10⁻²
Table 2.3 Calculated mean ingestion of Campylobacter for the various transmission routes using point estimates for the parameter values.
Transmission route Mean ingestion (number pppd) Indoor swimming pool 1.03E-08 Fish aquaculture prepared 9.26E-08
Sheep prepared 1.98E-07
Cattle prepared 2.98E-06
Vegetables prepared 3.03E-06
Pig prepared 3.86E-06
Crustacean prepared 4.97E-06
Shellfish raw 5.16E-06
Drinking water 5.26E-06
Pet animal small rodent 8.70E-06 Fish fisheries prepared 1.08E-05
Pet animal rabbit 1.74E-05
Turkey prepared 1.76E-05
Shellfish prepared 2.53E-05
Cattle raw 1.90E-04
Pet animal cat 2.18E-04
Firm fruit raw 2.53E-04
Farm animal pig 9.16E-04
Chicken fillet prepared 9.45E-04
Soft fruit raw 1.05E-03
Chicken other prepared 1.39E-03
Recreational water 1.48E-03
Pet animal dog 1.50E-03
Vegetables raw 2.82E-03
Farm animal cattle 7.56E-03
Fish fisheries raw 8.86E-03
Farm animal poultry 1.24E-02 Farm animal goat + sheep 1.30E-02
Milk raw 1.67E-02
Chicken other raw 1.73E-02
0.0015
0.050
0.084
water
food
direct
contact
Figure 2.2. Accumulated mean ingestion (no. of campylobacters ingested per person per day) per category of transmission routes.
So exposure by water plays a minor role and exposure by direct contact (approximately 2/3 of total exposure) is more important than by food (about 1/3) (fig 2.2). The sum of all means equals an exposure of 0.135 campylobacters pppd.
The alternative scenarios give little change in what was concluded above. The medians of the mean exposure values are theoretically equal, however the numeric simulation procedure gives minor deviations. The larger uncertainty of the parameters in the alternative scenarios result in even larger confidence intervals for the exposure than found for the base scenario. To illustrate this, in the base scenario 14 routes have confidence intervals that do not overlap with the city farm confidence interval. For the scenarios with increased uncertainty ranges and uniform distributions these numbers are 7 and 5, respectively. So with the alternative scenarios even less can be concluded on differences in exposure between transmission routes. In order to determine which parameters determine most the model output (the exposure), we performed a simple linear regression analysis of model output as a function of each of the parameters. The coefficient of determination (r2) was used as measure. This shows that for food routes, survival is the most important parameter which implies it is important to know whether a product is consumed raw or prepared. For direct contact routes, the amount of faeces ingested per faeces-contact and somewhat less the probability of contact with faeces given contact and the fraction of the human population that is at risk, are the important parameters. For water routes, the effect of treatment is the most important parameter. Although the present model is an exposure model, one is tempted to make a simple
calculation of the number of human cases of infection based on the estimated exposure, using a dose-response relationship. For this, the Beta-Poisson model was used:
Pinf, day = 1-(1+µ/β)-α
with Pinf,day the probability of infection per day, µ the dose and α en β parameters. Teunis and
in a value for Pinf, day of 2.55 x 10⁻³ pppd. The probability of 1 or more infections per person
per year equals:
Pinf, year = 1 - (1 - Pinf, day)365
This gives Pinf, year = 0.606. The estimated number of cases of infection with Campylobacter
per year for the whole Dutch population according to the exposure model in combination with the dose-response relationship then equals 0.606 * 16 x 106 = 9.70 x 10⁶. A reasonable estimate is that the number of cases of disease is about equal to 1/3, i.e. 3.2 x 10⁶, of the
number of cases of infection (Havelaar et al. (2000), footnote page 15). Based on
epidemiological data the estimated number of gastro-enteritis cases in the Netherlands per year by Campylobacter is equal to 107,000 (De Wit et al. 2001). So the risk assessment model appears to give a severe overestimation of the number of cases of campylobacteriosis, although it must be kept in mind that the exposure model, the dose-response relationship and the epidemiological estimate are all uncertain. This observation is discussed in 2.3.1.
2.3
Exposure assessment versus epidemiology
Both the exposure assessment and the case-control study have estimated the number of campylobacter cases in the Dutch general population and the relative importance of different
transmission routes. It is interesting to discuss the discrepancies of the two approaches on these points. First, the number of campylobacter cases predicted by exposure assessment is much higher than estimated in epidemiological studies in the general population. In fact at the selection level that case-control studies are performed (positive cases from routine laboratory practices) the number of campylobacter cases in the Netherlands is another 17-19 times lower as estimated in the general population. Second, given the difference in estimated cases, it still is interesting to compare the relative importance of transmission routes as estimated by epidemiological analysis (2.1) and exposure estimates (2.2) and attempt to explain the differences.
2.3.1 Number of predicted campylobacter cases
A number of explanations can be given for the difference between the estimated number of symptomatic cases by exposure assessment (3.2 million) and in epidemiological studies in the general population (107,000), see 2.2.4.
Clustering
Exposure is clustered for a part of the transmission routes. For example, contact with farm animals is typical for farmers, abattoir personnel etc., but not for the general population. Also, some people will tend to drink raw milk regularly, whereas others may never do so. If we would take this into account, the non-linear shape of the dose-response relationship, especially the levelling off at high doses, might result in a lower estimate of the total number of cases of infection and illness.
Immunity
Exposure, especially clustering of exposure, may lead to some degree of immunity. This may significantly influence the effect of exposure: (partly) immune persons may have a much lower probability to become infected or ill. Preliminary modelling work on immunity shows that the calculated incidence is much lower when immunity protects against re-infection or illness for a number of years. It also was found that case control research can be strongly disturbed by the occurrence of immunity as well.
Immunity might e.g. play a role in the transmission routes pet animals and farm animals, chicken other raw and raw milk. The last two routes combine a high mean exposure for the whole population with a limited number of consumers. When these ‘immunity’-routes are subtracted from the total exposure, then the mean exposure left over is 6.51 x 10⁻²
campylobacters pppd. The number of campylobacter infection cases in the Netherlands per year according to the model and the dose-response relationship then becomes 5.82 x 10⁶, 40 % lower than the previous estimate.
It must be noted that if the first time of an exposure leads to disease severe enough to be enrolled in a laboratory-driven case-control study, the risk factor involved should have been found in such a study. In a general population study that catches only a few cases they may easily be missed. But if the first clustered exposure is more probable to occur in young healthy persons with a high resistance (although not yet immune) it may not lead to disease severe enough to appear as a case in a laboratory-driven case-control study but at the same time would cause some degree of immunity protecting at an older age.
Variable dose instead of mean dose
The output of the exposure model is the mean ingested number of campylobacters per person per day, for the whole Dutch population. This number was used as input for the
dose-response relationship. In a more proper way, attention should be given to the variability of the size of the dose that is ingested by people: variability between days, people, place. This variability should in general be described by probability density functions, and samples from these distributions are each by each input for the dose-response relationship. The clustering mentioned above is one aspect of this variability. It is not immediately clear what is the effect of including this variability of the dose on the estimated number of cases of infection.
The dose-response relationship
Dose-response models may overestimate the risk of infection and illness if based on data from outbreaks or from volunteer experiments with a proven pathogenic strain (which is the case in the exposure study of Black et al. (1988). It might well be that a substantial proportion of naturally circulating strains is not or much less pathogenic. Moreover, theoretically,
differences in effects of the matrix in which the campylobacters reside, or even genetic host differences may play a role as well. Theoretically this may have a huge influence on the risk estimates.
Exposure estimates
The exposure estimates are generally very uncertain, due to limited data availability. In addition there is no objective theoretical framework to describe this uncertainty. Therefore an overestimation of exposure is possible.
Epidemiological incidence estimate
The epidemiological derived estimate of the incidence of campylobacteriosis in the general population is highly uncertain (20.000-160.000 cases per year in the whole of the
Netherlands). Uncertain, but still the upper limit is much smaller than computed straightforward from the exposure estimates. Case definition, focused on acute
gastroenteritis, sample storage and culturing may add to an underestimation of the real incidence of all symptomatic cases, including those with mild symptoms or chronic sequelae. An important part of clinical cases of GBS and reactive arthritis caused by campylobacter would not have been identified by the standard case definitions used for a symptomatic (acute) gastro-enteritis and is even often asymptomatic directly after infection.
2.3.2 Relative importance of transmission routes
In this section the relative importance of transmission routes as indicated by the CaSa study and the exposure study will be compared. Attention will be given to differences in the setup of the studies and to similarities and differences in the estimated importance of transmission routes. In the comparison we will mainly concentrate on the C. jejuni PARs. In table 2.4 results from both studies are brought into one table. In this table, the group ranking from top to bottom is determined in the first instance by the epidemiological categories with
significant PARs and the remaining groups are ranked according to the exposure study.
Aspects that make a comparison difficult
When comparing the results of the epidemiological CaSa study with the exposure model, a number of differences are found between these studies that make a comparison difficult. In general, typical differences in the epidemiological study with the factors considered in the exposure estimation are questions related to food preparation, storing and kitchen hygiene; place of consumption (at home or elsewhere); living conditions; age of pets; profession-related contact with animals, food or infected people; family composition; living conditions and proxies of behaviour and susceptibility as age, sex and socio-economic status. Some aspects in more detail:
- One starting point in the exposure model is that undercooking of food plays a negligible role in transmission. When prepared (heated), all transmission takes place by cross-contamination before preparation. The raw food that is consumed, is food that is left unheated on purpose (e.g. chicken liver, steak tartare). In CaSa, there are categories like ‘undercooked meat’, ‘meat prepared at barbeque, grill, microwave’, and ‘undercooked seafood’. This makes a comparison difficult.
- In the exposure model, some foods are divided in more categories than were found statistically significant in the CaSa model: e.g. on the one hand ‘sheep’, ‘cattle’,
‘turkey’ and ‘pig’ in the exposure model and on the other hand ‘meat’ in the final CaSa model; ‘chicken fillet prepared’, ‘chicken other raw’ and ‘chicken other prepared’ in the exposure model versus ‘chicken’ in the final CaSa model.
- There are a number of categories that are investigated in the CaSa study and not in the exposure model: game, tripe, eating in a restaurant, food bought at stall, contact with persons with symptoms outside the household, occupational exposure to raw meat (as a cook or as a butcher) and anti-acid secretory drugs (proton pump inhibitors and H2
-antagonists).
- The exposure model considers C. spp. As a whole, while in CaSa C. jejuni and C. coli are distinguished.
Comparing major categories
In the exposure model the categories food, direct contact and water were accumulated and compared as a whole. The conclusion was that only food and direct contact are important; direct contact is more important than food (fig 2.2). The role of water is not clear as well in the CaSa study (C. jejuni vs. C. coli), but obviously food is more important than direct contact.
Chicken
Chicken is in the CaSa study by far the route with the highest PAR. In the exposure study chicken (or any route) is not much higher than the other routes. It is in second place in this study in the form of ‘chicken other raw’ and it is also noticeable that ‘chicken other prepared’ is the prepared food with the highest exposure. If we suggest immunity to play a role, the ‘regular’ exposure to chicken is not expected to be as high in the CaSa study as it is. In fact several other case-control studies show chicken eating at home even to be ‘protective’. It is relevant to note that chicken is not a statistically significant risk factor for a C. coli infection although C. coli and C. jejuni occur in a proportion of 30/70 in chicken. It may be that C. coli does not survive as well as C. jejuni. Moreover, we suggested above that the lower exposition in general to C. coli would make the role of immunity for C. coli less important than for
C. jejuni. One suggestion might be that imported chicken meat poses a higher risk for
infection, e.g. as no ‘regular’ strains are involved. However we should realise that almost everybody eats chicken, so that with a low OR of 1.4 the PAR is still considerable, but with a large confidence interval. One reason that an OR of 1.4 was found significant is that the CaSa study is one of the largest case-control studies ever on campylobacter.
Non chicken meat
The consumption of meat excluding chicken (i.e. cattle, sheep, turkey, pig) plays a minor role according to the exposure model. This agrees with the not significant PAR for ‘meat, not chicken’. The high PAR values found for barbecue/grill/microwave and undercooked meat contradict the assumption of the exposure study that transmission through undercooking can be neglected and/or the implicit assumption (as no separate route barbecue is distinguished) that the probability of cross-contamination with barbecuing is not higher than with other food preparation methods.
Direct contact
The importance of direct contact with dogs and cats and the minor importance of direct contact with other pets (e.g. rabbits, small rodents) was found in both studies. However, although in the exposure study direct contact via city farms and farm animals (goat & sheep, poultry, cattle and to a lesser extent pig) are among the most important routes, these routes are not significant in the final multivariate model in the CaSa study. In the multivariate model risk factors are combined that have an independent contribution to the risk of infection. For example, 80% of the enrolled infected farmers (and those among the controls) had cats and/or dogs. As ownership of cats and dogs is also a risk factor for non-farmers, the unique risk of farmers with respect to farm animals resolves in the multivariate model, but is univariately significant. Hence the epidemiological association with ownership of cats and dogs may very well be an overestimation of the direct causal relationship. It may be a proxy of a behaviour that involves a more frequent environmental contact as well. Indeed within the CaSa study in 90 instances Campylobacter was found in both the patient and in the faeces of their pet but in only 1 case the strains were genetically (AFLP) identical (preliminary results CaSa-study). To clarify this point it is necessary to do specific stratified analyses. Contact on city farms, were not asked for specifically in CaSa but were part of a question on ‘contact with animals outside the household’. Here also, ownership of cats and dogs may be a disturbing factor and further stratified analysis might be necessary.
Seafood
In the exposure model, ‘fish, fisheries raw’ (= herring) was important, whereas other fish categories were unimportant. In the CaSa study, the (partly similar) category ‘undercooked seafood (fish, shellfish/crustacean)’ was important, and regular fish consumption was ‘protective’.
Raw milk
In the exposure study, raw milk is no. 3 on the list, whereas it is not significant in the CaSa study. Raw milk outbreaks are especially related to young children. This clearly indicates that it is an important factor, but age-related development of immunity may play a role. Being focused on sporadic infections, the CaSa study does not indicate a significant contribution. Both immunity and lifestyle factors related to regular raw milk consumption might play a role. But then it must be assumed that a large part of these people developed immunity without first becoming a symptomatic case severe enough to end up in the laboratory surveillance.
Vegetables and fruit
In the exposure study, raw vegetables were among the higher exposures and soft and firm fruit showed a moderate exposure. These routes are protective in the CaSa study. A
‘protective’ role is also found for nuts, chocolate, dairy products, and fish. It must be noted that this large group of food products with a negative PAR can also be interpreted as a varied ‘healthy’ diet, as opposed to a one-sided diet hypothetically being a risk factor as a life-style
factor. Prepared vegetables play a minor role in the exposure study and are not included in the CaSa study.
Water
In the exposure study, swimming in recreational water was a moderately important transmission route. It was not significant for C. jejuni in the CaSa study, but a clear
contribution was found for C. coli. In this case immunity might play a role. The exposure to
C. coli can be considered as rare compared to C. jejuni and immunity might consequently be
higher for the latter microorganism. A moderate exposure may then lead to an infection with
C. coli but not with C. jejuni. The other transmission routes related to water (indoor pools,
drinking water) play a minor role in both studies.
Concluding remarks
It is known (especially from food consumption surveys) that the poor reproducibility in filling in questionnaires may strongly influence PAR estimates. If this bias is random, the relationship of the risk factors questioned with the outcome (disease) is weakened and OR values change to 1 and hence in an absolute sense, lowers the corresponding PAR. It also may influence the ranking and statistical significance of risk factors, especially if differences in accuracy of reporting between risk factors are considerable.
Due to the considerable uncertainties and the confounding effects of e.g. clustering of exposure and immunity, the use of exposure modelling for source attribution of
campylobacteriosis is limited. The results of case-control studies are likewise confounded. Crucial is the notion that exposure modelling works at the bottom of the surveillance
pyramid, whereas case-control studies focus on a subgroup of infected cases that in the case of CaSa are strongly selected with respect to severity. In this selection genetic susceptibility, general health, medication (anti acid-secretory drugs) and life-style are probably not similar to that for the average case in the general population. They may be more at risk to become symptomatically infected even at a low level of exposure. On the other end, mild or asymptomatic infection in response to a high level of exposure (without being partly immune) may occur in some professions that at the beginning of the career select young healthy persons that become (partly) immune afterwards. In the general population regular low exposure may lead to asymptomatic infection and the development of (partial) immunity protective for incidents of high exposure. Serology studies in the general population in
Wisconsin (Belongia et al. 2003) and preliminary results of a similar study on Campylobacter
jejuni-IgG in the Netherlands suggest that 2-3 million people are infected in such a way that
an IgG response is induced. This estimate is much closer to the 5.8-9.7 million cases with the exposure model and emphasizes the role of immunity in explaining the gap between exposure and epidemiological estimates.
Further understanding of the impact of these phenomena on risks of illness and infection is of critical importance for reliable attribution of risks to various sources. The results do
underline, however, that campylobacteriosis is a multi-source problem, and that preventive measures must be directed to all relevant sources.
Table 2.4 Calculated mean ingestion of Campylobacter spp. (Left) and epidemiologically measured significant population attributable risks (PARs) of C. jejuni and C. coli (Right: preliminary results), for the Netherlands.
A negative PAR would be protective. Rk = original ranking in exposure study; ns = not significant.
Transmission Route Ingestion (no. pppd)
Rk Category PAR(%)
C. jejuni
PAR(%)
C. coli
Chicken other raw 1.73E-02 2 Chicken other prep. 1.39E-03 11 Chicken fillet prep. 9.45E-04 13
Chicken 23% ns
Cattle raw 1.90E-04 17 Meat: bbq/grill/microwave 12% 20% Turkey prepared 1.76E-05 19 Undercooked meat 10% 25% Pig prepared 3.86E-06 26 ‘Meat’, not chicken ns ns
Cattle prepared 2.98E-06 28 Tripe ns 4%
Sheep prepared 1.98E-07 29 Pork/sausages, at home ns (-%?)
Game Ns 5%
Eating in a restaurant 11% ns Food bought at stall Ns 10% Use of anti acid-secretory
drugs 9% 19%
Pet animal: dog 1.50E-03 9 Ownership cat(s) 7% ns
P.a. cat 2.18E-04 16 Ownership dog(s) 6% ns
P.a. rabbit 1.74E-05 20 Ownership rabbit/ rodent ns ns P.a. small rodent 8.70E-06 22
Contact symptomatic
persons (outside household) 4% ns Occupat. exposure raw meat 2% ns
Fish fisheries raw 8.86E-03 6 Shellfish prep. 2.53E-05 18 Fish fisheries prep. 1.08E-05 21
Undercooked seafood (fish,
shellfish/crustacean) 4% ns
Shellfish raw 5.16E-06 24 Crustacean prep. 4.97E-06 25 Fish aqua prep. 9.26E-08 30
‘Fish’ (-%?) (-%?)
City farm 4.80E-02 1 City farms ns ns
Milk raw 1.67E-02 3 Raw milk ns (-%?)
F.a. goat + sheep 1.30E-02 4 F.a. poultry 1.24E-02 5 F.a. cattle 7.56E-03 7 Farm animal: pig 9.16E-04 14
Contact farm animals ns ns
Vegetables raw 2.82E-03 8
Vegetables prep. 3.03E-06 27 Raw vegetables (-%?) (-%?) Recreational water 1.48E-03 10
Indoor pool 1.03E-08 31 Recreational water Ns 17% Soft fruit raw 1.05E-03 12
Firm fruit raw 2.53E-04 15 Fruit (-%?) ns
3.
Risk Model
3.1
Methodology
3.1.1 Principle
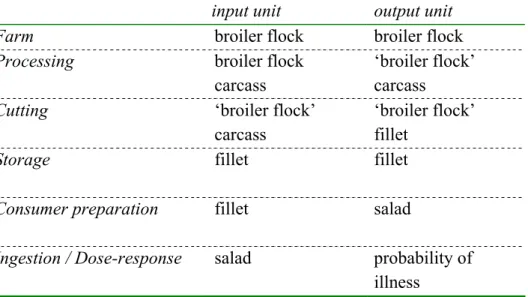
The risk model for Campylobacter in broiler chicken meat constructed for the CARMA project simulates the transmission of Campylobacter through the ‘farm to fork’ chain and assesses the consequences of human exposure. It follows the changes in the prevalence (frequency of units contaminated with campylobacter) and numbers of campylobacter in contaminated units from stage to stage over the chain. Here, the ‘unit’ is the potentially contaminated animal or food item, for example the carcass, the fillet or the bird exterior. At the stage of the ‘fork’, the model describes exposure as the prevalence of ingestion of a contaminated meal and the variability distribution of ingested numbers of campylobacters (doses). A dose-response model then predicts the frequency of infection and illness in the Dutch population in a year.
For the ‘farm to fork’ exposure modelling we apply the ‘Modular Process Risk Modelling’ methodology (MPRM) (Nauta 2001, Nauta 2002, Lindqvist et al. 2002, Nauta 2005). In this methodology, all relevant processes are described in terms of basic processes (bacterial processes growth and inactivation; food handling processes partitioning, mixing, cross-contamination and removal). This approach gives a clear structure of the food chain, and allows us to include the basic dynamics of the processes. The level of detail of these models depends on the relevance of the process step for the dynamics, the availability of data, and the specific risk management questions regarding this process step as considered in the analysis. In MPRM the first step is to consider the basic processes to model, and then to obtain the appropriate data. Within the basic process models non-linear effects that are considered important in the transmission dynamics are incorporated. Such effects can usually not be found from studying the data alone, but may be crucial when the effects of risk mitigation strategies are analysed with the model.
3.1.2 Uncertainty and variabilities
The constructed ‘farm to fork’ risk model is a stochastic quantitative microbiological risk assessment model. We use Monte Carlo simulation to incorporate the effects of uncertainty and variability in the analysis. For extensive discussion on this issue we refer to for example Vose (2000) and Nauta (2000). In the context of this report it is important to explain the various levels of uncertainty and variability that are dealt with in this study.
First, there is variability between birds within a flock. Quite often not the whole flock of birds is colonized, and the animal prevalence (the percentage of colonized birds) in a flock has a value between 0 and 100% (see also Katsma et al. (2005)). Moreover, also the level of campylobacter contamination on the birds’ exteriors and the concentration of campylobacter
in the gut will vary between birds in the flock. Such variability can be described by a probability distribution with one or a few parameters (e.g. a lognormal distribution).
Next, there is a variability between flocks reared and slaughtered in the Netherlands. Not only will some flocks contain colonized birds and some flocks none (i.e. the between-flock
prevalence lies between 0 and 100%), also the animal prevalence and the distribution of levels of campylobacter between birds in a flock will vary. Hence, to describe this variability, we need additional probability distributions of for example the animal prevalence and the means of the distributions describing the variability between birds.
Third, there is uncertainty. This uncertainty represents our lack of knowledge due to scarcity of data, imprecise methods of measurement, inadequate representativity of data, etc. Like variability, this uncertainty is often represented by probability distributions. A probability distribution may describe the uncertainty about the true value of a parameter, and also the uncertainty about the mean of a distribution describing variability.
As mixing uncertainty and variability may strongly affect the outcome of a risk assessment (see for an example Nauta (2000)), separation of these is important. For every distribution used in the risk model it should therefore be explicitly clear what it represents. This is not only the case for variability and uncertainty, but also for variability at different levels, like per bird or per flock.
It is not always possible to adequately describe the uncertainty in a probability distribution. If no or hardly any data are available, and even experts find it difficult to make an estimate, one may only have a ‘best guess’ or a ‘wild guess’ on hand. In such a case one can decide that the uncertainty is too indeterminate to be described with a probability distribution. An alternative is then to explore the impact of the uncertainty about this parameter by doing separate
alternative simulation runs with different values of this parameter in so called 'what-if' scenarios and compare the model outputs. The same procedure can be applied to simplifying assumptions in the risk model.
With variability at two levels and additional uncertainty, a ‘farm to fork’ risk model can easily become extremely complex. This was the case for the model developed for this study. Instead of a second order Monte Carlo, our analysis became third order and almost
intractable. In the final analysis we therefore choose to leave out the uncertainty as a
quantitative factor. Our approach was to first define a baseline model with most likely values for all parameters, including those describing the probability distributions for variability between birds in a flocks and variability between flocks. Next, in a set of alternative
scenarios, we evaluate the impact of the uncertainties in the model parameters and the model input.
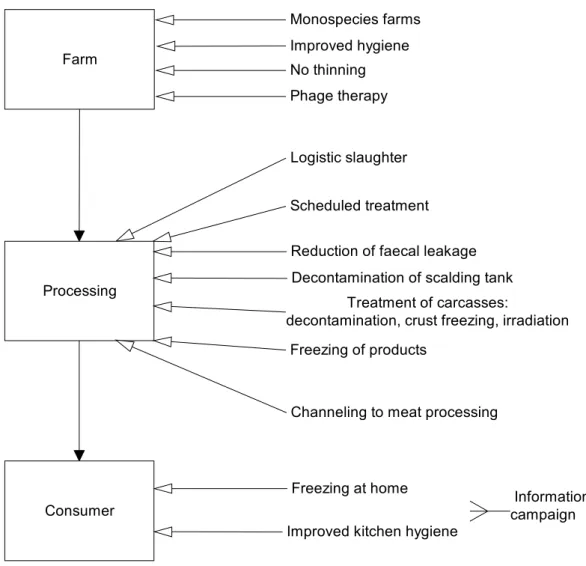
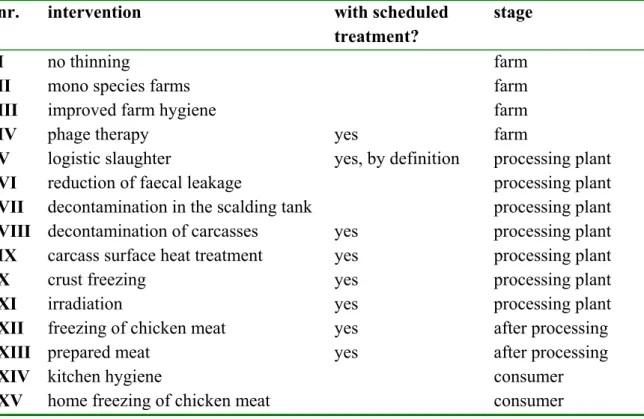
3.1.3 Interventions
The objective of the model is to evaluate and compare the effects of interventions to reduce the public health risks associated with campylobacter in broiler meat. This is done by comparing the baseline model results with results of model runs where the interventions are implemented in the model. For that purpose, the interventions proposed for evaluation by the