PBL-report
Integrated analysis of global
biomass flows in search of
the sustainable potential for
bioenergy production
G.J. van den Born, J.G. van Minnen, J.G.J. Olivier, J.P.M. Ros
contact gertjan.vandenborn@pbl.nl
November 2014
Bioenergy is increasingly becoming a prerequisite for achieving emission reduction targets for greenhouse gases and improving the security of energy supply worldwide. Many studies have assessed the potential to increase bioenergy, by assuming an overall increase in biomass production (up to 500 EJ by 2050). Our study identified the potential increase from an analysis of current and future efficiencies in using agricultural crops and residues, and wood for bioenergy, taking into account current biomass production levels, and the lifecycle phases of biomass products and waste flows.
The energy content of agricultural crops including residues produced worldwide is estimated at ~200 EJ, with grass and rangeland producing ~115 EJ, both mainly delivering inputs to the human food system. The net input is estimated at about 100 EJ yr-1, of which about 18 EJ originates from the livestock system. Only a small proportion of the primary production is used for the production of energy and
materials, and comes mostly from crops, such as sugarcane and corn. Only 5% of the energy content of crops and residues is used for bioenergy and materials (420 Mt ~11 EJ). However, use of unused and burned crop residues would add ~24 EJ for
bioenergy and materials production. This would increase the proportion from 5% to 17% of the energy content from crops and residues used in bioenergy and material production. The assumptions included sustainable soil carbon management (roughly half of the aboveground carbon remains on the soil).
Other potential energy sources are improved use of waste flows from industrial processes and consumption, and would provide an additional ~21 EJ, adding ~56 EJ or 18% of the energy content of the total agricultural production worldwide (crops, residues and grasslands).
Analysis of the wood cycle indicated that about 2700 Mt yr-1 or ~49 EJ yr-1 annually is used as fuelwood. This is considerably more than used for other purposes, such as timber products and paper (965 Mt yr-1 or 17 EJ yr-1) and forest residues (average 960 Mt or ~17 EJ). Nevertheless, there is potential to increase the availability of wooded biomass by using current flows more efficiently, even when sustainability concerns are taken into account. This can be done by using a part of the primary forest residues left in the forest (globally ~17 EJ yr-1). Furthermore, about 100 Mt or ~2 EJ yr-1 of wooded products end up in landfill but are potentially useable for bioenergy. This quantity could increase considerably in the coming decades (2 to 10 EJ) because the stock of timber products is increasing ( ~15 EJ is produced and ~7 EJ is waste).
The potential for bioenergy can be increased by 63 EJ/yr-1 by using current flows more efficiently through optimized collection and conversion and would more than double current global bioenergy supply. However, crucial to utilising this additional potential biomass source is whether it can be collected and transported to meet geographical differences in supply and demand, and to enable large-scale processing in combination with carbon capture and storage, and re-use. There is potential crop and residue for biomass worldwide, with largest wood potential in developing countries.
1 Introduction
With the transition to a low-carbon economy, the proportion of renewable energy With the transition to a low-carbon economy, the proportion of renewable energy sources is increasing, with attention to availability of sustainable biomass supplies. Since the 1990s, many biomass initiatives have been started worldwide to produce bioenergy, especially from dedicated crops, agricultural residues and forestry. This has triggered discussion on the sustainability of bioenergy, and particularly the indirect impact of biofuels on land use change. This study analysed global biomass flows in order to assess the sustainable potential for bioenergy production, and focused on residues from agriculture and forestry.
Increasing attention to sustainable use of biomass is reflected in research and policy plans developed in various countries worldwide. For example, EU Member States have indicated that almost 10% of the total gross final-energy consumption in the EU in 2020 should come from biomass. This represents more than half of all renewable energy sources (Elbersen et al, 2013). In the USA, the Department of Energy, investigated ‘A Billion Ton’ biomass supply for bioenergy and bioproduct industry (ORNL, 2011). In the long term, the targets for further decreasing greenhouse gas emissions will lead to further increase in this demand.
Multiple scenario studies have shown the potential increase in biomass production by assuming an increase in production area and intensification of cultivation processes (Hoogwijk, 2005; Smeets et al., 2007; Dornburg et al., 2010). These studies show a wide variation in future potential of as much as 500 EJ/yr. Our study assessed current use of biomass and biomass products in order to assess how biomass resources are used and the scope for increasing the potential for bioenergy, which is expected to offer more sustainable production of biomass. Sustainability criteria were considered including soil organic matter content in managed soils.
A distinction was made between biomass from agriculture and forestry. Aquatic
biomass was not considered. Agricultural biomass was divided into crops and residues (food, feed, fodder, energy and materials) and livestock (meat, dairy products, fat, energy and materials, excluding fisheries). Forestry biomass was divided into industrial roundwood (for construction, furniture and paper) and fuelwood. Flows of these sources were assessed including conversion to wood products, edible human food, animal feed products, biomass fuels and processed biomass, and use and consumption as food, fuel or material by human and animals. As the potential for bioenergy was assessed, quantities are expressed in weight (tonnes of biomass in dry matter) and energy content (PJ).
2 Materials and methods
2.1 Agricultural products
To assess the efficiency and scope for expanding biomass from current arable land, grassland, rangeland and livestock, the analysis included uses, residues and by-products, waste flows and flow to the soil. Crops were selected that are produced in very large quantities worldwide. Crop yield, use and residues (food, feed, energy and materials) and soil management are largely determined by agro-ecological soil
conditions as well as management (low and high input agriculture), economics and policies. For the assessment of the biomass production from grasslands and rangelands, the roughage intake of ruminants was used to estimate current production.
The main source of information was the FAO statistics (FAOSTAT, 2013). These statistics are suitable for assessing crop and livestock production and consumption, but do not or only partly cover production of grasslands, residues (straw, stover, leaves), by-products (such as, distillers dried grains with solubles, cakes) and waste streams. Missing information was supplemented from literature. Of particular
relevance are the ratios of crop yield to residue, which are crop-specific and affected by biophysical conditions and management level. For example, short-straw wheat varieties grown in Europe produce relatively less straw per ton of grain than do long-straw species grown in Africa. In addition, local issues determine the future potential, for instance, labour versus mechanisation on sugarcane plantations, and lack of adequate infrastructure.
As production levels of grasslands and rangelands are highly uncertain, two methods were used to estimate the bandwidth of global grassland and rangeland production. The first method was based on FAO data on pasture area (FAO, 2008) and rough estimates of grass production. The second method was based on the theoretical grass consumption of ruminants, such as cattle, buffalo, mules, asses and camels.
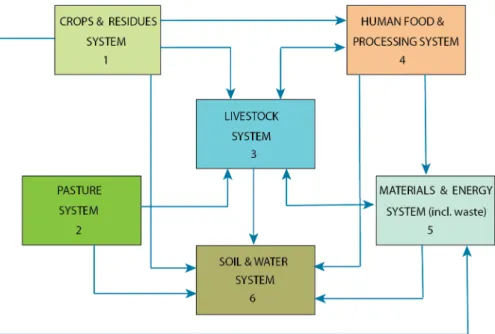
To structure biomass flows, six systems were distinguished, which together represent production, use, flows and interlinkages (Figure 2.1). The first three systems cover the total production of the crop and residue system including by-products (1), the pasture system covering natural and cultivated grasslands and rangelands (2), and the
Figure 2.1. Agricultural biomass chain and flow
The selected crops (some of which are clustered) were maize, rice, other cereals (such as wheat, barley), sugarcane, soybean, other oil crops, fruits and vegetables, roots and tubers, and sugar beet. These crops account for 94% of global biomass crop production, and those not included were treated as one cluster. Production from grasslands was based on the roughage intake of ruminants (cattle, buffalo, mules, asses, camels, sheep and goats). All animal categories were considered in calculating meat, milk, fat, bones, skins and manure production from livestock (FAOSTAT, 2013). Crop production, grasslands and livestock grazing are closely linked and partly
interdependent, with some food crops used for both food and feed, crops residues used for feed and stock bedding, and manure to fertilise the soil used for crop production.
The most direct link to the human food and processing system (4) is the consumption of vegetal products. The production of animal products (meat, milk) indirectly requires vegetal inputs and more resources to produce a similar amount of food compared to the vegetal chain (in caloric and nutritional terms). However, traditional livestock systems valorise biomass that is not suitable for direct human consumption (grasses, residues, waste) and use land less suitable for crop production (too wet and too dry grasslands). Modern livestock systems also use concentrates (high protein inputs) as feed.
The energy and materials system (5) covers the use of dedicated agricultural crops, crop residues, waste from livestock and from human food consumption to produce bioenergy and biomaterials. In the last 10 to 15 years, production of bioethanol and biodiesel (first and second generation) and new materials (such as bioplastics) has increased worldwide (BP, 2012; European Bioplastics, 2013). Because of the close relationships between the systems, worldwide increase in demand for biomass has had impact on all systems, including land use and price.
The soil and water system (6) is essential for agriculture. This requires soil management based on long-term sustainability, including sufficient nutrients and
organic matter, the latter is often discussed in relation to use of biomass for bioenergy and biomaterials.
2.2 Wood
Wood is harvested from natural and semi-natural forests and timber plantations, by either clear-cut or selected logging. The timber is used for wood products, such as saw logs, and paper and pulp, and as an energy source for heating, cooking and power generation. Many forests have been used for timber for considerable periods of time, and forest plantations are increasing in importance for timber production.
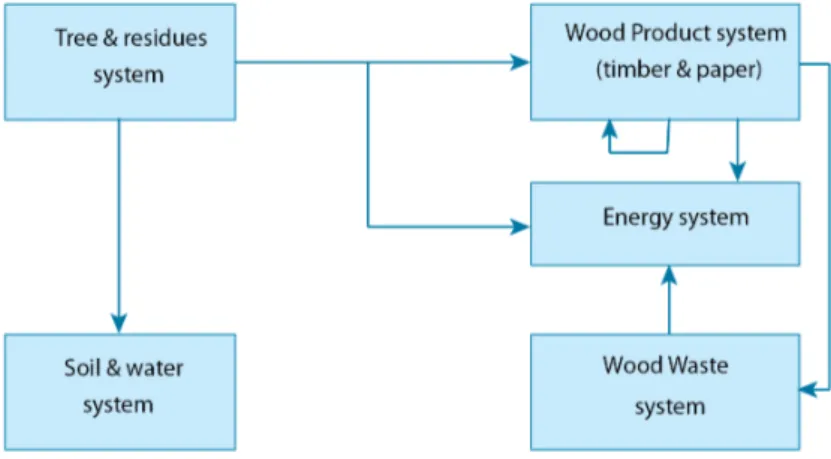
As in agriculture, different systems were distinguished to enable systematic assessment of woody biomass flows, production and allocation chain (energy and material), and the link with soil (residues). Five systems are distinguished (Figure 2.2). The tree harvesting system (1) includes the different tree compartments (trunks, branches, leaves and roots) and primary residues, which is left in the wood in many cases but might be used more. The soil and water systems (2) supply nutrients and water to the trees. They are partly dependent on the input of primary residues as well as the biodiversity of a forest is. The wood is used as a material in the wood product or material system (3). In this way wood is stored within our society for a period ranging from less than a year to more than 100 years. Wood can also be used as an energy source directly in the energy system (4). Wooded biomass is used for heating, cooking and power generation. Finally, the wood waste system (5) receives the output of the material system, and collects and converts in into an input for the energy system.
ForeSTAT dataset was the primary data source for quantifying wood product/timber production flows (FAOSTAT, 2013). Industrial roundwood was divided into saw logs and veneer logs, pulp and paper wood, and fuelwood (energy system). These
production data are reported in volume units (m3) biomass, separately for coniferous and non-coniferous wood, and include estimated unrecorded volumes, particularly
Figure 2.2. Wood biomass chain and flow
informal fuelwood collection. Subsequent products in the datasets are reported in mass units (tonnes) and comprise saw mill products and paper mill inputs and products.
These FAO statistics cover most of the wood extraction and biomass depletion from forests. However, assessment of all man-related depletion processes has shown five areas not fully covered in the FAO statistics. For most of these data gaps,
supplementary data is used:
• Fuelwood collection is underreported in FAO statistics according to national energy statistics. Estimates for fuelwood use included in energy statistics (based on
knowledge of the extent to which households require fuelwood and charcoal) are generally more accurate than the numbers collected or estimated by forestry-related experts. Data from the International Energy Agency (IEA, 2012) were used to estimate non-FAO fuelwood production, which was shown to be a substantial proportion of about 40% of total fuelwood consumption.
• Illegal logging is not captured in the national statistics provided to FAO (Nellemann & Interpol, 2012). Many wild estimates are made. The mid-point estimates made by UNEP were used because they also provide country-level estimates (Nellemann and Interpol, 2012). These estimates are 25% higher than total global extraction of industrial roundwood extraction made by FAO, which is significant but highly uncertain.
• Primary residues or remaining biomass not harvested (branches and leaves; non-harvested, dying trees after selective logging or after slash/burn) flow from the tree system into the soil and water system. Estimates of the proportion of non-harvest biomass vary considerably in the literature, largely because of differences in practice (EUwood, 2012). For example, in selective logging, a substantial number of trees are damaged in locating and removing selected trees from the forest. FAO estimates have been used in many research projects to quantify primary residues.
• In addition to forests and other forested land, other sources of biomass are pruning waste from public parks, private gardens and yards, biomass products disposed of as municipal solid waste (MSW), particularly food, paper and cardboard, wood, garden, and some textiles, and industrial waste, and products made from this waste, such as compost, recycled paper and cardboard, and biogas from landfills.
3 Materials and methods Major biomass sources
and applications in 2010
3.1 Biomass from the agro complex
3.1.1 Arable crops: current biomass production
Biomass production from selected crops was assessed using parameters to estimate residues, crop use and residues, and flows between systems (see Section 2.1). The results are presented in Table 3.1.
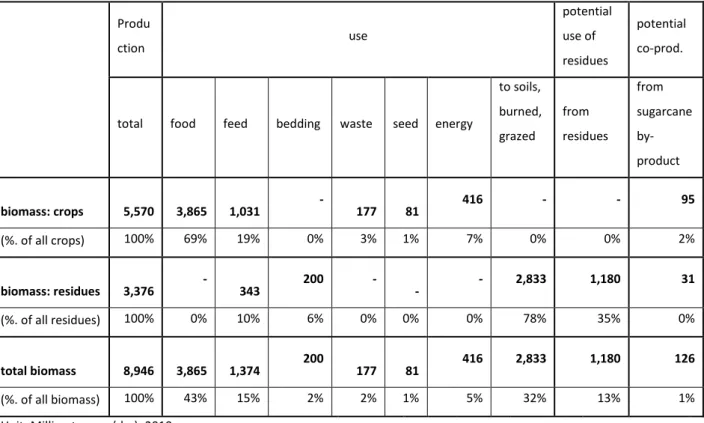
Table 3.1. Production, use and potential and relative proportion of crops and residues
Produ ction use potential use of residues potential co-prod.
total food feed bedding waste seed energy
to soils, burned, grazed from residues from sugarcane by-product biomass: crops 5,570 3,865 1,031 - 177 81 416 - - 95 (%. of all crops) 100% 69% 19% 0% 3% 1% 7% 0% 0% 2% biomass: residues 3,376 - 343 200 - - - 2,833 1,180 31 (%. of all residues) 100% 0% 10% 6% 0% 0% 0% 78% 35% 0% total biomass 8,946 3,865 1,374 200 177 81 416 2,833 1,180 126 (%. of all biomass) 100% 43% 15% 2% 2% 1% 5% 32% 13% 1%
Unit: Million tonnes (dm), 2010
Selected crops
Corn: The ratio of stover to grain is estimated at 1.15 and to sustain soil quality, the residue remaining on the soil is estimated at 60% (Kim & Dale, 2004). Corn is used for feed (55%) and for food (20%), and also for materials and energy. Corn stover residues are used for grazing livestock. Currently in the USA, most corn residues are un-used.
Rice paddy: The proportions of paddy rice are 70% rice grain, 20% husk and 10% bran (IRRI, 2013). The rice grain is used for food, the husk is partly used for
materials, and the bran for feed and food. The straw to grain ratios range from 0.9 to more than 2.0. In our study, a conservative ratio of 1.0 was assumed. For rice grain, the ratio is assumed to be independent of yield. (Summers et al., 2001).
Other cereals: Wheat, which is the most grown and traded commercial food, is considered to be representative of all other cereals. The ratio of grain to straw depends on the management level including the species grown and agro-ecological conditions. At lower yield levels (~ 1 ton/ha), the straw to grain ratio is 1.3 and at higher yield levels (> 9 ton/ha) the ratio drops to 0.7. Cereals are used for food (65%), and also for feed (20%). In developing countries, the straw is used as feed and in the developed countries for bedding. It is assumed that the bedding straw and manure return to the soil.
Soybean and other oil crops: The ratio of soybean straw to beans is about 1.2. To sustain the soil quality, the residues required are estimated at 60%. Oil is extracted from soybeans for consumption, cooking, non-food products and the remaining cakes are used as feed. The average oil extraction is 15%. The soybean leaves and straw remain on the land. It is not certain how much is grazed, baled, mulched or even burned. To estimate the amount of residues/straw from other oil crops a similar approach as for soybean was used to estimate the quantity of residues/straw . Sugarcane: Sugarcane is cultivated for sugar (sucrose) and ethanol. Brazil is the largest producer, followed by India and China. Sugarcane agro-industry is diversified, producing food (sucrose, alcohol, molasses), energy co-generation, and biofuels (ethanol) (Pippo and Luengo, 2013). About 35% of the sugarcane biomass is leaves and tops (sugarcane trash) that are mostly burned or remain in the field. There is growing awareness that sugarcane trash can be an important feedstock for energy in Brazil and in China. It is assumed that 50% of sugarcane leaves can be extracted without consequences for sustainable soil management. Based on current sugarcane production, this amounts to 120 Mt (dry matter). A similar quantity of leaves should remain in the cane fields as a source of carbon and nutrients. A by-product of
sugarcane processing is wet bagasse that can be used for energy co-generation. The quantity of bagasse produced is estimated at more than 230 Mt (dry matter), which corresponds with estimates made by Pippo and Luengo (2013). About 50% of the bagasse produced is used as energy co-production (Chandel et al., 2012) and the rest remains unused in the environment.
Other crops: The biomass residues of fruits and vegetables, roots and tubers, and sugar beets are limited in quantity, but have potential for bioenergy production when available in sufficient quantities. Their relatively high economic value makes these crops less favourable for uses other than food. Sugar beet is comparable to sugarcane, and the high sugar content makes the crop suitable for food, fuel and energy.
The remaining crops were estimated at about 570 Mt. Their residues are estimated at 185 Mt (based on the same ratio as main crop production to their residues).
The total crop biomass is estimated at about 8,950 Mt, of which about 5,570 s (62%) is categorised as crops and 3,380 Mt (38%) as above ground residues (see Table 3.1).
The most crops are produced for food (69%), feed (19%), energy and materials (7%) and other uses such as seed and waste (5%). Of the estimated residues, 10% is used for feed (corn and straw) and 6% for bedding (in developed countries). Most residue remains in the field, is burned or grazed by livestock.
3.1.2 Pasture and livestock: current biomass production
Global and regional production data of pasture systems are scarce and uncertain. Pasture systems include natural grasslands, rangelands and cultivated grasslands, while livestock systems include domestic and semi-domestic animals. The global grassland area is estimated at 3.5 billion ha (data for 2000). Their production strongly depending on the agro-climatic zone and grassland management systems.
Based on pasture area data and conservative biomass estimates (1 and 4 t/ha dry matter) and higher estimates (2 and 7 t/ha dry matter), the total production is estimated at between 5.1 and 10.1 billion tonnes dry matter (FAO, 2008; Smit et al., 2008). Based on the global number of ruminants and their body weight, the theoretic demand is estimated at 5.5 billion tonnes dry matter. This figure was estimated by combining global numbers of ruminants and the daily intakes (2.0 to 2.5% of their body weight in dry matter grass). In this analysis, the 5.5 billion tonnes dry matter was used for the lower estimated production level.
The livestock system is linked to all other systems defined (Figure 2.1). To understand these links and to quantify flows, inputs and outputs were considered to be relevant and quantifiable system boundaries and were thus taken as starting point for our analysis. This approach avoids the complexity of internal flows in the system (metabolism, digestibility, energy balances).
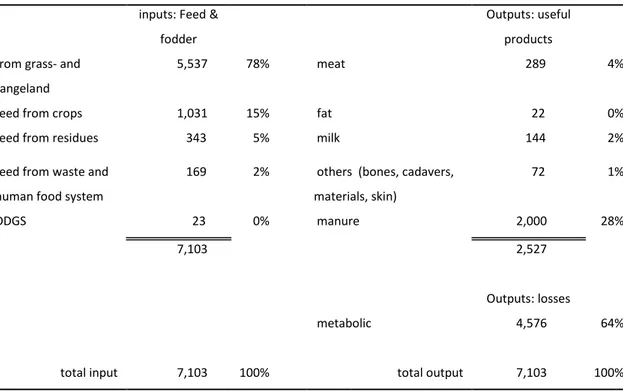
The other inputs are feed from crops (cereals, soy) and crop residues (straw), edible waste streams (human food and food processing) and by-products of alcoholic beverage production and biofuels (cakes from oil crops, glycerine). Biomass from grassland production is estimated at 5,540 Mt, which amounts to 80% of the total input. Other inputs are feed crops, residues, feed from the human system (waste) and by-products from biofuel production. The main outputs of the livestock system are meat, milk and fat, estimated at a total of 455 Mt. Other livestock products are manure, skins, hair, bones and horns, which are used in fertiliser materials and energy.
Inputs to and outputs of the livestock system are presented in Table 3.2. The outputs of livestock systems have many applications. Without a more regional assessment, it is difficult to assess whether and how these products, by-products and wastes are used in the human, energy and soil systems. Most bulk flows, especially in developed regions, have an application and resources are used somewhere, even though the potential might be low. In developing countries, livestock systems include small farms and less industrialized processing, and transport in rural areas is less well developed and waste handling less organized.
Table 3.2. Relative proportion of inputs and outputs in the livestock system
inputs: Feed &
fodder
Outputs: useful products from grass- and
rangeland
5,537 78% meat 289 4% feed from crops 1,031 15% fat 22 0% feed from residues 343 5% milk 144 2% feed from waste and
human food system
169 2% others (bones, cadavers, materials, skin) 72 1% DDGS 23 0% manure 2,000 28% 7,103 2,527 Outputs: losses metabolic 4,576 64%
total input 7,103 100% total output 7,103 100% Unit: Million tonnes (dm), 2010
3.1.3 Soil system
Crop and grassland production systems require nutrients, organic matter and water. Soil organic matter is key to drought-resistant soil and sustained food production (FAO, 2005). In sustainable systems, a substantial part of crop residues should remain in the field or be returned to the field after use and treatment (compost, organic waste, straw) and/or managed so that the nutrient uptake is in balance with inputs (residues, manure, artificial fertilisers, N fixating crops). The total above ground biomass input to cultivated, grazed soils and rangelands is about 4,850 Mt. The most biomass ( 2,830 Mt) comes from crop residues, about 1,800 Mt from manure and 200 Mt from bedding straw. To maintain soil quality, especially in regions with low input agriculture, all manure produced should be used as fertiliser. The minimum quantity of residue to remain on the soil is estimated to be 1,750 Mt.
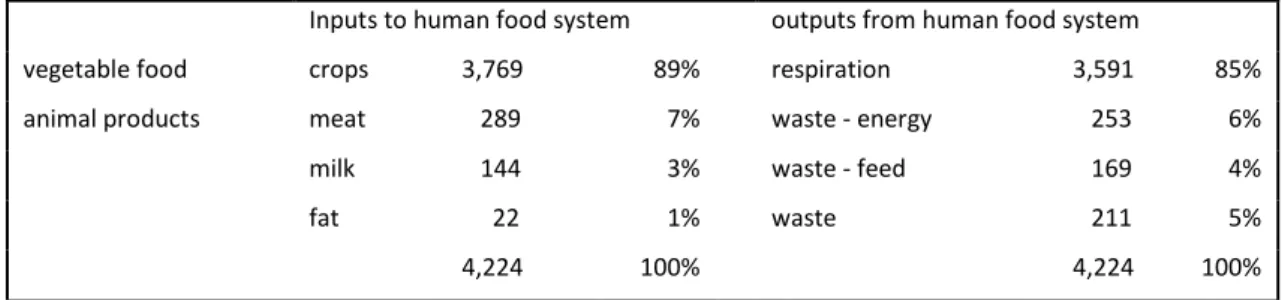
3.1.4 Human food system
The edible output streams of biomass from crop and livestock systems are inputs to the human food and processing system. The most important are grains, roots, tubers, vegetable oils, vegetables and fruits, which are consumed directly or after processing into more attractive products for consumer markets. Part of the stream is wasted, either avoidably or unavoidably. In weight, the crop-related inputs to the human system are about 90% of the total human food intake of about 4,220 Mt (Table 3.3). The remaining intake is food from livestock (meat, milk, fat). The total human intake
is used for growth and metabolism and excretion. About 15% of the total input to the human system is estimated to end as waste, animal feed or is used to produce energy. Table 3.3. Estimated inputs and outputs of the human food system
Inputs to human food system outputs from human food system
vegetable food crops 3,769 89% respiration 3,591 85% animal products meat 289 7% waste - energy 253 6% milk 144 3% waste - feed 169 4% fat 22 1% waste 211 5% 4,224 100% 4,224 100% Unit: Millions tonnes (dm), 2010
3.1.5 Energy and material system
The energy and material system covers the direct and indirect inputs from all other systems to energy production and material use. The flow directly from agriculture is ~420 Mt, of which about ~70 Mt is for materials. The input is mostly sugarcane and corn. Biofuel production also generates other products, such as feed. The total energy content of these commodities is about 11 EJ.
After processing, this delivers ethanol, biodiesel, and other types of energy (including 2.4 EJ additional energy from co-processing) and materials. The proportion of
sugarcane is 37%, oil crops 16%, corn 16%, co-processing 18% and cereals, paddy rice and other crops together 13%. The net energy output, mainly ethanol and
biodiesel, is about 5 EJ. Energy from the food industry and consumption of food waste and material waste and manure adds a further 8 EJ to energy production including co-products.
3.1.6 Overview of agro-biomass flows
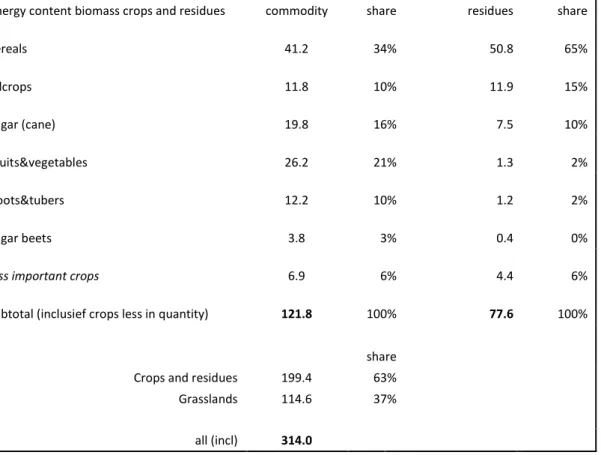
The total energy content of all crops discussed is about 200 EJ/yr, of which 60% (122 EJ) is from the main crops and 40% (78 EJ) from residues (see Table 3.4). The proportion of cereals is 45% (40% of total crop biomass and 50% of total biomass residue). The estimated 78 EJ is in line with previous studies. Lal (2004) calculated the total residue production from agriculture at 3758 Mt yr-1, and Zhang et al. (2012) estimated the total plant residue to be 3,736 Mt yr-1, equivalent to 67 EJ. Our study estimated the total residue to be somewhat higher at 4,450 Mt (3,367 Mt/yr dry matter ), equivalent to 78 EJ. This somewhat higher estimate is due to more recent crop production data (2010) and differences in crop selection. The estimate for the main selection, which covers 94% of world crop production, has been adjusted to represent all crops.
Table 3.4. Estimated energy content and relative proportion of agriculture production Energy content biomass crops and residues commodity share residues share
cereals 41.2 34% 50.8 65% oilcrops 11.8 10% 11.9 15% sugar (cane) 19.8 16% 7.5 10% Fruits&vegetables 26.2 21% 1.3 2% Roots&tubers 12.2 10% 1.2 2% sugar beets 3.8 3% 0.4 0%
less important crops 6.9 6%
4.4 6% subtotal (inclusief crops less in quantity) 121.8 100%
77.6 100%
share
Crops and residues 199.4 63%
Grasslands 114.6 37%
all (incl) 314.0
Unit: EJ yr-1
The energy content of grasslands is estimated to be 115 EJ yr-1. As discussed, this is the lower estimation of an uncertain bandwidth. The total energy content of all
primary agricultural biomass is estimated at 315 EJ yr-1. The livestock related energy content is estimated at about 20 EJ yr-1, but this is secondary and may not be added to the total production.
Only a small proportion of the energy content of crops and residues is used for energy and material production. About 5% of the energy content of crops and residues
production is used for bioenergy and materials (420 Mt ~11 EJ), and mostly comes from crops, such as sugarcane and corn.
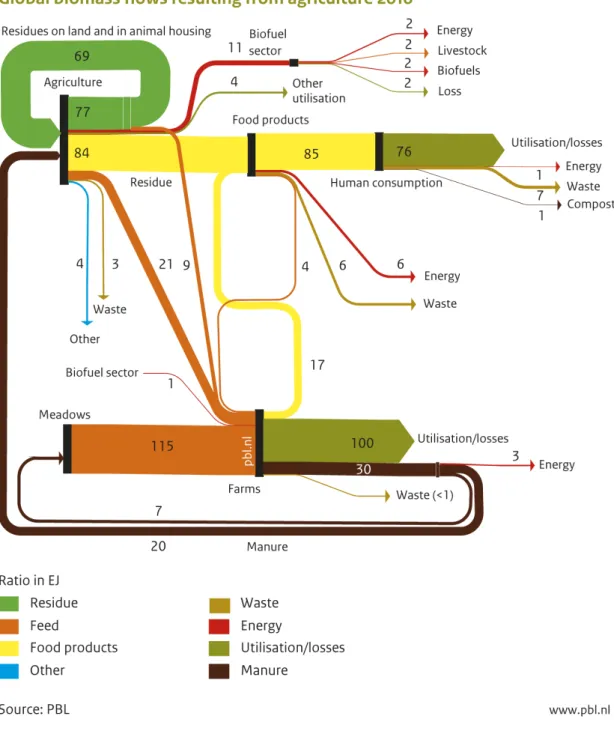
The biomass flows in the agro complex are presented in ExaJoules in the Sankey diagram in Figure 3.1. Using energy density data for all common commodities, the mass data have been converted to energy data. The energy content depends on the moisture content. In this study, the commonly referred weight – energy ratio’s were used.
Figure 3.1. Global biomass flows (2010) resulting from agriculture
3.2 Biomass from the forestry-wood system
As described in the previous section, the wood biomass flow consists of five systems: trees, wood products and other materials, the energy system, soil and water system, and the wood waste system.
3.2.1 Tree and residue system: current wood harvests
Forests cover more than 4 billion hectares or about 30% of the global land area, and there is a further 1 billion hectares of wooded land (FAOSTAT, 2013). About half of this total area is located in developed countries and half in developing (mostly tropical) countries.
Figure 3.2. Main global wood flows (FAO, 2010; IEA, 2012)
Global woody biomass flows from forest harvesting to waste generation are presented in Figure 3.2. About 4600 Mt or 83 EJ biomass is harvested annually for energy
(60%), industrial roundwood (20%) and losses (20%). The latter consists of woody biomass that is harvested, but not used and remains in the forest as logging
losses/primary residues (branches, leaves, unsuitable trunks, tree stumps). These residues are normally transferred to the soil.
Losses in the biomass flow due to large-scale forest fires (~2400 Mt yr-1) have not been included. This considerable pool is less relevant to the discussion because it varies in time and place and cannot be transferred to energy (JRC/PBL, 2011).
A biomass pool is dead wood that remains in the forest, either standing or lying, and is transferred to the soil. It is often too costly to harvest dead wood. Besides, it is useful in increasing biodiversity (the proportion of dead wood is a sustainability criteria, (EEA, 2012). The global quantity of dead wood is estimated roughly at 67 Gt of biomass, which is about 11% of the total biomass (FAO, 2010), and about 20 times the annual wood harvest. The total pool is built up over a long time period and for the entire forest area. Assuming an average rotation of 50 to 100 years, this implies a biomass pool of 670 to 1340 Mt yr-1 (10 to 20 EJ yr-1) that dies annually and remains in the forest but only part of this is accessible and harvestable for energy production (see Section 3.2.2).
3.2.2 Energy system
About 2700 Mt yr-1 or ~49 EJ yr-1, which is about 60% of total annual harvest (Figure 3.2), is currently harvested for fuelwood and power generation. This is the largest proportion of the timber harvest (FAO, 2010; IEA, 2012). This extent of this flow is based on IEA data (2012), which are more comprehensive than FAO data. The most is used as fuelwood for heating and cooking (about 2200 Mt, 40 EJ or 48% of global total timber harvest), and about 300 Mt (or ~6 EJ or 8%) is used as solid biomass for power generation (IEA, 2012) and the remaining 4% (~3 EJ) is lost in the process.
3.2.3 Materials system
About 965 Mt or 17 EJ of biomass is harvested annually for industrial roundwood for construction and paper and cardboard (Figure 3.2). Some ~200 Mt yr-1 or 3.6 EJ yr-1 is roughly estimated as illegal logging (Nellemann & Interpol, 2012) but is not
included in FAO data. Some 570 Mt yr-1 or 10 EJ yr-1 of the total industrial
roundwood production is annually converted to saw logs for wood products (about 350 Mt yr-1) and construction (110 Mt yr-1), and lost in sawmills during processing (also about 100 Mt yr-1). The latter is most often re-used for energy and thus not available as an additional energy source. The remaining 390 Mt yr-1 or 7 EJ is used annually to produce paper and pulp, and 208 Mt yr-1 is recycled biomass. In this process, about 180 Mt (2.1 EJ) of biomass is lost annually as back liquor, which is also often re-used as an energy source in paper mills.
Another issue related to energy is the quantity of wood products returned annually to the system as waste. For 2010, this waste pool of wood products is estimated at about 400 Mt yr-1 or ~7 EJ yr-1. More than half (3.7 EJ) is recycled in the paper and pulp industry, 20% is used in power generation and 25% accumulates in landfill. However, waste production from wood products is less than the production of these products (950 Mt products produced which is input, compared to 400 Mt yr-1 waste production which is output). This implies a build-up of biomass in the human system (stock in buildings and furniture), possibly resulting in increased waste production in the long term. The current and future waste pool provides a potential source for additional biofuel (see Section 5).
3.2.4 Soil and water system
Soils provide nutrients and water for tree growth. Forests are estimated to contain 900 to 2700 Gt of biomass in the soil (Van Minnen, 2008), of which about a quarter is in the upper soil layer (0 to 30 cm) and delivers nutrients to trees (Hiederer, 2009). In addition to the natural cycle (including 600 Mt yr-1 dead wood), the annual input of logging residues to the soil is about 950 Mt yr-1. This pool of primary residues is about the same as the biomass harvested for industrial roundwood (EUwood, 2010).
Further, not only the quantity but also the quality of nutrients and water supply to forest soil is essential. For example, most nutrients and nitrogen required by trees originates from decomposed leaves and roots, while the largest biomass flow comes from tree trunks, which are relatively poor in nutrients. Dead stems could be removed, for example, for bioenergy production, without greatly affecting the nutrient balance in most forests, with exception of forests on very poor soils. However, removal may have a negative effect on soil biodiversity (Verkerk et al., 2012).
3.2.5 Wood-product waste system
The estimated 960 Mt yr-1 or 17 EJ yr-1 biomass harvested annually for saw logs, paper and pulp, and lost during the process in sawmills and paper industry leads to a large build up of biomass in the material system. Nevertheless, products, such as furniture and wood constructions, and paper come to an end, and the annual turnover is about 380 Mt or 7 EJ yr-1, of which 54% is immediately recycled (especially paper), 27% goes to landfill, and 19% is used in energy production. These flows could
increase considerably in the future when input and output to the material system is more in balance.
3.2.6 Overview of wood flows
The wood flows in the agro compex are presented in ExaJoules in the Sankey diagram in Figure 3.4
4 Potential efficiency improvements to increase
sustainable supply of biomass for energy
4.1 Potential from the agro-system
The potential to use more biomass flows in the energy supply was analysed on the basis of current flows. The largest losses are estimated to occur at the beginning of the biomass chain in crop residues, tree logging and burning. Low efficiency and high losses also occur in other stages of the biomass chain.
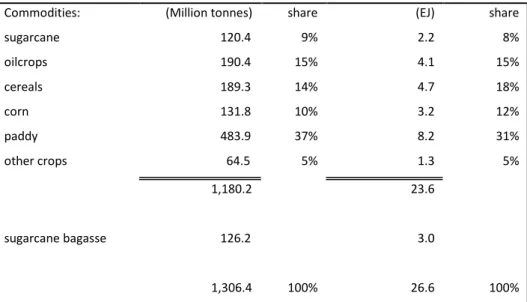
If un-used and burned crop residues, which are classified as the sustainable potential, were used for energy and materials, extraction could increase by 1,180 Mt, equivalent to ~24 EJ (see Table 4.1). This could increase the proportion from 5% to 17% of the energy content of crops and residues only, and 11% of the energy content of the total primary produced agricultural production, including grassland and rangeland.
Table 4.1. Sustainable potential for energy and materials from crop residues including energy co-production
Commodities: (Million tonnes) share (EJ) share sugarcane 120.4 9% 2.2 8% oilcrops 190.4 15% 4.1 15% cereals 189.3 14% 4.7 18% corn 131.8 10% 3.2 12% paddy 483.9 37% 8.2 31% other crops 64.5 5% 1.3 5% 1,180.2 23.6 sugarcane bagasse 126.2 3.0 1,306.4 100% 26.6 100% units: Mtonnes (left column) EJ yr-1 (right column), all countries, 2010
In the assessment of the bioenergy potential is assumed that soil management is sustainable. In the calculations a minimum amount of residues was determined. For most crop this means that at least about 50-60% of the aboveground crop residues should remain on the land. This especially is necessary in low input agriculture. For some crops, such as rice, lower values suffice (Kim & Dale, 2004). For rice there is no clear consensus in literature. Residue management is often based on a rotation, for example, of rice and wheat. High residue removal affects negatively the soil properties and sustainability of crop production, but if left, the residue may interfere negatively with the next crop (planting of wheat after rice) (Mandal et al., 2004; Kim & Dale, 2004). Also soil type affects the amount of required residues, for example acid soils benefit from silica-rich rice straw. In the calculation we used 20% for rice, 50% for sugarcane and 60% for all other crops.
The large production of rice and the relatively low residue flow to the soil makes rice residues the residue with the highest potential for bioenergy, followed by residues from oilcrops, cereals, corn and sugarcane. Although rice residues have an high potential Lim et al (2012) concluded that further research is required on optimal allocation of rice straw and rice husk resources in rice mills and on industrial
commercialisation of these technologies. The sugarcane agro-industrial system already incorporates a lot of residues in the food-fuel-energy chain, but improvements and innovations in land management and in sugar and ethanol processing are needed in order to use the full potential.
Next to the potential of using un-used or burned residues, there is potential from more efficient handling of waste streams. The majority of the carbon rich organic waste comes from the human systems. In the assessment is assumed that the waste products are not in competition with other applications (such as, animal feed,
landfilling), the waste products are collected separately and channelled into a stream for bioenergy or biomaterials. It is assumed that about 15% of the current flow of vegetable and animal products is an organic rest flow that is wasted. Other potential sources, but less in quantity, are wasted agricultural products (crops, cadavers, fats and bones from slaughtered animals). Together these streams add up to 21 EJ of which 70% from waste from the human system.
If both potentials are considered the potential contribution from the agro-system to the energy system 56 EJ which is 18% of the energy content of the total primary produced agricultural production (including grassland and rangeland).
4.2 The potential from the forestry-wood system
About 66 EJ biomass is harvested annually, of which about 49 EJ yr-1 is used for energy production, the remainder is harvested for paper and pulp and for construction and saw logs (10 EJ yr-1 and 7 EJ yr-1 , respectively). With regard to the latter, losses occur in different steps and systems of harvesting and production (see Table 4.2). Furthermore, paper and timber are often dumped on landfill at the end of their lifetime. Production losses and waste could potentially be used and thus increase fuelwood availability.Increasing use of primary forest residues and dead wood
Harvest losses: harvesting removes tree trunks and some branches from a forest for specific uses. But damaged trunks and branches and bark are often left or burned along roadsides (primary residues) because removal is often uneconomical. Between 20 and 35% of total felling consists of primary forest residue (EUwood, 2010),
implying a pool of 11-19 EJ yr-1 (average 17 EJ yr-1 ; see Table 4.2). A large proportion can be removed from a forest without affecting the nutrient balance, because most nutrients are in the small biomass, mainly the leaves. The exception is forests on poor soils (EUwood, 2012) where harvest residue potentially represents a substantial biomass resource (14 EJ yr-1 ) for energy production (Repo, 2012). Dead wood: the global stock of dead wood is estimated at about 1200 EJ of biomass (FAO, 2010). This large pool has build up over a long period of time and in the entire forest area. Assuming an average rotation of 50 to 100 years, this implies a biomass pool of 10 to 20 EJ yr-1 . When primary forests are excluded because they have not been used (based on FAO, 2010), about 7 to 14 EJ yr-1 of dead biomass remains. Forests with large quantities of dead wood are located in Russia and in parts of Africa.
A limitation to the use of salvaged wood is the high costs of access and transport (Niquidet et al., 2012). A conservative estimate of accessible planted forests reduces the pool of available dead wood to about 2 EJ yr-1 biomass (Table 4.2). When an additional assumption is made that half of the dead wood needs to remain in forests to maintain biodiversity (Verkerk et al, 2012), the estimate is about 1 EJ yr-1 biomass available annually for energy production.
Wood product waste
Wood waste occurs in processing, such as in sawmills and paper production, and is estimated at 6 EJ yr-1. In developed countries, much of this biomass is either lost or re-used in the system, for example for energy, and is not an additional fuel source (IEA, 2012). Sawmills in developing countries produce about 0.3 EJ yr-1 of unused residues from construction and saw logs (Table 4.2).
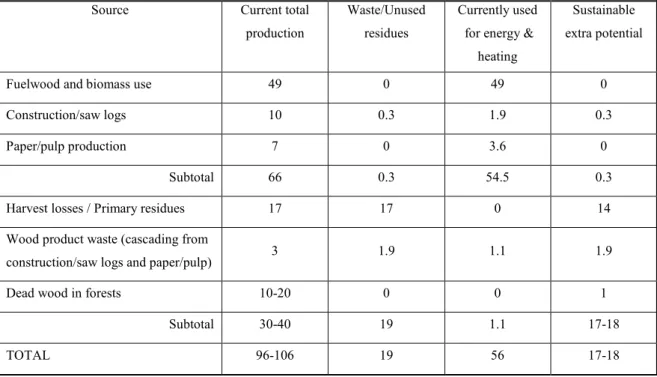
Table 4.2. Current wood production for energy production and its potential if the wood is used more efficiently
Source Current total production
Waste/Unused residues
Currently used for energy &
heating
Sustainable extra potential
Fuelwood and biomass use 49 0 49 0
Construction/saw logs 10 0.3 1.9 0.3
Paper/pulp production 7 0 3.6 0
Subtotal 66 0.3 54.5 0.3
Harvest losses / Primary residues 17 17 0 14
Wood product waste (cascading from
construction/saw logs and paper/pulp) 3 1.9 1.1 1.9
Dead wood in forests 10-20 0 0 1
Subtotal 30-40 19 1.1 17-18
TOTAL 96-106 19 56 17-18
Unit: EJ yr-1
The annual global production of industrial roundwood is estimated at about ~17 EJ yr-1, which includes 3.6 EJ yr-1 of illegal logging. Materials, such as timber, board and paper, are wasted (about 3 EJ yr-1) and end in landfill (1.9 EJ yr-1 ) or are used in energy production and co-firing (1.1 EJ/y). Assuming equal quantities from timber products and paper and pulp waste, this cascading provides a potential 1.9 EJ yr-1 for energy production (Table 4.2).
There is considerable stock build up in the system with more wood products (15 EJ) produced annually than disappear from the system (3 EJ). The current waste flow for energy production could increase considerably in the coming decades (1-8 EJ yr-1) as the system gains more equilibrium.
5 Discussion and conclusions
Our study summarised the present use of biomass products in order to assess the potential to increase efficient use of biomass resources and to scope for expanding supply for bioenergy. This potential based on less waste and cascading is expected to offer sustainably produced biomass without issues, such as indirect land use change (ILUC) for production of more agricultural crops for energy and the carbon debt for expansion of wood felling. Our evaluation of the efficiency of resource use included an assessment of the key uncertainties about quantities produced, the quantity used for each main application and the quantities wasted in various activities for 2010.
The energy content of all crops including residues produced worldwide is estimated at ~200 EJ, and grassland and rangeland produce ~115 EJ, mainly for the human food system. The net input is about 100 EJ, of which about 18 EJ originates from the livestock system. Only a small proportion the primary production is used for energy and material production, and only 5% of the energy content of crops and residues is used for bioenergy (~11 EJ). If all un-used and burned crop residues were used for energy, considering sustainable soil management, the extraction for energy would increase by ~24 EJ.
Other potential energy sources are better use of waste flows from industrial processing and use, and could produce a total of 21 EJ, providing an additional potential of 45 EJ (and total of ~56 EJ) or almost 18% of the energy content of total agricultural
production worldwide (crops, residues and grasslands).
The energy content of all wood harvested worldwide including residues is estimated at ~ 66 EJ annually. Most of this ( ~50 EJ) is used as fuelwood or directly for power generation. However, the extent of sustainable wood harvesting and wood collected informally is not known. In addition, about 17 EJ of global primary residues are left in the forest. Taking into account sustainability concerns such as soil quality, a potential of ~15 EJ (including collection of more dead wood) is estimated to be available for bioenergy. This is within the range given by Anttila et al, (2009), confirming that 12 to 74 EJ is technically possible for primary residues, and 1 to 15 EJ is economically
feasible.
About 20% of all wood harvested is used for timber and paper production (about 10 and 7 EJ, respectively), producing considerable amounts of waste. Currently, ~2 EJ of timber products that go to landfill could potentially be used for bioenergy. This wood product waste (cascading/tertiary residues) could be even more relevant in the future as the quantity could increase in the coming decades because the stock of timber products in human system is still increasing. Increased efficiency and cascading of wood provide a potential of 17-18 EJ yr-1 for biofuel production.
Based on data for 2010, more efficient and sustainable use of biomass produced in agriculture and forestry could provide an additional energy input of 63 EJ, without reducing availability for current applications. This implies that the current bioenergy could be doubled. However, the sustainability of some bioenergy is uncertain
(fuelwood), is under discussion or even assumed to be doubtful (biofuels from crops). Taking this into account, the total sustainable potential is estimated at 80 to 100 EJ, while the global energy demand in 2010 was 550 EJ.
With a growing global population and expected economic growth in many countries, the demand will increase for biomass products such as food. Thus, more residues and waste will also be produced. However, a linear relationship can seldom be assumed, and especially not for agricultural production. In the future, crop productivity may increase with a focus on the most valuable parts of crops and not on the residue.
Thus, residues are not likely to increase as much as the crops themselves. However, more wood will be become waste and thus available for energy (cascading). Global energy demand will also increase, and the potential percentage contribution is likely to be about the same. Expansion of specific energy crops and wood plantations for
energy, if considered sustainable in future situations, has not been included. Crucial to utilising the biomass potential is whether quantities can be collected and transported to meet geographical differences in supply and demand and to enable large-scale processing in combination with carbon sequestration or re-use. Crop and residues potential can be identified worldwide with most of the wood potential in the developing world. Use of more sustainable harvest techniques may contribute to reducing possible damage.
The move from potential to large-scale energy production requires a balanced and efficient chain of biomass producers, agro sector and/or forestry sector, adequate transport infrastructure and transport system (road, rail of water) and energy producers. In addition, it requires an organisation with a focus on the long-term resource use and energy production. These conditions need to be meet in order to reduce costs and to ensure investment is profitable, as well as to guarantee energy production. In developed countries, such conditions are available and scaling up of biomass use seems feasible. However, competition between energy and other biomass users (such as feed, agriculture, materials) seems more dominant than the lack of basic facilities.
In developing countries the situation is often different. Basic structures are lacking or limiting. Road and transport infrastructure are limited and agricultural production is often small-scale farming, characterised by low inputs and traditional organic soil management, and is less organised. These are serious obstacles to development of bioenergy especially in less developed countries.
Another issue is sustainable crop production, grass- and rangeland management and forestry. Unsufficient nutrient and carbon flows to the soil, especially in low-input regions, will negatively affect soil fertility, soil structure and water holding capacity and affect biodiversity and have impact on future production potential. This not only for bioenergy, but also for the production of food, feed and wood and the condition and biodiversity of the forests.
References
Anttila P, Karjalainen T, Asikainen A (2009) Global Potential of Modern Fuelwood. Working paper of the Finnish Research Institute 118. www.metla.fi
BP (2012) BP statistical Review of world energy, June 2012.
Chandel AK, da Silva SS, Carvalho W, Singh OV (2012) Sugarcane bagasse and leaves: foreseeable biomass of biofuel and bio-products, Wiley Online Libarary 21 november 2011.
Dornburg V, van Vuuren D, van de Ven GWJ et al. (2010), Bioenergy revisited: Key factors in global potentials of bioenergy. Energy & Environmental Science 3 (2010)3. - ISSN 1754-5692 - p. 258 - 267.
EEA (2012) Streamlining European biodiversity indicators 2020: Building a future on lessons learnt from the SEBI 2010 process. – Technical Report European Environment Agency 11/2012; doi:10.2800/55751, Copenhagen, available at
http://www.eea.europa.eu/publications/streamlining-european-biodiversity-indicators-2020
Elbersen B., Fritsche U, Petersen J-E, Lesschen JP, Böttcher H, Overmars K (2013) Assessing the effect of stricter sustainability criteria on EU biomass crop potential. Biofuels, Bioproducts and Biorefining 7: 173–192.
EUwood (2012) EUwood - Real potential for changes in growth and use of EU forests. Final report. Hamburg/Germany, 160 p,
http://ec.europa.eu/energy/renewables/studies/doc/bioenergy/euwood_final_report.p df
European Bioplastics (2013) Bioplastics, Facts and Figures. see http://en.european-bioplastics.org
FAO (2005) The importance of soil organic matter, Key to drought-resistant soil and sustained food production. Authorss: Alexandra Bot and José Benites, FAO soil bulletin 80, FAO, Rome.
FAOSTAT (2013) FAOSTAT. Available at www.faostat.fao.org (accessed 2013) FAO (2008) Are grasslands under treat, brief analysis of FAO statistical data on pasture and fodder. See www.fao.org/uploads/media/grass_stats_1.pdf
FAO (2010) Global Forest Resources Assessment 2010. Main report. FAO Forestry Paper No. 163. Rome., Italy, 378p, Available at:
www.fao.org/docrep/013/i1757e/i1757e.pdf
Hiederer R (2009) Distribution of Organic Carbon in Soil Profile Data. EUR 23980 EN. Luxembourg: Office for Official Publications of the European Communities. 126pp. Hoogwijk M, Faaij A, Eickhout B, de Vries B, Turkenburg W (2005) Potential of biomass energy out to 2100 for four IPCC SRES land-use scenarios. Biomass and Bioenergy 29: 225-257
International Energy Agency IEA (2012) Global Wood Pellet Industry Market and Trade Study. IEA Task 40. Retrieved 1 June 2012.
IRRI (2013) available at www.knowledgebank.irri.org/
JRC/PBL European Commission, Joint Research Centre (JRC) and PBL Netherlands Environmental Assessment Agency (2011). Emission Database for Global Atmospheric Research (EDGAR), release version 4.2 of 11 November 2011. Internet:
Kim S, Dale B (2004) Global potential bioethanol production form wasted crops and crop residues. Biomass and Bioenergy 26: 361-375
Lal R (2004) World crops residues production and implication of its use as a biofuel. Environment International 31 (2005) 575– 584
Lim JS, Manan MA, Wan Alwi SR, Hashim H (2012) A review on utilization of biomass from rice industry as a source of renewable energy. Renewable and Sustainable Energy Reviews 16(5): 3084-3094.
Mandal KG, Misra AK, Hati KM, Bandyopadhyay KK, Ghosh PK, Mohanty M (2004) Rice residue- management options and effects on soil properties and crop productivity. Food, Agriculture & Environment Vol.2 (1) : 224-231. 2004
Van Minnen JG (2008) The terrestrial carbon cycle on the regional and global scale: modeling, uncertainties and policy relevance. PhD Wageningen University and Research, Wageningen, 237p http://edepot.wur.nl/121947
Nellemann C, Interpol (2012) Green Carbon, Black Trade: Illegal Logging, Tax Fraud and Laundering in the Worlds Tropical Forests. A Rapid Response Assessment. United Nations Environment Programme (UNEP) Environmental Crime Programme
GRIDArendal. www.grida.no
Niquidet K, Stennes B, Kooten GC (2012) Bioenergy from Mountain Pine Beetle Timber and Forest Residuals: A Cost Analysis. Canadian Journal of Agricultural Economics 60:195-210. DOI: 10.1111/j.1744-7976.2012.01246.x
Pippo WA, Luengo CA (2013) Sugarcane energy use: accounting of feedstocks energy considering current agro-industrial trends. International Journal of Energy and
Environmental Engineering 2013, 4:10
Oak Ridge National Laboratory—U.S. Department of Energy ORNL (2011) U.S. billion-ton update: Biomass supply for a bioenergy and bioproducts industry. ORNL/TM-2011/224. Oak Ridge, TN.
Repo A, Känkänen R, Tuovinen J-P, Antikainen R, Tuomi M, Vanhala P, Liski J (2012) Forest bioenergy climate impact can be improved by allocating forest residue removal. GCB Bioenergy 4(2): 202-212.
Smeets EMW, Faaij APC, Lewandowski IM, Turkenburg, WC (2007) A bottom-up assessment and review of global bioenergy potentials to 2050. Progress in Energy and Combustion Science 33, 56-106.
Smit HJ, Metzer MJ, Ewert F (2008), Spatial distribution of grassland productivity and land use in Europe. Agricultural Systems 98: 208-219.
Summers MD, Jenkins BM, Hyde PR, Williams JF, Scardacci SC, Mutters RG (2001) Properties of Rice Straw as Influenced by Variety, Season and Location. Published by the American Society of Agricultural and Biological Engineers, St. Joseph, Michigan www.asabe.org. Paper number 016078, 2001 ASAE Annual Meeting. (doi:
10.13031/2013.4214) @2001
UNECE/FAO (2011) State of Europe’s Forests 2011. Status and Trends in Sustainable Forest Management in Europe. 344p www.foresteurope.org/full_SoEF
Verkerk PJ, Lindner M, Zanchi G, Zudin S (2011) Assessing impacts of intensified biomass removal on deadwood in European forests. Ecological Indicators 11: 27-35. http://dx.doi.org/10.1016/j.ecolind.2009.04.004
Zhang Y, Ghaly AE, Binxi L (2012), Availability and physical properties of residues from major agricultural crops for energy conversion through thermochemical processes, American Journal of Agricultural and Biological Science.