RIVM report 601501027/2005
Environmental Risk Limits for alcohols, glycols, and some other relatively soluble and/or volatile compounds
2. Integration of human and ecotoxicological risk limits
T.P. Traas and D.M. Bontje
This investigation has been performed for the account of the Directorate-General for Environmental Protection, Directorate for Chemicals, Waste and Radiation, in the context of the project ‘International and National Environmental Quality Standards for Substances in the Netherlands’, RIVM-project no. 601501.
Contact: T.P. Traas
Expert Centre for Substances tp.traas@rivm.nl
National Institute for Public Health and the Environment, PO Box 1, 3720 BA Bilthoven, the Netherlands. Tel. 31-30-2749111, fax. 31-30-2742971
Rapport in het kort
Milieurisicogrenzen voor alcoholen, glycolen en enkele andere relatief oplosbare of vluchtige stoffen. 2. Integratie van risicogrenzen voor mens en ecosystemen
Milieurisicogrenzen zijn concentraties van een stof in water, bodem, sediment en lucht waarbij geen nadelige effecten van die stof worden verwacht. In dit rapport worden
milieurisicogrenzen bepaald die zowel de mens als ecosystemen beschermen tegen nadelige effecten van chemische stoffen. Hiertoe werden eerder afgeleide ecotoxicologische
risicogrenzen vergeleken met die voor de mens: 1-butanol, n-butylacetaat, cyclohexylamine, diethyleenglycol, ethyleenglycol, ethylacetaat, methanol, methyl ethyl keton (MEK), methyl
tert-butyl ether (MTBE), tribroommethaan en triethanolamine.
De milieurisicogrenzen voor de mens die in dit rapport zijn gerapporteerd zijn berekend met behulp van het model Humanex. Humanex is beschreven in RIVM rapport 601501022. De milieurisicogrenzen op basis van de ecotoxicologie zijn berekend in deel 1 van dit rapport (RIVM rapport 601501016). De hier gepresenteerde methode maakt het mogelijk om relatief eenvoudig uit te rekenen of humane risico’s dominant zijn over het milieu of andersom. Voor 4 tot 5 stoffen (afhankelijk van het milieucompartiment) blijkt de mens de meest kritische factor te zijn voor het risico van de stof.
Trefwoorden: geïntegreerde risicoschatting; mens; milieu, blootstelling; model; chemische stoffen; normstelling, risicogrenzen
Abstract
Environmental Risk Limits for Alcohols, Glycols, and other Relatively Soluble and/or Volatile Compounds. 2. Integration of Human and Ecotoxicological Risk Limits
Environmental risk limits are concentrations of a substance in water, air, sediment and soil that are expected to be protective of the environment. In this report environmental risk limits (ERLs) are derived, based on a comparison of human and ecotoxicological risk limits. Ecotoxicological risk limits, derived previously, were compared to risk limits for human health for the following substances: 1-butanol, n-butyl acetate, cyclohexylamine, diethylene glycol, ethylene glycol, ethyl acetate, methanol, methyl ethyl ketone (MEK), methyl tert-butyl ether (MTBE), tribromomethane and triethanolamine.
Environmental risk limits based on ectoxicological information were calculated in part 1 of this report (RIVM report 601501016). The scientific basis for the human risk evaluation model Humanex is described in a companion report (RIVM report 601501022). The method presented here allows a relatively easy calculation of the dominant risk to either humans or to the environment. Human risk appeared to determine the risk limits for four to five substances (depending on the environmental compartment).
Keywords: integrated risk assessment, environment, health; exposure; model; chemicals; quality objectives
Contents
Samenvatting ____________________________________________________________________________ 9 Summary ______________________________________________________________________________ 11 1. Introduction _______________________________________________________________________ 13 1.1 General background _____________________________________________________________ 13 1.2 Human risk limits_______________________________________________________________ 14 1.3 Exposure models _______________________________________________________________ 15 1.4 Integration of environmental risk limits______________________________________________ 17 2. Calculating Maximum Permissible Concentrations with Humanex __________________________ 19
2.1 Background ___________________________________________________________________ 19 2.2 Correction for the Tolerable Concentration in Air______________________________________ 20 2.3 Integrating human and ecological risk limits __________________________________________ 21 3. Integrating MPChuman with MPCeco____________________________________________________ 23
3.1 Introduction ___________________________________________________________________ 23 3.2 Integration of risk limits__________________________________________________________ 24
3.2.1 1-Butanol __________________________________________________________________ 24 3.2.2 n-Butyl acetate ______________________________________________________________ 25 3.2.3 Cyclohexylamine ____________________________________________________________ 25 3.2.4 Diethylene glycol ____________________________________________________________ 27 3.2.5 Ethyl acetate _______________________________________________________________ 27 3.2.6 Ethylene glycol _____________________________________________________________ 28 3.2.7 Methanol __________________________________________________________________ 29 3.2.8 Methyl ethyl ketone __________________________________________________________ 30 3.2.9 Methyl tert-butyl ether ________________________________________________________ 31 3.2.10 Tribromomethane ___________________________________________________________ 32 3.2.11 Triethanolamine_____________________________________________________________ 33
4. Overview of risk limits ______________________________________________________________ 35 4.1 ERLs for water_________________________________________________________________ 35 4.2 MPCs for groundwater___________________________________________________________ 35 4.3 MPCs for air___________________________________________________________________ 36 4.4 MPCs for soil __________________________________________________________________ 36 4.5 MPCs for sediment _____________________________________________________________ 37 5. Discussion _________________________________________________________________________ 39
5.1 MPCs protective for man and ecosystems ____________________________________________ 39 5.2 The interpretation of MPChuman values_______________________________________________ 39 5.3 Exposure assumptions and uncertainty ______________________________________________ 40 Acknowledgements ______________________________________________________________________ 41 References _____________________________________________________________________________ 43 Appendix 1 Substance properties used __________________________________________________ 45 Appendix 2 EUSES settings for calculations of PECREGs__________________________________ 47 Appendix 3 Tolerable Daily Intakes and Tolerable Concentrations in Air _____________________ 53
Samenvatting
Milieurisicogrenzen moeten bescherming bieden aan mens aan milieu. Bij het afleiden van milieurisicogrenzen in het kader van interventiewaarden worden deze grenzen afgeleid voor zowel de mens en het milieu, waarna de laagste waarde wordt voorgesteld als
milieukwaliteitsnorm. Bij het afleiden van milieugrenzen voor de algemene milieukwaliteit werd tot nu toe alleen voor een aantal vluchtige stoffen gekeken naar het risico voor de mens. In voorgaande rapporten werd echter vastgesteld, dat het voor deze stoffen niet uitgesloten is, dat blootstelling ook via andere routes dan alleen lucht plaatsvindt. Op basis hiervan heeft de voormalige Stuurgroep INS (thans Stuurgroep Stoffen) vastgesteld dat een
multi-compartimentele benadering van humane blootstelling het meeste perspectief biedt. Het rapport geeft een invulling aan deze benadering,
In dit rapport zijn maximum toelaatbare risiconiveaus vergeleken voor 11 stoffen waarvoor risico’s voor mens en milieu worden verwacht: 1-butanol, n-butylacetaat, cyclohexylamine, diethyleenglycol, ethyleenglycol, ethylacetaat, methanol, methyl ethyl keton (MEK), methyl
tert-butyl ether (MTBE), tribroommethaan (bromoform) en triethanolamine. Risicogrenzen
voor het milieu zijn eerder berekend op basis van toxiciteitsgegevens voor deze stoffen met verschillende organismen. De risico’s voor de mens werden berekend met het model Humanex. Dit model berekent het relatieve belang van blootstellingroutes naar de mens, op basis van de fysisch-chemische eigenschappen en de emissies tijdens productie en gebruik. Hiermee kan berekend worden, wat de concentraties in de verschillende
milieucompartimenten mogen zijn, waarbij de totale blootstelling van de mens de toelaatbare dagelijkse inname (TDI) net niet overschrijdt.
Uit de vergelijking van de risicogrenzen voor mens en milieu kwam naar voren dat de mens de meest kritische factor is voor milieurisicogrenzen voor 4 tot 5 stoffen, afhankelijk van het milieucompartiment. In die gevallen kan de risicogrens voor een bepaald milieucompartiment naar beneden worden bijgesteld, zodat er geen risico voor de mens is. Op theoretische
gronden is dit een goede keus. Binnen het kader van het project ‘(Inter)nationale Normstelling Stoffen’ (INS), wordt de methodologie van het ‘Technical Guidance Document’ (TGD), uitgebracht door de Europese Commissie, gebruikt. In deze richtlijn wordt altijd een integratie van humane en ecotoxicologische risico’s gemaakt. Deze bijstelling is echter misschien niet altijd nodig. Er zijn redenen om alleen de risicogrens naar beneden bij te stellen, als het betreffende compartiment daadwerkelijk een belangrijke bron is van blootstelling. Het
gebruikte model laat zien of dit het geval is of niet, en in welke mate. Het hier gepresenteerde model maakt het eenvoudig om de bepalende factor, voor milieurisicogrenzen te vinden: mens of milieu. Zonder modelberekeningen is dit niet in te schatten.
Summary
Environmental risk limits should offer protection to man and ecosystems. Risk limits in the framework of soil remediation (so called intervention values) are derived in that way. The strictest limit is proposed as official quality standard. In the framework of general
environmental quality, the maximum permissible concentration only took human risk into account for a number of volatile substances. Previous research however showed that for these substances, it could not be excluded that other routes of exposure could contribute to human risk as well. On that basis, the steering committee (currently Steering Committee for
Substances) for this project (INS) decided that a multi-route approach to human exposure is more appropriate. This report details such an approach.
In this report, maximum permissible concentrations (MPCs) were compared for eleven substances for which risks to both man and environment are expected: 1-butanol, n-butyl acetate, cyclohexylamine, diethylene glycol, ethylene glycol, ethyl acetate, methanol, methyl ethyl ketone, methyl tert-butyl ether, tribromomethane and triethanolamine. Ecotoxicological risk limits were calculated in a companion report, based on laboratory toxicity tests with several organisms. Risks for man were calculated with the model Humanex. This model calculates the relative importance of exposure routes to man, based on the phyico-chemical properties of a substance and the emissions that take place during production and use of a substance. This allows for estimation of concentrations in each environmental compartment, where total human exposure is just within the limits of the tolerable daily intake (TDI). The comparison between ecotoxicological and human risk limits showed that human risk was the critical factor that determined risk limits for four to five substances (depending on the compartment). In those cases, the risk limits can be adjusted downwards such that no risk to humans remains. This is a good choice on theoretical grounds. Within the framework of the project ‘International and National Environmental Quality Standards for Substances in the Netherlands’, the methodology from the Technical Guidance Document (TGD), issued by the European Commission, is used. In this guidance an integration of human and ecotoxicological risks is always made. However, this adjustment may not always be needed. It can also be argued that risk limits are only adjusted downwards, if that particular compartment is an important exposure route for humans. The model that was used can identify if this is the case and to what extent. The model presented here makes it easy to determine the critical factor that determines the risk limits: man or environment. It is not possible to do this without model calculations.
1.
Introduction
1.1
General background
This report is a result of the project ‘International and National Environmental Quality Standards for Substances in the Netherlands’. The aim of the project is to derive
environmental risk limits (ERLs) for substances in the environment for the compartments air, (ground)water, sediment and soil. This specific report focuses on the integration of risk limits for man and ecosystems. The strictest criterion is used to determine the final risk limit. ERLs serve as advisory values to set environmental quality standards (EQS) by the Steering Committee for Substances for various policy purposes. The term EQS is used to designate all legally and non-legally binding standards that are used in Dutch environmental policy and Table 1 shows the correspondence between ERLs and EQSs. The general procedure for deriving ERLs is described in Traas (2001) and Janssen et al. (2004). The various ERLs are: • the negligible concentration (NC) for water, soil, groundwater, sediment and air
• the maximum permissible concentration (MPC) for water, soil, groundwater, sediment and air
• the ecotoxicological serious risk concentration (SRCeco) for water, soil, groundwater and sediment
Table 1. Environmental risk limits (ERLs) and the related environmental quality standards (EQS) that are set by the Dutch government in the Netherlands for the protection of ecosystems.
Description ERL EQS
The NC represents a value causing negligible effects to ecosystems. The NC is derived from the MPC by dividing it by 100. This factor is applied to take into account possible combined effects.
NC
(for air, water, soil, groundwater and sediment)
Target value
(for air, water, soil, groundwater and sediment)
The MPC is the concentration of a substance in air, water, soil or sediment that should protect all species in ecosystems from adverse effects of that substance. A cut-off value is set at the fifth percentile if a species sensitivity distribution of NOECs is used. This is the hazardous
concentration for 5% of the species, the HC5NOEC.
MPC
(for air, water, soil, groundwater and sediment)
MPC
(for air, water and sediment)
The SRCeco is the concentration of a substance in the soil, sediment or groundwater at which functions in these compartments will be seriously affected or are threatened to be negatively affected. This is assumed to occur when 50% of the species and/or 50% of the microbial and enzymatic processes are possibly affected, the HC50NOEC.
SRCeco (for water, soil, groundwater and sediment)
Intervention value after comparison with SRChuman (for soil, sediment and groundwater)
The process of deriving ERLs is shown schematically in Figure 1. ERLs for soil and sediment are calculated for a standardized soil. ERLs for water are reported for dissolved and total concentrations (including a standard amount of suspended matter) and if found significantly different, differentiated to freshwater and saltwater. Each of the ERLs and its corresponding EQS represents a different level of protection, with increasing numerical values in the order of
Target Value < MPC1 < Intervention Value. Each EQS demands a different action when exceeded, as explained elsewhere (VROM, 1994).
Figure 1. The process of deriving Environmental Risk Limits. Above the line the method to derive ERLs is indicated, i.e. MPC, NC and SRCeco. Below the dashed line the MPC, Target Value and
Intervention Value is indicated, set by the Steering Committee for Substances.
1.2
Human risk limits
People can be exposed to substances in soil, air, water or food products. Environmental quality standards are a policy instrument to safeguard against adverse effects of substances. In the Netherlands, the environmental risk limit ‘maximum permissible concentration (MPC)’ should protect both man and ecosystems. This report documents how the human exposure model ‘Humanex’ (Bontje et al., 2005) was used to calculate MPCs for humans and how these are compared to MPCs for ecosystems.
In the past, a human risk characterisation was done for volatile substances where a suspicion existed that human risk could be dominant over ecotoxicological risk (Van de Plassche and Bockting, 1993). For volatile substances it is often assumed that inhalation through air is the predominant route of exposure for man. A previous study has shown that this is not always true (Mennes et al., 1995). Calculating human exposure only from air causes an
underestimation of the exposure. When more routes are added, the total exposure will increase.
In 1995 the Committee on integrated environmental quality objectives (‘Stuurgroep Integrale Normstelling Stoffen’) concluded that multiple routes of exposure should be taken into account when calculating MPCs, so no relevant route of exposure would be ignored. The
1 A complicating factor is that the term MPC is used both as an ERL and as an EQS. For historical reasons, however, the same abbreviation is used.
1.Literature search and evaluation of ecotoxicological data for water, air, soil and sediment
RIVM
Steering Committee
for Substances
Parameters and criteria
3.Calculation of MPC for water, air, soil, sediment and groundwater, SRCecofor water, soil, sediment and
groundwater 2.Data selection
4. Setting of EQS: MPC, target value and intervention value
committee also confirmed that it was necessary to take the partitioning of substances into account when setting maximum permissible concentrations (MPCs) for water, sediment, soil and air (Gezondheidsraad, 1995). This partitioning of substances is implemented by the use of multi-media exposure models (Mackay, 1991). Multi-media models are used to predict
concentrations of substances in the environment.
Currently, human risk limits are integrated with ecotoxicological risk limits in two ways: 1) Intervention Values for contaminated soil, sediment and ground water are based on a
comparison of risk limits for man and ecosystems. The Intervention Values (concentrations) in environmental compartments are based on a calculation from a maximum permissible intake level (MPChuman) and are calculated with the model CSOIL (Van den Berg and Roels, 1995). The final risk limits are determined by the most critical target, man or ecosystems.
2) In the project ‘International and National Environmental Quality Standards for
Substances in the Netherlands’ (INS), risk assessment for humans has only been done for a large group of relatively volatile substances (Van de Plassche and Bockting, 1993). To compare human and ecotoxicological risk limits, the concentration in air was calculated with the multi-media modeSimpleBox (Van de Meent, 1993). The assumption was that air concentrations are in steady-state with the available ecotoxicological risk limits for soil and water. The air concentration that is in steady-state with the ecotoxicological risk limits, is compared to a human-toxicicological risk limit for inhalation. If the tolerable concentration in air (TCA) is exceeded, the risk limit for air should be adjusted
downwards (Van de Plassche and Bockting, 1993; Mennes et al., 1998).
There is a difference in approach between the two frameworks. In the framework of soil remediation, the risk of humans of living on contaminated soil is described by a specific scenario. It takes into account that people are exposed to the soil by way of soil contact, breathing in air that evaporates from the soil, and some part of the diet (vegetables and root crops) is home-grown on contaminated soil. This scenario is significantly different from the one that is used in the context of INS. In the latter framework, the risk is not due to living on contaminated soil, but on chronic, diffuse background exposure to the total of most relevant exposure routes. Because of the potential of substances to partition over different
environmental phases, this exposure can be by way of food, drinking water, air, soil contact etc. The basic assumption behind this calculation, as implemented in EUSES, is that all compartments are in steady-state at a low, background level, and that the contaminant can reside in every compartment that is a potential route of exposure. In the EU framework for risk assessment of new and existing substances, this is referred to as ‘indirect human exposure’, as opposed to direct exposure e.g. in the workplace. This report documents the current method to calculate human risk limits for (background) multi-route exposure from a contaminated environment.
1.3
Exposure models
Contaminants may accumulate in the environment and eventually enter the human food chain. To assess the exposure of a person through food one has to actually measure the concentration of the contaminant for every single item of food and measure total food intake. This is not feasible for the purpose of general risk assessment; therefore more generic human exposure models have been developed.
To make an exposure assessment, estimates are used for an average person. To estimate parameters such as average body weight and other biophysical parameters statistics are used.
The European Union has developed the computer program EUSES (European Union System for the Evaluation of Substances) to assess the exposure of Europeans to contaminants in the environment (Lijzen and Rikken, 2004).
AIR
WATER
SED
SOIL 1 SOIL 2 SOIL 3
GROUNDWATER AIR
WATER
SED
SOIL 1 SOIL 2 SOIL 3
GROUNDWATER
Figure 2. Environmental compartments considered in EUSES (EC, 1996).
The exposure to a given compound can be calculated. When actual measurements of the concentrations in the compartments such as air, water and soil are lacking, EUSES will use production volumes, compound properties and emission estimates to calculate likely concentrations in the environment. The predicted environmental concentrations (PECs) are then used to calculate the exposure of humans from air, drinking water, meat, milk, fish and crops.
To estimate the exposure of a person living on a polluted site, a risk assessment needs to be performed. Several human exposure models have been developed that often serve different goals. For an overview, see Swartjes (2002). In the Netherlands, the CSOIL-model was developed to estimate the exposure of humans who live on contaminated soil. This model includes routes not present in EUSES: exposure from home grown crops, soil ingestion, dust inhalation, dermal exposure to dust, inhalation of contaminants, evaporated from the soil or ground water, permeation of contaminants from the pore water into the drinking water and the exposure from showering with polluted drinking water.
By combining the CSOIL and EUSES model a comprehensive model has been built to describe multi-media exposure. Existing literature on this issue has been taken into account (Rikken et al., 2001; Rikken en Lijzen, 2004). This multi-media exposure model calculates human exposure and is named INS-Humanex. A companion report gives full details on the Humanex model and how it relates to both EUSES and CSOIL (Bontje et al., 2005). Table 2 and Figure 3 show the exposure routes incorporated in Humanex. Consumption patterns in Humanex are based on the average diet in the Netherlands, instead of the average European diet as incorporated in EUSES (Bontje et al., 2005).
1.4
Integration of environmental risk limits
Ecotoxicological risk limits for several compounds were derived in previous reports (Verbruggen et al., 2005; Tables 1-4; EU-RAR (EC, 2002) for MTBE). Results from this study will be used in the comparison between risk limits for human and ecological endpoints. Environmental concentrations related to human risk of these substances is calculated using the Humanex model as described above.
Table 2. Routes of exposure in the Humanex model, compared to EUSES and CSOIL.
EUSES-model CSOIL-model Humanex-model
Air n.i. Air
n.i. Inhalation of contaminant evaporated from the soil Equal to outside air Differentiation between inside and outside air. No differentiation
Meat1 n.i. Meat
Milk2 n.i. Milk
Fish n.i. Fish
Crops: root, leaf Home grown crops: root, leaf Crops: root, leaf Drinking water
purification n.i. Drinking water purification
n.i. Permeation of contaminant from the soil into the
drinking water Permeation of contaminant from the soil into the drinking water n.i. Showering with drinking water Showering with drinking water
n.i. Soil ingestion Soil ingestion
n.i. Dust inhalation Dust inhalation
n.i. Dermal exposure to dust Dermal exposure to dust
n.i. = not implemented, 1 Meat = all meat sources, 2 Milk = all dairy products
Human risk calculations starts from predicted regional environmental concentrations (PECs) calculated in EUSES. The compartments considered in EUSES are shown in Figure 1.3.
Human
Cow Inhale
Ingest Dermal
Shower Fish Root Leaf
Permeation Drinking water
Treatment
Air
Surface Water
Pore Water
Soil
Figure 3. All routes of exposure in the Humanex model. Cattle includes meat and milk.
To calculate PECs, physico-chemical properties of substances and production information (industry and use category) are needed as input in EUSES.
The PECs, substance properties, and data about human exposure are combined into a set of equations in the Humanex model (Bontje et al., 2005). Humanex calculates contaminant concentration ratios in e.g. fish, cows, drinking water, air, crops and dust. These contaminant concentration ratios in human exposure media are subsequently used to calculate exposure
ratios for direct and indirect human exposure (Figure 3), and the corresponding
concentrations in the environmental media (water, air, soil, sediment). The human risk limits are compared to ecotoxicological risk limits, based on the concentrations in each
environmental compartment (Figure 4).
Calculate fate (EUSES)
Calculate human risk limits (Humanex)
Calculate ecological risk limits
Compare risk limits, Choose most critical
ERLs (MPC, NC) for soil, water, air, sediment Calculate fate (EUSES)
Calculate human risk limits (Humanex)
Calculate ecological risk limits
Compare risk limits, Choose most critical
ERLs (MPC, NC) for soil, water, air, sediment
Figure 4. Diagram of the derivation of environmental risk limits (ERLs), based on integration of human and ecological risk.
A comparison of both types of risk limits will indicate the most sensitive target (humans or ecosytems) that will determine the final risk limit in each compartment. The compounds studied are shown in Table 3. These compounds have been choosen because of there physical-chemical properties which suggest relevant human exposure. that indicate risks to both humans and the environment, but to which degree is yet unknown.
Table 3. Compounds for which both human and ecotoxicological risk limits are derived and compared in this report. Ecotoxicological risk limits are reported in the EU-RAR for MTBE (EC, 2002) and
Verbruggen et al., 2005 (all other compounds).
CAS Compound 71-36-3 1-butanol 123-86-4 n-butyl acetate 108-91-8 cyclohexylamine 111-46-6 diethylene glyol 141-78-6 ethyl acetate 107-21-1 ethylene glycol 67-56-1 methanol
78-93-3 methyl ethyl ketone
1634-04-4 methyl tert-butyl ether
75-25-2 tribromomethane 102-71-6 triethanolamine
2.
Calculating Maximum Permissible Concentrations
with Humanex
2.1
Background
The Humanex model calculates the exposure of humans to a substance, based on a
combination of exposure routes from EUSES (EC, 1996) and CSOIL (Otte et al., 2001). The full procedure and details can be found in Bontje et al. (2005).
First, regional predicted environmental concentrations (PECREG) are calculated with EUSES. The substance properties and the relative emissions to different compartments (as determined by the industrial and use categories) determine how the substance partitions over the different environmental compartments.
The regional PECs calculated by EUSES are used as input in Humanex. The Humanex model only needs the relative importance of exposure routes. This is determined by the concentration ratios between the different environmental compartments (Van de Meent and De Bruijn, 1995). Therefore, the exact concentrations do not matter, but only the ratios between the different compartments and thus the PECREG can be based on a standard emission.
Compound pr operties Emission and use pattern Emission Tables SimpleBox Predicted Environmental Concentrations, at Regional scale: Air, Porewater, Soil, Surface water (dissolved)
HUMANEX
Ratio MRE /
Tolerable Daily Intake
Correction: TCA = MPCair Maximal Permissible Concentrations
Multi-route exposure (MRE)
Check: TCA > MPCair Yes No Critical MPC: MPCECO or MPCHUMAN MPC Human toxicol. data
EUSES
Figure 5. Diagram of the flow of information and decisions in the Humanex model. Humanex needs input from the EUSES model (indicated by the dashed box). TCA = Tolerable Concentration in Air; MPC = Maximum Permissible Concentration.
Second, the relative importance of exposure routes to humans is calculated from the PECREG as calculated by EUSES. The Multi-Route Exposure Estimate (MRE, [mg/day]) for humans is calculated from the standard emission (Figure 5, Table 4). The model then compares the MRE to the tolerable daily intake (TDI) of humans.
The third and final step in the calculation is based on the ratio of the TDI and the MRE. The concentrations (PECREG) must be proportionally adjusted until the MRE is equal to the TDI. When the MRE is equal to the TDI, the adjusted concentrations represent the MPChuman for each compartment. Thus, the final MPCs can be calculated based on the ratio of the TDI and the MRE:
MPChuman, soil = PECREGsoil * TDI/MRE MPChuman, air = PECREGair * TDI/MRE MPChuman, surface water = PECREGsurface water* TDI/MRE MPChuman, pore water = PECREGpore water* TDI/MRE
MPChuman values are calculated for diethylene glycol (discussed later), to illustrate the mechanism for calculating MPCs as explained above (Table 4). The initial EUSES estimates are listed first, and are recalculated into the MPCs at the bottom of the table, based on the TDI/MRE ratio.
Table 4. Example MPCHUMAN calculations for diethylene glycol. PECREG is initially based on a
standard emission (100,000 t/a) and adjusted with the TDI/MRE ratio.
EUSES derived PECREGs for
the compartments
PECREG of the
compartment
Conc. Units Water – initial estimate Surface water 9.46E+01 µg/L
Air – initial estimate Air 5.10E-05 µg/m3
Agricultural soil – initial est. Soil 1.63E-01 µg/kg wwt Sediment – initial estimate Sediment 5.86E+01 µg/kg wwt Agricultural pore water –
initial estimate Pore water 1.21E+00 µg/L
Calculated Total Exposure MRE 2.73E+00 µg /kg bw/d Tolerable Daily Intake
Tolerable Conc. In Air TDI TCA 4.00E+02 N.A. µg /kg bw/d µg/m3
TDI/MRE 1.46E+02 -/-
MPChuman, surface water 1.39E+04 µg/L MPChuman, air 7.47E-03 µg/m3
MPChuman, soil * 7.82E+01 µg/kg dwt MPChuman, sediment * 2.63E+04 µg/kg dwt Maximum Permissible
Concentrations for adult humans
MPChuman, pore water 1.77E+02 µg/L * Includes conversion from wwt to dwt according to Janssen et al. (2004).
2.2
Correction for the Tolerable Concentration in Air
In some cases, not only the TDI is available but also a Tolerable Concentration in Air (TCA). The TCA only concerns exposure by inhalation while the TDI is based on total dose received. These two values may be harmonized on the same dose basis, but this is not always known or possible. In such cases, a separate check on exceeding the TCA is performed. If the
MPCair > TCA, the previous calculated MPCair is replaced by the value of the TCA (Table 5). In this example, the MPC for human risk was already calculated according to the procedure in section 2.1.
Table 5. Correction when MPCair is higher than the TCA, illustrated for tetrahydrothiophene. Tetrahydrothiophene Units
MPCsurface water 9.95E+01 µg/L
MPCair 2.11E+03 µg/m3
Maximum Permissible Concentrations for adult
humans MPCsoil 4.71E+00 µg/kg dwt
MPCpore water 4.87E+00 µg/L
TCA for tetrahydrothiophene 1.80E+2 µg/m3
MPCair higher than TCA? yes -/-
MCPair = TCA MPCair 1.8E+2 µg/m3
2.3
Integrating human and ecological risk limits
Humanex is based on multi-compartmental exposure. Humanex calculates maximum
permissible concentrations (MPCs) in all compartments, corresponding to a human exposure that equals the maximum allowed dose or exposure. The maximum exposure is based on the acceptable daily intake (TDI) or tolerable concentrations in air (TCA) values as described below. If human exposure is less critical than exposure of ecosystems, the ecotoxicological MPC is also protective of humans. It is possible that some or all ecotoxicological MPCs are stricter than the corresponding human MPCs. For the example substance of tribromomethane (Table 6), the MPCeco is lower than the MPChuman for the surface water compartment. For air, no MPC is available based on ecotoxicological data.
Table 6. Example calculation of critical MPCs for tribromomethane (CAS nr. 75-25-2).
Surface water
μg/L Groundwater μg/L μg/kg dwt Soil μg/mAir 3
Eco 96 96 1061 -
Human 214 38 308 55
Ratio Eco/Human 0.45 2.5 3.4 -
Critical MPC 96 38 308 55
It is proposed to set the critical MPC as the final MPC for a compartment, to protect both ecosystems and humans from adverse effects of pollutants. This is similar to the reasoning in the framework of soil remediation (Van den Berg and Roels, 1995), where Serious Risk Concentrations (SRCs) are based on the most critical of human and ecotoxicological risk limits.
3.
Integrating MPC
humanwith MPC
eco3.1
Introduction
How humans are exposed to a substance is partly determined by the distribution of a substance over the different environmental compartments and food sources linked to those compartments (see Bontje et al., 2005). To calculate the relative contribution of exposure from the different environmental compartments, the physico-chemical parameters of a substance are needed as input for the model EUSES.
EUSES calculates the relative importance of exposure routes, as determined by the Predicted Environmental Concentrations for the compartments air, surface water, pore water and soil Another input for this calculation is information on the manufacture and use of a compound, to determine industry and use category.
This information was sourced from the internet and reviewed based on expert judgement (Van der Poel, pers. comm.). If no reliable information on type of use and emission characteristics is available, the EUSES worst-case option of ‘wide dispersive use’ is chosen.
All physicochemical parameters for the compounds are taken from the report on
ecotoxicological risk limits for these substances (Verbruggen et al., 2005), and the EU-risk assessment report for MTBE (EC, 2002). Settings for EUSES are given in Appendix 2. The human risk assessment compares the total intake from all exposure routes with previously derived TDI and TCA values. These were not derived in this report, but were taken from previously published sources. TDI and TCA values are summarized in Appendix 3.
MPCeco values for surface water and soil (dry weight) are taken from the companion RIVM report (Verbruggen et al., 2005), except for MTBE (from EU-RAR: EC, 2002). Pore water is assumed to have the same MPCeco as surface water. Further, calculated Maximum Permissible Concentrations based on the Humanex model (MPChuman) are for human adults and not
adjusted for childhood years. The MPCs calculated in this chapter are based on all routes of exposure as presented in the introduction. The MPChuman values calculated with Humanex could be in conflict with MPCeco or vice versa. The most critical MPC is identified and reported.
For each substance, a table is given that summarizes the main information for each substance. The TDI and the TCA (Appendix 3) are reported, as well as the MPChuman that is calculated with Humanex for the different compartments. The MPCeco is shown and compared to the MPChuman, after which the most critical MPC is identified.
The contribution of the main compartments (surface water, ground water, air or soil) to human exposure is given as a percentage of total exposure. It should be realized that ingestion of e.g. leaf crops can be due to contaminant taken up by the plant either from air, from roots or both. The most important individual exposure route (cf. Figure 3) is shown at the bottom of the summary table. This percentage can be lower than the total percentage of the most
3.2
Integration of risk limits
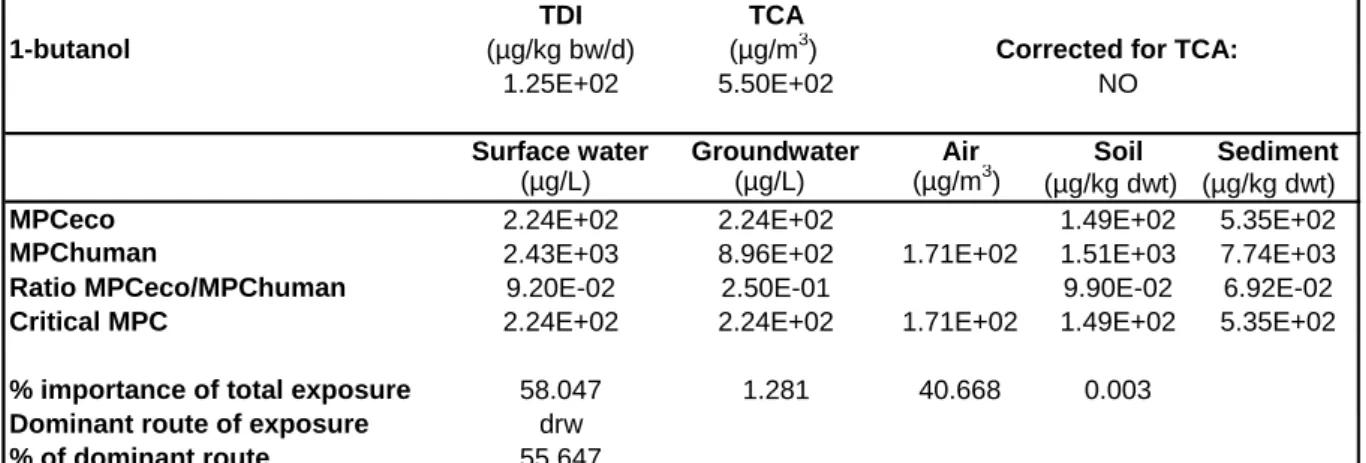
3.2.1 1-Butanol
O
H CH3
Use, emission pattern and exposure
The largest uses of 1-butanol are industries that make butyl acrylate, meth-acrylate and other related chemicals. 1-Butanol is also added to solvents and detergent formulations. These use patterns are input to calculate environmental distribution of 1-butanol with EUSES
(Appendix 2), using the substance properties from Appendix 1. 1-butanol is both highly volatile and soluble. The model results show, that the main routes of exposure to humans are surface water and air (Table 7). The main exposure routes of humans are drinking water (drw, 55.7%) and showering to a total of 58.1% and air (40.6%). Negligible contributions come from soil and root crops that take up the substance from pore water.
Table 7. MPC values for 1-butanol, and main routes of exposure to humans.
MPCs
The ecotoxicological MPC values for 1-butanol were derived previously. The Humanex calculations show that relatively high MPChuman values are estimated, as determined by total exposure from environment and food. For all compartments, the MPCeco values are stricter, indicating that ecological risk is dominant over human risk for 1-butanol.
The MPCwater is determined by the MPCeco, and therefore, the MPCwater does not need adjustment and is 224 µg/L. The critical MPC groundwater is determined by the MPCeco (set equal to the MPC for water, at 224 µg/L).
The MPCair is determined by human exposure because no ecotoxicity data are available, and is calculated by Humanex based on the TDI and the distribution of 1-butanol over the environmental compartments. The MPCair is set at 171 µg/m3. The critical MPCsoil is
149 µg/kg dry wt and is determined by ecological risk. This value is based on equilibrium
partitioning (EqP) between water and soil. The critical MPCsediment is determined by EqP as well and is based on ecological risk (535 µg/kg dry wt).
TDI TCA
1-butanol (µg/kg bw/d) (µg/m3) Corrected for TCA:
1.25E+02 5.50E+02 NO
Surface water Groundwater Air Soil Sediment
(µg/L) (µg/L) (µg/m3) (µg/kg dwt) (µg/kg dwt)
MPCeco 2.24E+02 2.24E+02 1.49E+02 5.35E+02
MPChuman 2.43E+03 8.96E+02 1.71E+02 1.51E+03 7.74E+03
Ratio MPCeco/MPChuman 9.20E-02 2.50E-01 9.90E-02 6.92E-02
Critical MPC 2.24E+02 2.24E+02 1.71E+02 1.49E+02 5.35E+02
% importance of total exposure 58.047 1.281 40.668 0.003
Dominant route of exposure drw
3.2.2 n-Butyl acetate
O O CH3
CH3
Use, emission pattern and exposure
n-Butyl acetate is used as a precursor for polyethylene terephthalate (PET) plastic production
and it is used as a solvent in the chemical and electronic industry. These use patterns are used to calculate environmental distribution of n-butyl acetate (Appendix 2), using the substance properties from Appendix 1.
Table 8. MPC values for n-butyl acetate, and main routes of exposure to humans.
The MPCeco values for n-butyl acetate were derived in the companion report. The Humanex calculations (Table 8) show that the current risk limit for humans (TDI) correspond with MPC levels that are higher than those for ecosystems. Thus, MPCs for all compartments are
determined by the ecotoxicological risk. The main exposure route of humans estimated by Humanex is air (93.5 %), drinking water and showering (6.4 %), due to the high vapour pressure and solubility of n-butyl acetate.
MPCs and integration
No additional calculations are necessary (all MPCeco/MPChuman ratios are < 1), and MPCs are determined by ecological risk in all cases except for air. This leads to the following integrated MPCs for n-butyl acetate:
The MPCwater is 18 μg/L, the MPCgroundwater is 18 μg/L, the MPCair is 653 μg/m3 the
MPCsoil is 96 μg/ kg dry wt and the MPCsediment is 127 µg/ kg dry wt.
3.2.3 Cyclohexylamine
NH2
Use, emission pattern and exposure
Cyclohexylamine is mostly used as a vulcanising agent, corrosion inhibitor and as an intermediate in the chemical industry for a diversity of chemicals. MPCs and exposure to
TDI TCA
n-butyl acetate (µg/kg bw/d) (µg/m3) Corrected for TCA:
2.00E+02 1.00E+03 NO
Surface water Groundwater Air Soil Sediment
(µg/L) (µg/L) (µg/m3) (µg/kg dwt) (µg/kg dwt)
MPC eco 1.80E+01 1.80E+01 9.57E+01 1.27E+02
MPC human 3.58E+02 1.09E+02 6.53E+02 5.93E+02 2.82E+03
Ratio MPC eco/MPC human 5.02E-02 1.65E-01 1.61E-01 4.49E-02
Critical MPC 1.80E+01 1.80E+01 6.53E+02 9.57E+01 1.27+02
% importance of total exposure 6.431 0.109 93.459 0.001
Dominant route of exposure air
humans is shown in Table 9. Most of human exposure (73.5%) originates from surface water through drinking water (including showering) and fish consumption. Exposure through air is not a main route of exposure, but substantial (25%). The MPCeco is more stringent than MPChuman by four orders of magnitude. The missing compartments are integrated by the distribution pattern calculated by EUSES (Appendix 1).
Table 9. MPC values for cyclohexylamine, and main routes of exposure to humans.
MPCs and harmonisation
For cyclohexylamine, all MPCs except air are determined by ecological risk.
The MPCwater is determined by the MPCeco and is 0.2 μg/L. The MPCgroundwater is equal to the MPCeco for water, 0.2 μg/L. The MPChuman for airis 8710 μg/m3.
The MPCsoil (0.81 μg/kg dry wt) and the MPCsediment (1.2 μg/kg dry wt) are determined by ecological risk, and are based on equilibrium partitioning (EqP) between water and soil or sediment.
Since all MPCs except for air are determined by the MPCeco, and much lower than the corresponding MPChuman, it can be expected that a potential conflict exists between the MPCeco, air and the MPChuman, air. The MPCeco, air is not calculated from ecotoxicity studies, but similar to MPCs for sediment, it can be calculated based on partitioning coefficients. The KP,air-water is calculated by EUSES from the ratio of concentrations in air to surface water (32.6 m3/m3). The MPC
eco, air is then 36 ng/m3, much lower than the MPChuman, air of
8710 μg/m3. In this case, the critical MPCair is clearly determined by the ecotoxicological value.
In the EU, intercompartmental harmonisation is not considered. This viewpoint is now also integrated in the current national strategy for risk limit derivation. In this case, due to the very large difference (6 orders of magnitude) between MPCeco and MPChuman, it can be expected that concentrations at the level of the MPChuman, air could lead to exceeding MPCeco values in water or soil due to intercompartmental exchange. However, if such concentrations will ever occur cannot be predicted in advance. The relevance of this process depends on local factors such as the magnitude, scale (local or regional) and duration of the hypothetical pollution event.
TDI TCA
cyclohexylamine (µg/kg bw/d) (µg/m3) Corrected for TCA:
1.10E+04 N.A. NO
Surface water Groundwater Air Soil Sediment
(µg/L) (µg/L) (µg/m3) (µg/kg dwt) (µg/kg dwt)
MPC eco 2.00E-01 2.00E-01 8.12E-01 1.16E+00
MPC human 2.67E+05 9.46E+04 8.71E+03 1.47E+05 8.17E+05
Ratio MPC eco/MPC human 7.49E-07 2.11E-06 5.52E-06 1.42E-06
Critical MPC 2.00E-01 2.00E-01 8.71E+03 8.12E-01 1.16E+00
% importance of total exposure 73.495 1.616 24.886 0.003
Dominant route of exposure drw
3.2.4 Diethylene glycol
O O
H OH
Use, emission pattern and exposure
Diethylene glycol (DEG) is used for many applications such as anti-freezing agent,
intermediate in the chemical industry, pH-regulating agent, fillers, solvents, etc. The TDI for DEG is a sum-TDI that includes DEG and ethylene glycol.
Exposure is mainly through the drinking water (drw) and very little exposure derived from the plant (Table 10). Plants take up DEG mainly from the air, but this is insignificant for total exposure. The MPChuman is almost a hundred times stricter than the MPCeco in case of groundwater and soil.
Table 10. MPC values for diethylene glycol and main routes of exposure to humans.
MPCs
In the case of diethylene glycol, all MPCs are determined by the risk for human health. The
MPCwater is 14 mg/L, the MPCgroundwater is 177 μg/L, the MPCair is 7.5 ng/m3, the MPCsoil is 78.2 μg/ kg dry wt, and the MPCsediment is 26.3 mg/ kg dry wt.
3.2.5 Ethyl acetate
O O CH3 C H3Use, emission pattern and exposure
Ethyl acetate is used as solvent for paints and as solvent in the chemical industry and a limited amount is produced as a foodstuff additive. Based on the Humanex calculations
(Table 11), 89% of the total exposure originates from the air compartment through inhalation, while the remaining exposure is derived from surface water, by way of drinking water (9.7%) and showering (1.4%).
TDI TCA
diethylene glycol (µg/kg bw/d) (µg/m3) Corrected for TCA:
4.00E+02 N.A. NO
Surface water Groundwater Air Soil Sediment
(µg/L) (µg/L) (µg/m3) (µg/kg dwt) (µg/kg dwt)
MPC eco 1.47E+04 1.47E+04 6.62E+03 3.20E+04
MPC human 1.39E+04 1.77E+02 7.47E-03 7.82E+01 2.63E+04
Ratio MPC eco/MPC human 1.06E00 8.32E+01 8.47E+01 1.22E+00
Critical MPC 1.39E+04 1.77E+02 7.47E-03 7.82E+01 2.63E+04
% importance of total exposure 99.796 0.166 0.038 0.000
Dominant route of exposure drw
Table 11. MPC values for ethyl acetate and main routes of exposure to humans.
MPCs
No additional calculations are necessary because all MPCeco/MPChuman ratios are < 1. MPCs are determined by ecological risk in all cases except air. This leads to the following MPCs for ethyl acetate:
The MPCwater is 107 µg/L, the MPCgroundwater is 107 μg/L, the MPCair is 2.8 mg/m3 the
MPCsoil is 204 μg/ kg dry wt and the MPCsediment is 389 mg/ kg dry wt.
3.2.6 Ethylene glycol
O H
OH
Use, emission pattern and exposure
Ethylene glycol (EG) is used as an intermediate in the chemical industry, as anti freeze and as a solvent. Humanex calculations predict that human exposure is mainly by drinking water (drw; 97%) due to its high solubility and related high concentration in the surface water and relative low concentrations in the other compartments (Table 12).
Table 12. MPC values for ethylene glycol and main routes of exposure to humans. Drw=drinking water.
TDI TCA
ethyl acetate (µg/kg bw/d) (µg/m3) Corrected for TCA:
9.00E+02 4.20E+03 NO
Surface water Groundwater Air Soil Sediment
(µg/L) (µg/L) (µg/m3) (µg/kg dwt) (µg/kg dwt)
MPC eco 1.07E+02 1.07E+02 2.04E+02 3.89E+02
MPC human 3.04E+03 6.64E+02 2.79E+03 1.24E+03 1.03E+04
Ratio MPC eco/MPC human 3.53E-02 1.62E-01 1.64E-01 3.77E-02
Critical MPC 1.07E+02 1.07E+02 2.79E+03 2.04E+02 3.89E+02
% importance of total exposure 11.093 0.131 88.775 0.000
Dominant route of exposure air
% of dominant route 88.563
TDI TCA
ethylene glycol (µg/kg bw/d) (µg/m3) Corrected for TCA:
4.00E+02 N.A. NO
Surface water Groundwater Air Soil Sediment
(µg/L) (µg/L) (µg/m3) (µg/kg dwt) (µ/kg dwt)
MPC eco 2.00E+05 2.00E+05 8.94E+04 4.34E+05
MPC human 1.36E+04 1.72E+03 2.25E+00 7.55E+02 2.57E+04
Ratio MPC eco/MPC human 1.47E+01 1.16E+02 1.18E+02 1.69E+01
Critical MPC 1.36E+04 1.72E+03 2.25E+00 7.55E+02 2.57E+04
% importance of total exposure 98.108 0.882 1.009 0.000
Dominant route of exposure drw
MPCs
The TDI for EG is a sum-TDI that includes DEG and ethylene glycol. Similar to diethylene glycol, all MPCs for ethylene glycol are determined by the risk for human health. This leads to the following MPCs for ethylene glycol:
The MPCwater is 13.6 mg/L, the MPCgroundwater is 1.72 mg/L, the MPCair is 2.25 μg/m3, the
MPCsoil is 755 μg/ kg dry wt and the MPCsediment is 25.7 mg/kg dry wt.
3.2.7 Methanol
HO-CH3
Use, emission pattern and exposure
Methanol is used as a solvent for paints and chemical products in the industry and is mostly used as a precursor of formaldehyde. It is also used as an alternative non-fossil fuel. The relatively high partitioning to air explains the main exposure through air by inhalation of almost 47 % (Table 13). Exposure from leaf crops also originates indirectly from the air. Another important exposure pathway is by way of drinking water, because EUSES contains a relatively worst-case purification module.
Table 13. MPC values for methanol and main routes of exposure to humans.
MPCs and integration
All MPCeco/MPChuman ratios are < 1, indicating that ecological risk dominates the calculations for the MPC. The only compartment determined by human risk is air. This leads to the following integrated MPCs for methanol:
The MPCwater is 190 µg/L, the MPCgroundwater is 190 µg/L, the MPCair is 816 μg/m3 the
MPCsoil is 97.9 µg/ kg dry wt and the MPCsediment is 426 µg/ kg dry wt.
TDI TCA
methanol (µg/kg bw/d) (µg/m3) Corrected for TCA:
5.00E+02 1.10E+03 NO
Surface water Groundwater Air Soil Sediment
(µg/L) (µg/L) (µg/m3) (µg/kg dwt) (µg/kg dwt)
MPC eco 1.90E+02 1.90E+02 9.79E+01 4.26E+02
MPC human 8.06E+03 8.06E+03 8.16E+02 4.04E+03 1.58E+04
Ratio MPC eco/MPC human 2.36E-02 2.36E-02 2.42E-02 2.69E-02
Critical MPC 1.90E+02 1.90E+02 8.16E+02 9.79E+01 4.26E+02
% importance of total exposure 47.119 49.541 50.099 0.002
Dominant route of exposure air
3.2.8 Methyl ethyl ketone
O
CH3
CH3 Use, emission pattern and exposure
Methyl ethyl ketone (MEK) is largely used in professional paints and ‘do-it-yourself’-paints, other applications are ink-solvents, intermediate in the chemical industry for e.g. organic synthesis and production of magnetic tapes. Often MEK is a by-product of acetic acid
production. Again, high vapour pressure and high solubility combine into an exposure pattern through air (85%) and drinking water (from treated surface water; 12.8%, not shown in Table 14).
Table 14. MPC values for methy ethyl ketone and main routes of exposure to humans.
MPCs
MPCeco/MPChuman ratios all >1. This means that the risk for human health dominates for MEK. However, the values of the two types of risk limits are very similar.
This leads to the following MPCs for methyl-ethyl ketone:
The MPCwater is 850 μg/L, the MPCgroundwater is 412 μg/L, the MPCair is 566 μg/m3, the
MPCsoil is 732 μg / kg dry wt and the MPCsediment is 2.81 mg/ kg dry wt.
TDI TCA
methyl ethyl ketone (µg/kg bw/d) (µg/m3) Corrected for TCA:
1.90E+02 8.75E+02 NO
Surface water Groundwater Air Soil Sediment
(µg/L) (µg/L) (µg/m3) (µg/kg dwt) (µ/kg dwt)
MPC eco 1.20E+03 1.20E+03 2.21E+03 4.27E+03
MPC human 8.50E+02 4.12E+02 5.66E+02 7.32E+02 2.81E+03
Ratio MPC eco/MPC human 1.41E+00 2.91E+00 3.01E+00 1.52E+00
Critical MPC 8.50E+02 4.12E+02 5.66E+02 7.32E+02 2.81E+03
% importance of total exposure 13.918 0.379 85.702 0.001
Dominant route of exposure air
3.2.9 Methyl tert-butyl ether
O CH3 CH3 C H3 CH3Use, emission pattern and exposure
Methyl tert-butyl ether (MTBE) is mainly used as a fuel additive. It serves as an
anti-knocking agent and makes fuel burn more efficient. Negligible applications of MTBE are in the production of pharmaceuticals and production of isobutene. Exposure is mainly through air (79%), drinking water (17%) and some by showering (about 4%). Table 15 shows calculation details.
Table 15. MPC values for methy tert-butyl ether and main routes of exposure to humans.
Critical MPCs and integration
In the EU-RAR, the PNEC for MTBE is based on the lowest NOEC for Mysidopsis bahia with an assessment factor of 10. This PNEC of 2.6 mg/L is also the MPCwater. The MPCsoil is based on the MPCwater of 2.6 mg/L and is calculated at 0.77 mg/kg ww for the EU standard soil. The conversion to the Dutch standard and to dry weight yields an MPCsoil of 2.4 mg/kg dw. The MPCsediment is based on the EU-RAR value of 2.05 mg/kg ww. Here, the conversion for dry weight is a factor of 2.6 and the organic carbon conversion is 1.18, which results in an MPCsediment of 6.29 mg/kg dw.
The MPChuman is the limiting ERL for the integrated MPC to protect both humans and ecosystems. This leads to the following integrated MPC values:
The MPCwater is 1.8 mg/L, the MPCgroundwater is 56 μg/L, the MPCair is 831 μg/m3 the
MPCsoil is 73.6 μg/ kg dry wt and the MPCsediment is 4.5 mg/ kg dry wt.
Comparison to Intervention values for MTBE
In the report by Swartjes et al. (2004), risk limits were derived for MTBE, based on the risk assessment concept for intervention values (Van den Berg and Roels, 1995). As detailed before, these limits are protective of situations where people are in contact with contaminated soil, either directly (ingestion) or indirectly (through food, inhalation etc.). The Humanex risk concept is based on the (worst-case) situation, where a substance is emitted in the
environment and a steady-state concentration is reached for all compartments. It is also assumed that humans are exposed to this contaminated environment by all relevant routes, including food.
TDI TCA
methyl tert-butyl ether (µg/kg bw/d) (µg/m3) Corrected for TCA:
3.00E+02 2.60E+03 NO
Surface water Groundwater Air Soil Sediment
(µg/L) (µ/L) (µg/m3) (µg/kg dwt) (µg/kg dwt)
MPC eco 2.60E+03 2.60E+03 2.40E+03 6.29E+03
MPC human 1.79E+03 5.60E+01 8.31E+02 7.36E+01 4.49E+03
Ratio MPC eco/MPC human 1.45E+00 4.64E+01 3.26E+01 1.40E+00
Critical MPC 1.79E+03 5.60E+01 8.31E+02 7.36E+01 4.49E+03
% importance of total exposure 20.798 0.034 79.168 0.000
Dominant route of exposure air
The reported risk limit for soil contamination is 221 mg/kg dry wt. This is a factor of 5 higher than the MPChuman, soil at 73.6 µg/kg dry wt. This serves to illustrate that the concept of multi-media exposure, which leads to a summation of exposure routes to humans, is rather different from the CSOIL exposure concept.
For groundwater and surface water as a source for drinking water, the proposed risk limit for intervention values is 9420 µg/L. The MPChuman, water is in the same order of magnitude, while the MPChuman, groundwater calculated with Humanex is much lower at 56 µg/L.
3.2.10 Tribromomethane
Br
Br
Br Use, emission pattern and exposure
Tribromomethane, also known as bromoform, is used on a small scale mainly for in routine procedures to separate minerals, in laboratories, and in the electronics industry.
Tribromomethane is quite volatile and exposure is mainly through air (56.7%). Its high solubility explains the high concentration in groundwater / drinking water. Showering causes additional exposure (about 6%, not shown in Table 16).
Table 16. MPC values for tribromomethane and main routes of exposure to humans.
Critical MPCs and integration
Ecological risk dominates for tribromomethane for water and sediment. For groundwater and soil the risks for human health determine the MPC.
The MPCwater is equal to the MPCeco and is 96.0 μg/L. The critical MPCgroundwater is determined by the MPChuman and is 37.6 μg/L. The critical MPCair is determined by human exposure and is calculated at 39.7 μg/m3. The critical MPC
soil of 308 μg/kg dry wt is determined by risk for human health. The critical MPCsediment is determined by ecological risk, and is 1.23 mg/kg dry wt, and is based on equilibrium partitioning (EqP) between water and soil.
TDI TCA
tribromomethane (µg/kg bw/d) (µg/m3) Corrected for TCA:
2.00E+01 1.00E+02 NO
Surface water Groundwater Air Soil Sediment
(µg/L) (µg/L) (µg/m3) (µg/kg dwt) (µg/kg dwt)
MPC eco 9.60E+01 9.60E+01 1.06E+03 1.23E+03
MPC human 2.14E+02 3.76E+01 3.97E+01 3.08E+02 2.26E+03
Ratio MPC eco/MPC human 4.49E-01 2.55E+00 3.44E+00 5.42E-01
Critical MPC 9.60E+01 3.76E+01 3.97E+01 3.08E+02 1.23E+03
% importance of total exposure 42.513 0.566 56.917 0.004
Dominant route of exposure air
3.2.11 Triethanolamine
O H N OH OHUse, emission pattern and exposure
Triethanolamine contributes 15 to 20% of the total world production of ethanol amines. It is used as detergent, ingredient of cosmetics and fabric softener and is an intermediate in the production of ester quaternaries. Outside Europe triethanolamine is also used as antifreeze. Exposure to this compound is mainly from surface water, treated for drinking water (97%). Ecological risk dominates for this substance (Table 17).
Table 17. MPC values for triethanolamine and main routes of exposure to humans.
Critical MPCs and integration
The MPCwater is determined by the MPCeco and is calculated at 320 µg/L. The critical
MPCgroundwater is also determined by the MPCeco, set equal to the MPC for water, 320 µg/L. The critical MPCair is 0.12 μg/m3 and determined by human exposure. No ecotoxicity data are available. The critical MPCsoil of 185 μg/kg dry wt is determined by ecological risk, and is based on equilibrium partitioning (EqP) between water and soil.
The critical MPCsediment is 737 μg/kg dry wt.
TDI TCA
triethanolamine (µg/kg bw/d) (µg/m3) Corrected for TCA:
1.25E+04 5.00E+03 NO
Surface water Groundwater Air Soil Sediment
(µg/L) (µg/L) (µg/m3) (µg/kg dwt) (µ/kg dwt)
MPC eco 3.20E+02 3.20E+02 1.85E+02 7.37E+02
MPC human 4.25E+05 4.61E+04 1.24E-01 2.60E+04 8.60E+05
Ratio MPC eco/MPC human 7.52E-04 6.94E-03 7.12E-03 8.57E-04
Critical MPC 3.20E+02 3.20E+02 1.24E-01 1.85E+02 7.37E+02
% importance of total exposure 98.015 1.949 0.035 0.000
Dominant route of exposure drw
4.
Overview of risk limits
4.1
ERLs for water
Table 18. Overview of SRC and MPC values for water. All MPChuman values are calculated using the
Humanex model. Compound SRCeco (mg/L) MPCeco (µg/L) MPChuman (µg/L) Integrated MPC (µg/L) 1-butanol 94 224 2430 224 n-butylacetaat 9.4 18 358 18 Cyclohexylamine 1.2 0.20 2.67E+5 0.20
Diethylene glycol 4083 1.47E+4 1.39E+4 13900
Ethyl acetate 66 107 3040 107
Ethylene glycol 2867 2.00E+5 1.36E+4 13600
Methanol 1218 190 8060 190
Methyl ethyl ketone 408 1200 850 850
Methyl tert-butyl ether* 47.5 2600 1790 1790
Tribromomethane 4.1 96 214 96
Triethanolamine 82 320 4.25E+05 320
* = Based on the EU RAR (EC, 2002), SRCeco from Swartjes et al. (2004).
For the compounds diethylene glycol, ethylene glycol, methyl ethyl ketone, and methyl
tert-butyl ether the MPCs based on risks for human health are lower than those based on
ecotoxicological risks, and determine the integrated MPC. For the other seven compounds, the ecotoxicological MPCs are lower.
4.2
MPCs for groundwater
Table 19. Overview of MPC values for ground water. All MPChuman values are calculated
using the Humanex model.
Compound MPCeco (µg/L) MPChuman (µg/L) Integrated MPC (µg/L) 1-butanol 224 896 224 n-butyl acetate 18 109 18 cyclohexylamine 0.20 9.46E+4 0.20 diethylene glycol 1.47E+4 177 177 ethyl acetate 107 664 107 ethylene glycol 2.00E+5 1720 1720
methanol 190 8060 190
methyl ethyl ketone 1200 412 412
methyl tert-butyl ether* 2600 56 56
tribromomethane 96 38 38
triethanolamine 320 4.61E+04 320
For six substances, ecotoxicological risk is the dominant factor that determines the MPC. Human risk determines the MPC for diethylene glycol, ethylene glycol, methyl ethyl ketone, methyl tert-butyl ether, and tribromomethane.
4.3
MPCs for air
Table 20. Overview of MPC values for air. All MPChuman values
for air are calculated using the Humanex model.
Compound MPCeco (µg/L) MPChuman (µg/L) 1-butanol - 171 n-butyl acetate - 653 cyclohexylamine - 8710 diethylene glycol - 7470 ethyl acetate - 2790 ethylene glycol - 2.25 methanol - 816
methyl ethyl ketone - 566
methyl tert-butyl ether - 831
tribromomethane - 39.7
triethanolamine - 0.12
No separate MPCecowere derived and compared to MPChuman values. In principle, this could be done using EUSES. The same principles that are used to calculate the relative importance of exposure routes for humans could be used to calculate the MPCeco, air. This is shown in the calculations for cyclohexylamine (section 3.2.3). Because MPCeco, air values are not formally required, no comparison was made. Section 3.2.3 shows that this could, in exceptional cases, lead to problems due to intercompartmental transfer.
4.4
MPCs for soil
Table 21. Overview of SRC and MPC values for soil. All MPChuman values are calculated using the
Humanex model. Compound SRCsoil (mg/kg) MPCeco, soil (µg/kg dw) MPChuman, soil (µg/kg dw) Integrated MPC (µg/kg dw) 1-butanol 63 149 1510 149 n-butyl acetate 50 96 593 96 cyclohexylamine 5.0 0.81 1.47E+5 0.81 diethylene glycol 1838 6624 78.2 78.2 ethyl acetate 125 204 1240 204
ethylene glycol 1282 8.94E+4 755 755
methanol 627 98 4040 98
methyl ethyl ketone 749 2205 732 732
methyl tert-butyl ether 44 2400 74 74
tribromomethane 46 1061 308 308
Similar to groundwater, human risk determines the MPCsoil for diethylene glycol, ethylene glycol, methyl ethyl ketone, methyl tert-butyl ether, and tribromomethane. For the other six substances, ecotoxicological risk is the dominant factor that determines the MPC.
4.5
MPCs for sediment
Table 22. Overview of SRC and MPC values for sediment. All MPChuman values are calculated using
the Humanex model.
Compound SRCeco, sed (mg/kg) MPCeco, sed (µg/kg) MPChuman, sed (µg/kg) Integrated MPC (µg/kg dw) 1-butanol 226 535 7740 535 n-butyl acetate 66 127 2820 127 cyclohexylamine 7.2 1.2 8.17E+5 1.2
diethylene glycol 8883 3.20E+4 2.63E+4 2.63E+4
ethyl acetate 239 389 1.03E+4 389
ethylene glycol 6230 4.34E+5 2.57E+4 2.57E+4
methanol 6729 426 1.58E+4 426
methyl ethyl ketone 1452 4275 2810 2810
methyl tert-butyl ether 116 * 6300* 4490 4490
tribromomethane 53 1225 2260 1225
triethanolamine 188 737 8.60E+5 737 * In Swartjes et al. (2004), ERLs were determined with the same value for soil and sediment. However, soil and sediment have different characteristics (organic carbon content, water content, density). These are taken into account in the current tables.
Similar to surface water, the MPChuman is lower than the MPCeco. for diethylene glycol, ethylene glycol, methyl ethyl ketone, and methyl tert-butyl ether. For the other seven substances, ecotoxicological risk is the dominant factor that determines the MPC.