RIVM Report 2016-0026
A. Verschoor et al.
Emission of microplastics and potential
mitigation measures
Abrasive cleaning agents, paints and tyre wear
Colophon
© RIVM 2016
Parts of this publication may be reproduced, provided acknowledgement is given to: National Institute for Public Health and the Environment, along with the title and year of publication.
Anja Verschoor (author), RIVM Leon de Poorter (author), RIVM Rianne Dröge (author), TNO Jeroen Kuenen (author), TNO Elias de Valk (author), RIVM Contact:
Anja Verschoor RIVM/VSP
anja.verschoor@rivm.nl
This investigation has been performed by order and for the account of the Ministry of Infrastructure and the Environment, within the
framework of VANG
This is a publication of:
National Institute for Public Health and the Environment
P.O. Box 1 | 3720 BA Bilthoven the Netherlands
Synopsis
Tyres, paints and abrasive cleaning agents can release microplastic particles, which are distributed in soil, water and air. Tyre wear is the largest of these three sources, with a total emission in the Netherlands of 17,300 tons per year, followed by paint particles at approximately 690 tons per year. The abrasive cleaning agents are a much smaller source, at approximately 3 tons per year.
This follows from an investigation conducted by RIVM. For each source, the destination of the particles in the environment is quantified. The emissions into water are, respectively, 1,800 (tyre wear), 330 (paint particles) and 1 (microplastics of abrasive cleaning agents) ton per year. The Dutch government formulated an ambition to use resources
efficiently. The disappearance of the above-mentioned materials in the environment is incompatible with that ambition. Furthermore, the exposure of organisms to these anthropogenic sources should be prevented.
The investigation comprises an inventory of potential measures to reduce the release of microplastics. For each source, it is essential to create awareness amongst consumers and professionals in order to induce a change in behaviour. In addition to this, the release of microplastics can be reduced through innovation. Another option is to take measures that prevent the distribution of wear particles to the environment.
These measures can be stimulated by legal implementation, by
voluntary agreements with professional associations, by financial stimuli such as subsidies, and awareness-raising campaigns to induce
behavioural changes.
Keywords: microplastics, tyre wear, paint, abrasive cleaning agents, emissions, distribution, measures.
Publiekssamenvatting
Uit banden, verf en schurende reinigingsmiddelen kunnen plastic deeltjes vrijkomen die zich in bodem, water en lucht verspreiden. Bandenslijtsel is de grootste van deze drie bronnen, met een totale uitstoot naar het milieu in Nederland van ongeveer 17.300 ton microdeeltjes per jaar. Daarna volgen verfdeeltjes met ongeveer
690 ton per jaar. De schurende reinigingsmiddelen zijn een veel kleinere bron, ongeveer 3 ton per jaar.
Dit blijkt uit onderzoek van het RIVM. Per bron is aangegeven in welk deel van het milieu de deeltjes terechtkomen. Zo is de emissie naar water respectievelijk 1.800 (bandenslijtsel), 330 (verfdeeltjes) en 1 (microplastics uit schurende reinigingsmiddelen) ton per jaar.
De Nederlandse overheid heeft de ambitie om efficiënt om te gaan met grondstoffen. Daarin past het niet om deze materiaalstromen in het milieu te laten ‘verdwijnen’. Bovendien moet zo veel mogelijk worden voorkomen dat organismen aan deze milieuvreemde stoffen worden blootgesteld.
Het onderzoek bevat daarom ook een eerste inventarisatie van
maatregelen om de uitstoot van microplastics te verminderen. Voor alle bronnen is het belangrijk om bij consumenten en bedrijven begrip te creëren voor maatregelen en het gedrag hierop aan te passen.
Daarnaast kunnen innovaties eraan bijdragen dat banden en verf minder snel slijten. Een andere optie is om maatregelen te nemen die
voorkomen dat slijtagestof zich in het milieu verspreidt.
De maatregelen kunnen worden gestimuleerd door ze wettelijk vast te leggen, branches vrijwillig overeenkomsten te laten opstellen, financiële prikkels zoals subsidies aan te reiken, en voorlichtingscampagnes te ontwikkelen om gedragsverandering te stimuleren.
Kernwoorden: microplastic, banden slijtage, verf, schurende reinigingsmiddelen, emissies, verspreiding, maatregelen.
Contents
Summary ─ 9 1 Introduction ─ 11
2 Identification and distribution of microplastics ─ 15
2.1 Definition of microplastic ─ 15
2.2 Distribution of microplastics ─ 15
2.3 Sewerage systems in the Netherlands ─ 16
3 Abrasive cleaning agents ─ 21
3.1 Introduction ─ 21
3.2 Why are microplastics used? ─ 22
3.3 Which products contain microplastics? ─ 23
3.4 Estimated emissions ─ 24
4 Paints and coatings ─ 27
4.1 Introduction ─ 27
4.2 Scope ─ 29
4.3 Calculation method ─ 29
4.3.1 Building / construction and DIY sectors ─ 29
4.3.2 Shipping ─ 36
4.4 Estimated emissions ─ 40
4.4.1 Building, construction and DIY sectors ─ 40
4.4.2 Shipping ─ 41
4.5 Uncertainties ─ 42
5 Rubber tyres 43
5.1 Introduction ─ 43
5.2 Characterization of microplastics from road vehicle tyres ─ 44
5.3 Calculation method ─ 47
5.4 Estimated emissions ─ 50
5.5 Uncertainties ─ 51
6 Measures and instruments to reduce microplastics emissions ─ 53
6.1 International approach ─ 53
6.2 National approach ─ 55
6.3 Instruments ─ 56
6.3.1 Command and control instruments ─ 56
6.3.2 Economic instruments ─ 57
6.3.3 Persuasive instruments ─ 57
6.4 Potential measures ─ 58
6.4.1 Abrasive cleaning agents ─ 58
6.4.2 Paints ─ 60
6.4.3 Tyres ─ 61
6.4.4 Improvements of the sewerage system ─ 63
7 Overall discussion and recommendations ─ 65 8 References ─ 67
Summary
According to the Marine Strategy Framework Directive2008/56/EC (MSFD), research must be conducted on the amount, occurrence and the sources of microplastics, and on measures that can reduce the emissions of microplastics.
To support the development of effective and efficient action plans by the Dutch government, RIVM published in 2014 an inventory and
prioritization of land-based sources of microplastics [1]. The prioritization of land-based sources was scored based on a first qualitative evaluation of three criteria: 1) volume of the emission, 2) feasibility of measures and 3) action perspectives for consumers. The current report is a follow-up study to three prioritized land-based sources: 1) abrasive cleaning agents, 2) paints and lacquers and
3) rubber tyres. The aim was to quantify emissions of microplastics from these sources in the Netherlands and to propose potential measures for reduction of microplastics. The study was announced by the Dutch government in the MSFD Programme of measures.
Definition
Microplastics are solid, synthetic polymer particles with a size smaller than 5 mm, with a low solubility in water and a low degradation rate. Microplastics may contain non-polymeric additives, oils, fillers or other product aids. The mass of these inherent ingredients is included in the emission calculations. However, external substances or materials attached to microplastics during or after their use phase, such as road dirt to tyre wear particles, are not included in the emission calculations.
Detergents
We screened >400 (abrasive) cleaning agents of six market-leading companies and found that ten products were suspected of containing microplastics. These microplastics serve as abrasive agents. It all concerned products used to clean floors. Based on market data, it was estimated that the total emission of microplastics from abrasive cleaning agents is 2.6 tons/year, which is almost completely discharged into the sewer. Emissions to surface water are estimated to be 1.2 tons/year. The most likely measures to reduce emissions into surface water are a legal ban or the gradual, voluntary phase-out of microplastics in detergents. These are measures that need to be taken by the responsible producers.
Paints
Paint particles are considered as microplastics because they have a backbone of polymers. For the building sector, a total emission of
490 tons was estimated. In respect of paints, applications in the building and shipping sector were determined to be responsible for the largest part of paint use. In the building sector, a distinction is made between professionals and do-it-yourself (DIY) consumers. The amount of
plastics that are released by removal of old paint layers, by the tear and wear of paint and by the rinsing of rollers and brushes coated with water-soluble wall paints is taken in to account. Emissions to surface water are estimated to be 130 tons per year. For shipping, the removal of paint at shipyards and marinas, as well as the wear and tear during shipping are quantified. In the shipping sector, it is estimated that 200 tons of microplastics per year are released to surface water.
A variety of measures could be considered to reduce the volume of paint particles. The most feasible seem to be measures that aim to reduce the wear of paints (paint innovation, way of application, maintenance), to prevent the spreading of dust and to create awareness with respect to rinsing brushes and rollers.
Rubber tyres
Road transport vehicle tyres were estimated to contribute 1,800 tons of particles from tyre tread wear per year into surface water through run-off from pavements, effluents and overflows of the sewage system, and 6,200 tons per year into soil. Additionally, another 900 tons per year of fine particulate matter from tyres are released to the air, and 7,400 tons per year are captured in open asphalt concrete roads. This pertains to the wear of tyres on nine different vehicle types: such as several types of trucks, passenger cars, buses and motorcycles. Potential measures comprise innovations made to tyres and road surfaces and the collection of run-off water, consumer awareness with respect to driving behaviour, tyre pressure and wheel alignment, the proper use of summer and winter tyres, and ways to reduce vehicle kilometres.
Uncertainties
The emission estimates in this report are often based on limited
information and rely partly on expert judgement. For this reason, ranges of emissions to surface water are reported. It is recommended that research be conducted in order to fill some significant knowledge gaps. Towards the end, suggestions are given in this report.
Measures
Legal, economic, voluntary and persuasive instruments for a policy to reduce microplastics were discussed and supplemented with a list of potentially product-specific viable options. The measures proposed in this study should be subjected to further socio-economic analysis to determine the effectiveness, viability and the costs and benefits of the measures.
A generic measure could be the improvement of sewage treatment plants. In general, this end-of-pipe measure is less favourable than preventive source measures and measures that address the producer’s responsibility. Furthermore, the current distribution of microplastics towards sewage treatment plants and removal efficiency of these plants are highly uncertain. These uncertainties must be reduced by specific research before end-of-pipe measures are introduced.
1
Introduction
Tasks from the Marine Strategy Framework Directive
This report presents facts and figures for three sources of microplastics — 1) abrasive cleaning agents, 2) paints and lacquers and 3) car tyre wear — and suggests potential measures to reduce the emission of microplastics from these sources. This task follows from the Marine
Strategy Framework Directive2008/56/EC (MSFD) and the related
Commission decision 2010/447/ on criteria and methodological
standards on the good environmental status of marine waters [2]. The latter document mentionsmicroparticles and, in particular, microplastics as one of the indicators of a good ecological status of the marine
environment. According to the MSFD, member states must develop monitoring methods in order to follow trends in the amounts and the occurrence of microplastics. Furthermore, research must be conducted into the sources of microplastics and into potential measures that can reduce the quantity of microplastics [3].
Origin of microplastics
Nowadays, plastic has penetrated virtually every single aspect of
everyday life: from clothing to electronics and from building materials to cleaning products. Due to littering, wear, imperfect waste management systems, sewage and industrial sources, plastic enters the environment. Some plastics consist of very tiny particles, known as microplastics: generally defined as solid polymer-based materials with a size of <5 mm. Yet larger plastic items also contribute to the microplastic load. Through mechanical wear and oxidation, plastic disintegrates and falls apart into smaller pieces and microplastics. Concerns have been raised because microplastics are found in both the marine and freshwater aquatic environments: in water, in sediments and in biota, such as fish, mussels and crustaceans [4, 5]. Apart from the protection of aquatic ecosystems, food safety is also an issue that is raised in relation to microplastics.
Previous work
To support the development of effective and efficient action plans by the government, RIVM published an inventory and prioritization of land-based sources of microplastics [1]. The reduction of land-land-based sources is relevant because it is estimated that a significant part of the plastic found in the marine environment originates from such land-based sources [6]. The prioritization of land-based sources was scored based on a first qualitative evaluation of three criteria: 1) volume of the emission, 2) feasibility of measures and 3) action perspectives for consumers. It was recommended that follow-up studies be launched in order to include more process-specific or industry-specific information and monitoring data as microplastic sources with the highest priority scores. The priority list is shown in Table 1.
Follow-up
A follow-up study on three product groups was demanded by the Ministry of Infrastructure and the Environment of the Netherlands and subsequently announced by the Dutch government in the MSFD
Programme of measures: 1) abrasive cleaning agents, 2) paints and lacquers and 3) rubber tyres [1]. The latter group includes the tyres of
nine different vehicle types: such as several types of trucks, passenger cars, buses and motorcycles. Several other high priority sources were not selected for the follow-up for practical and financial reasons. It was acknowledged that packaging/litter/waste collection is a significant source of microplastics, but this source has already been subjected to measures, regulations and green deals. Cosmetics also received a high priority, but this source has already been subjected to voluntary measures by the association of manufacturers and importers of
cosmetics and products for personal care in the Netherlands. The Plastic Soup Foundation watched for the effectiveness of these voluntary measures as part of their "Bead the microbead" campaign
(http://beatthemicrobead.org/en/product-lists). The issue of fibres and clothing was temporarily parked, awaiting the results of a Dutch
exploratory study by Milieu Centraal and the results of a EU-financed Life+ research project called “Mermaids” (http://life-mermaids.eu). Loading, unloading and the transfer of plastic pellets was not further explored for now because industries initiated a voluntary Zero Pellet Loss programme, also referred to as Operation Ocean Clean Sweep.
Table 1 Land-sources of microplastics and their priority adapted from RIVM Quick scan study [1].
Priority
score Activity/product Priority score Activity/product
9 Packaging material 4 Foodstuffs and snacks
8 Litter (general) Landfill sites
7 Waste collection Fibres
Cosmetics Packaging
Paint, lacquer, dyes Granular material (DIY)
Fibres and clothing Medical resources
Loading, unloading, transfer Toys and party items
Runoff from paved surfaces 3 Combustion
6 Tyre wear Sandblasting
Abrasive cleaning agents Granular material
Dust from construction sites Foodstuffs and snacks
Inflow from abroad Glues and adhesives
Agricultural plastics Shipyards
Compost, sewage sludge Rotary milling
Treated water Atmospheric deposition
Overflow and untreated water 2 Preparation of recycling
5 Composting installations Production of base chemicals
Glues, adhesives Medical resources
Insulation, construction materials Electronics devices
Cast floors, carpeting Dental surgeries
Household items Corrosion of water mains
Automotive businesses Extraction and distribution
Dry cleaners Cooling water
Cleaning of tankers Aviation
Sports fields 1 Pesticides/herbicides
Aims
This research study aims to answer the following questions, for abrasive cleaning agents, paints and tyres:
Which components or ingredients of the three products mentioned above are considered to be microplastics? What is the release pathway and what are the amounts of
microplastics released during the use or application of these products in the Netherlands?
Which potential measures can be taken to reduce these emissions and how sustainable are these measures? What kind of generic measures can be taken to reduce
microplastic emissions regardless of their source?
These questions are answered based on literature and desktop research, experimental research and input from stakeholders. Additionally, more details are collected about the appearance of the microplastics, why they are used and how they are distributed in the environment.
Acknowledgements
The following organizations and representatives are kindly acknowledged for their participation in the advisory / feedback group. These were:
Dutch Association of Soap Manufacturers, Hans Razenberg, www.nvz.nl
Dutch Association of Rubber Manufacturers, Kees van Oostenrijk, www.nvr.nl
Dutch Association of Paint and Ink Manufacturers, Martin Terpstra, www.vvvf.nl
Dutch Polymer Institute, Monique Bruining, www.dpi.nl Plastics Europe NL, Theo Stijnen, www.plasticseurope.org Plastic Soup Foundation, Jeroen Dagevos,
www.plasticsoupfoundation.org
Lydia Harkink, Unie van Waterschappen, www.uvw.nl This report does not necessarily represent the opinions of abovementioned organizations or representatives.
Experts from TNO (Jan Hulskotte), CBS (John Klein), Deltares (Erwin Roex, Nanette van Duinhoven), Rijkswaterstaat (Klaas van der Sterren, Lex Oosterbaan, Rob Hofman, Marcel van der Ploeg) and RIVM (Elbert Hogendoorn, Wim van der Maas) are kindly acknowledged for their advice and review of the draft version of this report.
2
Identification and distribution of microplastics
2.1 Definition of microplastic
A legally binding European definition of microplastics does not exist. Therefore, we use a description which was proposed by RIVM and
submitted to the EPA-network for further discussion with other European Member States [7]. This working definition is shortly described below. A review of existing proposals and working definitions indicates that there are five major elements that should be specified in order to determine whether a compound is a microplastic. These elements are: composition, physical state, solubility, degradability and size. Each element is further specified and the selected threshold values were adopted or derived from widely used and accepted legal frameworks. The following criteria, put forward in the same review, are used in this report.
Table 2 Elements of the microplastics definition in this study
Elements Provisional criteria Adopted from:
Composition Synthetic polymer-based materials ISO [8], REACH [9]
Physical state
A substance that is not a liquid or a gas. UN-GHS [10]
Size <5 mm MSFD [11]
Solubility < 1 mg/L REACH [12]
Degradability Compartment Marine water
Fresh or estuarine water Marine sediment Fresh or estuarine sediment Soil Half-life < 60 days < 40 days <180 days <120 days <120 days REACH [13]
Microplastics may contain non-polymeric additives, oils, fillers or other product aids. The mass of these inherent ingredients is included in the emission calculations because they form an inevitable part of the microparticles. Moreover, the effect of microplastics is determined by the total volume, shape and reactivity of the microparticles and not by the polymer ingredients alone. However, external substances or materials attached to the outer surface of the microplastics during or after the use phase, such as road dirt to tyre wear particles, are not included in the emission calculations.
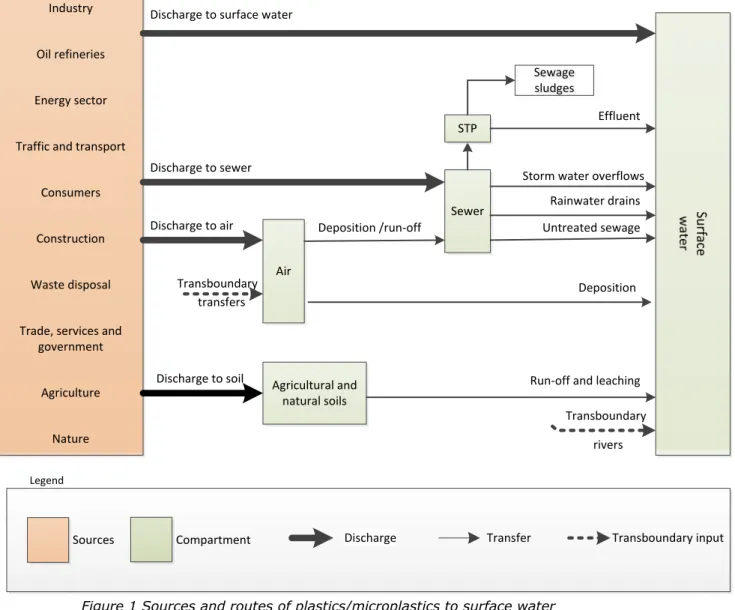
2.2 Distribution of microplastics
Microplastics can be released into the air, soil and surface water (directly or indirectly via a sewer). A general distribution scheme for the
discharges into water was retrieved from the Dutch Pollutant Release and Transfer Register (www.prtr.nl), see Figure 1. A vital attenuator in the release pathways for a number of applications is the sewage treatment plant (STP). In the Netherlands almost all households
(99.7%) are connected to a sewage system [14]. The removal efficiency depends on the type of sewerage system and the capacity and technical features of the STP. Reported removal efficiencies are very variable; removal percentages of 0-90% have been reported [15-17].
Figure 1 Sources and routes of plastics/microplastics to surface water (www.prtr.nl).
The residues of the STP, the sewage sludge, could be a source of
microplastics too. In the Netherlands, the application of sewage sludge on agricultural land is prohibited [18], sewage sludge is generally
incinerated; therefore there is no pathway from sewage sludge to the surface water. However, this may be a significant route in other countries. This report aims to quantify the direct emission of microplastics from abrasive cleaning agents, paints and tyres to the four compartments shown in Figure 1 (the bold black arrows). Subsequent exchange and redistribution over the compartments long after the emission has taken place is not taken into account. Redistribution occurs, for example, through the deposition of dust particles into soil, through precipitation and the resuspension of particles in water and sediment, and through the flooding of rivers.
2.3 Sewerage systems in the Netherlands
Most of the present sewer systems (approximately 70%) in the Netherlands are combined systems with both storm water and waste
Legend Industry Oil refineries Energy sector Traffic and transport Consumers Construction Waste disposal Trade, services and government Agriculture Nature Agricultural and natural soils Air Sewage sludges Sewer STP Discharge to soil Transboundary Transboundary Run-off and leaching Deposition Untreated sewage Rainwater drains Storm water overflows Effluent Deposition /run-off Discharge to air Discharge to sewer Discharge to surface water
Sources Compartment Discharge Transfer
Legend
rivers transfers
disadvantage of these systems is that at high rainfall, the capacity of these systems and the treatments plants is insufficient, resulting in an overflow of storm water and wastewater to the surface water. In
separated sewerage systems, the wastewater from streets is discharged directly into the surface water without treatment. This concerns
approximately 20% of the sewerage systems. The capacity of the sewage treatment plant can then be reduced and better tuned to the relatively constant amount of municipal wastewater. A disadvantage is the direct discharge of relatively contaminated run-off water from streets into the surface water without treatment. The newer, improved separated systems (10% of the systems in the Netherlands) will transfer the first part of the storm water (including street dirt) to the wastewater treatment plant, whereas the subsequent cleaner part is still discharged directly into the surface water.
In highly paved areas, microplastics are washed away with street dirt to the sewerage system. The distribution of emissions from paint to sewer, soil and surface water is not specifically described in the Dutch Pollutant Release and Transfer Register. Emissions from the abrasion of tyres within urban areas are allocated to sewer (60%) and soil (40%), while emissions from the abrasion of tyres outside urban areas are allocated to surface water (10%) and soil (90%) [20]. Emissions from several other emissions sources within urban areas are allocated similarly [21, 22]. Only limited data is available on the treatment efficiency of sewage treatment plants with regard to microplastics. In a study conducted by the Institute of Environmental Studies (IVM) at VU University Amsterdam, in collaboration with Deltares, Delft University of Technology and the Hollandse Delta Water Board, research was conducted into the presence of microplastics in various flows at the Heenvliet sewage treatment plant [15]. In this exploratory study, which only included a few samples, 90% of the microplastic particles were removed by the treatment process. The remaining 10% entered the surface water, from where it can reach the sea. In a follow-up study, the number of sewage treatment plants was increased to three and a larger number of samples were taken. The previous estimate for treatment efficiency (90%) was not confirmed by the follow-up study. Microplastics were detected in the effluent (on average 39-89 microplastic particles per litre). This confirms that
microplastics are not entirely removed from water by sewage treatment plants [23]. It turned out that the concentration of microplastics varied with time, and that effluent concentrations were not always lower than influent concentrations. A recent study conducted by four Dutch sewage treatment plants shows average microplastic concentrations in effluent of between 48 and 55 particles per litre [16].
Part of the contamination in wastewater and storm water is removed prior to the STP by traps and sedimentation devices. This concerns approximately 8-9% of the contamination ending up in sludge. A preliminary removal rate in the STP of 50% is employed, but a range (10-90% removal) is reported as well. This means 50% of the
microplastics in the treated wastewater will be transferred to the effluent and an equal part is transferred to sewage sludge. The amount in sludge consists of 2 streams: 1) amount of microplastics removed during the treatment and, 2) the amount captured in sedimentation
devices prior to treatment. The latter amounts to 9% for wastewater and 8% for storm water.
Plastic particles removed during treatment in the STP end up in the sewage sludge. Also sludge from sedimentation devices in the sewerage system may contain microplastics. In some countries, the application of sewage sludge on agricultural land for soil improvement and fertilizer is still allowed. In this way, microplastics are reintroduced in the
environment. In the Netherlands, this practice is not allowed and the communal sewage sludge is further processed and ultimately incinerated. Currently, several initiatives to reuse or recycle wastewater and sludge are being considered. Several resource recovery and sanitation
technologies are still in an experimental stage. Once brought forward to the operational stage, these new technologies will influence, either positively or negatively, the environmental load of contaminants such as microplastics and other contaminants. The following technologies could be of concern because of either possible increases of microplastic emissions or unfavourable changes in their exposure routes: products recovered from the STP, digestion of sewage sludge, use of concentrates to replace chemical fertilizer, co-digestion or composting of manure [24].
Based on the factsheet of the Pollutants Release and Transfer Register on sewerage systems in the Netherlands [25], the approximate
composition of the Dutch sewer system and emissions of municipal waste water and storm water to surface water is given in Table 3.
Table 3 Distribution of microplastics in the sewerage system of the Netherlands. Percentages are expressed as percentage of total emission of microplastics in wastewater or storm water that enters the sewerage system. Derived from [25]. Water
stream Untreated
a Effluentb Sludgec Total
Wastewatera 0.5% 45% 54% 100%
Range 9-82% 18-91%
Storm
waterb 20 36% 44% 100%
Range 7-65% 16-74%
a The fraction of wastewater that is treated is 90.8%. With a removal rate of 50% in the STP, approximately 45% ends up in effluent (90.8%x50%) and 45% ends up in sludge. The remaining part is either untreated (directly discharged to surface water 0.5%) or captured in sludge prior to treatment (9%). Total sludge is thus 45%+9% =54%. b The fraction of storm water that is treated is 72%. With a removal rate of 50% in the
STP, approximately 36% ends up in effluent (72%x50%) and 36% ends up in sludge. The remaining part is either untreated (directly discharged to surface water: 20%) or captured in sludge prior to treatment (8%). Total sludge is thus 36%+8% =44%.
In the Dutch Pollutants Release and Transfer Register (PRTR), advanced calculation methods are available for even eight different types of sewerage systems. PRTR data are linked to geographical locations, which enables regions with high exposure to be identified. In this report, a simplified approach was chosen, using average emission factors (see Table 3 and Table 4).
Considering the processes above, the emission of microplastics in wastewater (WW) to surface water (SW) can be computed as follows:
→
Table 4 Input parameters for the calculation of microplastic emissions from wastewater to surface water.
Parameter Description Value
Fraction of wastewater directly discharged to
surface water
0.003 Fraction of wastewater discharged to surface water
by wastewater overflow 0.005
Fraction of microplastics present in effluent 0.45
The emission of microplastics in storm (rain) water (RW) via STP to surface water (SW) can be computed as follows:
→ →
, ,
Table 5 Input parameters for the calculation of microplastic emissions through storm water run-off to surface water.
Parameter Description Value
, Fraction of urban storm water discharged to the STP 0.6
, Fraction of rural storm water directly discharged to
surface water 0.1
Fraction of wastewater discharged to surface water
by storm water overflow 0.2
3
Abrasive cleaning agents
3.1 Introduction
Cleaning is essential for hygienic or safety reasons. For instance, it reduces the risk of bacterial food contamination or it prevents surfaces from becoming slippery. Cleaning prolongs the service life of materials because dirt causes the deterioration of materials. Last but not least, cleaning enhances the aesthetic value (look and feel) of materials. Consumers demand detergents that are, in the first place, effective and that save time. In modern society, time-consuming cleaning activities are not appreciated. It seems that, for most consumers, environmental issues come in second or even third place (behind financial reasons) when choosing to purchase a cleaning product.
In 2014, Dutch consumers spent €122 per household (= €53 per capita) on detergents. Approximately 10% was spent on products for the
maintenance of surfaces and 25% was spent on cleaning products. Around 65% was used for dishwashing and laundry detergents [26]. Detergents are used for cleaning because they facilitate or enhance the removal of dirt. Detergents fall under the jurisdiction of the Regulation (EC) No 648/2004 of the European Parliament and the Council of 31 March 2004 on Detergents. Detergents are defined in this regulation as: “any substance or mixture containing soaps and/or other surfactants intended for washing and cleaning processes. Detergents may be in any form (liquid, powder, paste, bar, cake, moulded piece, shape, etc.) and are marketed for or used for household or institutional or industrial purposes.”
Other products to be considered as detergents are:
‘Auxiliary washing mixture ’, intended for soaking (pre-washing), rinsing or bleaching clothes, household linen, etc.;
‘Laundry fabric-softener’, intended to modify the feel of fabrics in processes, which are meant to complement the washing of fabrics;
‘Cleaning mixture’, intended for domestic all-purpose cleaners and/or other cleaning of surfaces (for instance materials,
products, machinery, mechanical appliances, means of transport and associated equipment, instruments, apparatus, etc.); ‘Other cleaning and washing mixtures ’, intended for any other
washing and cleaning processes.
Polishing waxes (e.g. for furniture, floors and cars) are not covered by the Detergent Regulation, because they do not contain soap. These products are therefore not subject of our investigation.
Applications of microplastics in (industrial and consumer) hand soaps, facial scrubs, and bath and shower products are also outside the scope of this report because these products are not considered detergents, but rather personal care products, and these fall under the EU Cosmetics Directive 76/768/EEC and the EU Cosmetic Products Regulation (EC) No 1223/2009.
The Detergents Regulation states that all ingredients contained in detergents must be publicly available, although this information is not always easy to find. First of all, most consumers do not know which chemicals are considered to be microplastics. Microplastic ingredients are not explicitly indicated as such, yet they are described by their chemical name, such as polyethylene. Polyethylene, however, is not necessarily present in the form of a microplastic. Secondly, information on consumer products is often not present on the packaging, but is only available on the Internet. Detergents for the professional market are accompanied by a Safety Data Sheet containing information on ingredients and their hazards.
3.2 Why are microplastics used?
Four factors contribute to effective cleaning: mechanical force (motion), chemicals, duration and temperature. Together, they determine the cleaning result. Abrasives are added to some detergents to increase the motion and, as a result, less aggressive chemicals are necessary or less time is needed to obtain the same result.
Abrasive cleaners are used in households to clean floors, surfaces and equipment and work pieces, mainly in kitchens and bathrooms. The materials to be cleaned can be wood, metal, plastic, ceramic, composite or painted surfaces.
In order to exhibit an effective abrasive function, particles should have a size of between 50 and 1000 µm. Particles of this size are referred to as microbeads. Polymer ingredients which function as, for example, a stabilizer, viscosity controller, soil release and anti-static agents are generally much smaller than the microbeads, but can be regarded as microplastics too.
In the past, abrasives were made of natural mineral components, such as sand (silica) or clay. Nowadays, an artificial abrasive, such as calcite (calcium carbonate), is a common ingredient of cleaning agents. Calcite is a cheap and effective cleaning agent, but for some surfaces it is too hard and aggressive. For ceramic furnaces and stainless steel surfaces in the kitchen, special surface abrasives exist which have a cleaning and a mild polishing effect. They usually contain aluminium oxide or silicium oxide as abrasive ingredient, instead of calcite. In particular cases, microplastic particles are used as abrasives in abrasive cleaning agents because of their mild abrasive action.
An abrasive that is too hard or too coarse can remove too much material or leave undesired scratch marks. Excessive abrasion or the presence of scratches may:
diminish or destroy usefulness (for instance scratching optical lenses and compact discs or dulling knives);
trap dirt, water or other material;
increase surface area, permitting greater chemical reactivity such as increased rusting
erode or penetrate a coating (such as a paint);
cause an object to wear away quickly (such as a blade or a gemstone);
A finer or softer abrasive will tend to leave much finer scratch marks. The softer abrasive may, however, become less effective more quickly as the abrasive is itself abraded.
Plastic particles are generally softer than mineral particles, but they are more expensive. For this reason, they are used only in products that are specifically designed to clean delicate surfaces.
3.3 Which products contain microplastics?
Detergents are divided in five different groups: laundry detergents, dishwasher detergents, bathroom cleaners, bleaching cleaners and surface cleaners. Abrasives are mainly used to clean hard surfaces. Abrasives are covered by the term ‘microbeads’. This study focuses on abrasive cleaning agents, so only the microbeads are under investigation. The emission of microplastics from laundry detergents fall outside the scope of our study. There are, however, indications that persistent and non-soluble polymers are also being used in certain laundry detergents. For instance, polypropylene terephthalate was found as an ingredient in several laundry detergents on the Dutch market. A large European research project focused on laundry detergents is currently being conducted by Italian and Spanish scientists in the Mermaids project. Results are expected to be published in 2016. Depending on the outcome of the Mermaids project, follow-up steps can be triggered.
Many polymeric or other types of surfactants or product aids are being used in detergents. Examples are polycarboxylates, non-ionic surface active ingredients (alcoholethoxylates, alkyl polyglycosides), anionic surface active ingredients (linear alkyl benzenesulphonate, alkyl sulphate and alkyl ethersulphate), cationic surface active ingredients (quaternary ammonium salts) and amphoteric surface active ingredients (aminoalkyl amino acid, cocoamidopropyl betaine). Usually it concerns polymers with a high solubility and biodegradability. The surface active ingredients which are allowed on the European market are all considered safe and fulfil the criteria of the EC Regulation on Detergents (No 648/2004). This
regulation states that all surfactants must be readily biodegradable. Polymers in detergents with functions other than as a surfactant do not have to fulfil the readily biodegradability criterion. It is possible, therefore, that persistent polymer ingredients that function as, say, a stabilizer, viscosity controller, soil release and anti-static agents could still be allowed in detergents because their function is not defined as surfactant. Many polymer ingredients and their functions are listed in the CosIng database (http://ec.europa.eu/growth/tools-databases/cosing/), which in essence is a database of substances used in personal care and cosmetic products, but it also contains ingredients of detergents. Another database is the Detergents Ingredients Database (DID-list), which contains the most common ingredients of detergents, their function and degradation potential and toxicity. The DID-list was set up as a source of information for assigning eco-labels to detergents. The rules for eco-labels have been laid down in EC Regulation 66/2010 (read more in Chapter 6.)
The composition of abrasive cleaning agents depends on the type of product. Common abrasive cleaners contain calcium carbonate. Polishing
agents contain mainly aluminium oxide or silica (for fine abrasive function) or calcium carbonate (for more coarse grains). Agents for leather polishing and maintenance do not contain microplastics, but rather waxes.
We searched for product information on a variety of surface cleaners on the websites of six market-leading manufacturers on the Dutch market for cleaning products (Appendix 1).
Of the more than 400 products we screened, eight products for floor cleaning and two products for wood polishing contain ingredients that may be considered as microplastics. It is not clear whether all these ingredients are abrasive particles or that they have a different function, e.g. as synthetic waxes. Further verification by contacting the
companies involved, eventually followed by chemical and microscopic analysis should confirm the precise nature and function of these
ingredients. Products for cleaning glass ceramic plates and steel did not contain microplastics, but rather alumina, silica and/or quartz.
3.4 Estimated emissions
Emissions of microplastics into surface water are estimated from usage, market penetration and removal rates at sewage treatment plants. The total emission of microplastics was estimated based on interviews conducted by the Dutch Association of Soap Manufacturers (NVZ) among their members. Members of NVZ cover 90-95% of the consumer market in the Netherlands, and approximately 66-85% of the professional market [26].
Table 6 Input parameters for the calculation of emissions to surface water.
Parameter Households Industry
Usage by NVZ members (ton/year)1 21 0.25
market share 90-95% 66-85%
1The NVZ-estimate of 2 tons of microplastics per year for households seems plausible, considering the fact that most (abrasive) cleaning agents did not contain microplastics. In fact, it was quite hard to find cleaning agents that did contain microplastics.
To verify the plausibility of the emission data provided by NVZ (2000 kg of microplastics for households), we estimated the market penetration of abrasive cleaning agents that contain microplastics.
In order to do so, it was assumed that:
1. a person buys and uses 500 g of abrasive cleaning agent per year;
2. microbead content in abrasive cleaning agents (when present) Fmicroplastic is 6%;
3. population density in the Netherlands is 16.9 million.
Using these inputs, a market penetration of 0.5% was calculated for abrasive products that contain microplastics. Given the uncertainties in the calculation, amounts of 2.6 tons of microplastics in abrasive cleaning agents corresponds with our experience that it is hard to find abrasive
cleaning agents with microbeads inside. The industrial use of products containing microplastics could not be verified.
To calculate the distribution of microplastics, the highest estimated usage of 2.6 tons/year was employed. The generic calculation method for emissions from wastewater to surface water, as explained in the previous chapter, has been followed.
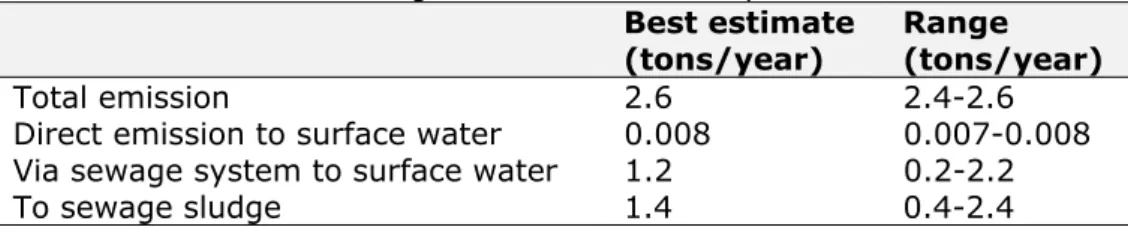
The most relevant pathway for the emission of microplastics from abrasive cleaning agents is the pathway to the sewerage system.
Table 7 Overview of estimated microplastic emissions and uncertainties involved. Uncertainties in usage and removal efficiency in STP are included.
Best estimate (tons/year)
Range (tons/year)
Total emission 2.6 2.4-2.6
Direct emission to surface water 0.008 0.007-0.008
Via sewage system to surface water 1.2 0.2-2.2
To sewage sludge 1.4 0.4-2.4
Almost all microplastics emitted from abrasive cleaning agents are discharged into the sewer: approximately 2.6 tons/year, half of which is assumed to reach the surface water. An almost negligible fraction of 0.008 ton/year is emitted directly to surface water; the rest is transferred to the sewerage system. As mentioned before, the uncertainties in removal efficiency in STP are high.
4
Paints and coatings
4.1 Introduction
Paints are applied for aesthetic reasons and for their protective qualities. Once applied and dried, paints protect substrates and prolong the
lifetimes of bridges, metal and wooden construction materials, cars, furniture, etc.
Paints are made from a mixture of ingredients that originate from fossil, mineral, biological or synthetic sources. The resins (= polymers from petrochemical or natural oils) are the ingredients in an organic paint that hold all the pigment and fillers together, ensure the integrity of the paint-layer and create the adhesion to the substrate.
The majority of paint formulations do not have microbeads as an ingredient. Such beads are added to a small portion of the paint portfolio only to achieve some special characteristics. However, paint particles are described as microplastics because of the resin content. The sanding of old paint layers or the degradation of the paint layer by weather conditions may lead to paint particles being released into the environment. The particles in such ‘paint dust’ will show a large variety in size distribution. Such particles are never discrete polymer particles or beads, but flakes of the paint-layer composed of the solid
components in the paint. Which means a part is polymer and the remainder are minerals. Depending on the type of paint, the polymer content of these flakes may vary.
An entire paint flake is defined as a microplastic particle because of the polymer content (even though part of the particle consists of other substances). See Chapter 2 for more information on the definition of microplastics.
There is little knowledge about the potential emissions of microplastics resulting from the application of paints. Since the application of paints is an activity done by professionals, as well as by consumers
(do-it-yourself), and it is done on a rather diffuse scale, there is a potential for significant emissions. In this chapter, we will provide a preliminary estimate of the emissions of microplastics from paint application as they occur during the entire lifespan of the coating.
Microplastics from paints can be released into the environment through tear and wear during use (weathering), during removal of old paint layers (sanding, abrasion), and through rinsing brushes and rollers. Figure 2 shows a microplastic of sanded paint. This was an alkyd lacquer, which was sanded manually with a fine grain. It shows that through sanding aggregated particles are formed with a size of approximately 20 µm. The aggregates are built up from smaller fragments, with sizes down to 1 µm.
Figure 2 Microplastic of sanded paint.
The weathering of paint consist of a complex set of processes in which the combined action of ultraviolet (UV) light and oxygen are predominant. It causes the dissociation of chemical bonds and can lead subsequently to chemical changes, which ultimately disintegrates a polymer down to carbon dioxide. This is beyond the scope of this desk research, but might be relevant when considering the environmental fate of microparticles derived from coatings.
Paints consist of binders (polymers), fillers, pigments and solvents/water. After the paint has been applied, the solvents and water evaporate and the binders and fillers remain, together forming the solid content, part of which may be emitted as microplastics during its lifespan. Thus when the paint is applied and dried, the microplastic consists of the polymers and the fillers together, because the several components are stuck together in one particle. When the paint is not yet dried (such as when rinsing the brushes in the sink), the microplastic consists of the polymers only, because the several components are not yet stuck together in a single particle.
A first estimate of potential microplastic emissions has been constructed taking into account the (limited) information available from literature, expert judgement and estimations. During this study, valuable input and comments have been received from the industry through the cooperation of the VVVF (Dutch industry association for paint producers) and two workshops with industry experts representing large paint producing companies in the Netherlands.
4.2 Scope
Before starting to estimate the emissions of microplastics, it is crucial to ensure the boundaries of this study. Paints are used in many different sectors as protective and decorative coatings. The building and
construction sector and the DIY (do-it-yourself) sector have been selected, as together they account for more than 70% of the total paint consumed in the Netherlands (see Figure 3). Additionally, we take into account shipbuilding and ship maintenance (nearly 10% of the paint consumed), because emissions to water are expected to be higher than in other sectors of paint users.
Figure 3 Domestic sales in the Dutch paint industry per sector in 2014 [27].
Three sources of emissions from microplastics have been identified which result in emissions to surface water:
removal of old paint layers (including sanding and abrasive blasting);
wear and tear of paints during their lifespan (largely due to weather influence);
rinsing of paint rollers in the sink.
The emissions of microplastics from Building and Construction and DIY are presented in paragraph 4.3.1, and from the shipping sector in paragraph 4.3.2.
4.3 Calculation method
4.3.1 Building / construction and DIY sectors
4.3.1.1 Selection of paint products and processes
Emissions of microplastics into water are expected to originate from maintenance and from the wear and tear of exterior coatings. The microplastic emission into water from interior paint applications is assumed to be zero. Another source considered is the washing of
brushes in the sink. We assume this is only done by DIY users, and only with (water-based) wall paints.
A schematic illustration of the emission sources considered in this study is shown in Figure 4. Professional building and construction 48% Do-it-yourself sector 24% Industry 8% Shipbuilding and maintenance 9% Steel preservation 7% Car repair 4%
Figure 4 Processes included in the emission calculation
For this assessment, the VVVF has provided, in confidence, detailed sales volumes in the Dutch market for 2014 (in tons); separately for the professional and the do-it-yourself sector. The sales volumes were obtained from members and have been supplemented with an estimate of sales data from non-members. The following product groups are identified in these statistics:
1. Concrete (including repair products) (only professional use) 2. Lacquer, varnish, undercoats and primers
3. Wood stains 4. Wall paints 5. Plasters
6. Other paints (including road paints)
7. Paints used in pre-made wooden products (for instance window frames) (only professional use)
The product group ‘Other paints’ consist of road paints (only paint marking, but not thermoplastic marking) and several other products, such as cleaning materials, preparatory materials and products for painting, as well as floor coatings. Only the road paint marking is included in the estimation of microplastics from paints. The sales volumes for each of the product groups listed above form the starting point of the calculation presented in this chapter.
4.3.1.2 Overview of calculation steps
As stated above, the methodology to calculate emissions of microplastics starts from the estimated total sales data from VVVF-members (that is 161.2 ktons in 2014) and non-member companies in the Netherlands in 2014 [27]. The market share of VVVF member companies is
To estimate the emissions of microplastics from paint applications into water, the following approach has been followed (see Figure 4): 1. The paint consumption is first corrected for the amount that is
not-used.
2. The paint consumption for both professional and DIY use is then divided among different product groups, i.e. concrete paints, lacquers, wood stains, etc. Seven product groups are identified in the professional sector and 5 product groups in the DIY sector. 3. The paint consumption for each product group is then split between
interior and exterior application. 4. For the coatings applied to exteriors:
a. Emissions resulting from maintenance (sanding and abrasive blasting) and emissions resulting from the wear and tear of the paint layer have been estimated. An abrasion test was performed to establish the amount of microplastics that can be released by abrasion.
b. For each of the paints, the plastic content has been estimated by taking into account only the solid fraction of the paint. 5. For the coatings applied to interiors:
a. Emissions resulting from rinsing brushes and rollers in the sink have been estimated for wall painting in the DIY sector only. For all other paints and for the professional sector, brush washing is assumed not to occur.
b. For each of the paints, the polymer content has been estimated.
6. The total emissions are distributed over sewer systems and direct emission to surface water.
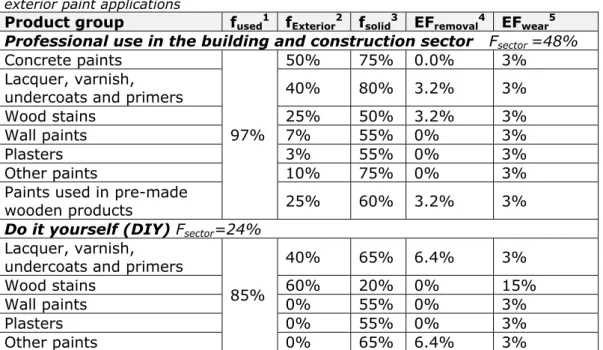
4.3.1.3 Emission from exterior paints
Based on the sales figures for paints, the emissions from the removal of old paint layers and from wear to the exterior paint application are calculated by applying the following formulas:
_
whereby:
Sales is the total paint volume sold
is the fraction of paints sold to professional and DIY sector, resp.
is the fraction of paint sold, specified by different types of
paint. This is confidential information from VVVF.
is the fraction of sold paints that is used;
is the mass fraction of the paints applied in an exterior
situation for that product group;
is the solid fraction in the paint for that product group;
is the emission factor for the removal of the old paint
layers, defined as the mass fraction of solid paint materials for the specific product group that is expected to be emitted as a result of these activities, taking into account the whole lifespan of the paint;
is the emission factor for wear, defined as the mass fraction of solid paint materials for the specific product group that is expected to be emitted as a result of wear to the paint layer, taking into account the whole lifespan of the paint.
Table 8 Input parameters for the calculation of microplastic emissions from exterior paint applications
Product group fused1 fExterior2 fsolid3 EFremoval4 EFwear5 Professional use in the building and construction sector Fsector =48%
Concrete paints
97%
50% 75% 0.0% 3%
Lacquer, varnish,
undercoats and primers 40% 80% 3.2% 3%
Wood stains 25% 50% 3.2% 3%
Wall paints 7% 55% 0% 3%
Plasters 3% 55% 0% 3%
Other paints 10% 75% 0% 3%
Paints used in pre-made
wooden products 25% 60% 3.2% 3%
Do it yourself (DIY) Fsector=24%
Lacquer, varnish, undercoats and primers
85% 40% 65% 6.4% 3% Wood stains 60% 20% 0% 15% Wall paints 0% 55% 0% 3% Plasters 0% 55% 0% 3% Other paints 0% 65% 6.4% 3%
1 In practice, not all the paints that are sold will be used. Especially in the DIY sector,
typically some of the paints will remain in the can and these unfinished cans will be stored or collected through waste collection systems. The remaining paint will not result in any emissions of microplastics. We adopt the estimates of the OECD that say, for professional paints, 3% of the paints are not used [28], while for the DIY sector, a factor of 15% is taken based on a VVVF estimate between 10 and 16% (while OECD estimated 25%).
2 The fraction of paint used for exterior applications is based on a study conducted on
decorative paints for DG Environment [29], which has been complemented with information received from the paint manufacturers through the VVVF.
3The solid content is based on information obtained from the paint manufacturers,
collected by the VVVF, and an average paint composition has been provided for this study for wall-paints, lacquers and primers. Additional data from the paint manufacturers has been collected by VVVF to distinguish between the paints used in the professional sector and those used in the DIY sector. The percentages provided in Table 8 are applicable to the paints used in exterior paint applications only.
4 Before applying new paint layers, old layers are (partly) removed by sanding or abrasive blasting, as well as by burning-off of old paints layers. These techniques are mostly applied to wooden surfaces to remove the old paint layers before a new paint layer is applied. In an earlier study on microplastics conducted for Norway [30], an emission factor of 6.4% was used for emissions of microplastics from sanding and abrasive blasting. In the OECD study, from which this factor is taken, this factor was originally applied for the sanding and abrasive blasting of ship coatings, and assumed to be similar for other coatings [28].
In the Netherlands, the professional use of sanding and blasting equipment should come with dust extraction (existing regulations), which would take away nearly all emissions of small particles when applied correctly. This has been confirmed by the Dutch branch organization for maintenance in the building sector, OnderhoudNL. Other methods for
and manual scraping of the paint. For these methods, it is more difficult to abate the emissions. In general, we expect that less abatement is used for DIY jobs than for those done by professional users.
Since no other estimates are available, we have chosen to keep the 6.4% emission factor for the DIY sector. A test has been conducted by paint manufacturers to quantify the emissions of solids from removal activities when using manual sanding. This was not a standardized test using a panel with two layers of paint, which was sanded manually with a fine grain. The percentage of emissions was found to be in the same range as the numbers presented in this section for DIY. However, assuming that the professional user will have more abatement measures in place, we estimate that emissions are 50% lower compared with DIY, so a factor of 3.2% has been adopted.
For wood stains, wall paints, plasters and other paints (professional), we assume no sanding or abrasive blasting takes place and therefore the emission factor is set at 0%. 5Emissions of microplastics resulting from the wear on paint layers are difficult to
estimate. In Norway it was estimated that around 3% of the solid particles are
weathered off during the lifespan of the paint [30]. This number is difficult to estimate, since it depends strongly on (amongst others) the influence of the weather. Discussions with experts provided a mixed picture: for exterior wall paints it may be too low, while for lacquers it may be too high. Since no alternative quantitative information was available, we have chosen to stick to the 3% emission factor for wear that was used in the Norwegian study [30]. Professional wood stains behave like lacquers and therefore the emission factor for professional wood stains is similar to lacquers. DIY wood stains are, by their nature, less durable. For wood stains applied in DIY (commonly used for gates and fences in residential gardens), we therefore assume a higher emission factor of 15%, as most of the layer is weathered off during the lifespan of the wood stains. This value was derived by assuming that the first two layers of wood stains were completely absorbed by the wood. Only the third layer is partly (assumption 50%) weathered.
4.3.1.4 Emission from interior paints
For interior applications, the emissions of microplastics are not taken into account, as these are assumed to be all (100%) collected as waste, which means no emissions into water take place. The only exception is the emissions from rinsing, which are assumed to take place only for wall paints in the DIY sector. Emissions from rinsing take place when paint rollers are rinsed in the sink after the paint has been applied. These emissions are calculated as:
_ _ , _ _
whereby:
SalesDIY_wall_paints is the total paint volume sold for wall paints in
DIY (confidential data from VVVF);
fused= the fraction of sold paints that is actually used;
fpolymer,DIY_wall_paints is the polymer fraction in the paint for that
sector (only the polymer and not the filling is taken into account, since the paint has not been applied yet);
EFrinsing is the emission factor for rinsing, defined as the mass
fraction of the amount of paint left in the roller before rinsing (assuming 100% is rinsed) compared with the total paint can contents.
Table 9 Input parameters for calculation of microplastic emissions from interior applications
Sector Product
group fused
1 finterior1 fpolymer2 EFrinsing3
Do It Yourself
(DIY) Wall paints 85% 100% 5% 1.6%
1 See comments at Table 8.
2 We assume that rinsing is only done in some cases in the DIY sector, and only for water-based wall paints. Alcrylate wood paints could also be rinsed with water, but this is used much less than with water-based wall paints. It is therefore assumed that all of the paint rollers from wall paints and none of the paint rollers from wood paints are rinsed. In the professional sector, the rollers and brushes are usually disposed of after the job. According to the VVVF, the polymer content of wall paints in the DIY sector is approximately 5%.
3 The percentage of the paint that is rinsed is based on the assumption that paint rollers are rinsed 1 time per 10 litres of paint. A test was performed by a paint manufacturer that weighed the amount of paint that was left in the paint roller before rinsing it. Approximately 240 grams (160 ml) of paint was left in the paint roller, which means an emission factor of 1.6% of the paint. This percentage is in line with the percentage in the OECD emission scenario document [28] of 1.5%, and therefore we have used the 1.6% percentage in this study.
4.3.1.5 Emission into the sewer, surface water and soil
After the 3 emission sources ( , and ) have been
quantified in terms of their total emissions of microplastics, their distribution to sewer (Esewer) and surface water ( ) is calculated.
In formula, these can be expressed as:
, , ,
, , ,
, , ,
whereby:
= emission of microplastics to the sewerage system;
= fraction of the microplastics that ends up in the sewerage
system;
= emission from removal of old paint layers;
= emission from wear of the paint layer;
= emission from rinsing;
= emission of microplastics into the surface water;
= fraction of the microplastics that is directly discharged into surface water;
= fraction of microplastics in the sewerage system that
ends up in the effluent (see also paragraph 2.3);
= fraction of microplastics in sewerage system that is not
treated (see also paragraph 2.3).
In order to determine the fraction of paints that ends up in the sewer and/or surface water, a distinction is made between rural and urban areas, because these areas have different ways to deal with run-off
areas is higher than in rural areas and the surface area that is painted is greater in urban areas. Note that emissions to the sewer will flow to wastewater treatment plants. Part of the microplastics will be removed from the wastewater and the effluents from the wastewater treatment plants will contain fewer microplastics. The purification rate of the wastewater treatment plants has not been a part of this study.
Microplastics that are not emitted into surface water or the sewer, will remain in the soil. These emissions will not end up in surface water or the sewer.
Table 10 Input parameters for the calculation of microplastic emissions into sewers and surface water.
Urban Rural Overall
value fsw,pav fpaint fsewer,pav fpaint
Rinsing 1 0.3% 1 99.7% not relevant 0% 1 0.5% 1 45%
Maintenance and wear
2 0% 66% 10% 34% 3.4%
2 60% 66% 0% 34% 39.4%
2 40% 66% 90% 34% 57%
1 20%
1 36%
1 See paragraph 2.3 “Sewerage systems in the Netherlands”
2 In order to estimate how much paint was used in urbanized areas and how much in rural areas, the population density, the number of households and the average size of houses in these areas was used. The houses in urbanized areas are smaller than in rural areas, and therefore less paint is used in urban areas. We estimated the surface area of the outside walls of houses (see Table 11) and used this to allocate the amount of paint used in urban areas and in rural areas, respectively. It was estimated that 66% of the paints are used in urban areas, whereas 34% are used in rural areas. The overall f , and
f , are calculated by:f , f , f , f , ., where f , is the fraction
of run-off water from paved surfaces that is transported to surface water in urban areas, and fpaint is the fraction of the paint that is used in urban and rural areas, respectively.
Table 11 Calculation of the surface area of the outside walls that need painting, which can be used as a weighing factor for the amount of paint used in urban and rural areas.
urbanHighly 1 Urban Medium urban Slightly urban Rural
Houses (x million) 2 1.720 1.838 1.315 1.324 1.325
Sides of house that need
painting 3 2 2 3 3 5
Length of house sides (m) 4 7.9 8.8 8.1 8.6 8.7
Average number of floors 5
1.5 1.5 2.0 2.0 2.0
Height of one floor (m) 6 3 3 3 3 3
Outside surface area that needs painting (m2) (x
million) 7 122.8 145.3 191.8 204.3 347.8
Percentage of paint used 66% 34%
1 Highly urban = >2,500 addresses per km2; urban =1,500-2,500 addresses per km2; Medium urban (1,000-1,500 addresses per km2); Slightly urban (500-100 addresses per km2), Rural < 500 addresses per km2;
2 Calculated from data on the number of residents and the number of residents per house
in 2014, these data were retrieved from statline.cbs.nl;
3 Assumption. Houses in highly urban and urban areas mainly consist of apartments and
terraced houses and only two of the four sides of these houses need painting. Some of the houses in moderately urban and slightly urban houses are detached houses, for which all the sides need painting. Therefore it is assumed that, on average, three of the four sides of all houses in these areas need painting. Almost all of the houses in non-urban areas consist of detached houses, for which all of the four sides need painting, But since extension buildings are also often present, this is raised to five sides in the
calculation;
4 Calculated from the surface area per floor and the assumption that the houses are
square. Surface area per floor was estimated from the number of houses per size class per municipality (from Statistics Netherlands, statline.cbs.nl);
5 Assumption. More apartments are used in highly urban and urban areas and therefore
the number of floors per house is fewer than in the other areas;
6 Assumption. Height of one floor is the same in all of the houses (3 metres);
7 Calculated by multiplying the number of houses, number of sides that need painting, length of the house sides, number of floors, and the height of one floor.
4.3.2 Shipping
4.3.2.1 Introduction
Emissions from paint particles occur during maintenance (at shipyards and marinas) and during use of the ships. Maintenance includes the sanding and abrasive blasting of the coating. Emissions that occur during use of the ships include the regular wear of the coating and occasional damage.
We focused on the hull of the ship in this study. Microplastic emissions from other parts of the ship have not been taken into account.
In the following paragraphs, emissions during maintenance and use are estimated. This is split into two parts:
1. Maintenance at shipyards and marinas (mainly professional marine shipping and inland shipping) is described in paragraph 4.3.2.2.
![Table 1 Land-sources of microplastics and their priority adapted from RIVM Quick scan study [1]](https://thumb-eu.123doks.com/thumbv2/5doknet/3015286.6764/14.892.131.846.545.1070/table-land-sources-microplastics-priority-adapted-rivm-quick.webp)


![Figure 3 Domestic sales in the Dutch paint industry per sector in 2014 [27].](https://thumb-eu.123doks.com/thumbv2/5doknet/3015286.6764/31.892.189.693.389.681/figure-domestic-sales-dutch-paint-industry-sector.webp)