Effects of bundled payment on curative health care costs in the Netherlands : An analysis for diabetes care and vascular risk management based on nationwide claim data, 2007-2010 | RIVM
103
0
0
Hele tekst
(2) Effects of bundled payment on curative health care costs in the Netherlands An analysis for diabetes care and vascular risk management based on nationwide claim data, 2007-2010 JN Struijs SM Mohnen CCM Molema JT de Jong-van Til CA Baan RIVM Bilthoven, 2012.
(3) Colophon All rights reserved. © 2012 National Institute for Public Health and the Environment (RIVM), Bilthoven, the Netherlands JN Struijs SM Mohnen CCM Molema JT de Jong-van Til CA Baan Contact: JN Struijs Centre for Prevention and Health Services Research Jeroen.Struijs@rivm.nl This report was originally published in Dutch in 2012 under the title Effect van integrale bekostiging op curatieve zorgkosten. Een analyse voor diabeteszorg en vasculair risicomanagement op basis van registratiebestanden Vektis, 2007-2010. RIVM report: 260131005. The greatest care has been devoted to the accuracy of this publication. Nevertheless, the editors, authors and publisher accept no liability for incorrectness or incompleteness of the information contained herein. They would welcome any suggestions for improvements to the information contained. All rights reserved. No part of this publication may be reproduced, stored in an automated database or made public in any form or by any means whatsoever, whether electronic, mechanical, photocopied, recorded or through any other means, without the prior written permission of the National Institute for Public Health and the Environment (RIVM). To the extent that the production of copies of this publication is permitted on the basis of Article 16b, 1912 Copyright Act in conjunction with the Decree of 20 June 1974, Bulletin of Acts, Orders and Decrees 351, as amended by the Decree of 23 August 1985, Bulletin of Acts, Orders and Decrees 471, and Article 17, 1912 Copyright Act, the appropriate statutory fees must be paid to the Stichting Reprorecht (Reprographic Reproduction Rights Foundation), P.O. Box 882, 1180 AW Amstelveen, Netherlands. Those wishing to incorporate parts of this publication into anthologies, readers and other compilations (Article 16, 1912 Copyright Act) should contact RIVM. RIVM-report number: 260013001 ISBN: 9789069602608.
(4) Contents Abstract 5 Rapport in het kort 6 Summary 7 1 Introduction 11 1.1 Background 11 1.2 Purpose of this study 13 1.3 Structure of this report 14 2 Diabetes management: implementation, costs and cost trends 15 2.1 Sample population 15 2.2 Curative health care costs for diabetes patients under differential pricing schemes from 2007 to 2009 17 2.3 Curative costs for diabetes patients in the bundled payment group in 2009 20 3 Vascular risk management: implementation and costs 23 3.1 Progress in implementing VRM 23 3.2 Curative health care costs in VRM programmes in fourth quarter of 2010 26 4 Effects of bundled payment arrangements on curative diabetes costs in comparison to management fee arrangements and care as usual 29 4.1 What effect did diabetes management programmes have on curative health care costs in comparison with care as usual? 29 4.2 What effect did the introduction of bundled payment diabetes management have on curative health care costs in comparison to management fee arrangements or to care as usual? 33 5 Effects of bundled payment arrangements on the numbers of diabetes patients using specialist care care 37 5.1 Effects of diabetes management programmes on the use of specialist care in 2009 37 5.2 Effects of bundled payment introduction on the use of specialist care in 2009 38 6 Discussion 41 6.1 Summary of findings 41 6.2 Research methods 43 6.3 Discussion 46 6.4 Recommendations 48 Literature 51. An analysis for diabetes care and vascular risk management based on nationwide claim data, 2007-2010 | 3.
(5) Appendices Appendix 1 Appendix 2 Appendix 3 Appendix 4 Appendix 5. The Dutch health care system 58 Brief description of Vektis health care databases 65 Method 67 Authors and other contributors 83 Tables and figures 84. 4 | Effects of bundled payment on curative health care costs in the Netherlands.
(6) Abstract This report describes the implementation of disease management programmes for type 2 diabetes and for vascular risk management (VRM) in the Netherlands based on bundled payments and assesses the effects of this bundled payment scheme on the curative health care costs of diabetes patients. Bundled payment was hypothesised to improve the quality of care and encourage task delegation and reallocation. The result could be lower health care costs and efficiency improvements in diabetes care. We used data from the Vektis health care information centre to analyse insurance claims made to Dutch health insurance companies. The data were confined to the health care costs reimbursed under the basic statutory insurance package required by the Health Insurance Act (Zvw), plus the compulsory and voluntary excesses paid by patients. By 2010, disease management programmes for diabetes were operating throughout the Netherlands. Just under 100 health care consortia known as care groups were providing such arrangements on the basis of bundled payment contracts with health insurers; others had arrangements in which GPs were paid supplementary management fees for the overhead and other costs of managing diabetes patients on a fee-for-service basis. Only seven care groups in the southern part of the country had bundled payment contracts for VRM in 2010. The curative health care costs per diabetes patient were about € 4800 for the year 2009. The bulk of these costs were for hospital-based specialist care (€ 2500) and for prescription medicines (€ 1100). The costs of primary care, about € 400 per patient, played only a modest part in the total curative costs. Curative costs per VRM patient were € 1350 in the fourth quarter of 2010. From 2008 to 2009, the costs per patient treated in a bundled payment diabetes programme increased by € 288 more than the costs of patients receiving care as usual. The cost rises for management fee patients and for care-as-usual patients did not significantly differ. Nearly 25% fewer patients in a bundled payment diabetes management programme utilised specialist care as compared to care-as-usual patients, and almost 40% fewer used diabetes-related specialist care. The costs of diabetes-specific specialist costs reduced slightly for diabetes management patients. Interestingly, the cost increases for all types of specialist care diverged between the two diabetes management groups, rising for bundled payment patients and declining for management fee patients, in comparison to care as usual. Key words: bundled payments – care groups – diabetes – vascular risk management – health care costs. An analysis for diabetes care and vascular risk management based on nationwide claim data, 2007-2010 | 5.
(7) Rapport in het kort In dit rapport wordt de invoering van zorgprogramma’s diabetes en vasculair risicomanagement (VRM) in kaart gebracht en de effecten van integrale bekostiging (IB) op de curatieve zorgkosten van diabetes beschreven. Bij de invoering van IB was de verwachting dat de kwaliteit van de zorg zou toenemen en dat er tegelijkertijd taakherschikking en taakdelegatie zou optreden. Hierdoor zouden de zorgkosten kunnen dalen en de chronische (diabetes)zorg doelmatiger worden. De resultaten van dit onderzoek zijn gebaseerd op de zorgdeclaraties van alle Nederlandse zorgverzekeraars voor mensen met diabetes, verzameld en beheerd door Vektis. Deze declaratiegegevens bevatten de declaraties van de zorg die valt binnen het basispakket in het kader van de Zorgverzekeringswet inclusief de kosten van het eigen risico van de patient. In 2010 werden vrijwel overal in Nederland zorgprogramma’s diabetes via IB aangeboden; bijna 100 zorgroepen boden dit aan. Daarentegen werden zorgprogramma’s VRM beperkt gecontracteerd in 2010; slechts zeven zorggroepen in het zuiden van het land boden dit aan. Curatieve zorgkosten van een diabetespatient bedroegen ongeveer €4800 in 2009. De kosten van ziekenhuiszorg (ongeveer €2500 per patient) en in mindere mate de medicatiekosten (ongeveer €1100 per patient) maakten hiervan het grootste onderdeel uit. Het aandeel van de kosten van huisartsenzorg was beperkt; ongeveer €400 per patient. De curatieve zorgkosten van mensen die participeerden in een zorgprogramma VRM hebben betrekking op declaratiegegevens uit het vierde kwartaal van 2010 en bedroegen ongeveer €1350 per patient voor het laatste kwartaal in 2010. De kosten van de curatieve zorg van patienten in een zorgprogramma bekostigd via IB waren in 2009 €288 meer gestegen dan de kosten van de curatieve zorg van patienten die reguliere zorg ontvingen. De kostenstijging van patienten in een zorgprogramma bekostigd via koptarief verschilde niet significant van de patienten die reguliere zorg kregen. Het onderzoek liet verder zien dat deelnemers aan een zorgprogramma diabetes, bekostigd via IB, in 2009 bijna 25% minder vaak gebruikmaakten van het ziekenhuis in vergelijking met diabetespatienten die reguliere zorg ontvingen. Als alleen gekeken wordt naar diabetesspecifieke dbc’s dan is de invloed van deelname aan een zorgprogramma nog duidelijker te zien; bijna 40% minder diabetespatienten in een zorgprogramma gingen naar het ziekenhuis ten opzichte van patienten met reguliere diabeteszorg. De kosten per patient die ziekenhuizen maakten voor diabetesgerelateerde zorg namen licht af. Opmerkelijk genoeg namen de totale ziekenhuiskosten van deze patienten juist toe en verklaarden bijna de helft van de toename van de totale curatieve zorgkosten. Bij koptarief werd deze stijging in totale ziekenhuiskosten niet gevonden. Trefwoorden: Integrale bekostiging – zorggroepen – diabetes – vasculair risicomanagement – zorgkosten. 6 | Effects of bundled payment on curative health care costs in the Netherlands.
(8) Summary An initial analysis of the effect of bundled payments on curative health care costs There have been many initiatives in recent years to improve the efficiency of long-term disease management. One important development has been the creation of disease-specific health care standards. The main purpose of the health care standards is to optimise the quality of care by specifying requirements for the content and organisation of good care. Health care standards provide a strong guiding framework for the development of integrated, multidisciplinary programmes of disease management. The bundled payment model was developed to facilitate the creation of such programmes. It enables health insurance companies to purchase, as a single product, all the health care services needed for the management of a particular chronic disease, including all the activities needed to ensure cooperation and coordination between the health care providers involved. Following a period of experimentation with the bundled payment model in the Netherlands from 2007 to 2009, it was introduced on a long-term basis for diabetes and vascular risk management as from 1 January 2010. At the same time, it is still possible to claim diabetes management according to the older pricing mechanism, which remunerated providers for direct health care provision on a fee-for-service basis, supplemented by a management fee. The fee covers the costs of activities outside the direct provision of health care, such as overhead costs, information and communication technologies and coordination of the integrated care delivery. Diabetes care can also still be provided on the older fee-for-service basis without a supplementary fee. In that case, the care is not part of an organised, integrated programme of disease management. We refer to the latter practice as care as usual. This report maps the scale of implementation of the disease management programmes for diabetes and for vascular risk management (VRM), and it assesses the effects that the bundled payment approach in particular has had on the curative health care costs for diabetes. Our research findings are based on insurance claims for health care to diabetes patients as reported by all Dutch health insurance companies to the health care information centre Vektis. Vektis collects and manages data on all health care procedures covered by the Dutch basic statutory insurance package required by the Health Insurance Act (Zvw), including the costs for compulsory and voluntary policy excesses. By 2010, disease management programmes for diabetes were available throughout the country Due in part to the need for central contracting arrangements in the bundled payment approach, health care consortia known as care groups have been set up and charged with the delivery of integrated disease management programmes. By 2010, nearly 100 care groups were operating disease management programmes for diabetes; as a result, diabetes management was being delivered and remunerated by bundled payments virtually everywhere in the country. Comparable programmes for VRM, in contrast, had only been contracted by seven care groups in the south of the country. The scale of VRM implementation depended largely on the attitude of a care group’s preferential insurance company to bundled payment. Curative health care costs per diabetes patient in 2009 put at € 4800 The costs of curative care for all Dutch diabetes patients (average age 67) were about € 4800 per patient in 2009. That was € 1300 higher than the health care costs for an average resident of similar age. General practice costs were only a limited share of that figure, about € 400 per patient. The largest cost items were for specialist or hospital-based care (averaging about € 2500 per year) and medication costs (about € 1100). Curative costs depended strongly on whether patients had other chronic illnesses; the costs were approximately € 2600 higher per comorbid condition. An analysis for diabetes care and vascular risk management based on nationwide claim data, 2007-2010 | 7.
(9) Highest cost increases were for patients in bundled payment diabetes management The average yearly costs of treating a diabetes patient by whatever approach rose by € 219 from 2008 to 2009, an increase of about 5% and consistent with the total cost increment for all Dutch health care in the same period. The curative costs for diabetes patients in a bundled payment disease management programme increased by € 288 more than the costs of care-as-usual patients; the increase for management fee patients did not significantly diverge from that for care-as-usual patients. Fewer bundled payment and management fee patients used specialist care in 2009 About 17% fewer patients receiving some type of diabetes management utilised outpatient or inpatient hospital-based care in 2009 than did care-as-usual patients. The contrast with care as usual was greater for bundled payment patients (25%) than for management fee patients (12%). The influence of diabetes management was even more pronounced when it came to diabetes-specific episodes of specialist care, with almost 40% fewer patients in diabetes management using that care than patients receiving care as usual. Small cost savings in diabetes-specific specialist care for diabetes management patients, but bundled payment patients had higher costs for specialist care in general The reduced numbers of diabetes management patients using specialist care resulted in a slight saving of € 36 per patient in the costs of diabetes-specific specialist care in 2009. At the same time, the total specialist cost increase (including non-diabetes costs) for bundled payment patients was € 142 higher than that for care-as-usual patients, whereas it was € 128 lower for management fee patients. The reasons for these contrary cost trends are yet unclear. Long-term effects of bundled payments on curative health care costs are still unknown Our cost analyses in this report are based on insurance claims data from 2008 and 2009, a period that can be considered a start-up phase in the bundled payment approach. Both care groups and health insurers were still gaining experience in the contracting and provision of disease management based on bundled payment. Other studies have shown that avoidable double payments occurred for certain medical procedures during this period. Our study was unable to verify that. Another qualifying factor is that the two-year time frame of our study was probably too short to gauge the full impact of bundled payment. Given the clinical course of diabetes, where many complications do not develop until later, such shortterm findings may underestimate the ultimate effects of bundled payments. It is also possible that the desired effects on curative health care costs are less likely to be achieved in diabetes than in other diseases, because the Dutch ‘care as usual’ for diabetes was already of a high standard as compared to that in many other countries. This would make it all the more interesting to study the effects of bundled payments on the costs of VRM and COPD patients. In view of the considerable time interval required for the full incorporation of insurance claims data into the Vektis databases (two years for specialist care), it will still be several years before reliable evidence can be obtained on the effects of bundled payments on diabetes, vascular risk and COPD management. Financial incentives in secondary care at odds with bundled payment aims The current findings have shown that although a reduction was achieved in the numbers of diabetes patients using specialist care, no corresponding cost reduction occurred in the secondary care sector. A possible explanation may lie in the pricing system for specialist care, which is mainly based on fee for 8 | Effects of bundled payment on curative health care costs in the Netherlands.
(10) services principles. It would be advisable to experiment with financial incentives in both primary and secondary care that are more consistent with the goals of the bundled payment model – quality enhancement aligned with cost savings.. An analysis for diabetes care and vascular risk management based on nationwide claim data, 2007-2010 | 9.
(11) 10 | Effects of bundled payment on curative health care costs in the Netherlands.
(12) 1 Introduction 1.1 Background Many initiatives to improve the quality of disease management The Netherlands has seen many initiatives in recent years to improve the quality and effectiveness of health care for people with chronic diseases. Aims are to improve cooperation between health care providers, to improve the coordination of care, to ensure compliance with multidisciplinary guidelines and to promote disease self-management. One key supporting development was the realisation of the Health Care Standard for Diabetes Mellitus type 2 by the Dutch Diabetes Federation (NDF, 2007). With the goal of optimising the quality of care, these health care standards set out the principal requirements of diabetes treatment in terms of the health care services and organisational frameworks necessary for long-term disease management (Coördinatieplatform Zorgstandaarden, 2010). The health care Standards are condition-focused, meaning that they specify the health care services required for managing the disease in question, but they do not prescribe where, how or by whom the services are to be delivered. Since the publication of the NDF Health Care Standard, many initiatives have been taken in the field of practice to implement disease management programmes for diabetes. A major obstacle to introducing such programmes nationwide has been the fragmented pricing mechanisms for long-term care (see Appendix 1 for an introduction of the Dutch health care system). This prompted the Netherlands Ministry of Health, Welfare and Sport (VWS) to experiment from 2007 to 2009 with a bundled payment model for integrated diabetes care (VWS, 2008a). Bundled payments as a strategy for further quality improvement The creation of bundled fees enables health insurance companies to purchase, as a single service or product, the entire package of care needed to manage a chronic health condition such as diabetes. Such integrated health care packages have also introduced a new player into the Dutch health system: the care group. Insurance companies sign contracts with care groups to purchase a disease management product (the entire package of required health care services) for a specified chronic condition. The term ‘care group’ refers to the prime contractor of the disease management programme, not to the team of health care providers that deliver the services. The care group serves as the principal contractor that must An analysis for diabetes care and vascular risk management based on nationwide claim data, 2007-2010 | 11.
(13) ensure that the care is delivered. A care group subcontracts most care components to individual health care providers or agencies, or it may deliver some components itself. It arranges with all the associated providers which specific services they will provide, as well as setting additional requirements, such as when they are to refer patients, what data they are to record and report to the care group, and what professional development training they are to complete. The Health Ministry expected bundled payments to improve the implementation of formal standards of care, thus improving the quality of disease management. At the same time, health care tasks would be delegated or reallocated within the primary care sector or from secondary to primary care. This could both reduce the costs and improve the efficiency of long-term disease management (VWS, 2008b; VWS, 2009). Bundled payment model officially launched as from 1 January 2010, with a three-year transition After the experimentation phase in 2007-2009, bundled payment schemes for diabetes management and for vascular risk management (VRM) were introduced on a more permanent basis on 1 January 2010, followed by the scheme for chronic obstructive pulmonary disease (COPD) on 1 July 2010. Alongside those programmes, disease management services for patients with these chronic health conditions could alternatively still be claimed under the ‘old’ pricing system. Under that procedure, direct providers of health care were reimbursed on a fee-for-service basis (separate payments), plus a lump-sum ‘management fee’ per patient. A management fee defrays the costs of activities that are necessary for disease management but not part of the direct health care provision, such as overhead, IT and coordination costs. The years 2010 to 2012 were considered a transitional period from the old to the new pricing mechanism. Evaluation committee appointed to monitor developments in transitional period To keep track of developments related to bundled payments, the previous health minister set up the Bundled Payment Evaluation Committee (EIB) to keep the ministry informed whether the necessary conditions for the bundled payment model are being fulfilled and to advise the ministry whether and when the transitional period can be ended. Such prerequisites include health care quality assurance, consistency of care, patient participation, appropriate services for people with multimorbid conditions, and transparency of quality assessment (EIB, 2011a). The EIB has since produced three reports on the initial results of bundled payments (EIB, 2011b; EIB, 2012a; EIB 2012b), including a final report in June 2012. Research on the impact on health care quality Two key aspects covered by the EIB recommendations were the effects of payment bundling on the quality and the costs of care. A recent RIVM study focused on the quality effects in diabetes care (Struijs et al., 2012). It found mild improvements over the three-year period in indicators evaluating the patient care process, such as HbA1c tests, yearly foot examinations and regular cholesterol checks. It also saw improvements in patient outcomes, in terms of the percentages of patients with systolic blood pressure under the 140 mmHg target level (6 percentage points higher) and patients satisfying target cholesterol levels (10 points higher). No evidence yet for cost effects of bundled payments As of yet there has been no nationwide research on how bundled payments have affected the costs of curative health care. In tentative research, the health insurance companies Achmea and VGZ recently 12 | Effects of bundled payment on curative health care costs in the Netherlands.
(14) published widely divergent estimates, ranging from a surge in primary care costs of 49% (Sprangers et al., 2012) to cost savings of 40% in the total costs of care (VGZ, 2012). The Health Ministry thereupon commissioned the RIVM to provide more clarity about the effects of bundled payment on health care costs, drawing on the evaluation questions posed by the EIB.. 1.2 Purpose of this study The present study evaluates the effects that the introduction of the bundled payment model has had on the costs of curative health care. Distinction between effects of disease management and effects of bundled payments To clearly identify the statistical effects that bundled payments have on the costs of care, we must distinguish between cost effects generated by a disease management programme per se and cost effects generated by bundled payment arrangements. Given that disease management programmes are in themselves designed to improve the efficiency of care, those effects are theoretically independent of the method of payment. Bundled payment has been chosen as the preferred pricing mechanism for these programmes in the Netherlands, making it a means to an end: the creation of disease management programmes. Other ways of paying for disease management are also conceivable, such as the management fee mentioned above. In our study we therefore distinguish three comparison groups: 1. Bundled payment group: all diabetes patients of GPs who offer a diabetes management programme for which they claim a bundled fee (fee-for-condition payment). 2. Management fee group: all diabetes patients of GPs who offer a diabetes management programme on a fee-for-service basis but who claim an additional management fee to cover the planning and coordination of the services of the various health care providers. 3. Care-as-usual group: all diabetes patients of GPs who do not offer a diabetes management programme and who provide diabetes treatment on a fee-for-service basis. Before we can identify the effects of bundled payment on health care costs, we first need to map the extent of implementation of bundled payment. If it has only been implemented on a small scale, then any cost effects would be more marginal than in broader-scale implementation. Our study therefore begins by charting the current scale of implementation of disease management programmes for diabetes and for vascular risk that are covered by bundled payment contracts, as well as the costs generated by the people receiving care under any disease management programme. Our analysis of patient costs is confined to diabetes, whereby both the bundled payment and the management fee groups are considered in comparison to the care-as-usual group. Cost effects of VRM programmes could not yet be properly quantified, because such programmes have not yet been widely contracted (Van Til et al., 2010). As we anticipate that some cost effects of bundled payments will be specifically accountable to the fewer referrals to secondary care, we also investigate how many diabetes patients utilise hospital-based (outpatient or inpatient) specialist care. The implementation of COPD management programmes is not documented in this report.. An analysis for diabetes care and vascular risk management based on nationwide claim data, 2007-2010 | 13.
(15) The above considerations led us to the following research questions: 1a. What is the current scale of implementation of diabetes and vascular risk management programmes that are covered by bundled payment contracts? 1b. What curative health care costs do people generate when they receive care in disease management programmes for diabetes and vascular risk? 2. What effect does the introduction of bundled payment diabetes management have on curative health care costs in comparison to the fee-for-service arrangements with management fees or care as usual? 3. Has the introduction of bundled payment diabetes management led to reductions in the numbers of people with diabetes who utilise specialist care in comparison to arrangements with a management fee or care as usual? Our nationwide data on health care costs and health service utilisation was based on insurance claims data from Vektis, a health care information centre that records and provides access to data from all Dutch health insurance companies. Its databases reflect the health care costs reimbursed under the basic statutory insurance package specified by the Health Insurance Act (Zvw), including the compulsory and voluntary excesses paid by patients. This report makes use of Vektis claims data for 2007 to 2010.. 1.3 Structure of this report This report presents our study of the effects of bundled payment introduction on health care costs. Our most important conclusions and recommendations are summarised in the summary at the beginning of the report, which also serves as an executive summary. Chapters 2 and 3 describe the implementation of bundled payment programmes and estimate the health care costs for diabetes management and for vascular risk management (research questions 1a and 1b). Chapter 4 reports our comparative findings on health care costs (question 2), and in chapter 5 we assess changes in the utilisation rates of hospitalbased specialist services by diabetes patients (question 3). In chapter 6, we report and discuss our conclusions and make policy and research recommendations. Appendix 1 is an introduction to the Dutch health care system. Appendix 2 shortly describes the Vektis health care databases which were used in this study, while Appendix 3 gives a detailed description of the design and employed methods of the study. Appendix 4 lists the people at the RIVM who have contributed to the report, as well as the external steering group and the project group of Vektis. The final Appendix 5 provides figures and tables of additional performed analyses.. 14 | Effects of bundled payment on curative health care costs in the Netherlands.
(16) 2 Diabetes management: implementation, costs and cost trends Outline This chapter describes our study population and examines cost trends in the three comparison groups of diabetes patients in the period from 2007 to 2009. We first describe the study population we studied for the 2007-2010 period. We then analyse (section 2.2) how curative health care costs evolved in the three groups from 2007 to 2009 (cost data for 2010 were not yet fully available). Section 2.3 goes on to itemise the health care costs in bundled payment arrangements and explain these in more detail.. 2.1 Sample population 2.1.1 Comparison groups Size of sample population grew strongly in 2007-2010 The overall number of diabetes patients in our yearly samples increased from 183,721 in 2007 to 365,004 in 2010 (Table 2.1). This doubling in patient numbers was largely due to the increasing incorporation of Dutch health insurance policyholders into Vektis databases. Vektis did not begin its record keeping until 2006, and not all health insurers were reporting data in 2007 and 2008. Quite in line with our expectations, the number of patients in our bundled payment subgroup likewise grew sharply from 2007 to 2010, as a result of increasing numbers of care groups and increasing numbers of GPs who joined them. The coinciding declines in the numbers of patients in the management fee and care-as-usual groups also matched our expectations. The number of diabetes patients in our sample does not equal the total number of diabetes patients in the Netherlands. In order to ensure unambiguous differentiation between the comparison groups, and hence reliability in the results, we applied certain exclusion criteria in the sampling. Among these were the exclusion of patients whose data were not available for all four quarters of any calendar year, or who were registered with more than one GP or care group during a single year (see Appendix 3 for a full explanation of exclusion criteria). An analysis for diabetes care and vascular risk management based on nationwide claim data, 2007-2010 | 15.
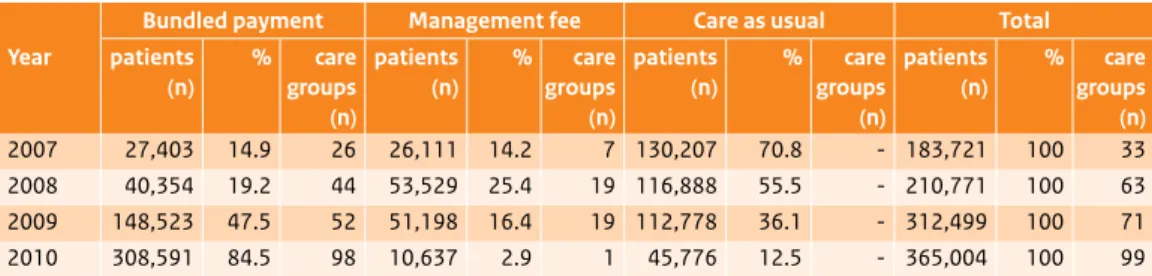
(17) Table 2.1 Numbers of diabetes patients and care groups by comparison group, 2007-2010. Bundled payment Management fee Care as usual Year. patients (n). %. 2007 2008 2009 2010. 27,403 40,354 148,523 308,591. 14.9 19.2 47.5 84.5. care patients groups (n) (n) 26 26,111 44 53,529 52 51,198 98 10,637. %. 14.2 25.4 16.4 2.9. care groups (n) 7 19 19 1. patients (n). %. 130,207 116,888 112,778 45,776. 70.8 55.5 36.1 12.5. care groups (n) -. Total patients (n). %. 183,721 210,771 312,499 365,004. 100 100 100 100. care groups (n) 33 63 71 99. Table 2.2 Characteristics of patients in the comparison groups, 2010. Bundled Management Care as usual Total payment fee General characteristics Number of patients 308,591 10,637 45,776 365,004 Mean age (SD) 67.1 (11.9) 66.8 (12.3) 66.9 (11.9) 67.1 (11.9) Gender (% male) 50.2 51.1 51.0 50.4 % of patients with comorbid chronic 34.5 34.2 34.8 34.5 conditions 1 other condition 26.4 26.7 26.8 26.5 2 other conditions 6.8 6.5 6.7 6.8 ≥3 other conditions 1.2 1.0 1.2 1.2 Medication use 83.3 89.6 100.0 85.6 % taking oral diabetes medicines# (1 or more insurance claims per year) 3.0 1.9 0.0 2.6 % injecting insulin$ (180 DDD§ or more per year) # = defined by ATC code A10B; $ = defined by ATC code A10A; § = daily defined doses; SD = standard deviation.. Similar patient characteristics across groups By 2010, most diabetes patients were in the bundled payment group (308,591 of the total of 365,004, or 84.9%; Table 2.2). Little difference was found between the three comparison groups in terms of age, gender or comorbidity rates. The care-as-usual group did differ from the other two in terms of medication use; unlike in the other groups, all care-as-usual patients were taking oral diabetes medicines. This discrepancy was due to differences in selection criteria for the three groups. Bundled payment and management fee groups were selected by how their diabetes management programme was claimed. As this was not possible for the care-as-usual group, it was selected by the types of medicines claimed (see Appendix 3). Patients injecting insulin were excluded from the care-as-usual group.. 16 | Effects of bundled payment on curative health care costs in the Netherlands.
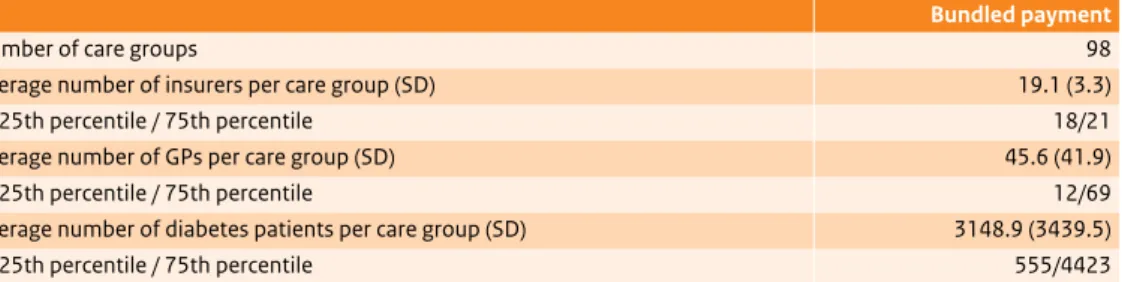
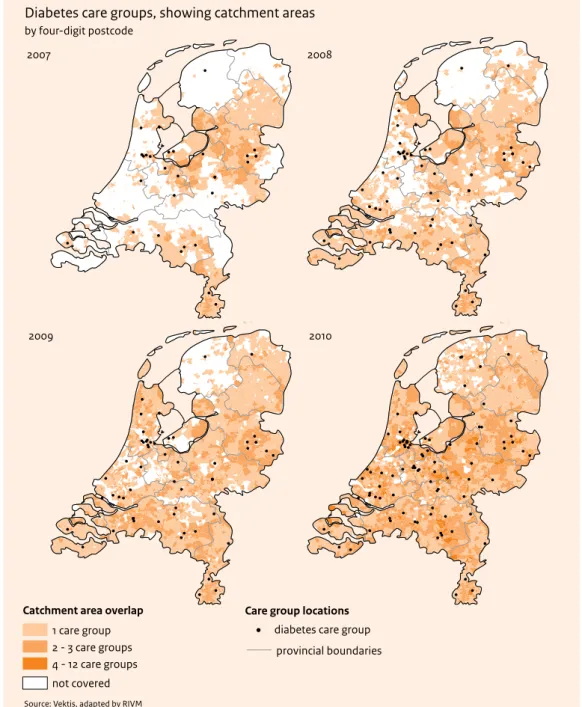
(18) Table 2.3 Average numbers of health insurance companies, GPs and diabetes patients per care group in the bundled payment comparison group, 2010*. Bundled payment Number of care groups 98 Average number of insurers per care group (SD) 19.1 (3.3) 25th percentile / 75th percentile 18/21 Average number of GPs per care group (SD) 45.6 (41.9) 25th percentile / 75th percentile 12/69 Average number of diabetes patients per care group (SD) 3148.9 (3439.5) 25th percentile / 75th percentile 555/4423 * Data in this table are based on the bundled payment comparison group in the sample; because many patients were excluded from the sample, the figures on the number of patients in bundled payment arrangements are underestimates of the actual number. SD = standard deviation. 2.1.2 Care groups Care group catchment areas covered almost the entire Netherlands A total of 98 care groups had bundled payment contracts for diabetes management in 2010. Strong increases had occurred in the numbers of care groups since 2007, when the bundled payment arrangements were introduced and the first care groups were established. There was also a swift expansion of the catchment areas of care groups in 2008 and 2009. By 2010, the catchment areas of all the care groups together covered virtually the whole country (Figure 2.1); most of the remaining ‘white spaces’ in the figure are apparently due to incomplete data provision by two small health insurers (see also Appendix 3). Generally speaking, care groups signed bundled payment contracts with the market-leading (preferential) health insurance company in their region; an average of eighteen other companies then ‘honoured’ that contract. An average of about 3100 patients per care group were being treated in the diabetes management programmes covered by bundled payment contracts in 2010.. 2.2 Curative health care costs for diabetes patients under differential pricing schemes from 2007 to 2009 This section traces trends in health care costs for people with diabetes in our three comparison groups in the 2007-2009 period. We report the average curative costs per patient per year. Figure 2.2 gives a breakdown of the health care costs in three categories. Increase in average curative costs per patient from 2007 to 2009 The average cost of curative health care per diabetes patient rose from € 4492 in 2007 to € 4832 in 2009 (Figure 2.3). In all three comparison groups, a cost surge was particularly observable from 2007 to 2008. General practice costs were a small share of total costs: € 400 per patient in 2009 In all three groups, the costs of care in the GP practice made up but a small part of the curative health care costs of diabetes patients (Figure 2.3). We could not make meaningful cross-group comparisons of An analysis for diabetes care and vascular risk management based on nationwide claim data, 2007-2010 | 17.
(19) Figure 2.1 Geographical diffusion of care groups with diabetes management programmes covered by bundled payment contracts, 2007- 2010 (showing catchment areas).. Diabetes care groups, showing catchment areas by four-digit postcode 2007. 2008. 2009. 2010. !. Catchment area overlap 1 care group 2 - 3 care groups 4 - 12 care groups. Care group locations diabetes care group provincial boundaries. not covered Source: Vektis, adapted by RIVM. 18 | Effects of bundled payment on curative health care costs in the Netherlands.
(20) Figure 2.2 Three categories of health care costs for diabetes patients.. Curative health care costs in diabetes care General practice costs. Costs of specialist care. Other costs. - Practice nurse costs - Diabetes-specific costs - Consultation fees and capitation allowances - Costs of integrated care (bundled or management fees). - Diabetes-related specialist care - Other specialist care. -. Costs for non-medical practitioners Pharmacy Medical aids Patient transport Mental health care. Figure 2.3 Mean curative costs per diabetes patient, by comparison group, 2007-2009. 6000 5000 4000 e 3000 2000 1000 0 2007 2008 2009. 2007 2008 2009. 2007 2008 2009. 2007 2008 2009. bundled payment. management fee. care as usual. total. GP. Hospital. Other. the average per-patient general practice costs, as the costs in the bundled payment and management fee groups also included fees for integrated care arrangements that were not available in the care-as-usual group. A large proportion of those fees covered non-GP-based care, such as that provided by subcontractors like dieticians and podiatrists. The general practice costs in those groups were therefore higher than those in the care-as-usual group. This overestimate of the general practice costs was the highest in the bundled payment group, because the bundled fees covered more services than management fees. Figures A5.1 to A5.4 show the year-by-year costs per comparison group per sector. Half of the costs were for hospital-based specialist care: about € 2500 per patient More than half of the average curative health care expenditures for diabetes patients went into hospitalbased specialist care (Figure 2.3). Average per-patient hospital costs rose in all three comparison groups from 2007 to 2009 (Figure A5.2). They diverged very little across groups in 2009: € 2573 per bundled payment patient, € 2528 per management fee patient and € 2564 per care-as-usual patient. An analysis for diabetes care and vascular risk management based on nationwide claim data, 2007-2010 | 19.
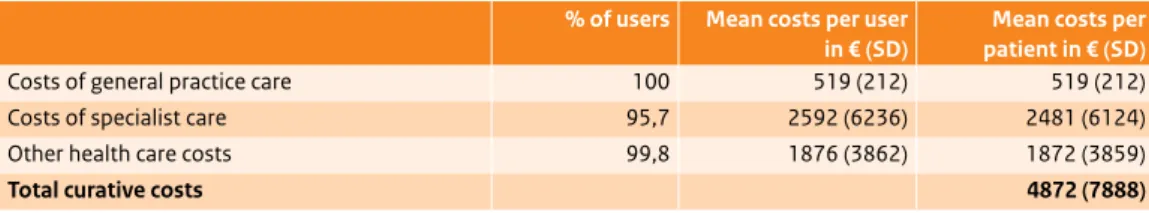
(21) Pharmacy costs predominated in ‘other costs’: about € 1100 per patient The category ‘other health care costs’ included pharmacy costs, medical aids, non-medical health care, patient transport and mental health care. These costs were comparable across groups in 2009 and averaged € 1941 per bundled payment patient, € 1929 per management fee patient and € 1978 per care-as-usual patient (Figures 2.2 and A5.3). Pharmacy costs were approximately € 1100 per patient in all three groups.. 2.3 Curative costs for diabetes patients in the bundled payment group in 2009 We now focus in more detail on the costs of general practice care, specialist care and other services in 2009 for patients being treated for diabetes specifically under bundled payment arrangements. We distinguish between average costs per user – costs of the services actually utilised by patients – and average costs per patient (whether or not the covered services were actually utilised). We also assess per-patient variations between and within care groups. Average curative costs per bundled payment patient over € 4800 per year The average costs per diabetes patient in the bundled payment comparison group were € 4872 in 2009. The costs of general practice care, € 519, were a small proportion. Specialist care, at € 2481 per patient, claimed about half the costs. Other health care services came to € 1872 per patient, thus also forming a substantial share of the yearly costs (Table 2.4). These average costs per bundled payment diabetes patient (mean age 67) were € 1325 higher than the average curative health care costs per resident of the Netherlands in the 65-to-69 age category.1 Costs of integrated care constituted one half of general practice costs In the bundled payment group, more than half of the general practice costs for diabetes patients, or € 287, were accounted to the integrated care arrangements. As we explain below in section A3.1.3, about 15% of the patients in this group were not in fact in a diabetes management pathway, but were receiving care as usual (see Table 2.5). The average cost of integrated care per user came to € 339 in 2009. This figure should not be understood as the average bundled fee for diabetes management, as the calculation also included people for whom the fee was claimed for fewer than four quarters of 2009. The average bundled payment was higher.. 1. According to the recent Cost of Illness study (Slobbe et al., 2011), the average cost per resident of the Netherlands was € 3374 in 2007. Applying a CPI-based deflator of 1.0511 for 2007-2009, we estimated a cost for 2009 of € 3374 × 1.0511 = € 3546 (Table A4.9).. 20 | Effects of bundled payment on curative health care costs in the Netherlands.
(22) Table 2.4 Average curative health care costs per diabetes patient and per actual user in bundled payment group in 2009 (N = 148,523). % of users Mean costs per user Mean costs per in € (SD) patient in € (SD) Costs of general practice care 100 519 (212) 519 (212) Costs of specialist care 95,7 2592 (6236) 2481 (6124) Other health care costs 99,8 1876 (3862) 1872 (3859) Total curative costs SD= standard deviation.. 4872 (7888). Table 2.5 Average costs of general practice care per diabetes patient and per actual user in bundled payment group in 2009 (N = 148,523). % of users Mean costs per Mean costs per user in € (SD) patient in € (SD) Costs of integrated care 84.7 339 (84) 287 (145) Diabetes-specific costs 27.5 16 (47) 5 (26) Practice nurse costs 86.7 20 (30) 17 (29) Consultation and capitation fees 100 210 (153) 210 (153) Costs of general practice care 519 (212) Practice nurse = nurse working in GP practice with appropriate professional qualifications; SD = standard deviation.. Some bundled payment patients had additional diabetes-specific general practice costs Over and above the bundled diabetes management fee, GP practices claimed additional ‘diabetes-specific costs’ in 2009 for more than one quarter of the patients in the bundled payment comparison group (Table 2.5). These costs were low (€ 5 per patient, € 16 per user). Examples were blood glucose testing strips or yearly diabetes counselling. The additional diabetes-specific claims are attributable in part to the fact that some patients in the bundled payment group were not in a diabetes management pathway (as explained in section A3.1.3) or to the inclusion of patients for whom fewer than four quarterly bundled payments were claimed in 2009. We were unable to judge whether double payments were also claimed. Virtually all bundled payment patients received specialist care in 2009 Claims for additional hospital-based specialist services were made in 2009 for nearly all patients in the bundled payment group (95.7%; Table 2.4). Average per-patient costs for all types of hospital services for all health conditions came to € 2481 that year. Only 3.3% of those costs (averaging € 81 per patient) involved episode-of-care payments for diabetes-specific treatment (Table 2.6). These additional costs were low because only 11.4% of the patients utilised such diabetes-specific services. Most patients who went to hospitals for such diabetes-related treatment received outpatient care; fewer than 1% received day-patient care and even fewer received diabetes-specific inpatient care.. An analysis for diabetes care and vascular risk management based on nationwide claim data, 2007-2010 | 21.
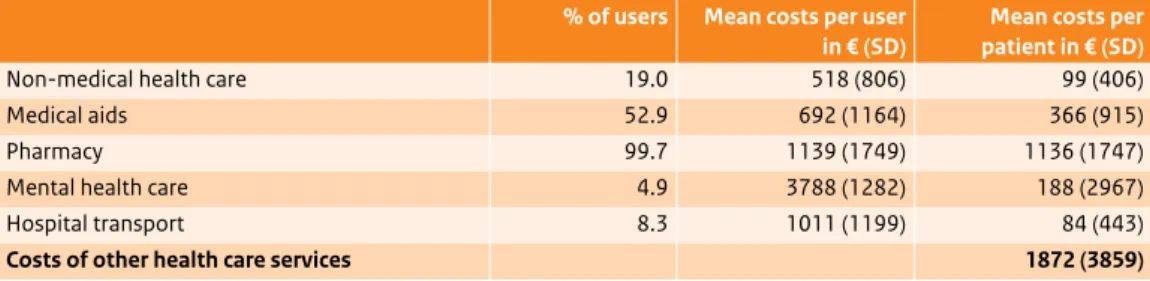
(23) Table 2.6 Average costs of diabetes-specific specialist care per diabetes patient and per user in bundled payment group in 2009 (N = 148,523). % of users Mean costs per Mean costs per user in € (SD) patient in € (SD) Outpatient specialist diabetes treatment 10.7 443 (173) 46 (145) Day-patient specialist diabetes treatment 0.9 948 (573) 9 (105) Inpatient specialist diabetes treatment 0.6 4259 (2323) 26 (381) Specialist diabetes treatment SD = standard deviation.. 11.4. 714 (1081). 81 (430). Table 2.7 Average costs of other health care services per diabetes patient and per actual user in bundled payment group in 2009 (N = 148,523). % of users Mean costs per user Mean costs per in € (SD) patient in € (SD) Non-medical health care 19.0 518 (806) 99 (406) Medical aids 52.9 692 (1164) 366 (915) Pharmacy 99.7 1139 (1749) 1136 (1747) Mental health care 4.9 3788 (1282) 188 (2967) Hospital transport 8.3 1011 (1199) 84 (443) Costs of other health care services SD = standard deviation.. 1872 (3859). Other costs were largely pharmacy costs The average costs for services not categorised as GP or specialist care were € 1872 per bundled payment patient in 2009 (Table 2.7). The largest share of these was for pharmaceutical products (€ 1136). Almost all patients in the bundled payment group were on medication (99.7%). Mental health care costs came to € 188 per patient, but the proportion of users was only 4.9%; calculated by actual user, those costs were high at € 3788. Wide cost variations across and within care groups In addition to calculating the various types of health care costs, we also assessed variations between and within care groups. In terms of the average per-patient costs in 2009, major differences between care groups emerged (Figures A5.5 - A5.8). Variations in the average per-patient costs were also wide within the care groups themselves; that is, there were patients with low costs and with very high costs. In view of these large differences, it did not suffice to simply report the mean costs per patient. We therefore also calculated the 25th and 75th percentiles of the mean costs (Figures A5.9 - A5.12). Yet even on the basis of those dispersion measures, wide differences between care groups still remained.. 22 | Effects of bundled payment on curative health care costs in the Netherlands.
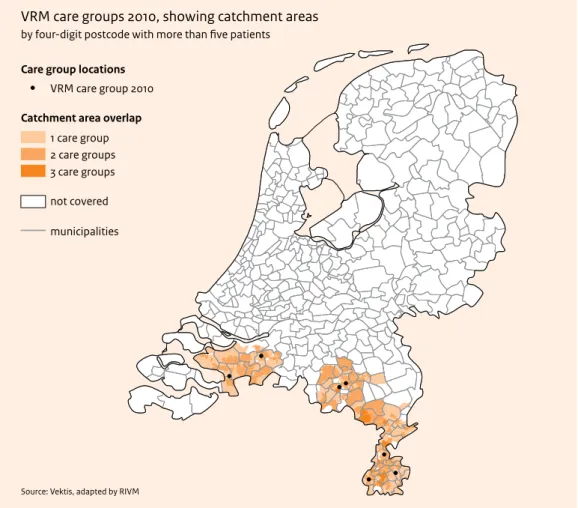
(24) 3 Vascular risk management: implementation and costs Outline This chapter traces the implementation of vascular risk management (VRM) programmes with bundled pricing arrangements. We first briefly describe the general characteristics of the care groups, GPs and patients involved in the VRM programmes. Section 3.2 details the health care costs of the patients in 2010, the first year these could be claimed under bundled payment contracts.. 3.1 Progress in implementing VRM Seven care groups had VRM bundled payment contracts in 2010 In 2010, there were seven care groups in the Netherlands with bundled payment contracts for vascular risk management; all seven also had bundled payment contracts for diabetes care. An average of just under 70 GPs per care group were involved in the VRM programmes (see Table 3.1) – fewer than in diabetes management programmes. This means that, within care groups, not all doctors offering diabetes management were also providing VRM. Care groups with bundled payment VRM programmes all in south of country The seven care groups providing vascular risk management on a bundled payment basis were located solely in some southern regions of the Netherlands (Figure 3.1). It seemed evident that the purchasing strategy of the regional preferential insurance company was a strong influencing factor in whether or not care groups had contracted VRM in 2010. On average, that insurer’s bundled payment contract for VRM was ‘honoured’ by eleven ‘peripheral’ insurance companies (Table 3.1) – lower than the average of nineteen companies that abided by preferential diabetes contracts (see Table 2.3).. An analysis for diabetes care and vascular risk management based on nationwide claim data, 2007-2010 | 23.
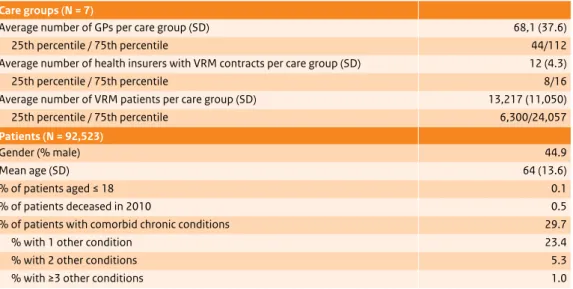
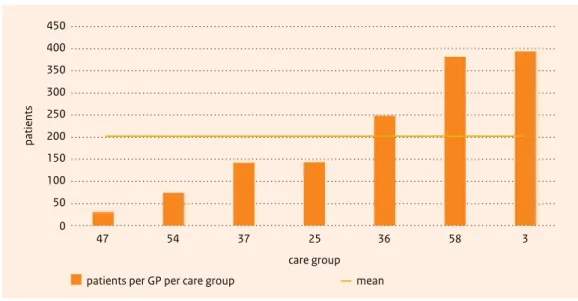
(25) Table 3.1 Characteristics of care groups and patients in vascular risk management (VRM) programmes on a bundled payment basis, 2010. Care groups (N = 7) Average number of GPs per care group (SD) 68,1 (37.6) 25th percentile / 75th percentile 44/112 Average number of health insurers with VRM contracts per care group (SD) 12 (4.3) 25th percentile / 75th percentile 8/16 Average number of VRM patients per care group (SD) 13,217 (11,050) 25th percentile / 75th percentile 6,300/24,057 Patients (N = 92,523) Gender (% male) Mean age (SD) % of patients aged ≤ 18 % of patients deceased in 2010 % of patients with comorbid chronic conditions % with 1 other condition % with 2 other conditions % with ≥3 other conditions SD = standard deviation.. 44.9 64 (13.6) 0.1 0.5 29.7 23.4 5.3 1.0. More than 13,000 patients on average per care group in VRM programmes, but with large variations by GP An average of 13,217 patients per participating care group were involved in its vascular risk management programme. The numbers of VRM patients per GP within the seven care groups varied from 30 to nearly 400 (Figure 3.2). These disparities seem wider than would be expected from any differences in the prevalence of cardiovascular disease or risk factors; possibly different criteria were used by the various care groups to select patients for the programmes. The average number of patients taking part in a VRM programme per care group was considerably higher than the average number of 6151 in diabetes programmes.2 This is mainly because the prevalence rates of cardiovascular disease and cardiovascular risk are higher than the rate for diabetes; people in both of those cardiovascular categories meet the selection criteria for the VRM programmes. VRM patients were younger on average than diabetes patients and had lower rates of comorbid diseases The characteristics of patients in VRM programmes differed from those of the diabetes patients. VRM patients were younger on average (age 64 versus 67) and had a lower rate of comorbidity (29.7% versus 34.5%). Their mortality rate in 2010 was also considerably lower. A possible explanation for these differences is again that VRM, unlike diabetes management, is not restricted to those who already have the disease; people with high risk are also eligible. VRM participants thus form a relatively healthier population.. 2. Based on patient numbers before application of exclusion criteria (see Appendix 3).. 24 | Effects of bundled payment on curative health care costs in the Netherlands.
(26) Figure 3.1 Geographical distribution of care groups with bundled payment VRM programmes, 2010 (also showing catchment areas).. VRM care groups 2010, showing catchment areas by four-digit postcode with more than five patients Care group locations VRM care group 2010 Catchment area overlap 1 care group 2 care groups 3 care groups not covered municipalities. Source: Vektis, adapted by RIVM. An analysis for diabetes care and vascular risk management based on nationwide claim data, 2007-2010 | 25.
(27) Figure 3.2 Numbers of patients per GP per care group in VRM programmes in 2010. 450 400 350 patients. 300 250 200 150 100 50 0. 47. 54. 37. 25. 36. 58. 3. care group patients per GP per care group. mean. 3.2 Curative health care costs in VRM programmes in fourth quarter of 2010 Average costs for VRM patients calculated for fourth quarter of 2010 only Because only one of the seven care groups had concluded a bundled payment contract for VRM for the full year in 2010, we confined ourselves to fourth-quarter claims data to assess the health care costs. The cost estimates for hospital-based specialist care and mental health care should be interpreted with some caution, as not all the relevant data had been entered into the Vektis databases at the time of our analysis; our figures for these items are therefore underestimates. General practice costs per VRM patient about € 100 The average costs of general practice care were approximately € 100 for VRM patients in the fourth quarter of 2010 (Table 3.2). About half of these were accountable to integrated care arrangements. The direct costs of the care provided by practice nurses (€ 3) formed only a small part of the VRM patients’ cost profile; the real practice nurse costs were higher, as most were categorised as integrated care costs. The per-patient costs of additional GP care for VRM-specific symptoms were also low (€ 1), due to the small percentage of actual users. Over 40% of VRM patients made use of hospital-based specialist services A total of 43.3% of all VRM patients utilised some form of specialist care in the fourth quarter of 2010. Per-patient costs averaged € 440 (Table 3.5). When it came to the VRM-specific episode-of-care payments claimed for these patients, the vast majority of patients received outpatient care only (Table 3.3). Fewer than 10% underwent day-patient or inpatient treatment. Despite the small percentage with inpatient admissions (4.8%), the average per-patient costs were relatively high at € 160. 26 | Effects of bundled payment on curative health care costs in the Netherlands.
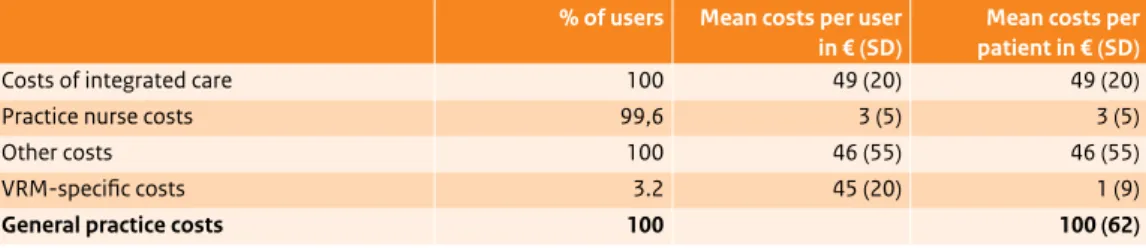
(28) Table 3.2 Average costs of general practice care per VRM patient and per actual user, 4th quarter of 2010 (N = 92,523). % of users Mean costs per user Mean costs per in € (SD) patient in € (SD) Costs of integrated care 100 49 (20) 49 (20) Practice nurse costs 99,6 3 (5) 3 (5) Other costs 100 46 (55) 46 (55) VRM-specific costs 3.2 45 (20) 1 (9) General practice costs SD = standard deviation.. 100. 100 (62). Table 3.3 Average costs of VRM-specific specialist care per VRM patient and per actual user, 4th quarter of 2010 (N = 92,523). % of users Mean costs per user Mean costs per in € (SD) patient in € (SD) Outpatient VRM-specific treatment 28.7 280 (974) 80 (537) Day-patient VRM-specific treatment 4.7 844 (1,429) 40 (358) Inpatient VRM-specific treatment 4.8 3,363 (4,065) 160 (1,141) SD = standard deviation. Table 3.4 Average costs of other health care services per VRM patient and per actual user, 4th quarter of 2010 (N = 92,523). % of users Mean costs per user Mean costs per in € (SD) patient in € (SD) Pharmacy 97.5 507 (1267) 495 (1254) Medical aids 33.8 453 (1109) 153 (679) Non-medical health care 13.7 574 (845) 79 (370) Mental health care 0.03 1,370 (4781) 45 (898) Patient transport 6.8 758 (1036) 52 (330) Costs of other health care services SD = standard deviation.. 97.9. 823 (1998). Average costs for ‘other care’ per VRM patient were € 823 Per-patient costs of services not categorised as GP or hospital-based care averaged € 823 in the fourth quarter of 2010, and more than half of these (€ 495) were pharmacy costs (Table 3.4). Mental health care costs were relatively low at € 45 per patient, but the rate of mental health care utilisation was very low indeed (.03%). Average costs per VRM patient were € 1362 The average total cost of curative health care for VRM patients in the fourth quarter of 2010 was € 1362 (Table 3.5). A substantial share of these costs, € 823 per patient, was for ‘other services’. The cost of general practice care formed a relatively small part of the total.. An analysis for diabetes care and vascular risk management based on nationwide claim data, 2007-2010 | 27.
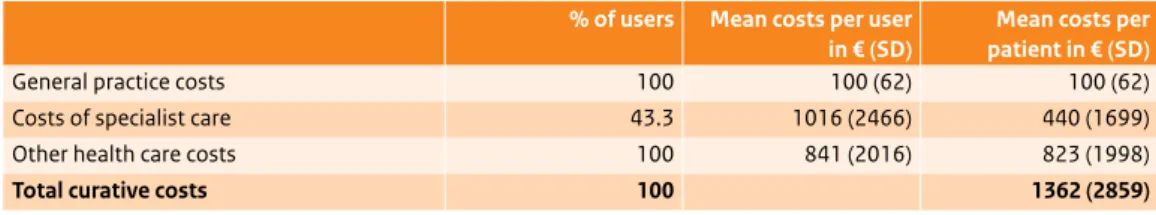
(29) Table 3.5 Average curative health care costs per VRM patient and per actual user, 4th quarter of 2010 (N = 92,523). % of users Mean costs per user Mean costs per in € (SD) patient in € (SD) General practice costs 100 100 (62) 100 (62) Costs of specialist care 43.3 1016 (2466) 440 (1699) Other health care costs 100 841 (2016) 823 (1998) Total curative costs SD = standard deviation.. 100. 28 | Effects of bundled payment on curative health care costs in the Netherlands. 1362 (2859).
(30) 4 Effects of bundled payment arrangements on curative diabetes costs in comparison to management fee arrangements and care as usual Outline This chapter addresses research question 2: ‘What effect does the introduction of bundled payment diabetes management have on curative health care costs in comparison to the fee-for-service arrangements with management fees or care as usual?’ We approach this analysis in two steps. We first identify the overall effects on curative costs associated with the introduction of diabetes management, with no distinctions made as to pricing systems (section 4.1). We then examine specifically whether the bundled payment arrangements themselves had any distinct influence on the health care costs of diabetes patients (section 4.2). Our analyses are based on regression analyses for 2008 and 2009. The year 2010 could not be included, as not all relevant data had yet been entered into the Vektis databases; the 2007 data were not analysed because of the small patient numbers in some groups. Appendix 5 gives a detailed overview of results.. 4.1 What effect did diabetes management programmes have on curative health care costs in comparison with care as usual? To assess whether diabetes management programmes affected the health care costs of diabetes patients, we combined the bundled payment and management fee subgroups from our sample and compared them to the care-as-usual subgroup. The cost comparison was based on the differences in cost trends between these two groups from 2008 to 2009 (Box 4.1). We began by determining the increase in curative costs for all diabetes patients that year.. An analysis for diabetes care and vascular risk management based on nationwide claim data, 2007-2010 | 29.
(31) Box 4.1 Summary of analysis method in Table 4.1 Sample:. diabetes management patients (bundled payment + management fee groups; n = 20,257 +13,722 = 33,979) versus care-as-usual patients (n = 30,160), including only patients remaining in same comparison group throughout 2008 and 2009 (N = 64,139). Dependent variable:. difference in curative costs between 2008 and 2009. Control variables:. baseline curative costs in 2008; patient characteristics (age, gender, comorbidity). Analyses:. multivariate regression, including two-level models (GP- patient, insurer-patient). Sensitivity analyses:. (1) patients with oral medication only (A10B) and (2) data from 2007 to 2009. Table 4.1 Cost increases in euros from 2008 to 2009 for diabetes patients (whether or not in diabetes management programmes) (N = 64,139). Model 0 SE Model 1 SE Intercept 219*** 24 -678*** 44 2008 baseline costs -0.6*** 0.004 -0.6*** 0.004 16*** 2 Age3 (centred) Gender (ref. = female) 290*** 48 Comorbidity (0-15) Diabetes management patient. yes no SE = standard error; p-values: ** ≤ .01; *** ≤ .001.. 1789*** 142** ref.. 36 47. Average costs increased for all diabetes patients Looking first at the cost trends for all diabetes patients, we found that the average per-patient costs rose by € 219 from 2008 to 2009 (Table 4.1, model 0). This was an increase of 5%, matching the coinciding rise for the Dutch general population (CBS, 2012a). The average curative costs per diabetes patient in 2008 (baseline costs) proved to be negatively associated with the cost increase; that is, the higher the 2008 costs, the smaller the 2009 increase (a 60-cent lower increase for every euro of higher costs in 2008). The patient characteristics age, gender and comorbidity also significantly influenced the cost increase (model 1); older patients, men and patients with comorbid conditions showed higher increases. Greater cost increases for diabetes management patients As model 1 in Table 4.1 shows, the 2008-2009 cost trend for patients in diabetes management diverged from that for patients receiving care as usual. After adjustment for patient characteristics, the costs for diabetes management patients increased by € 142 more than those for care-as-usual patients. 3 Few apparent cost influences from GPs, care groups or insurance companies Multilevel analyses were carried out to detect any separate influence that GPs or health insurers might have had on the differential cost increases. Detailed results are reported in Appendix 5. These additional analyses indicated that GPs played only a marginal role in the cost increase differential between diabetes management and care-as-usual patients (Table A5.1, model 4). That is, although the increases did vary 3. Reference age is 67.8. 30 | Effects of bundled payment on curative health care costs in the Netherlands.
(32) between GPs, the actual GP-level differential cost increase between diabetes management and care as usual was only € 4. Since care-as-usual patients were not being treated in care groups, we could not investigate whether care groups had any such effect overall. We did, however, use the data in the bundled payment comparison group to test for differences between care groups in their per-patient costs for 2009, finding only limited care group-level variation (Table A5.2). We further tested whether care groups with recently implemented bundled payment contracts in 2009 diverged from those with longer-running programmes in terms of per-patient costs, but no differences emerged (see Box 4.2). Nor was any significant effect found for health insurance companies in relation to the 2008-2009 per-patient cost increases (Table A5.1, model 6). Sensitivity analyses yielded similar results We tested our findings in two sensitivity analyses. Because we had identified care-as-usual patients in the insurance database on the basis of their medication codes and diabetes management patients by their procedure codes (see Table A3.3), the latter group also included people with type 2 diabetes who were not taking medication. In our first sensitivity analysis, we repeated our analyses including only the patients in both groups who were taking oral medication. The differential cost increase between groups was maintained (Table A5.1, model 7). In the second sensitivity analysis, we repeated our analyses including only those patients whose data over the entire 2007-2009 period were available and who were continuously in the same comparison group. Here, too, the results were highly comparable to the previous ones, with greater cost increases for patients in diabetes management than for care-as-usual patients (Table A5.3).. An analysis for diabetes care and vascular risk management based on nationwide claim data, 2007-2010 | 31.
(33) Box 4.2 Did care groups with bundled payment contracts vary in their per-patient costs? Curative costs per patient varied about € 1000 between care groups In the figure below, we have plotted the per-patient curative health care costs by care group against the numbers of diabetes patients per care group in 2009. In care groups with more than 650 diabetes patients, the average health care costs per patient ranged between € 4000 and € 5000, a span of about € 1000. Most care groups with fewer than 600 diabetes patients had per-patient costs averaging € 5000 to € 6000. Groups with smaller numbers of sampled patients did not necessarily have fewer diabetes patients in total, as some may have had more patients excluded during the sample selection (see Appendix 3). No higher costs per patient in start-up year Care groups that had first begun work in 2009 are denoted by grey dots in the figure below, and older ones by black dots. As no systematic distribution of new groups is evident, we conclude that the year of inception had no influence on per-patient health care costs in 2009. Figure Mean per-patient curative costs in care groups with bundled payment diabetes management contracts, by numbers of patients per care group, 2009 (N = 52). 7000 6000 5000 4000. €. 3000 2000 1000 0. 0. 500. 1000. 1500. 2000. 2500. 3000. 3500. 4000. 4500. numbers of patients per care group care group existing > 1 year. care group existing <1 year. 32 | Effects of bundled payment on curative health care costs in the Netherlands. 5000 5500. 6000.
(34) 4.2 What effect did the introduction of bundled payment diabetes management have on curative health care costs in comparison to management fee arrangements or to care as usual? We now examine the extent to which the increase in health care costs we observed in section 4.1 could be attributable to the introduction of bundled payment schemes. We addressed this research question in two different analyses. First, we compared the increases in health care costs for those patients in the bundled payment, management fee and care-as-usual groups who stayed in the same comparison group throughout the 2008-2009 period (section 4.2.1). This analysis could identify differences in cost trends between the comparison groups, but could not provide evidence on any causal effects of bundled payments. We therefore conducted a second analysis assessing cost trends for patients who were transferred from management fee to bundled payment arrangements from 2008 to 2009 (section 4.2.2).. 4.2.1 Effects of bundled payment arrangements on curative health care costs in comparison to management fee arrangements or care as usual (for patients remaining in same arrangement in 2008-2009) Our first analysis examines effects of bundled payment amongst patients who stayed in the same comparison group in the two-year period. Box 4.3 describes the method of analysis. Box 4.3 Summary of analysis method in Table 4.2 Sample:. bundled payment patients (n = 20,257) vs management fee patients (n = 13,616) vs care-as-usual patients (n = 30,160). Reference group: care as usual. All patients remained in the same comparison group throughout 2008 and 2009 (N = 64,033).. Dependent variable:. difference in curative costs between 2008 and 2009. Control variables:. baseline curative costs in 2008; patient characteristics (age, gender, comorbidity). Analyses:. multivariate regression, including two-level models (GP- patient, insurer-patient). Sensitivity analyses:. patients with oral medication only (A10B). Greater cost increases for bundled payment patients than for management fee patients or care-asusual patients The health care costs of patients in the bundled payment group increased by € 288 from 2008 to 2009, significantly more than the costs of patients receiving care as usual (Table 4.2). The cost increase for patients in the management fee group did not significantly diverge from that in the care-as-usual group. This implies that the previously observed greater cost increase of € 142 for patients in some form of diabetes management as compared to care-as-usual patients (see section 4.1) is completely accountable to those in the bundled payment group. Supplementary analyses showed that costs were not significantly clustered by GPs or insurance companies (Table A5.4, models 4 and 7).. An analysis for diabetes care and vascular risk management based on nationwide claim data, 2007-2010 | 33.
(35) Table 4.2 Differences in total health care costs in euros from 2008 to 2009 for diabetes patients in same pricing system in both years (N = 64,033)4. Model 1 SE Intercept -882*** 46 2008 baseline costs -0,7*** 0,004 Pricing system Bundled payment 288*** 55 Management fee -74 63 Care as usual ref. 17*** 2 Age5 (centered) Gender (ref. = female) 296*** 48 Comorbidity 1813*** 36 SE = standard error; *** p-value ≤ .001.. Sensitivity analyses yielded a similar picture Here again, an analysis including only those diabetes patients taking oral medication produced very similar results (Table A5.1, model 7). 45. 4.2.2 Effects of bundled payment arrangements on the curative health care costs of management fee patients transferring to bundled payment or care as usual in 2009 Our second analysis of the effects of bundled payment arrangements was designed to detect any causal effects these might have had on health care costs. Box 4.4 Summary of analysis method in Table 4.3 Sample:. patients who were in the management fee group in 2008 (N = 14,666); comparisons were made between patients who remained in those arrangements in 2009 and those who were transferred to bundled payment or care-as-usual arrangements. Dependent variable:. difference in curative costs between 2008 and 2009. Control variables:. baseline curative costs in 2008; patient characteristics (age, gender, comorbidity). Analyses:. multivariate regression, including two-level models (GP- patient, insurer-patient). Sensitivity analyses:. patients with oral medication only (A10B). The subsample analysed here consisted of patients in our management fee subgroup from 2008. These patients were already receiving diabetes management; only the pricing system changed for some of them in 2009, enabling the isolated effect of that change to be identified. The health care costs of patients transferred to bundled payment in 2009 were compared to the costs of (1) those transferred to care-asusual arrangements in 2009 and (2) those remaining in management fee arrangements. Box 4.4 summarises the method of analysis applied.. 4 5. Patient numbers differ slightly from those in Table 4.1, because some care groups had non-existent provider codes. Reference age is 67.8.. 34 | Effects of bundled payment on curative health care costs in the Netherlands.
(36) Table 4.3 Differences in curative health care costs in euros from 2008 to 2009 for diabetes patients in management fee arrangements in 2008 (N = 14,666). Model 1 SE Intercept -751** 256 2008 baseline costs -0.6*** 0.008 Pricing system Bundled payment -92 344 Management fee -6 254 Care as usual ref. -86 n.a. Difference between bundled payment and management fee groups6 18*** 4 Age7 (centred) Gender (ref. = female) 200* 93 Comorbidity (0-15) 1703*** 70 SE = standard error; n.a. = not applicable; p-values: * ≤ .05; *** ≤ .001.. Numbers of patients were limited because few care groups worked with management fees in 2008 The total number of patients under management fee arrangements in 2008 was small (N = 14,666) in comparison with the numbers in our other analyses. In 2009, some of these patients (n = 554) were transferred to bundled payment arrangements. Another limited number were transferred to care as usual (n = 496). In view of these small patient numbers, the results should be interpreted with caution. No significant cost increases for patients transferred to bundled payment arrangements in 2009 As Table 4.3 shows, the cost increases for patients transferring to bundled payment did not significantly diverge from the increases for patients transferring to care as usual or staying in management fee arrangements. No causal effect is therefore apparent between the implementation of bundled payments and the cost increases previously observed in the bundled payment group. Additional analyses controlling for clustering by GPs or health insurance companies did not alter these conclusions (Table A5.5, models 4 and 6).67 Sensitivity analyses yielded no different insights Repetition of the analyses including only patients with oral medication produced no different results than the broader analyses (Table A5.5, model 5).. 6 7. Using the least-square means procedure. Reference age is 67.8.. An analysis for diabetes care and vascular risk management based on nationwide claim data, 2007-2010 | 35.
(37) 36 | Effects of bundled payment on curative health care costs in the Netherlands.
(38) 5 Effects of bundled payment arrangements on the numbers of diabetes patients using specialist care Outline The aim of the Dutch Ministry of Health, Welfare and Sport in introducing the bundled payment model was to enhance the quality of diabetes management in primary care. Fewer people with diabetes would then need to utilise outpatient or inpatient hospital-based (specialist) care, thus reducing costs. This chapter investigates whether the anticipated decrease in patient numbers in secondary care has actually occurred. Section 5.1 assesses the extent to which diabetes management programmes of any kind are associated with lower utilisation rates of hospital-based services as compared to care as usual. Section 5.2 then examines whether the bundled payment approach in particular has led to an independent reduction in the number of patients using specialist care in comparison to the management fee model or to care as usual.. 5.1 Effects of diabetes management programmes on the use of specialist care in 2009 Fewer diabetes management patients used specialist care As Figure 5.1 shows, almost 17% fewer patients who were participating in any kind of diabetes management programme in 2009 utilised hospital-based specialist services than patients receiving care as usual.8 The effect of diabetes management stands out even more clearly if we look at diabetes-specific hospital-based specialist services alone: nearly 40% fewer diabetes management patients used diabetesspecific specialist services (OR = 0.58). The latter effect was less pronounced for inpatient than for outpatient care (OR = 0.72 vs 0.59).. 8. The conclusion that 17% fewer diabetes management patients used specialist care derives from the odds ratio of 0.83 (Figure 5.1). An odds ratio (OR) is a comparison between the likelihood that an event will occur in one group and the likelihood that it will occur in another.. An analysis for diabetes care and vascular risk management based on nationwide claim data, 2007-2010 | 37.
Afbeelding
+7
GERELATEERDE DOCUMENTEN
De ACM heeft daarop destijds aangegeven aan GTS dat te willen doen op basis van zo recent mogelijke cijfers over realisaties (besparingen moeten blijken).. GTS geeft aan
De ACM heeft echter geen aanwijzingen dat zij geen goede schatter heeft voor de kosten van kwaliteitsconversie per eenheid volume.. Daarom komt zij tot de conclusie dat zij wel
De historische PV gemeten op de transportdienst achtte de ACM representatief voor de verwachte PV op de aansluitdienst.. De transportdienst vertegenwoordigt het grootste deel van
Dit geldt namelijk niet voor zaken betreffende mededingingsbeperkende afspraken (artikel 6 Mw/101 VWEU). Het geldt evenmin voor misbruikzaken in niet-gereguleerde sectoren.
Dit nacalculatiekader is: de ACM calculeert niet na, tenzij is voldaan aan elk van de volgende criteria: (i) de gegevens zijn bij het nemen van het methodebesluit slecht te
De kosten tijdens de reguleringsperiode van investeringen in gebruik genomen tot en met 2020 kan een netbeheerder alleen terugverdienen als deze zijn opgenomen in de GAW bij
Daarbij houdt PRW aandacht voor de belangen en kansen die deze ontwikkeling biedt voor de kokkelvissers en de natuur op de Waddenzee zelf..
geïsoleerd te staan, bijvoorbeeld het bouwen van een vistrap op plaatsen waar vismigratie niet mogelijk is omdat de samenhangende projecten zijn vastgelopen op andere
