C.F. van Kreijl | A.G.A.C. Knaap | J.M.A. van Raaij (Editors-in-Chief)
O
u
r f
oo
d,
ou
r h
ea
lth
RIVM National Institute for Public Health and the Environment P.O. Box 13720 BA Bilthoven The Netherlands www.rivm.nl/en
for this. Each year, overweight and unfavourable dietary composition account for thousands of new cases of illness and unnecessary deaths. The number of young people and adults who are overweight is increasing. Foodborne infections and allergic reactions to food constituents also cause some health loss. This report addresses questions such as what is the health loss due to unhealthy diets and unsafe food in the Netherlands? What are the causes of this problem? What effects can we expect to see in the future?
The report shows that, in the Netherlands, a substantial portion of health loss can be prevented by a healthier diet and safer food. This requires an integrated strategy, involving greater activity on the part of all those involved. The main opportunities are to be found on the supply side, i.e. in the hands of the private sector. But the consumer also has an important part to play, by making the proper choices in terms of health. The government must first create the necessary conditions, possibly followed by enforcement where appropriate.
This report is a collaborative publication of the Nutrition, Medicines and Consumer Safety Division and the Public Health and Health Services Division of the National Institute for Public Health and the Environment (RIVM). It is one of a series of reports on Public Health Forecasts in the Netherlands. The report was originally published in Dutch under the title Ons eten gemeten: Gezonde voeding en veilig voedsel in Nederland [RIVM-report number: 270555009; ISBN 90-313-4411-7; 2004]. See also the RIVM website: www.rivm.nl/en.
Our food, our health
Healthy diet and safe food in the Netherlands
hier nog
de EAN-code
Nutrition, Medicines and Consumer Safety Division Public Health and Health Services Division
National Institute for Public Health and the Environment P.O. Box 1, 3720 BA Bilthoven, The Netherlands
Tel: +31 30 274 9111; fax: +31 30 274 2971
Healthy diet and safe food in
the Netherlands
C.F. van Kreijl, A.G.A.C. Knaap and J.M.A. van Raaij (Editors-in-Chief)
Editors:
M.C.M. Busch, A.H. Havelaar, P.G.N. Kramers, D. Kromhout,
F.X.R. van Leeuwen, H.M.J.A. van Leent-Loenen, M.C. Ocké
and H. Verkleij
P.O. Box 1
3720 BA Bilthoven The Netherlands All rights reserved
© 2006 National Institute for Public Health and the Environment, Bilthoven, The Netherlands.
The report was originally published in Dutch under the title Ons eten gemeten: Gezonde voeding en veilig voedsel in Nederland
Translation: Taalcentrum-VU, Amsterdam
The greatest care has been devoted to the accuracy of this publication. Nevertheless, the editors, authors and the publisher accept no liability for incorrectness or incom-pleteness of the information contained herein. They would welcome any suggestions concerning improvements to the information contained herein.
All rights reserved. No part of this publication may be reproduced, stored in an auto-mated database or made public in any form or by any means whatsoever, whether electronic, mechanical, using photocopies, recordings or any other means, without the prior written permission of the National Institute for Public Health and the Envi-ronment. Inasmuch as the production of copies of this publication is permitted on the basis of Article 16b, 1912 Copyright Act in conjunction with the Decree of 20 June 1974, Bulletin of Acts, Order and Decrees 351, as amended by the Decree of 23 August 1985, Bulletin of Acts, Orders and Decrees 471, and Article 17, 1912 Copyright Act, the appropriate statutory fees should be paid to the Stichting Reprorecht (Publishing Rights Organization), PO Box 882, 1180 AW Amstelveen, The Netherlands. Those whishing to incorporate parts of this publication in anthologies, readers and other compilations (Article 16, 1912 Copyright Act) should contact RIVM.
RIVM report number 270555009 ISBN 90-6960-135-4
ISBN 978-90-6960-135-9 NUR 882
FOREWORD
Food. We cannot survive without it. It is a primary life requirement for us all. But food is more than that. Food also plays an important role in terms of our health. An opti-mal diet helps to maintain good health.
In the Netherlands, an unhealthy dietary pattern is responsible for a large proportion of the ill-health and deaths due to cardiovascular diseases, diabetes and cancer. An increasing number of Dutch people are overweight. This is due to eating too much, particularly fat-rich foods, and to insufficient physical activity. The increase in the number of children with overweight is alarming. We must halt this trend by encour-aging people to adopt a healthier diet and to be more physically active. The consump-tion of enough fruit, vegetables and fish is good for the heart and blood vessels. The quantity of food consumed is also important, and should be in line with the daily amount of physical activity. In short, eating healthily and in moderation is good for your health.
Needless to say, our food must also be safe. Much has been done in past centuries to ensure that this is the case. Production techniques have been greatly improved, the quality of our food is continually monitored, and control systems have been intro-duced. In the Netherlands, responsibility for food safety is shared by the Ministry of Health, Welfare and Sport, and the Ministry of Agriculture, Nature and Food Quality. Although much has been achieved in terms of food safety, we must not rest on our laurels. New developments and emerging threats must be addressed. New products are being introduced all the time, such as food with health-promoting additions and genetically modified foods. Their safety must also be assured.
This report, which was commissioned by the Ministry of Health, Welfare and Sport, considers the various health-related aspects of diet and nutrition. It offers an overview of current knowledge concerning the effects of diet and foods upon health. It not only provides information about past trends and the current situation, but also considers future developments with regard to the nutritional value and safety of our food. The report has been written in such a way as to make it useful to both scientists and policy-makers. It will undoubtedly make a substantial contribution to the production and consumption of healthy, safe food.
The Minister of Health, Welfare and Sport,
ACKNOWLEDGEMENTS
This report, originally published in Dutch under the title Ons eten gemeten, is a col-laborative publication of the Nutrition, Medicines and Consumer Safety Division and the Public Health and Health Services Division of the National Institute for Public Health and the Environment (RIVM). The report is one of a series of reports on Public Health Forecasts in the Netherlands.
The report, moreover, contains contributions from other institutes and universities, which are gratefully acknowledged. The institutions in question are: Wageningen Uni-versity, TNO Quality of Life, Vrije Universiteit Amsterdam, and Maastricht University. Many individuals have made valuable contributions to this report. These include authors from RIVM and other institutes (mentioned above), reviewers and other experts consulted, as well as the members of the Policy Advisory Group. To acknow-ledge and underline the importance of their input, the names of all those involved have been included in Appendices 1-3.
The European Food Safety Authority (EFSA) considers this report to be a significant contribution to the international discussion on the risks and benefits of food, as well as an important reference guide for its Scientific Committee and Scientific Panels. For this reason, EFSA has provided financial support for the translation of this report into English. The RIVM would like to thank the European Food Safety Authority for this financial contribution.
TABLE OF CONTENTS
FOREWORD 5
ACKNOWLEDGEMENTS 6
KEY MESSAGES 13
PART A OUR FOOD, OUR HEALTH: 19
Summary of the main findings of the report
1 INTRODUCTION 21
2 MAIN FINDINGS 22
2.1 How healthy is the Dutch diet ? 22 2.2 How safe is Dutch food ? 28
2.3 Healthy diet and safe food in balance 32
3 SIGNIFICANCE OF THE FINDINGS 35
4 OPPORTUNITIES FOR PREVENTION 39
5 MONITORING AND RESEARCH 43
PART B OUR FOOD, OUR HEALTH: 45
Healthy diet and safe food in the Netherlands
1 INTRODUCTION 47
REFERENCES 54
2 HOW HEALTHY IS THE DUTCH DIET ? 55
2.1 Introduction 55
2.2 Diet in relation to health and disease 56
2.2.1 Dietary factors in relation to chronic diseases 57
2.2.2 Dietary standards, Guidelines for Good Nutrition and Rules for a healthy diet 65
2.3 Food consumption and the intake of nutrients 66 2.3.1 The general population 67
2.3.2 Food consumption of specific age groups 71
2.3.3 Food consumption among the lower socio-economic and ethnic groups 74
2.4 Potential health gain through improvements to the diet 75 2.4.1 Current health loss in the Dutch population: the maximum
scenario 79
2.4.2 The realistic health gain: middle scenario 83 2.5 Options for dietary interventions 85
2.5.1 Food supply and other environmental factors 85 2.5.2 Interventions targeting personal factors 88
2.5.3 Interventions will vary according to target group 89 2.5.4 The integrated approach and comparison with interventions
targeting smoking 92 2.6 Summary and conclusions 92
REFERENCES 94
3 WHAT IS THE GOVERNMENT DOING TO PROMOTE A HEALTHY DIET ? 99
3.1 Introduction 99
3.2 Policy: objectives, target groups, roles and responsibilities 100 3.3 Instruments and measures 104
3.4 The effects of policy in practice 107
3.5 Efforts targeting the main nutritional problems 109 3.6 Summary and conclusions 112
REFERENCES 113
4 HOW SAFE IS DUTCH FOOD ? 115
4.1 Introduction and scope 115
4.2 Pathogenic micro-organisms in our food 118 4.2.1 Introduction 118
4.2.2 Overview of pathogenic micro-organisms and other infectious agents in food 119
4.2.3 The scale of foodborne infections in the Netherlands and their effect on public health 120
4.2.4 Factors which influence microbial food quality 128 4.2.5 The most important foodborne pathogenic micro-organisms
in terms of possible health gain 137 4.2.6 Summary and conclusions 140 4.3 Harmful chemical constituents in our food 142
4.3.1 Introduction 142
4.3.2 Harmful chemical constituents in food: a general overview 143 4.3.3 Risk assessment, admission policy and setting standards 150 4.3.4 Factors which influence chemical food quality 155
4.3.5 The main chemical substances in food in terms of potential health gain 156
4.3.6 Summary and conclusions 160 4.4 Food safety in perspective 161
5 WHAT IS THE DUTCH GOVERNMENT DOING TO ENSURE SAFE FOOD ? 173 5.1 Introduction 173
5.2 Policy: objectives and priorities 174 5.3 Measures targeting food safety 177 5.4 Supervision of food safety 182
5.5 Efforts targeting the main threats to food safety 184 5.5.1 Microbiological hazards 184
5.5.2 Chemical hazards 185 5.6 Summary and conclusions 186
REFERENCES 187
6 HOW HEALTHY AND SAFE ARE FUNCTIONAL FOODS AND DIETARY
SUPPLEMENTS ? 189
6.1 Introduction 189
6.2 Overview of functional foods and health products 191 6.3 Legislation 192
6.3.1 Functional foods 192 6.3.2 Health products 194 6.3.3 Claims 195
6.4 Potential health gain 198
6.4.1 Who is likely to benefit from the use of functional foods and health products ? 198
6.4.2 Health gain in practice 200
6.5 The converse situation: possible risks to public health 201
6.6 Consumption of functional foods and dietary supplements containing vitamins and minerals in the Netherlands 203
6.6.1 Functional foods containing vitamins and minerals 204 6.6.2 Dietary supplements containing vitamins and minerals 205 6.7 Criteria for weighing health gain against health risk 209
6.7.1 Health gain 209 6.7.2 Health risks 210 6.7.3 Pitfalls 211
6.8 Summary and conclusions 212
REFERENCES 213
7 HEALTH GAIN AND HEALTH LOSS: HEALTHY DIET AND SAFE FOOD IN
A BROADER CONTEXT 215
7.1 Introduction: what questions are to be posed ? 215 7.2 Health versus safety in common foods 216
7.2.1 Approach 216
7.2.2 Results of the comparison 218
7.4 Healthy diet compared with other lifestyle interventions 228 7.4.1 Calculations for three lifestyle factors 228
7.4.2 Comparison of lifestyle factors with diet and BMI 233 7.5 DALYs lost through dietary factors and other causes 235 7.6 Summary and conclusions 237
REFERENCES 239
8 WHAT DETERMINES CONSUMER EATING BEHAVIOUR AND RISK PERCEPTION? 241
8.1 Introduction 241
8.2 The consumer and the determinants of eating behaviour 241 8.2.1 What determines behaviour ? 241
8.2.2 Proximal determinants 242 8.2.3 Distal determinants 245 8.2.4 Ultimate determinants 247
8.2.5 Conclusions with regard to interventions 248 8.3 The consumer and the perception of food safety 248
8.3.1 Introduction 248
8.3.2 ‘Objective’ risk assessment 248 8.3.3 Other characteristics of risks 249 8.3.4 Characteristics of risk observation 250 8.3.5 Individual differences in risk perception 252 8.3.6 Cultural factors 252
8.3.7 Conclusions with respect to risk communication 253 8.4 Conclusions and recommendations 256
REFERENCES 258
9 WHAT WILL THE FUTURE BRING ? 261
9.1 Introduction 261 9.2 External factors 261 9.2.1 Socio-demographic factors 262 9.2.2 Socio-cultural factors 263 9.2.3 Legislation/Policy 263 9.2.4 Macro-economic factors 264 9.2.5 Science 264 9.2.6 Miscellaneous factors 265
9.3 Developments in the food supply and eating behaviour 266 9.3.1 Developments in the food supply 266
9.3.2 Developments in eating behaviour 269 9.4 Effects on public health 271
9.4.1 Will the Dutch diet be healthier ? 271 9.4.2 Will food become safer ? 272 9.4.3 Effects on public health 274
9.5 Principles and recommendations for policy 277
9.5.1 Healthy diet: principles for policy addressing supply 278 9.5.2 Healthy diet: principles for policy addressing behaviour 279 9.5.3 Safe food: principles for policy addressing supply 279 9.5.4 Safe food: principles for policy addressing behaviour 279 9.5.5 Perception 280
9.6 Summary and conclusions 280
REFERENCE 281
10 GENERAL SUMMARY AND CONCLUSIONS 283
10.1 Where are we now and where are we going ? 283 10.2 Where do the priorities lie ? 287
10.3 Where do the opportunities lie ? 290
10.4 What has the government done and what has it not done ? 293 10.5 What is still needed ? 295
10.6 Gaps in the knowledge and recommendations for monitoring and research 299
REFERENCES 303
APPENDICES 305
Appendix 1 Members of the Policy Advisory Group 305
Appendix 2 List of authors, peer-reviewers and other contributors to this report 306
Appendix 3 List of interviewees (chapter 9) and other experts consulted 308 Appendix 4 Glossary of Abbreviations 309
Appendix 5 Disease symptoms associated with pathogenic micro-organisms in food 312
Appendix 6 Gastroenteritis (GE) in humans in the Netherlands, number of cases confirmed by laboratory testing, visits to GPs, total incidence, and proportion attributable to food 314
Appendix 7 Association of pathogenic micro-organisms with various types of food 316
Appendix 8 Calculation of the disease burden attributable to foodborne infections and intoxications 318
Appendix 9 Naturally occurring, potentially harmful chemical food constituents 319
Appendix 10 Non-naturally occurring, potentially harmful chemical food constituents 322
Appendix 11 Prioritizing principles for policy 326
Appendix 12 Background to the calculations and model results in chapters 2 and 7 327
KEY MESSAGES
Dutch people are less healthy than they could be due to an unhealthy diet. In particular, they eat too much and consume the wrong types of foods.
• Over the past century, the Dutch diet has become healthier and safer. As a result, general health has improved and life expectancy has increased. However nowadays health is threatened by an unhealthy diet, and because the number of people who are overweight is increasing.
• The percentage of people classified as obese has doubled in the last 25 years to approximately 10% of the adult population. It is predicted that this figure will rise to 15% within the next 20 years. Most alarmingly, there is a comparable increase in the percentage of children who are overweight. Overweight and obesity are caused by an energy-dense diet in combination with a lack of physical activity, resulting in an energy imbalance.
• The unfavourable composition of the Dutch diet (based on the study of five impor-tant dietary factors) also leads to considerable health loss. The intake of saturated and trans fatty acids is too high, while the consumption of fish, fruit and vegeta-bles is too low.
• Overweight and unfavourable dietary composition each account for approximate-ly 40,000 cases of adult-onset diabetes, cardiovascular diseases and different types of cancer in total per year. Unfavourable dietary composition is twice as likely as overweight to result in death: 10% of all deaths in the Netherlands are attributable to the composition of the diet and 5% to overweight. In terms of the average life expectancy of all 40-year-olds, this means that unfavourable dietary composition reduces life expectancy by 1.2 years, while overweight will reduce life expectancy by 0.8 years. It is not known what proportion of the health problems caused by overweight can be attributed to diet.
• The overall health loss caused by an unhealthy diet is comparable to that caused by smoking. Measured in DALYs (Disability Adjusted Life Years: a summary measure which combines death and illness, using a disability weighing factor for the seri-ousness of the disease), the annual health loss due to an unhealthy diet is between 300,000 and 400,000 units. This figure includes 245,000 DALYs caused by unfavourable dietary composition and an unknown proportion of the 215,000 DALYs which are due to overweight. In the case of smoking, the annual health loss is estimated to be just over 350,000 DALYs.
Dietary interventions can reverse a substantial proportion of the health loss. However, if the current trends continue, life expectancy may fall.
• Approximately one half of all deaths and illnesses due to the unfavourable dietary composition can be avoided by means of dietary interventions which are consider-ed feasible (basconsider-ed on small-scale experiments). In particular, rconsider-educing the content of saturated and trans fatty acids in foods and increasing the consumption of fish, fruit and vegetables appears to be effective. In the case of overweight and obesity, approximately one quarter of all deaths and illnesses can be prevented, assuming an average weight loss of three kilograms per person.
• These modelled dietary interventions are in line with current favourable trends in fish consumption and the decreasing content of saturated and trans fatty acids in the diet. However, the trends in overweight and the consumption of fruit and vegetables show a very unfavourable picture. This indicates that a far more force-ful preventive approach is called for in this area.
• If these trends continue (and other factors remain unaltered), life expectancy in the Netherlands will start to fall for the first time in many decades.
Functional foods and dietary supplements do not offer a solution to the health problems caused by an unhealthy diet.
• Consumers who follow the dietary guidelines have no need for functional foods or supplements. Only certain specific risk groups (such as infants and elderly persons with a low micronutrient status) will benefit from such products. Even in that case, the health gains will be limited.
• In many cases, no evidence exists to support the health claims made for such foods and supplements. The consumer may well be misled by extravagant advertising. • As they may be consumed in excessive quantities, some bio-active ingredients pose
a real risk of health loss. This is particularly the case with vitamin supplements in which the unit dose exceeds (sometimes by a wide margin) the safe upper level of intake, as seen with vitamin B6for example. Such products are currently freely available. The safe upper level can also be exceeded when several ‘enriched’ products are used in combination.
In recent years Dutch food has become demonstrably safer in terms of chemi-cal and microbiologichemi-cal contamination. Nevertheless, food safety is often the subject of negative media coverage.
• The food consumed in the Netherlands has become safer over the past 20 years. For example, the contamination of animal products with Salmonella has been reduced considerably, as has the concentration of dioxins in foods and human breast milk.
• Food safety generally reaches the news only when problems occur, usually due to unavoidable incidents (‘Good news is no news’). This creates a distorted picture of the actual situation.
• The government and private sector have long been engaged in efforts to increase food safety and to provide a high degree of consumer protection. Food in the Netherlands, therefore, is now safer than ever before.
Nevertheless, unsafe food leads to health loss and new threats are emerging.
• Although the overall number of incidents involving Salmonella contamination have decreased in the Netherlands, foodborne infections continue to present a per-sistent problem. Every year, there are between 300,000 and 700,000 reported cases of gastroenteritis and several hundred other cases of serious illness. Foodborne infections account for some 20 to 200 deaths each year. The overall annual health loss is estimated to be between 1,000 and 4,000 DALYs.
• In some cases, chemical contamination and the presence of naturally occurring chemical compounds in food lead to a limited degree of health loss in the popula-tion (either demonstrable or theoretically estimated). In terms of actual illness, allergens form the most important category of agents, but these must be con-sidered separately, given the differences in individual susceptibility. In the Nether-lands, the overall health loss attributable to chemical contamination and allergens is estimated to be between 1,500 and 2,000 DALYs per annum.
• Experts predict that food in the Netherlands will become even safer in future. This is largely due to the increased attention being devoted to food safety. At the same time, new threats to food safety may emerge. They include new types of foodborne infection, the globalization of food production chains, the increasing consumption of raw or unprocessed products, and the over-consumption of functional foods and dietary supplements.
Effective risk communication with the consumer is essential in any food safety incident or crisis.
• There are no indications that the consumer has a persistent or increasing loss of confidence in food safety. However, this confidence is subject to major fluctuations when incidents or crises occur.
• The major problems attached to food safety incidents are those of assessing the actual risk to health and the unpredictability of public perception. Effective methods for assessing the actual health effects involved are not always available. Alongside the objective, calculated risk, the consumer’s perception of risk will often form a far more important factor. This perception will be determined by factors such as the perceived seriousness and controllability of the risk or its expected consequences, as well as the nature and extent of media coverage. • Risk management (and hence crisis management) therefore requires an
under-standing of both the actual risk and the perceived risk. Adequate measures to-gether with open and transparent communication with the consumer form the basis for success.
Much greater health gains are to be made through encouraging a healthy diet than through improving food safety. This has consequences in terms of the priorities to be set.
• The comparison of the health gains theoretically attainable from a healthier diet on the one hand and improved food safety on the other, shows a clear preference for the former. Just through ensuring a proper dietary composition, separate from avoiding overweight, the maximum health gains (in DALYs) are some 40 to 100 times greater than the current overall health loss due to unsafe food.
• Besides the potential health gains, other factors must be considered when establishing priorities. These include the current trends and the feasibility of the proposed interventions. Consequently, three priorities have been identified:
1. The promotion of a healthy diet, with the secondary aims of:
- Reducing overweight and obesity (major health gains, unfavourable trends, and interventions which may not be fully feasible).
- Promotion of a proper dietary composition (major health gains, variable trends and variable feasibility of interventions).
2. The maintenance and (where necessary) improvement of the current high level of food safety (limited health gains, important social mandate and good feasibi-lity of interventions).
3. Improvement of risk assessment methodologies and of risk communication with the consumer, particularly in the event of a food safety incident or crisis.
The main opportunities for creating a healthier diet and for increasing food safety are to be found on the supply side, i.e. in the hands of the private sector.
• The private sector can make a major contribution to a healthier diet and safer food. This can be done by restricting the supply of ‘unhealthy’ foods, reducing portion sizes, reducing advertising for ‘unhealthy’ foods (particularly that targeting chil-dren), offering a more affordable range of ‘healthy’ foods, increasing the traceabili-ty of products or ingredients, and by introducing new (food safetraceabili-ty) technologies. • Experts expect great gains from product modification, in which the composition of
foods will be made healthier and consumers will not be required to alter their eat-ing habits dramatically.
• The private sector could do more to address its responsibilities with regard to the issues above, becoming even more active than it already is.
The consumer also has an important role to play.
• The human environment has a major influence on people’s eating habits. How-ever, each consumer has overall responsibility for choosing the food he or she eats, and for its safe storage and preparation. A significant cultural shift is required to render a healthy diet and concern for one’s weight a social norm. Eventually, this shift must lead to permanent and sustainable behavioural changes.
The government must create the necessary conditions, and may be required to take enforcement action where appropriate.
• If consumers are to fulfil their responsibilities, they must be given adequate infor-mation about a healthy diet and safe food. But they must also put that knowledge into practice. This will require education, information campaigns and practical skills training, together with a more explicit representation of their interests by consumer organizations in order to ensure adequate product information. • The Dutch government must maintain the current high level of food safety. It must
also invest in an adequate response to new developments in the commercial food chains, in crisis management and in effective consultation with the consumer. • A thorough understanding of the actual nutritional situation in the Netherlands is
essential to proper food policy. This calls for an effective monitoring system which will not only ‘keep a finger on the pulse’ but will also be essential in evaluating and further developing policy with regard to healthy diets and food safety.
• An integrated strategy seems to offer the best potential for promoting healthier eating habits. Such a strategy must not only address the supply side, but also the consumer and his or her environment. There should therefore be a combination of pricing policy, legislation, guidelines for the catering industry, measures applying to public places, health education and a shift in social norms. These measures should eventually lead to the ‘healthy choice’ becoming the ‘easy choice.’ An active approach on the part of government and the various societal organizations is called for.
OUR FOOD, OUR HEALTH:
1
Introduction
The report entitled ‘Our food, our health; Healthy diet and safe food in the Netherlands’ is an English translation of a report that was originally published in Dutch. The original report, written by the National Institute for Public Health and the Environment (RIVM) and entitled ‘Ons eten gemeten; Gezonde voeding en veilig voedsel in Nederland’, was presented to the Dutch Minister of Health, Welfare and Sport on September 1, 2004.
This English report, just like the original report in Dutch, consists of two parts, A and B. Part A contains a summary of the report’s main findings and is based on the scien-tific data presented and discussed in part B. This report also includes corrections to the data on disease-free life expectancy in part B, chapters 2 and 7 (sections 2.4, 7.4 and appendix 12).
There are many aspects to food and diet. This summary, which is concerned with the past, present and future, provides answers to questions from the perspective of health. How healthy is the Dutch diet? How safe is Dutch food? What health gains are to be had through better diet and eating habits and by reducing overweight1? What is the
appropriate balance between the desire for a healthy diet and that for ensuring food safety? How will this affect the various parties involved in food production, distribu-tion and consumpdistribu-tion?
In answering these questions, a pragmatic definition of the terms ‘healthy diet’ and ‘safe food’ is applied. A healthy diet relies on both the composition and the quantity of food consumed. Thus we should eat neither too much nor too little (energy intake in balance with energy expenditure), and the composition of the diet should be in line with the recommendations. With regard to food safety, the emphasis is not only on possible microbiological or chemical contamination, but also on potentially harmful naturally-occurring constituents. Where the amount of such substances (either in or on the supplied/consumed foods) is below the level which could be considered harm-ful to human health, the term ‘safe food’ is applied.
In the Netherlands, the findings presented in this report can assist the Ministries of Health, Welfare and Sport (VWS) and Agriculture, Nature and Food Quality (LNV) in their efforts to develop a view on healthy diet and safe food. The information is also of significance to other parties, including the local and national organizations which attempt to promote healthy diets and better health, organizations which control food safety, those which produce, process, distribute, sell or prepare food (including the agri-cultural sector, the food industry, supermarkets, restaurants, schools, staff canteens and healthcare institutes), organizations engaged in food and nutrition research and, of course, the people most closely involved: consumers and consumer organizations.
1 Overweight is defined as a Body Mass Index (BMI) equal to or greater than 25; severe overweight (obesity)
2
Main findings
2.1
How healthy is the Dutch diet ?
a. A healthy diet and safe food have contributed to the improvement of general health and have increased the average life expectancy
Food is a primary life requirement. Today, people in the Netherlands live much longer than previous generations. That is partly due to the availability of a sufficient quantity of good quality food. The Dutch now live in an era and a part of the world with an abundant food supply, and stringent control of food safety aspects. Furthermore, they now have access to greater scientific knowledge concerning healthy eating habits and food safety.
b. Yet obesity is now one of the greatest threats to public health
• In the Netherlands, the percentage of people who may be described as obese has doubled over the past 25 years to approximately 10% of the adult population. • The most worrying trend is the increase in the number of young children who are
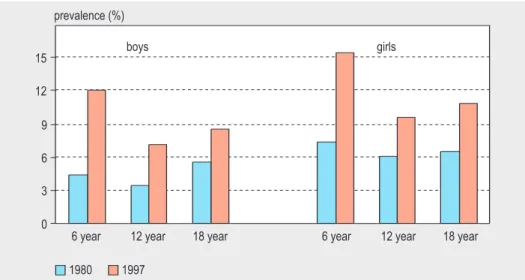
overweight or obese. In 1997, the percentage of overweight persons in the 2 to 20 age group varied between 7% and 16%, depending on age. In the case of girls aged 6, this represented a 100% increase compared to the 1980 figures, while for boys aged 6, there had been a 200% increase (see figure 1). The trend is of particular con-cern because eating habits, like so many aspects of lifestyle, are acquired in these formative years.
• Among those with only primary or lower vocational education, obesity is roughly three times more prevalent than among those with higher vocational training or a university degree. However, the increase over time is seen in both groups.
Figure 1: Prevalence of overweight among Dutch children by gender and age.
0 3 6 9 12 15
6 year 12 year 18 year
boys girls
6 year 12 year 18 year 1980 1997
• Obesity is more prevalent among Turkish, Moroccan, Surinamese and Antillean men and women in the Netherlands than among the ‘native Dutch’ population. There are, however, no trend statistics available. There is less information relating to other ethnic groups.
• Food consumption of the average Dutch citizen has not increased in recent decades. In fact, between 1988 and 1998, energy intake fell by 5%. The cause of the increase of overweight is rather the over-consumption of food relative to the amount of physical activity undertaken. It is therefore clear that the degree of physical activity has decreased even further, although good statistics relating to trends in energy expenditure through physical activity are not available.
• It is expected that the incidence of overweight and especially that of obesity, will continue to rise sharply in the Netherlands. Given the current trend, the number of Dutch persons who are obese is likely to increase by 50% before the year 2020. Merely maintaining the current level will require significant efforts.
c. The composition of the Dutch diet is still far removed from the recommended healthy diet
In recent decades significant changes have occurred in the Dutch dietary pattern with regard to several important dietary factors. In the case of some factors, the diet has clearly become more healthy; for others, the reverse is true (see table 1).
• The main improvements are the decrease in the content of saturated and trans fatty acids in foods, and the increase in the consumption of fish. Between 1988 and 1998, the consumption of trans fatty acids decreased by over 60% as a result of modifications to the composition of margarines and cooking fats. The consump-tion of saturated fatty acids decreased by 5%, largely due to the successful intro-duction of lower-fat dairy and meat products. Fish consumption appears to have increased: in 2001, the quantity of fish purchased for consumption at home had increased by 17% compared to the 1995 figure.
• However, fewer than 25% of people follow the recommendations with regard to the consumption of fruit, vegetables and dietary fibre. Over the course of 10 years (1988-1998), consumption of fruit and vegetables actually declined by between 15% and 20%. Despite improvements in terms of the fatty acid content of products, only 5% of the Dutch population follow a diet according to the recommended fatty acid pattern.
Table 1: Actual dietary consumption compared to the recommended intake in the Netherlands.
Dietary factor Recommended intake Average consumption Trend 1998
Saturated fatty acids < 10 energy per cent 14.5 energy per cent Favourable Trans fatty acids < 1 energy per cent 1.8 energy per cent Favourable Fish 1 or two times per week 2 to 3 times per month Favourable Fruit 2 pieces per day (200 grams) 102 grams Unfavourable Vegetables 150-200 grams 120 grams Unfavourable
In addition, many groups in the population have specific dietary problems which require certain additional recommendations.
• Mothers should be encouraged to breastfeed their infants.
• The eating habits of young people are showing a less favourable trend than those of the population as a whole. In particular, there has been a much sharper decline in the consumption of bread and vegetables.
• Undernutrition may be observed among some more elderly citizens, which may lead to vitamin and mineral deficiencies.
• The dietary composition of persons with a lower socio-economic status is, on aver-age, less likely to be in accordance with the recommendations than that of people in the higher socio-economic groups.
• Few statistics are available with regard to the food consumption of ethnic minority groups. There is no uniform picture covering all groups. The fatty acid content of the diet of some groups is actually better than that of the native Dutch population, but the average content of vitamins and minerals is somewhat lower.
d. Overweight and unhealthy dietary composition cause considerable health loss
For the purposes of this document, ‘health loss’ is expressed in terms of the additional incidence of disease and mortality (e.g. through type 2 diabetes mellitus, cardiovascu-lar diseases and various forms of cancer) which can be attributed to overweight or unfavourable dietary composition.
• Adults who are seriously overweight are five to twelve times more likely to develop diabetes, and two to three times more likely to develop cardiovascular diseases or certain forms of cancer.
• An excessive intake of the ‘wrong’ type of fats, such as saturated and trans fatty acids, increases the likelihood of developing cardiovascular diseases by 25%, while eating fish once or twice a week will reduce this risk by 25%.
• The consumption of an adequate quantity of fruit will reduce the risk of develop-ing coronary heart diseases, stroke, lung cancer, breast cancer2and stomach
can-cer by between 20% and 30%, while an adequate intake of vegetables will reduce the risk of coronary heart diseases and lung cancer to approximately the same degree.
• Each year, 38,000 cases of cardiovascular diseases among adults aged 20 and above can be attributed to the unfavourable composition of the diet (calculated accord-ing to the five factors), as can 2,700 cases of cancer (see figure 2).
• Overweight is responsible for 22,000 cases of diabetes, 16,000 cases of cardiovascu-lar diseases and 2,200 cases of cancer each year (see figure 2). Other consequences of overweight, such as impaired mobility, have not been included.
• Approximately 10% of the total number of deaths in the Netherlands each year can be attributed to an unfavourable dietary composition, while overweight is directly responsible for 5% of deaths.
2 According to a recent report published by the Dutch Cancer Society, the relationship between diet and
• When these statistics are combined and expressed in DALYs3per year (Disability Adjusted Life Years), approximately 215,000 DALYs lost as a result of the three dis-eases cited (cardiovascular disdis-eases, cancer and diabetes mellitus) can be ascribed to overweight, and 245,000 DALYs to unfavourable dietary composition.
• The average decrease in life expectancy resulting from unfavourable dietary com-position is 1.2 years (for the entire Dutch population aged 40 and above). In the case of overweight, the decrease in life expectancy is 0.8 years. The health loss will clearly be much greater for those who consistently eat too much or eat the wrong types of food.
In calculating the overall health loss due to an unhealthy diet, one cannot merely total the figures for overweight and unfavourable composition of the diet. Over-weight is caused in part by the combination of insufficient physical activity and an energy-dense diet, which partially overlaps with the dietary composition considera-tion, although the exact degree of this overlap is unknown. Of the five dietary factors considered, fruit and vegetables can help to reduce weight due to their high fibre con-tent and low energy density. However, over-consumption of energy-dense foods has not been included in the food consumption scenarios modelled.
3 For several years now, the health gains or losses due to disease or risk factors have been expressed in terms
of DALYs. Mortality and years lived with disease (weighed according to the seriousness of the disease) are combined in this figure.
0 5 10 15 20 25 30 35 40 45 x 1,000 I = Incidence; M = Mortality
Diabetes Cardiovascular diseases Cancer saturated fatty acids trans fatty acids five dietary factors combined overweight fish fruit vegetables
IM I M I M IM IM I M I M
Figure 2: Calculated health loss due to the fact that the consumption of various fatty acids, fruit and vegetables (separate or in combination), as well as bodyweight (BMI), fails to meet the recommendations.
e. Improved dietary patterns can lead to considerable health gains
The health loss presented above has been calculated by means of a comparison with the situation in which all Dutch people follow the dietary and weight recommenda-tions. It should therefore be regarded as the maximum theoretical health gain. However, because it would be overly optimistic to assume that everyone will adopt a healthy diet overnight, a calculation has also been made on the basis of dietary pat-terns which are partially improved in the direction of the recommendations. Experi-ence with small-scale dietary interventions suggests that such an improvement is fea-sible. In these ‘middle’ scenarios we assume the following changes in the dietary patterns of persons who do not yet meet the recommendations in full:
• consumption of saturated fatty acids to be reduced by 2.5 energy per cent • consumption of trans fatty acids to be reduced by 0.5 energy per cent • consumption of fish to be increased by one or two portions per month • consumption of vegetables to be increased by 50 grams per day • consumption of fruit to be increased by 50 grams per day.
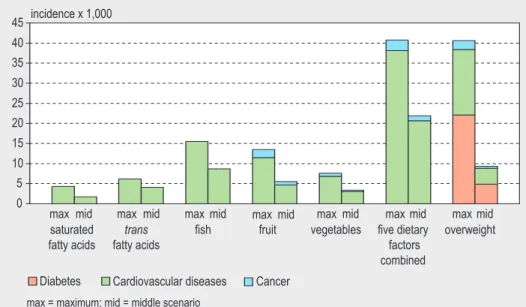
These dietary interventions will reduce the maximum annual incidence of disease and mortality attributable to the dietary composition (with regard to the five factors stated) by approximately fifty per cent (see figure 3).
A significant assumption in these calculations is that the success of the small-scale interventions can be extrapolated to the level of the entire population. The improve-ments cited have varying relationships to the current trends. In the case of trans fatty acids, target consumption under the middle scenario is in line with the rapid decline seen in recent years. By contrast, the middle scenario target for fruit and vegetable
Figure 3: Reduction in annual incidence of disease in the Netherlands: maximum and middle scenarios. 0 5 10 15 20 25 30 35 40 45 incidence x 1,000
max = maximum; mid = middle scenario
Diabetes Cardiovascular diseases Cancer
max mid max mid max mid max mid max mid max mid max mid saturated fatty acids trans fatty acids five dietary factors combined overweight fish fruit vegetables
consumption is at odds with the trend of recent years. The middle scenario targets for saturated fatty acids and fish consumption have, in this respect, an in-between position. Concerning the fatty acid intake, the middle scenarios are somewhat less ambitious than the objectives stated in a Dutch government policy document entitled ‘Langer Gezond Leven’ (‘Living longer in good health’). The policy’s target for saturated fatty acids is a reduction to 10 energy per cent by the year 2010, while that for trans fatty acids is a reduction to 1 energy per cent. These figures are in line with the dietary re-commendations. The policy does not state any specific target for fish consumption, and while it does seek to increase consumption of fruit and vegetables, no firm figures are stated.
f. Only through firm action to tackle overweight can any substantial health gains be made
The results of small-scale experiments suggest that an average weight loss of three kilograms per person (1 BMI unit) is possible. The health gain that such a weight reduction would yield is in the order of one quarter of the maximum incidence of mor-tality and morbidity attributable to overweight (see figure 3). However, the current trend runs in the opposite direction. Over the past 15 years, average bodyweight has actually increased by three kilograms and the number of persons with obesity, in par-ticular, will continue to rise. The policy objective is to at least stabilize the current level of overweight, thus curbing the trend. The health loss that will be avoided in this manner is also in the order of one quarter of the current maximum incidence of mor-tality and morbidity attributable to overweight.
Compared to the health gains to be made under the middle scenarios for dietary compo-sition, that achieved by reducing overweight will be less marked. Overweight is therefore a more difficult problem to counter than an unfavourable dietary composition.
g. Without interventions it is unlikely that the Dutch will eat more healthily in the future
Experts predict that the current trends in eating habits and in the types of food avail-able on the market will continue for the coming 5 to 10 years (see textbox 1). Despite a growing number of new foods which are appropriate to a healthy diet, the overall range of products available will not become any healthier due to the even greater increase in unhealthy products. Consumers will buy more ‘convenience foods’ and the consumption of snacks, larger portions and products which are energy-dense will continue to rise.
Expectations are that the unfavourable effects will dominate. Children, teenagers and people with a lower socio-economic status will form a high-risk group. This relates to the over-consumption of energy-dense products which contain few other nutrients and are made particularly attractive by their strong sweet or salty flavour. Moreover, healthy food is generally more expensive. Without active social pressure to reverse these trends, an adverse effect on public health may be expected, especially in terms of the number of people suffering from overweight and various chronic diseases.
2.2 How safe is Dutch food ?
a. Dutch food has become safer in several respects, due to a high level of consumer protection
Over the past few decades, national and international governments have introduced an extensive system of legislation, standardization and control in the field of food safety. Producers have also introduced many more measures designed to enhance food safety. The food consumed in the Netherlands is therefore safer in many respects than it was in the past. This is clearly demonstrable in the case of a number of micro-biological and chemical contaminants. For example:
Greater availability of
Products with improved nutritional quality, including healthy convenience foods (+) Energy-dense products (-)
Unhealthy convenience foods (-) Larger portions (-)
Functional foods and dietary supplements (?)
Eating habits
Shift towards convenience foods (overall bal-ance: (-))
Shift towards larger portions and energy-dense products (-)
More people who fail to eat breakfast (-) More snacks and other forms of ‘grazing’ (?)
+: expected effect is favourable to public health; - : expected effect is unfavourable to public health; ?: nature of effect is currently unknown
Textbox 1: Likely developments which will influence healthy and unhealthy dietary patterns in the Netherlands. 0 1,000 2,000 3,000 4,000 5,000 6,000 7,000 8,000 9,000 10,000 1984 1985 1986 1987 1988 1989 1990 1991 1992 1993 1994 1995 1996 1997 1998 1999 2000 2001 2002 2003 0 25,000 50,000 75,000 100,000 125,000 150,000 Travel/other Cattle Pigs Layers/Repro/Eggs Broilers/products Sa lm on el lo si s ca se s, ge ne ra lp op ul at io n La b-co nf irm ed ca se s of sa lm on el lo si s
• In the Netherlands, the incidence of food poisoning caused by Salmonella bacteria fell from approximately 150,000 cases in 1984 to approximately 50,000 in 2003 (see figure 4).
• The concentration of dioxins and PCBs in human milk in the Netherlands has halved over the past 10 to 15 years due to the reduction in exposure through foods. The food-related incidents that have occurred in the Netherlands in recent years have had little or no effect on health. However, they do erode consumer confidence and serve to highlight shortcomings which still exist within the current food safety system.
b. And yet foodborne infections remain an obstinate and persistent problem
Based on population surveys, it is estimated that there are approximately 4.5 million cases of gastroenteritis (inflammation of the stomach and small and large intestines) each year. Of these, one third (i.e. 1.3 to 1.7 million) are thought to be due to a food-borne infection (see textbox 2). Between them, four types of bacteria and viruses are responsible for approximately half of all identifiable foodborne infections: Campy-lobacter spp., Salmonella spp., Clostridium perfringens and the noroviruses.
Alongside the acute and usually mild health effects of gastroenteritis, there are also a few hundred cases of serious illness which can be attributed to foodborne infections involving a known pathogen. They include cases of toxoplasmosis, Guillain-Barré syn-drome, Haemolytic uraemic syndrome and listeriosis. Between 20 and 200 persons die as a result of a food infection each year.
Expressed in DALYs, the estimated health loss due to foodborne infections with known causative agents is approximately 1,000 to 4,000 per annum. This is comparable to the health loss due to AIDS or bacterial meningitis. However, this figure is probably an underestimate given the unquantifiable contribution of food to the large number of gastroenteritis cases due to (as yet) unknown causative agents.
Textbox 2: Estimated annual incidence of gastroenteritis due to foodborne infections in the Netherlands.
Total number of gastroenteritis cases 4.5 million Number with known causative agent 1.6 million Number due to foodborne infection 0.3-0.7 million Number not due to foodborne infection 0.8-1.3 million Number with unknown causative agent 3 million
Number possibly due to foodborne infection 1 million 1
Number not due to foodborne infection 2 million 1
1 While they have not been empirically tested, these figures are based on the ratio of 1:2 among the cases of
c. There are also chemical food constituents and contaminants responsible for some degree of demonstrable health loss
The health loss due to the presence of chemical food constituents or contaminants is more difficult to quantify than that due to microbiological contamination. A distinc-tion is drawn between chemical contaminants and those chemical components which are naturally present in certain foods, such as nitrates, natural toxins and allergens. In the case of chemical contamination, there are usually no acute effects but there can be chronic health effects, such as cancer, which become apparent only after a long period of time. Because of the delay involved, such effects can rarely be directly attrib-uted to exposure to any one chemical substance. Estimates of safe (and unsafe) intake levels are usually based on experiments involving animals. The safe intake levels for many chemical food contaminants have been established in this way. In general, the intake of such substances in the Netherlands is well below the identified safe levels. Table 2 provides an overview of the chemical substances found in food and posing some health risk, together with an estimate of the possible health gain (in DALYs) if exposure to these substances is avoided outright.
• In the case of allergens and certain natural toxins (phycotoxins and phytotoxins) there can indeed be an immediate and observable health effect. It is estimated that food allergies account for an annual health loss in the order of 1,000 DALYs. How-ever, allergens form a separate category since the effects are partly due to genetic susceptibility and therefore vary from one person to another. They can also be avoided by a careful choice of food. The overall health loss due to the presence of natural toxins is smaller than that due to allergens.
• In the case of nitrates and nitrites, as well as a number of chemical substances which do not occur naturally in food (PAHs, acrylamide), estimates suggest that long-term health effects can arise in the form of cancer. Here, the estimated theo-retical annual health loss is in the order of 500 to 1,000 DALYs.
Although information concerning developments over time is not available for some aspects, current information gives the general impression that Dutch food is now safer than it used to be. However, given the nature of the estimation methods used, it seems likely that the microbiological contamination levels have been underestimated (based as they are solely on information concerning proven food contamination by known agents). Conversely, the health risks posed by the chemical contamination of food are more likely to have been overestimated, since these often concern incidental measurements in excess of the identified safe levels, and because of the safety factors used and/or the conservative method of risk assessment applied (particularly with regard to genotoxic carcinogens).
To summarize, the main food safety problems are currently represented by microbial foodborne infections and allergens, and by the unavoidable occurrence of food-relat-ed incidents. It remains unclear whether the number of people suffering from some form of food allergy is increasing. The Dutch Health Council is currently collating the available scientific knowledge in this respect.
d. Food safety will continue to improve but new threats are likely to emerge
According to the experts, the measures taken by the government and food producers will ensure that our food becomes even more safe than it already is (see textbox 3). This will largely be due to better control systems and to the use of decontamination methods for dealing with micro-organisms on products of animal origin. However, no reduction in the incidence of microbiological contamination may be expected where this is due to incorrect storage and preparation on the part of the consumer. In fact, it is thought that the consumer’s knowledge of food preparation and the necessary stan-dards of hygiene is declining. In addition, new threats due to the globalization of food production and the food market will continue to demand attention. It may be expect-ed that the favourable effects will outweigh the unfavourable effects, but only if the current level of protection is maintained and due attention is devoted to new threats.
Table 2: Chemical substances in food in the Netherlands, with the health risks and possible health gains if exposure is avoided.
Substance category DALYs to be gained Comments
Allergenic proteins etc. 1,000 Figure gives rough estimate for allergens in foods, such as shellfish, fish, milk, nuts, wheat, etc.
Mycotoxins (aflatoxins, etc.) < 1 Figure relates specifically to aflatoxin B1
Phycotoxins (DSP, ASP) 10-70
Phytotoxins (anisatin) < 1
Nitrates/nitrites 100-500 Figure relates specifically to nitrosamines formed.
Growth promoting agents 1 (non-natural analogues such as clenbuterol)
Process contaminants 300-700 Figure relates mainly to acrylamide. (PAHs, acrylamide) The number of DALYs to be gained through
2.3
Healthy diet and safe food in balance
Many people and organizations make choices with regard to food, based on their own perspectives, in which health and safety play a role: consumers, food producers, the catering industry, organizations which produce the guidelines for a healthy diet, and the government which must make decisions on the collective efforts to be directed towards the promotion of a healthy diet and the improvement of food safety. Some-times those decisions will relate to a single ingredient, food or product, while on other occasions they will relate to entire groups or batches of products. Interests other than those of health alone are also part of these decision making processes.
This report addresses the positive and negative effects on public health. For this pur-pose, it uses three questions to bring these aspects into balance:
1. What is the relationship between health loss due to an unhealthy diet on the one hand and unsafe food on the other?
2. What is the relationship between ‘healthy’ and ‘safe’ with regard to four common food items for which specific recommendations exist?
3. How does that relationship apply to new developments such as the use of func-tional foods and dietary supplements?
The DALY concept forms the basis for all comparisons. Food supply
Better control systems due to extensive imple-mentation of the Hazards Analysis Critical Control Points (HACCP) system (+)
More industrially prepared products in combina-tion with better control systems (+)
More use of decontamination methods (+) More products from other countries • Longer turnaround time for products (-) • Less adequate control systems and
inspec-tions in some countries (-)
• Import of new bacteria and viruses, or re-emergence of known bacteria and parasites which had previously been eradicated (-) New products with new potential problems, such as the storage of pre-prepared products in shops (-)
More products with the same additives, e.g. many products having the same bio-active ingredients or natural flavourings (accumulation effect) (-)
More products with higher levels of contaminants due to the harmonization of international legisla-tion favouring those countries in which less strin-gent rules are applied (-)
More contaminated products due to reduced government involvement and supervision (?) Lower priority of food safety in times of economic recession (?)
Less effective mild preservation techniques (?) Second generation of genetically modified crops (?)
Food preparation by consumer and catering establishments
More information provided to the consumer, but less knowledge on the part of the consumer with regard to hygiene in food preparation (-)
+: expected effect is favourable to public health; - : expected effect is unfavourable to public health; ?: nature of effect is currently unknown
Textbox 3: Likely developments in food supply and consumer behaviour which will determine whether food in the Netherlands becomes more or less safe.
a. The health loss due to unhealthy diet is many times greater than that attrib-utable to unsafe food
When set against the health loss due solely to unfavourable dietary composition (245,000 DALYs), i.e. leaving the loss due to overweight aside, the estimated annual health loss due to microbiological foodborne infection involving known pathogens (1,000-4,000 DALYs) and chemical constituents (1,500-2,000 DALYs) is rather limited. The health loss due to unfavourable dietary composition is approximately 40 to 100 times greater than that due to unsafe food. Overweight also accounts for a far greater annual health loss (215,000 DALYs) than unsafe food.
b. The health gains to be made through the consumption of more fruit and vegeta-bles, wholegrain products and fish, as well as through breastfeeding, are many times greater than the health risks involved
Any food or group of foods may have both favourable or unfavourable health effects. This can be confusing for the consumer, particularly when the official dietary guide-lines recommend increased consumption of fish and vegetables, while it is recognized that these products can contain certain harmful contaminants. Accordingly, the balance between ‘healthy’ and ‘safe’ has been calculated for four groups of common foods for which specific recommendations exist:
• Fruit and vegetables: leafy vegetables can contain relatively high levels of nitrates, while pathogenic microorganisms may be found on all raw fruit and vegetables. They may also contain phytotoxins.
• Fish can contain dioxins or PCBs.
• Wholegrain cereal products (an important source of dietary fibre) can be contami-nated with mycotoxins derived from fungi.
• Human milk can contain dioxins and PCBs, while it is possible for an HIV-positive mother to transfer the virus via the milk.
The annual gains to be made by following the consumption levels currently recom-mended (the maximum scenario) vary from approximately 1,000 to 2,400 DALYs (breastfeeding) to almost 100,000 DALYs (fish, fruit). Compared to these figures, the risks attributable to known contaminants, insofar as they are quantifiable, are usually some 100 times lower. In some cases the risks are even negligible.
This does not mean that no further consideration needs to be given to contaminants. Rather, it highlights the success of the system of standardization and control that has been developed in recent decades, as well as the necessity of ensuring that this system continues to adapt to new scientific insights and developments in both food supply and food consumption.
c. The health claims of functional foods are often unproven and the over-consump-tion of bio-active ingredients can itself pose a risk
The recommended diet will include all necessary nutrients. In recent years, however, a number of products have emerged for which the manufacturers make certain health claims. These are the so-called functional foods and dietary supplements. Research into any positive or negative health effects associated with these products is still in its early stages. Because legislation is, as yet, inadequate (although it is devel-oping rapidly) consumers can easily be misled by extravagant advertising claims. For the vast majority of functional foods and dietary supplements now on the market, there is not only insufficient evidence for the presence of beneficial health effects, but also for the absence of detrimental effects. It is therefore not possible (or not yet possi-ble) to draw any useful conclusions regarding their contribution to public health. Only in the case of a few dietary supplements, such as folic acid and vitamin B6can firm statements be made:
• It has been shown that expectant mothers who take supplements containing folic acid at an early stage of their pregnancy can reduce the likelihood of birth defects (such as spina bifida). It has also been established that no health risks attach to the use of such supplements.
• In the case of vitamin B6, the risk of overdosing exists, while there are no demon-strable positive effects attached to the use of the supplement. Approximately 16% of the products containing B6which are currently on the Dutch market contain a dose which exceeds (sometimes by a wide margin) the established safe upper level of intake. Moreover, the ordinary daily diet will contain sufficient vitamin B6and no groups with any deficiency are known.
The dosage of vitamins and minerals in many ‘enriched’ foodstuffs remains relatively low. Often, it is comparable to the quantity to be found in an ordinary daily diet (the ‘Recommended Daily Intake’). Furthermore, there are generally no indications of health risks attaching to most of the vitamins and minerals contained in dietary sup-plements. Nevertheless, the dietary supplements do pose a particular risk of overdos-ing, since the concentrations of vitamins and minerals in such products are very much higher than in the enriched foods. However, since the most recent National Food Con-sumption Survey (in 1998), no new information has become available concerning the consumer’s usage of high-dosage vitamin and mineral supplements, nor about trends in the use of supplements in general.
d. Consumers and scientists often have differing views about risks
Although the health loss due to an unhealthy diet is far greater than that due to unsafe food, consumers often view matters from a different perspective. They usually attach more weight to those risks which are beyond their sphere of influence, rather than to those which are due to their own choice of food and eating habits. According-ly, food safety issues are often regarded as more serious (risk perception) and result in greater public disquiet than any unhealthy aspects of a diet that is not in line with the recommendations. The government and food producers must take this phenomenon seriously and must gain a better understanding of the underlying mechanisms. This is necessary not only to ensure adequate risk communication with the public, but also to maintain consumer confidence.
3
Significance of the findings
a. What are the priorities?
Priorities for policy are determined by several factors, such as the potential health gains, current trends and expectations, the feasibility of interventions, the balance between measures addressing a healthy diet and those directed at food safety, the costs of the measures, and so on. When these factors are taken into account, but leav-ing the question of costs aside, three important priorities in the field of healthy diet and safe food can be identified.
Priority 1: The promotion of a healthy diet, which involves a two-pronged approach
• Reduction of overweight and obesity
The calculations presented show that the maximum health gains achievable through the reduction of overweight are no greater than those to be made through the improvement of dietary composition. Nevertheless, there are various reasons for tack-ling the problem of overweight as a matter of the greatest urgency. Firstly, we see an unfavourable trend: the prevalence of overweight and obesity continues to increase, the rise being greatest among children and young people, which would suggest an even more acute problem in the future. Secondly, the seriousness of the obesity prob-lem has long been underestimated, despite the scientific community having drawn attention to the upward trend in the 1980s. Only in the last few years attention has been devoted to overweight at the national and international political level. Thirdly, it would appear that the health loss which can be obviated by means of feasible weight-related interventions is relatively small (approximately 25% of the total). A major soci-etal effort will therefore be required to ensure that the prevalence of overweight in the Netherlands does not rise further, and to avoid reaching the situation that can already be seen in the United States and the United Kingdom.
• Promotion of a healthy composition of the diet
It would not be appropriate to base policy solely on the reduction of overweight. A proper composition of fatty acids in the diet, regular fish consumption, and an
ade-quate intake of fruit and vegetables can do just as much in reducing the incidence of cardiovascular diseases and cancer, quite aside from the considerations of achieving a proper bodyweight. When we look at the health gain thought achievable on the basis of previous small-scale experiments, we see that the effect of a proper dietary compo-sition (based on the five dietary factors) is more than double that of the reduction in overweight. The trend is currently positive with regard to some factors (saturated fatty acids, trans fatty acids and fish consumption) but the decreasing consumption of fruit and vegetables is still worrisome. There are also a number of vulnerable groups, such as the very young and the very old, who face specific dietary problems which must be addressed separately. For example, very few babies under three months are now breastfed. And there is also some undernutrition among the elderly, with result-ing vitamin and mineral deficiencies.
Priority 2: Maintenance and, where possible, improvement of the current high level of food safety
In the current situation, it is clear that the health loss attributable to unsafe food is many times smaller than that due to an unhealthy diet. This is largely due to the fact that an effective system of food safety measures and control has been developed in recent decades. Clearly, this system must be maintained. However, it is appropriate to ask what maintenance level will be required in the future, in the light of existing and newly emerging threats.
Priority 3: Better risk assessment methods and improved risk communication with the consumer
Food safety incidents, both large scale and small scale, will continue to occur. Human error, malfeasance and new ‘surprises’ can never be ruled out. The ‘zero-risk’ situation is therefore unattainable. In order to limit the impact of incidents, a more effective assessment of the actual health risks is required, together with a better risk communi-cation with the consumer. As both uncertainty regarding the extent to which risks are known and social complexity (the number of stakeholders and conflicting interests) increase, so must a more open social debate be conducted.
b. Investing in a healthy diet is just as important as investing in other healthy lifestyle factors
In order to place the health loss attributable to an unhealthy diet and unsafe food in perspective, table 3 presents a comparison of the health loss (in DALYs) due to these factors and that due to other lifestyle factors. The health loss for various other envi-ronmental factors is shown in order to put in perspective the part played by food safe-ty. Lastly, a comparison is made with the health loss due to a number of significant diseases, irrespective of their causes. The calculations are particularly complex and the underlying data involve some uncertainties. As a result, the comparison is broad, and the health loss is presented in categories.