Development of a model to assess the
occurrence of mycotoxins in wheat,
maize and nuts
Report 320111002/2008
RIVM Report 320111002/2008 RIKILT Report 2008.004 PRI Report 186
Development of a model to assess the occurrence of
mycotoxins in wheat, maize and nuts
A holistic approach
S. Dekkers1H.J. van der Fels-Klerx2 S.M.F. Jeurissen1 M.C. Kandhai2 C.J.H. Booij3 P.M.J. Bos1
1 RIVM - National Institute for Public Health and the Environment, Centre for Substances and Integrated Risk Assessment
2 RIKILT - Institute of Food Safety, Unit of Databases, Risk Assessment and Supply Chain Management, Wageningen UR
3 PRI-Plant Research International, Biointeractions and Plant Health, Wageningen UR
Contact: S. Dekkers
Centre for Substances and Integrated Risk Assessment (SIR) susan.dekkers@rivm.nl
This research has been performed within Work Package 2 of the SAFE FOODS project (task 2.10.3) within the framework of EU 6th Framework Programme, Research Program 9.4.1 (‘New food safety risks’) of the Dutch Food and Consumer Product Safety Authority, and Strategic Research Program ‘Food Safety’ (theme 6) of the Dutch Ministry of Agriculture, Nature and Food Quality.
© RIVM 2008
Parts of this publication may be reproduced, provided acknowledgement is given to the 'National Institute for Public Health and the Environment', along with the title and year of publication.
Abstract
Development of a model to assess the occurrence of mycotoxins in wheat, maize and nuts using a holistic approach
The most important factors for the prediction of the occurrence of mycotoxins in food include weather conditions (such as temperature and atmospheric humidity), agricultural factors (such as crop rotation and soil cultivation) and factors within the food chain (such as crop drying and storage conditions). Mycotoxins are toxic chemical compounds produced by fungi that can occur in various foodstuffs. The National Institute for Public Health and the Environment (RIVM) and Wageningen University and Research Centre (Wageningen UR) have developed a blueprint of a model to assess the risk of
occurrence of re-emerging mycotoxins in wheat, maize and nuts. In order to protect consumers against mycotoxins, it is essential to detect any possible contamination with fungi at the earliest possible stage. Governmental organizations and the commercial sector can use the proposed model as an early
detection tool.
During the development of the model, an investigation was necessary to determine which factors, both inside and outside the food chain, could be used as indicators for the presence of mycotoxins. This investigation included interviews and a workshop with experts from various fields related to this subject. These insights have led to the development of a conceptual ‘traffic light’ model that indicates the risk of occurrence of mycotoxins with color signals; red indicates high risk, yellow medium risk, and green low risk. The prediction capacity of the conceptual model will be further investigated in a follow-up study.
Rapport in het kort
Ontwikkeling van een model om de aanwezigheid van mycotoxinen op tarwe, maïs en noten in te schatten volgens een holistische benadering
De belangrijkste factoren om de aanwezigheid van mycotoxinen in voedingsmiddelen te kunnen voorspellen zijn: weersomstandigheden (zoals temperatuur en luchtvochtigheid), landbouwkundige factoren (zoals gewasrotatie en grondbewerking) en factoren in de voedselketen (zoals het drogen van de gewassen en opslagcondities). Mycotoxinen zijn giftige chemische stoffen die door schimmels worden geproduceerd en in verschillende voedingsmiddelen terecht kunnen komen. Het Rijksinstituut voor Volksgezondheid en Milieu (RIVM) en Wageningen Universiteit en Researchcentrum
(Wageningen UR) hebben een conceptmodel ontwikkeld waarmee de aanwezigheid van mycotoxinen op tarwe, maïs en noten kan worden geschat. Om consumenten tegen mycotoxinen te kunnen
beschermen is het noodzakelijk om een mogelijke besmetting met schimmels zo vroeg mogelijk te ontdekken. Overheidsorganisaties en het bedrijfsleven kunnen het model als hulpmiddel hierbij gebruiken.
Bij de ontwikkeling van dit conceptmodel is onderzocht welke factoren binnen en buiten de
voedselketen gebruikt kunnen worden als indicatoren voor de aanwezigheid van mycotoxinen op tarwe, maïs en noten. Hiervoor zijn interviews en een workshop met deskundigen uit verschillende
invalshoeken gehouden. Met deze inzichten is een concept ‘stoplicht’-model ontwikkeld dat de mate van het risico op de aanwezigheid van mycotoxinen aangeeft door middel van een rood (hoog risico), geel (gemiddeld risico) of groen (laag risico) signaal. In een vervolgstudie zal het voorspellende vermogen van het conceptmodel verder worden onderzocht.
Contents
Summary 9
1 Introduction 11
2 Identification of most relevant mycotoxins 13
2.1 Overview RASFF mycotoxin hazards 13
2.2 Literature review 14
2.3 Conclusions 18
3 Literature search on relevant indicators 19
3.1 Relevant indicators 19
3.2 Interrelations between indicators 20
3.3 Conclusions 23
4 Review and selection most relevant indicators 25
4.1 Introduction 25 4.2 Interviews 25 4.2.1 Approach 25 4.2.2 Results 26 4.2.3 Conclusions 30 4.3 Workshop 31 4.3.1 Approach 31 4.3.2 Results 31 4.4 Conclusions 34
5 Development of the model 35
5.1 Set-up of the model 35
5.1.1 Introduction 35
5.1.2 ‘Traffic light model’ 36
5.1.3 Decision tree model 37
5.1.4 Set-up of the model - approach 38
5.2 Definition of risk categories and interrelations of the indicators 39 5.2.1 Temperature and relative humidity during cultivation 39
5.2.2 Crop rotation 43
5.2.3 Tillage policy 44
5.2.4 Drying 44
5.2.5 Storage and transport conditions 45
5.2.6 Crop variety 46
5.2.7 Insect damage 46
5.2.8 Blanching of nuts 47
5.3 Relative importance of the different indicators 47
5.4 Detailed model for wheat, maize and nuts 48
5.5 Discussion 54
6 Identification of data sources 55
6.1 Open access data sources 55
6.1.3 Data sources for drying and storage and transport conditions 56
6.1.4 Data sources for insect damage 57
6.1.5 Data sources for blanching of nuts 57
6.2 Data available for governmental and industrial users. 57
6.3 Conclusions on data sources 58
7 Conclusions and recommendations 61 References 63
List of abbreviations 69
List of definitions 71
Annex 1: List of indicators based on literature review 73 Annex 2: Questionnaire interviews 79 Annex 3: List of conducted interviews 81 Annex 4: Complete list of indicators (interviews) 83 Annex 5: List of participants workshop 87
Summary
This report describes the development of a blueprint of a model to assess the risk of occurrence of re-emerging mycotoxins in wheat, maize, peanuts and tree nuts. This model may be used by risk assessors, risk managers and industrial stakeholders to anticipate on the potential presence of mycotoxins by proactive risk management strategies or by adjusting purchasing strategies.
Various fungi and mycotoxins can occur on wheat, maize, peanuts and tree nuts. To select the most relevant mycotoxins for which the model should be developed, the occurrence, intake and toxicity of the different mycotoxins in each of the four commodities was evaluated. DON, OTA, T-2 and HT-2 seem to be the most important mycotoxins in wheat and maize, while aflatoxins seem to be the most important mycotoxins in peanuts, tree nuts and maize.
For the development of the model, a holistic approach was used in which not only indicators related to the food production chain, but also indicators from influential sectors outside the food production chain were studied. Based on a literature survey and an expert study, consisting of in-depth interviews and a workshop, relevant indicators for the model were identified. Fourteen experts with expertise on various influential sectors participated in the interviews, resulting in an overall selection of ten important indicators for all commodities. The workshop focused on wheat and consensus was reached on the seven most important indicators for the risk of occurrence of re-emerging mycotoxins in wheat, the definitions for these indicators and sub-indicators and the interrelationships between these (sub-)indicators.
The indicators and sub-indicators as defined for wheat during the workshop were critically reviewed for their predictive value for maize, peanuts and tree nuts, based on the results of the interviews and additional literature research. Additional indicators and sub-indicators were defined for maize, peanuts and tree nuts. Overall, the most relevant indicators for the four commodities are temperature and (relative) humidity, crop variety, crop rotation, tillage, drying of the kernel, storage and transport conditions, insect damage and blanching of nuts. Some of these indicators (rotation, tillage, and blanching of nuts) are not relevant for all commodities.
For all indicators, measurable sub-indicators (model parameters) were defined such as ‘sensitivity towards fungal contamination’ as a sub-indicator for ‘crop variety’. For these (sub-)indicators different risk categories were defined to facilitate inclusion in the model. Depending on the indicator, two (‘red’ and ‘green’) or three (‘red’, ‘yellow’ and ‘green’) risk categories were defined referring to a,
respectively, ‘high’, ‘intermediate’ and ‘low’ risk of occurrence of mycotoxins. The risk categories are separated from each other by threshold values that are referred to as ‘cut-off values’ in this report. Since the most favorable conditions are different for the various mycotoxins, cut-off values were defined in such a way that it is expected that conditions that are most favorable for the most relevant mycotoxins in the specific commodity can be distinguished from less favorable and unfavorable conditions. Interrelationships between parameters were included in the risk categories. Furthermore, relative importance scores were assigned to each (sub-)indicator for each commodity.
A blueprint of a ‘traffic light model’ was developed for the risk of occurrence of mycotoxins in each of the four commodities (wheat, maize, peanuts and tree nuts). By including different risk categories, cut-off values and importance scores for each commodity, this model was specified for each commodity. In
occurrence of mycotoxins into a low (green), intermediate (yellow) or high (red) risk. Depending on the cut-off values of the different risk categories, the user input for each indicator will fall into one of these risk categories, leading to a score of 0 (green), 1 (yellow) or 2 (red). These scores together with the importance factors given to the different (sub-)indicators, determine the output signal.
Also, possible data sources for the indicators of the model are listed in the current report. Before this conceptual model can be used as a model to assess the risk of occurrence of re-emerging mycotoxins in wheat, maize and nuts, a performance assessment is necessary. To enable implementation of the model for governmental stakeholders, an infrastructure should be established to obtain sufficiently detailed information on all indicators included in the (conceptual) model. Some industrial stakeholders may already have data available on most of these indicators for various purposes.
1 Introduction
Many efforts are undertaken in the European Union to improve the risk management of food-borne emerging risks by using pro-active, forward-looking approaches. A distinction can be made between emerging risks related to 1) a significant exposure to a hazard not recognized earlier, and 2) a new or increased exposure to a known hazard (which is then called a ‘re-emerging risk’). To control (re-)emerging risks pro-actively, it is necessary to explore a broader area of disciplines which are related to or influence the food production chain, rather than analysing solely the relevant food supply chain. Inspired by the OECD report ‘Emerging Risks in the 21st Century’ (OECD, 2003), a holistic approach has been developed and elaborated upon in several research projects (Noteborn et al., 2005; Noteborn, 2006; Van der Roest et al., 2007). In 2004 and 2005, a holistic approach was applied on mycotoxins in a project sponsored by the Dutch Food and Consumer Safety Authority (VWA). A preliminary inventory was made of relevant indicators in the food supply chain for fungal growth and mycotoxin production in various commodities. Furthermore, the available data sources of these indicators were identified (Park and Bos, 2007). Within task 2.10.3 of the SAFE FOODS project, which is funded by the 6th framework program of the EU, a model to assess the risk of occurrence of (re-)emerging mycotoxins in wheat, maize and nuts is developed using a holistic approach. From 2006 onwards, these activities on mycotoxins were combined. From 2007 onwards, activities within a project on mycotoxins financed by the Dutch Ministry for Agriculture, Nature and Food Quality (LNV), were also included.
The current report describes the development of a blueprint of a model to assess the risk of occurrence of re-emerging mycotoxins in wheat, maize and nuts using a holistic approach. Wheat and maize were selected because these commodities are used as model commodities in various other Work Packages of the SAFE FOODS project. Nuts were selected because the VWA frequently encounters peanuts, pistachios, dried figs and to a lesser extent hazelnuts that are contaminated with excessive levels of aflatoxin B1 and total aflatoxin. In addition, the most common notifications of mycotoxin hazards received by the EU RASFF (Rapid Alert System for Food and Feed) system in the last couple of years concern aflatoxin contamination of nuts (mainly pistachios, peanuts and hazelnuts). The aim of the model is restricted to assess the presence of re-emerging (i.e. known) mycotoxins and not the related health risk. For emerging (i.e. not yet known) mycotoxins, it will be difficult to identify specific indicators and develop a model, but the indicators for re-emerging mycotoxins will probably also be valuable for emerging mycotoxins.
First, a literature search was performed to define the most relevant mycotoxins and to establish a gross list of indicators that may be relevant for the occurrence of mycotoxins on wheat, maize and nuts (described in chapters 2 and 3). Thereafter, an expert study consisting of a series of in-depth expert interviews followed by a workshop was performed to define the most important indicators that can be used in the model (chapter 4). The results of the interviews and the workshop were used to develop a blueprint of a model to assess the presence of re-emerging mycotoxins on wheat, maize, peanuts and tree nuts (chapter 5). In chapter 6, data sources that are currently available to and used by governmental and industrial stakeholder are described and possible additional data sources for the indicators that were included in the blueprint of the model are discussed. Before this conceptual model
can be used to assess the risk of occurrence of re-emerging mycotoxins in wheat, maize and nuts, a performance assessment is necessary, by means of analyzing a sufficient number of historical and/or ‘real-time’ cases of mycotoxin contamination. Also, the data sources for the different indicators have to be filled out into more detail.
2 Identification of most relevant mycotoxins
To select the most relevant mycotoxins for which the model should be developed, the occurrence of mycotoxins in several product categories was evaluated based on notifications on mycotoxins received by the EU’s RASFF (Rapid Alert System for Food and Feed). Also the daily intake (exposure) and the toxicity of the main mycotoxins in wheat, maize and nuts were evaluated based on literature reviews (see below).
2.1 Overview RASFF mycotoxin hazards
Under the RASFF system, members, such as national food control authorities, are obliged to notify any measures regarding to food safety, such as recalls of food and feed products and arrestment of imported consignments not complying with food legislations. As set out in the General Food Law (EU regulation 178/2002/EC), RASFF is hosted by the EFSA. The European Commission publishes weekly overviews of RASFF alert and information notifications on its website. In addition, it publishes annual reports of the notifications. These annual reports provide an overview of the numbers of notifications and the categories of food products and hazards that they pertained to. In addition, each annual report
highlights peculiar developments within the particular year (Kleter, submitted). The annual reports and the weekly overviews of RASFF notifications are available through the RASFF website
(http://europa.eu.int/comm/food/food/rapidalert/index_en.htm).
In 2006, 31% of the original notifications received through the RASFF system concerned mycotoxins (877 notifications) (RASFF, 2007). This is comparable with the number and percentage of original notifications in 2003 (805 notification; 35%), 2004 (881 notifications; 34%) and 2005 (993 notifications, 31%) (RASFF, 2004; 2005; 2006).
In Table 2.1 a breakdown of the RASFF notifications on mycotoxins in 2006 by mycotoxin and product category is given. In general, similar numbers of mycotoxin contaminations within the
different products categories were observed in 2003, 2004 and 2005. About 90-95% of the notifications on mycotoxins in 2003 - 2006 concerned aflatoxin. Most of these notifications concerned pistachio nuts primarily originating from Iran. Aflatoxins were also regularly reported in peanuts and derived
products originating from China, Brazil, Argentina, India, Egypt and Ghana (peanut butter). Furthermore, many notifications in 2006 (but also in 2003, 2004, and 2005) were mainly related to Ochratoxin A (OTA) and to a lesser extent patulin and fumonisins. In 2006, the OTA notifications concerned mainly fruits and vegetables (especially dried vine fruit) (27), coffee and coffee products (12), cereals and cereal products (11) and herbs and spices (4).
Table 2.1 The number of RASFF notifications on mycotoxins in 2006 for the main mycotoxins
within several product categories
[Source: RASFF, 2007].
An imal nu tritio n Cer eal pr odu cts Coffee Bab y fo od Frui t a nd veget abl es Her bs a nd s pic es Fru it j uices Nut a nd nut p rod uct s To tal Aflatoxins 4 5 1 0 69 37 0 684 800 Fumonisins 0 14 0 1 0 0 0 0 15 Ochratoxin A 0 11 12 0 27 4 0 0 54 Patulin 0 0 0 1 1 0 5 0 7 Zearalenone 1 0 0 0 0 0 0 0 1 Total 5 30 13 2 97 41 5 684 877
2.2 Literature review
In addition to the RASFF notifications, several literature reviews on (the occurrence of) mycotoxins were consulted, including two reviews conducted within the SAFE FOODS project by UNICATT (Prandini, submitted a; submitted b; Pitt, 2000a; Pitt et al., 2000b; Doohan et al., 2003; Logrieco et al., 2003). From these reviews, several relevant mycotoxins occurring in wheat, maize and nuts and the different fungi which can produce these mycotoxins were identified. An overview of fungi and mycotoxins occurring in wheat, maize and nuts is given in the table underneath.
Table 2.2 An overview of fungi and mycotoxins occurring in wheat, maize and nuts.
Fungi Mycotoxin* Remarks
Wheat
F. graminearum, F. culmorum and closely related species
DON, ZEA, NIV The major source of DON and NIV is F. graminearum, a species endemic in wheat and other cereals throughout the world.
F. sporotrichioides, F. acuminatum and F. poae
T-2 T2 occurs occasionally in wheat, especially in northern temperate climate.
Penicillium verrucosum OTA Associated with northern European
barley and wheat, does not appear to be common elsewhere.
Fungi Mycotoxin* Remarks
Maize
F. verticillioides (F. moniliforme) (and closely related species like F. proliferatum and F. subglutinans)
FB1, FB2, FB3 (and to a lesser extent MON, BEA and FUP)
Maize is the only significant source of these compounds.
F. graminearum, F. culmorum and closely related species
DON, ZEA, NIV, Under natural conditions these mycotoxins do not occur solitary. F. sporotrichioides, F.
acuminatum and F. poae
T-2 HT-2
T2 occurs occasionally in maize, especially in northern temperate climate.
A. flavus (and A. parasiticus) AFB1 (and to a lesser extent AFB2, AFG1 and AFG2)
A. flavus is the dominant species in maize and tree nuts.
A. alutaceus (formerly known as A. ochraceus)
OTA A. alutaceus is common in peanuts and
maize. Although OTA is isolated from a wide range of cereals, records are rather infrequent.
Peanuts
A. parasiticus (and A. flavus) AFB1, AFG1
(followed by AFB2 and AFG2)
A. parasiticus is the dominate species in peanuts.
A. alutaceus (formerly known as A. ochraceuss), A. niger, and A. gluacus.
OTA A. alutaceus is a common in peanuts
and maize. Tree nuts
A. flavus (and A. parasiticus) AFB1 (and to a lesser extent AFB2, AFG1 and AFG2)
A. flavus is the dominant species in maize and tree nuts.
A. niger, A. gluacus, and A. alutaceus (formerly known as A. ochraceuss), and other related species
OTA
* AFB1 = Aflatoxin B1; BEA = beauvericin; DON = deoxynivalenol; FB1 = Fumonisin B1; FUP = Fusaproliferin; MON = moniliformin; NIV = nivalenol; OTA = Ochratoxin A; T-2 = T-2 toxin; ZEA = zearalenone
In 2001 the SCOOP (Scientific Co-operation on Questions relating to Food) task 3.2.10 ‘Collection of occurrence data of Fusarium toxins in food and assessment of dietary intake by the population of EU Member States’ was established. The task was divided in three subtasks (zearalenone, fumonisins and trichothecenes) (Schothorst and Van Egmond, 2004). Within this study thirteen countries were asked to provide information on the exposure of the population to Fusarium toxins in their country. Twelve countries provided data on trichothecenes and 9 countries on zearalenone and fumonisins. Table 2.3 summarizes this information. The database covered altogether 44959 analyses on 16 Fusarium mycotoxins. Positive samples ranged from 0% (verrucarol) to 57% (deoxynivalenol) of all samples
Table 2.3 Overview on Fusarium toxin occurrence data submitted by the countries participating in the SCOOP project [Source: Gareis et al., 2003].
Fusarium toxin Countries Number of samples Positive samples Type B trichothecenes DON 11 11022 57% NIV 7 4166 16% 3-acetyldeoxynivalenol 6 3721 8% 15-acetyldeoxynivalenol 3 1954 20% Fusarenon X 3 1872 10% Type A trichothecenes T-2 8 3490 20% HT-2 6 3032 14% T-2 Triol 2 1389 6% Neosolaniol 2 1323 1% Diacetoxyscirpenol 3 1886 4% Monoacetoxyscirpenol 1 853 1% Verrucarol 1 121 0% ZEA 9 5018 32% Fumonisins FB1 9 3863 46% FB2 6 1010 42% FB3 1 239 36% Sum: 44959
Table 2.4 presents a summary of food categories most frequently contaminated with Fusarium mycotoxins. Cereals ranked first and among them maize and wheat showed the highest level of contamination with Fusarium mycotoxins.
Table 2.4 Summary of food groups most frequently contaminated with Fusarium mycotoxins
[Source: Gareis et al., 2003].
Fusarium toxin Main food items/food groups contaminated
(percentage of positive samples)
Type B trichothecenes
DON maize (89%), wheat* (61%)
NIV maize (35%), oats (21%), wheat* (14%)
3-Acetyldeoxynivalenol maize (27%), wheat (8%)
Type A trichothecenes
T-2 maize (28%), wheat (21%), oats (21%)
HT-2 oats (41%), maize (24%), rye** (17%)
ZEA maize (79%), maize milling fractions (51%), maize based
products (53%), wheat (30%), wheat milling fraction (24%), wheat based products (11%), baby food (23%)
Fumonisins
Dietary intakes were calculated from 12 (trichothecenes), 9 (zearalenone) and 7 (fumonisins) countries. An overview of the calculations of mean dietary intakes as percentages of the TDI (tolerable daily intake) values is given in Table 2.5 (Gareis et al., 2003). The calculated average dietary intake values for most Fusarium toxins were found to be considerably below the (temporary) TDI-values. Higher intakes (as percentage of the (temporary) TDI values) were observed for the group of infants. Intakes higher than the TDI were noted for the sum of T-2 toxin and HT-2 toxin for both adults and infants.
Table 2.5 Range of average dietary intakes* calculated as percentage of the TDI values
[Source: Gareis et al., 2003].
Mycotoxin TDI (µg/kg bw/day) Population (% TDI) Adults (% TDI) Infants (% TDI) DON 1 0.8 - 33.8 14.4-46.1 11.3-95.9 NIV** 0.7 4.2 - 11.1 0.8-8.25 3.7-22.6 T-2 + HT-2** 0.06 18.3 - 250 61.7-171.7 26.7-563.3 ZEA** 0.2 13.4 5.3-14.5 3-27.5 FB1 + FB2 2 0.8 - 13.2 0.1-14.1 22.3
* Mean food consumption and mean occurrence data ** Temporary TDI
Gareis et al. (2003) demonstrated that Fusarium mycotoxins are widely distributed in the food chain in the EU. The major sources are products made from cereals, in particular wheat and maize. While the dietary intakes of Fusarium toxins are often less than the TDI values for the respective toxin for the entire population and adults, they are close to or even exceed in some cases the TDI values for risk groups like infants and children.
The results of similar SCOOP tasks on OTA were reported in 1997 and 2002 (EC, 1997 and 2002). From these assessments of dietary intake of OTA by the population of EU Member States it can be concluded that the main food items/ food groups contaminated with OTA in 2000 were rye and derivatives, cocoa and products, dried fruits, millet, cereal and products, baby food, and wheat and derivatives (EC, 2002). Respectively 61, 67, 70, 71, 73, 81, and 88% of the tested samples of these food products/food groups were tested positive for OTA. The calculated average dietary intake values for OTA were in most cases below the TDI-value suggested by the SCF (5 ng/kg bw/day). The estimated average dietary intakes ranged between 23-73% of the TDI for the whole population of the different countries, between 23-53% of the TDI for adults, and between 38-96% of the TDI for children.
The occurrence in food and dietary intake of aflatoxins were evaluated the Scientific Panel on Contaminants in the Food Chain (CONTAM) of the EFSA. The main food items contaminated with aflatoxins in 2000-2006 were tree nuts, groundnuts, spices, figs and other dried fruits, maize and other cereals, crude vegetable oil and cocoa beans. The number of samples with total aflatoxin levels of 4 μg/kg or less varied from 78.5% for Brazil nuts to 100% for baby foods (EFSA, 2007). The EFSA calculated the dietary intake of aflatoxins using mean occurrence data and mean consumption data based on the current situation for adults. All occurrence values were truncated at the current EU Maximum Limits for adults. For groundnuts, nuts, dried fruit, cereals and processed products thereof intended for direct human consumption or as an ingredient in foodstuffs, maximum levels of 4 μg/kg for total aflatoxins (aflatoxins B1 +B2 + G1 + G2) and 2 μg/kg for aflatoxin B1 (AFB1) have been fixed. For spices corresponding levels have been set to 10 μg/kg for total aflatoxins and 5 μg/kg for
between 0.35 and 0.84 ng/kg body weight per day for lower bound (aflatoxin concentrations below the limit of detection (LOD) were entered as zero) and between 0.69 and 1.93 ng/kg body weight per day for upper bound estimates (aflatoxin concentrations below the LOD were entered as the actual value of LOD).
Aflatoxins are genotoxic carcinogens, for which it is generally assumed that there is no threshold dose below which no tumour formation would occur. Therefore, it is recommended that exposure to aflatoxins should be as low as reasonably achievable (EFSA, 2007).
2.3 Conclusions
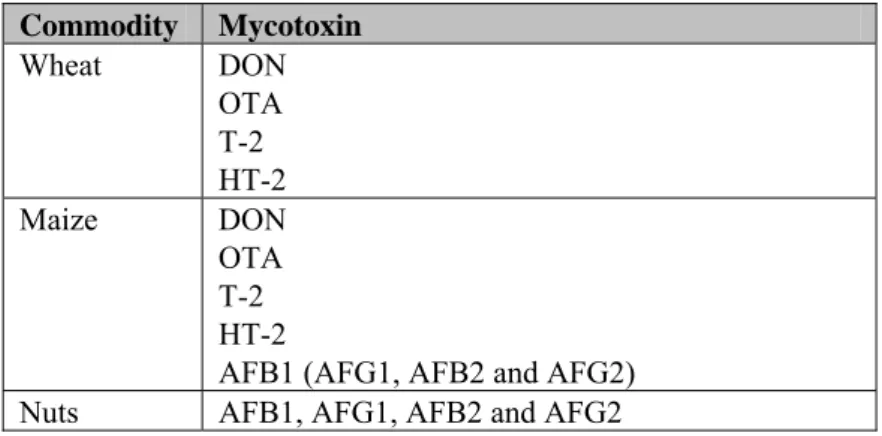
Based on the occurrence, intake and toxicity of the different mycotoxins in wheat and maize, DON, OTA, T-2 and HT-2 seem to be the most important mycotoxins, especially when children are taken into account. In addition, also aflatoxins are important mycotoxins in maize. For nuts, aflatoxins are the most relevant mycotoxins. An overview of the most important mycotoxins found in Table 2.6. For these mycotoxins a model will be developed to assess the risk of occurrence in wheat, maize and nuts.
Table 2.6 Overview of most important mycotoxins per commodity.
Commodity Mycotoxin Wheat DON OTA T-2 HT-2 Maize DON OTA T-2 HT-2
AFB1 (AFG1, AFB2 and AFG2) Nuts AFB1, AFG1, AFB2 and AFG2
3 Literature search on relevant indicators
3.1 Relevant indicators
Relevant indicators for the risk of occurrence of the most important mycotoxins (see Table 2.6) in wheat, maize and nuts include indicators from the food supply chain as well as from the host environment. In the PERIAPT project, several influential sectors from the host environment were identified (Noteborn et al., 2005). In the EMRISK project, these influential sectors were further refined and the resulting influential sectors are shown in Figure 3.1.
Figure 3.1 Influential sectors in the host environment of the food supply chain regarding
emerging risks (from Noteborn et al., 2006).
In the current project, a gross list of indicators for the presence of (re-)emerging mycotoxins in wheat, maize, peanuts and tree nuts was made (see the table in Annex 1). This table is arranged according to the influential sectors shown in Figure 3.1. However, since the aim of the model that will be developed will be to assess the presence of mycotoxins on wheat, maize and nuts and not to assess the related health risk, the influential sector ‘Health’ was excluded in the current project. Several information sources were used to establish this gross list, and these are described shortly below.
In the EMRISK project, a list of 270 initial indicators for identification of emerging risks in general was produced based on inputs of ongoing initiatives elsewhere (i.e. FAO, WHO, SANCO etc.) and results of workshops organised with issue and/or field experts (Noteborn et al., 2006). For the current project, these indicators were reviewed for their relevance to fungal growth and mycotoxin production and the relevant ones are listed in Annex 1.
In a previous RIVM project commissioned by the VWA (Park and Bos, 2007), a preliminary inventory of relevant indicators for fungal growth and mycotoxin production was already made based on data from Good Agricultural, Storage and Manufacturing Practices guidelines, Hazard Analysis and Critical Control Point (HACCP) programs, existing early warning systems, case studies, literature reviews and personal communication with experts. These indicators are also used in the current project.
Additional indicators were identified from several literature reviews (Hussein and Brasel, 2001; Van Maanen and Xu, 2003) and publications on monitoring, management and prevention strategies (CAC, 2004; CAC 2005; Queensland Government 2007).
Information on several currently available models predicting the occurrence of fungi and mycotoxins in wheat and maize (and wheat and maize based products) was reviewed within task 2.10.1 and 2.10.2 of Work Package 2 of the SAFE FOODS project by Prandini et al. (submitted b). Several additional models are described by De la Campa et al. (2005) and Xu (2003). These models are generally region specific and (partly) loss their predictive value outside the region for which they were developed. Since the aim of this project is to develop a more general model, these models themselves are not directly useful for this purpose. However, the indicators of these models can be used in the development of a more general model and are therefore also included in the table in Annex 1. These indicators are predominantly of meteorological origin (e.g. temperature, rainfall, and relative humidity), sometimes in combination with agricultural information (e.g. growth stages of the crops). Furthermore, some
additional indicators for wheat and maize were derived from several other publications (Vigier et al., 2001; Munkvold, 2003; Nordby et al., 2004; EMAN, 2006; Aldred and Magan, 2004; Schrödter, 2004). For peanuts and tree nuts, information obtained from several monitoring, management and prevention strategies and some predictive models for aflatoxin contamination in nuts were used to select relevant indicators for the risk of occurrence of mycotoxins in nuts (Bayman et al., 2002; Boutrif et al., 1998; Henderson et al., 2000; Rachaputi, 2002; Turner, 2005).
All indicators identified for wheat, maize, peanuts and tree nuts are listed in the table in Annex 1.
3.2 Interrelations between indicators
Because of the strong interrelationship of many indicators, these relations were made more visible by combining them into two schemes, one scheme for the indicators of mycotoxin growth on the crop in the field (pre-harvest; Figure 3.2) and another scheme for mycotoxin growth on crop during processing and storage (post-harvest; Figure 3.3). Those indicators that are closely related to the product (primary indicators; e.g. temperature) are positioned in the inner circle of the scheme, closest to the centre of the scheme (mycotoxin in crop). Secondary indicators (those that might influence the primary indicators
like pesticides or economy) are positioned in the outer circle of the scheme. To keep the scheme comprehensive, the more distantly related indicators are not presented separately but are represented by boxes of their influential sector outside the outer circle.
Figure 3.2 Indicators of mycotoxin growth on crop in field (pre-harvest) and their
interrelationships (primary indicators are positioned in the inner circle, while secondary indicators and influential sectors are positioned in the outer circles of the scheme).
Rainfall Relative humidity Fungal infection Temperature Other pests Pesticides Crop rotation Host susceptibility Variety Climate Economy and Finance Industry and Trade Government and Politics Growth stage Growth season Crop
density growth Weed Fertilisation
Irrigation
Science and Technology mycotoxin
in crop
Crop demand Population and
Figure 3.3 Indicators of mycotoxin growth on crop during processing and storage (post-harvest) and their interrelationships (primary indicators are positioned in the inner circle, while secondary indicators and influential sectors are positioned in the outer circles of the scheme).
Another way of putting the indicators into perspective is by ‘backtracking’ the different stages the product or crop has gone through before it becomes available for consumption. This is the usual procedure after a contamination of mycotoxins in food items is discovered. First information on the country of origin and transport conditions of the food item is gathered and studied. When a certain food item that is usually mainly imported from one country is suddenly mainly imported from other
countries, this may indicate possible changes in mycotoxin contamination of this food item due to differences in general conditions within these countries which may or may not favour the occurrence of mycotoxins in this food item. Figure 3.4 gives an overview of the indicators important in this
backtracking. Insufficient drying of crop Relative humidity Temperature Other pests Storage Packaging Climate Economy and Finance Legislative developments Harvest Ventilation Personal hygiene Insect, bird or rodent infestation Crop damage Moisture content after harvest Industry and Trade Strikes at harvest mycotoxin in crop Fungal contamination Crop maturity
Science and Technology
Coordination supply chain Quality and Safety Population and Social Conditions Transport Pesticides Sorting
Figure 3.4: Indicators of mycotoxin growth on crop by ‘backtracking’ the different stages the product or crop has gone through before it becomes available for consumption.
3.3 Conclusions
In the models that are currently available in literature to predict the occurrence of known fungi and mycotoxins, predominantly meteorological indicators (e.g. temperature, rainfall, and relative humidity) were found, sometimes in combination with agricultural information (e.g. growth stages of the crops). From the monitoring, management and prevention strategies described in literature, mainly indicators originating from the food supply chain could be derived. In addition to these indicators, several indicators from the other influential sectors (derived from the EMRISK report) may also be relevant to assess the presence of mycotoxins on various crops and may be useful in a model (see Annex 1). Furthermore, based on the literature search it is evident that the indicators are highly interrelated and interrelationships between indicators have to be taken into account when developing a model to assess the risk of occurrence of re-emerging mycotoxins.
Relative humidity Temperature Climate Economy Legislation Ventilatio Personal hygiene Moisture content Trade barriers Strikes Crop maturity Crop damage Relative humidity Insect, bird or rodent infestation Pesticides Temperature Personal hygiene Crop damage Pests Fungal contamination Temperature Crop growth Harvest Sorting and processing Drying Storage Country Transport Country Transport Country Transport Mycotoxin in crop
4 Review and selection most relevant indicators
4.1 Introduction
To select the most important indicators to assess the risk of occurrence of re-emerging mycotoxins in wheat, maize and nuts, a series of in-depth interviews was held, followed by a workshop. In-depth interviews were chosen instead of a written questionnaire, since holistic approaches are rather complex and during an in-depth interview, the holistic way of thinking can be explained better than with a written questionnaire. Also, more detailed insight in the expert judgments on the indicators and their rationales can be obtained. During the group discussions of the workshop, the differences in expert opinions were discussed to try to obtain consensus among the experts.
4.2 Interviews
4.2.1 Approach
4.2.1.1 Set-up expert interviews
The series of expert interviews was aimed to identify the main influential sectors and the main
indicators for the presence of mycotoxins on wheat, maize and nuts. During the interviews, the experts were first asked to identify the most important influential sectors and to indicate which influential sectors are within their expertise. Thereafter, the experts were asked to think about indicators within the different influential sectors. The gross list of indicators (Annex 1) was not used in the interviews, so that the experts would not be hampered by this prior knowledge, which made it possible to identify new indicators and rephrase indicators already identified. However, the list was used by the interviewers to be able to give examples, if necessary.
Afterwards, the experts received a report on their interview, and were asked to rank the importance of the indicators that were mentioned by them. They were asked to do so for wheat, maize and nuts, separately, and to select the five most important ones. The questionnaire used in the interviews can be found in Annex 2.
4.2.1.2 Selection of experts
The selection of experts was such that every influential sector listed in Annex 1 would be covered by several experts. Experts were selected based on the expert database of the SAFE FOODS project, on the list of participants of previous emerging risks projects (EMRISK, PERIAPT), on suggestions by the VWA, and on suggestions of experts interviewed during the current project.
4.2.1.3 Data analysis
To get insight in the importance of the indicators for the three crops wheat, maize and nuts, the experts were asked to rank the indicators for each crop with an importance score of 1 – 4 (1 = very important, 2 = reasonably important, 3 = slightly important, 4 = irrelevant). For the data analysis, the score 1 (very important) got the value 3, the score 2 (reasonably important) the value 2, the score 3 (slightly
asked to select the five most important indicators (‘top 5’). The frequency that each indicator was selected in the top 5 was calculated. All data from the interviews were analyzed per interview (also if an interview was held with two experts at the same time).
4.2.2 Results
4.2.2.1 Experts
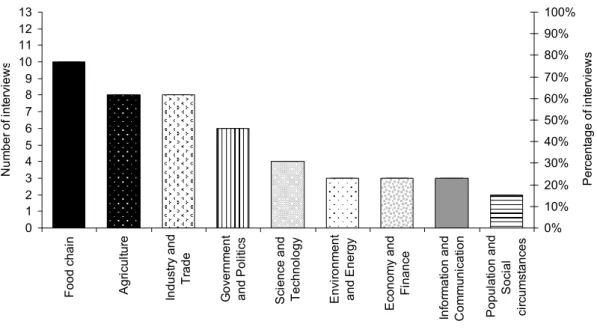
In total, 13 interviews have been conducted with in total 17 experts. Figure 4.1 gives an indication of the extent to which each influential sector is covered by the area of expertise of the consulted experts per interview, based on their own judgement. For each influential sector, it is indicated how many interviews were conducted with experts with knowledge on this influential sector. All experts had knowledge on at least two influential sectors. All influential sectors were covered by at least two interviews. A list with the consulted experts and their areas of expertise can be found in Annex 3.
0 1 2 3 4 5 6 7 8 9 10 11 12 13 F ood c h ai n Ag ri cu ltu re Indu st ry a n d Tr ad e G o ve rn m ent a n d P o lit ic s S ci enc e an d Tec hnol og y E n vi ronm en t and E ner gy E cono m y a n d Fi nan ce In fo rm a tio n a n d C o m m uni ca tion P opul at io n an d So ci a l ci rc u m st an ce s N u m ber of in te rv ie w s 0% 10% 20% 30% 40% 50% 60% 70% 80% 90% 100% P e rc en tage o f i nt e rv ie w s
Figure 4.1 Number of interviews with experts with knowledge on the different influential
sectors.
4.2.2.2 Influential sectors
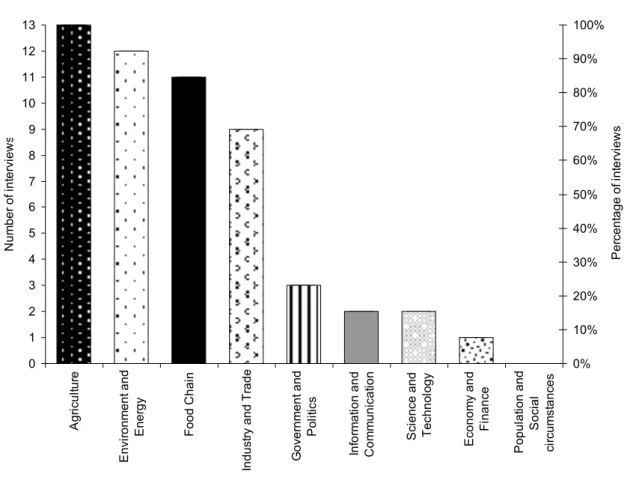
All indicators mentioned by the experts could be classified within one of the influential sectors already identified. In one expert interview, ‘disasters’ (with indicators such as ‘food scarcity’ and ‘war’) was suggested as an additional influential sector. However, after further discussing these indicators, they were considered to be covered by the existing influential sector ‘Population and Social conditions). Therefore, no new influential sectors were identified. Figure 4.2 indicates the percentage of the interviews in which the different influential sectors were regarded as an important sector. The most important influential sectors were ‘Agriculture’, ‘Environment and Energy’ (more specifically ‘Climate’), ‘Food Chain’ and ‘Industry and Trade’.
0 1 2 3 4 5 6 7 8 9 10 11 12 13 Ag ri cu ltu re E n vi ronm ent and E ner gy Food C hai n Indus tr y and Tr ade G o ve rn m ent an d Po lit ic s In fo rm at ion and C o m m uni cat ion S ci enc e a n d Techno lo gy E conom y and F inanc e P opul at io n an d So ci a l ci rc um st anc es N u m ber of in te rv ie w s 0% 10% 20% 30% 40% 50% 60% 70% 80% 90% 100% P e rc en ta ge of in te rv ie w s
Figure 4.2 Number of interviews in which the experts regarded the indicated influential sector
important.
4.2.2.3 Indicators
A list of all indicators that were mentioned during the interviews can be found in Annex 4. In Table 4.1, the indicators that were mentioned in >25% of the interviews are listed. In the second column of Table 4.1, the percentage of interviews in which the different indicators were mentioned is given. For each indicator, the importance scores obtained in all interviews in which the indicator was mentioned, were summed per crop (see the third column ‘Total score in interviews per crop’) and also for all three crops together (see the last column ‘Total score for all crops’). Since the experts were asked to give these scores only to those indicators they had mentioned themselves, these total scores are much lower than the maximum score possible (which would add up for wheat to a maximum of 10 interviews x maximum score of 3 = 30, for maize to a maximum of 8 x 3 = 24 and for nuts to a maximum of 9 x 3 = 27). Based on the percentage of interviews in which each indicator is mentioned, the most important indicators (mentioned in >50% of the interviews) are: storage conditions and quality, humidity/drought, temperature, changes in consumption patterns, transport conditions, tillage policy and regulations with respect to mycotoxins. Based on the total score the most important indicators for all three crops (total score > 35) are: humidity/drought, storage conditions and quality, temperature, changes in consumption pattern, regulations with respect to mycotoxins, transport conditions and education within food production chain. Differences between the crops were that the indicators tillage policy, crop variety and crop rotation scored relatively high in wheat and maize, but low for nuts (see Table 4.1).
Table 4.1 Overview of the most frequently mentioned indicators and their importance scores as judged by the experts in the interviews.
Indicator Percentage of interviews*
Total score in interviews per crop
Total score for all crops ** Number of interviews n = 13 Wheat
(n=10)
Maize (n=8)
Nuts (n=9) Influential sector: Food Supply Chain
Traceability 38% 9 9 12 30.0
Mixing 31% 7 7 6 20.0
Transport conditions 62% 12 12 15 39.0
Storage conditions and quality 77% 20 17 20 57.0
Influential sector: Agriculture 0.0 0.0 0
Agriculture small/large scale production 46% 9.5 10.5 13 32.5
Tillage policy 54% 16 10 2 28.0
Crop variety 46% 14 8 2 24.0
Genetically modified crops 31% 7 7 1 15.0
Crop rotation/pre-crop 38% 13 7 0 20.0
Irrigation and drainage 31% 7 7 9 23.0
Use of pesticides 31% 7 8 6 21.0
Harvest conditions 31% 10 11 10 31.0
Influential sector: Climate and Energy 0.0 0.0 0
Humidity/drought 77% 23 17 19 59.0
Temperature 77% 22 16 18 56.0
Influential sector: Industry and Trade 0.0 0.0 0
Global trade 38% 8 6 6 20.0
Changes in trade flows 31% 5 4 4 13.0
Other market (biofuel) 31% 3 2 0 5.0
Influential sector: Economy and
Finance 0.0 0.0 0
Influential sector: Government and
Politics 0.0 0.0 0
Regulations with respect to mycotoxins 54% 14 11 12 37.0
Influential sector: Communication
and Information 0.0 0.0 0
Information flows (e.g. RASFF, but also
to consumers) 46% 6 6 10 22.0
Education within food production chain 46% 12 10 13 35.0
Influential sector: Science and
Technology 0.0 0.0
Influential sector: Population and
Next to assigning an importance score to each of the indicators, the experts were also asked to select the five most important indicators (‘top 5’). Figure 4.3 gives an overview of these most important indicators, including in how many interviews these indicators were listed in the top five. This result is based on 10 interviews, since in the remaining interviews no answer to this question was given. In 7 of the 10 interviews, humidity/drought was in the top five of most important indicators. Furthermore, temperature, storage conditions and quality, crop variety, transport conditions, tillage policy, crop rotation, and global trade were in the top five of two or more interviews. These indicators belong to the influential sectors ‘Environment and Energy’, ‘Agriculture’, ‘Food Chain’, and ‘Industry and Trade’. Please note that Figure 4.3 can not be directly compared to the results in Table 4.1, since Figure 4.3 reflects the results the top five and Table 4.1 reflects the results of the importance scores that were assigned to all indicators mentioned.
0 1 2 3 4 5 6 7 8 9 10 H u m idi ty /d roug ht T e m per at ur e S tor age c ondi tions and qu al ity C rop v a ri et y T ran spor t con d iti ons T ill age p o lic y C ro p r ota tio n G lobal tr ade Number of interviews 0% 10% 20% 30% 40% 50% 60% 70% 80% 90% 100% P e rc en tage of in te rv ie w s
Figure 4.3 Number of interviews in which the experts classified the different indicators in the
Based on the percentage of interviews in which the different indicators were mentioned, the importance scores, and the percentage of interviews in which the different indicators belonged to the top 5, the 10 most important indicators were selected. Table 4.2 provides a description of these most important indicators. The indicator ‘changes in consumption patterns’ (see Table 4.2) is an important indicator according to the results of the interviews. This indicator, however, seems to be more related to the health risk of mycotoxins than to the risk of mycotoxin contamination in various commodities.
Table 4.2 Description of the most important indicators based on the interview results.
Indicator Explanation
Humidity/drought Air/soil humidity, rain and drought during the different stages of the crop (flowering, harvest etc.).
Temperature High temperatures in winter, large day-night temperature differences in spring, early and/or warm summers.
Storage conditions and quality
Examples of such conditions are time, storage per farmer versus storage in cooperation’s, separate storage of suspected lots and temperature and humidity. Crop variety Choice of for example resistant, short or GMO varieties.
Transport conditions Examples of such conditions are time, size shipping company, temperature, moist, ventilation and measures to prevent condensation.
Tillage policy No tillage policy or deep ploughing.
Crop rotation Growing similar/dissimilar types of crops on the same parcel in sequential seasons.
Global trade Trade of crops among many different countries of various parts of the world. Changes in
consumption patterns
Differences in eating patterns of certain products. Regulations with
respect to mycotoxins
European and national limits for mycotoxins in different products in importing and exporting countries.
4.2.3 Conclusions
Based on Figure 4.2, it can be concluded that the most important influential sectors are ‘Agriculture’, ‘Environment and Energy’, ‘Food chain’ and ‘Industry and Trade’.
Experts were asked to assign importance scores to the indicators they mentioned during the interview and also to list the five most important indicators. An analysis of the most important indicators was performed based on a) the extent to which the indicators are mentioned in the different interviews (Table 4.1), b) the ranking of these indicators for the different crops (Table 4.1), and c) the extent to which the indicators were listed in the top five in the different interviews (Figure 4.3). When comparing the results of these different analyses, some differences are observed. Global trade is an important indicator according to the top five results, whereas based on the extent to which the
indicators were mentioned and the ranking of the indicators with importance scores, global trade is not among the most important indicators. In addition, changes in consumption patterns and regulations with respect to mycotoxins are found to be important indicators based on the extent to which the indicators were mentioned and the ranking of the indicators with importance scores, but not when using the top 5 method. Taking the different analyses together, the 10 most important indicators were
identified (Table 4.2) with ‘humidity/drought’ and ‘temperature’ being more important than the other eight indicators. These results were used as a starting point for the workshop (see next section).
4.3 Workshop
4.3.1 Approach
4.3.1.1 Objectives
The overall aim of the workshop was to arrive at consensus upon the most important indicators for identification of (re-)occurrence of mycotoxins. The workshop focused on wheat as a model commodity. The aim of the workshop was broken down into the following objectives:
- to further reduce the set of 10 main indicators identified in the interviews; - to define the selected most important indicators in more detail;
- to identify potential interactions between the selected indicators;
- to obtain consensus upon the most important indicators and relevant interactions.
4.3.1.2 Selection of experts
The selection of experts was aimed to include experts with expertise in the relevant influential sectors, i.e. ‘Agriculture’, ‘Environment and Energy’, ‘Food chain’ and ‘Industry and Trade’ (as determined in section 4.2). Furthermore, the experts were selected on the basis of their backgrounds, aiming to include experts from risk management, risk assessment and feed and food industry. Several experts that participated in the interviews were invited, together with additional experts.
4.3.1.3 Set-up of workshop
After a short introduction in which the aim of the workshop was explained, the results of the expert interviews were presented, including the set of 10 most important indicators based on the interviews. The participants were asked to individually rank these indicators from 1 – 10 according to their relative importance for wheat. After this individual task, the experts were divided into 2 groups, each group consisting of experts with various backgrounds. In each group the results on the ranking of the indicators were discussed aiming to reach consensus on the most important ones and to add any missing indicators. These most important indicators were defined in more detail and interactions with other important indicators were identified. The last part of the workshop consisted of a plenary feedback session, in which the results of the two group discussions were presented and an overall discussion was held on potential differences in the outcomes.
4.3.2 Results
4.3.2.1 Experts
In the workshop, fourteen experts with expertise in the relevant influential sectors (based on the results of the interviews) participated, with 4 persons from industry, 5 persons from risk management and 5 persons from risk assessment (a list of participants is included as Annex 5).
4.3.2.2 Selection of indicators
Table 4.3 presents the results from the experts’ individual scoring of the 10 most important indicators (resulting from the series of interviews). As can be seen from this Table, humidity was evaluated to be the far most important indicator to assess the risk of the occurrence of mycotoxins in wheat, followed – in order of importance – by temperature and crop rotation. Then, three other indicators were judged to be nearly as important, being tillage, storage conditions and quality, and crop variety. The other indicators were judged to be less important. The indicator ‘changes in consumption patterns’ was selected as an important indicator according to the results of the interviews. However, during the workshop, this indicator was considered not to be important in assessing mycotoxin contamination in
various commodities, since this indicator is more related to the health risk of mycotoxins than to the risk of occurrence of mycotoxins in various commodities.
Table 4.3 Results ranking of top 10 indicators interviews during workshop.
Ranking Indicator Total scores*
1 Humidity/drought 128
2 Temperature 97
3 Crop rotation 93
4.5 Tillage policy 83
4.5 Storage conditions and quality 83
6 Crop variety 80
7 Transport conditions and quality 66
8 Global trade 37
9 Regulations with respect to mycotoxin limits 33
10 Changes in consumption patterns 14
* Thirteen participants filled in the ranking, and gave 10 points to the most important indicator and 1 point for the least important indicator (maximum score 130)
During the discussion on selecting the most important indicators and identification of missing indicators in both the subgroups, several experts stressed that indicators will differ for different mycotoxins and/or fungi. Therefore, it was decided to allow discussion on various toxins but to focus on those toxins that can be produced by Fusarium species in wheat. In both subgroups of experts, consensus was reached on the following most important indicators: relative humidity, temperature, crop rotation, crop variety, tillage policy and storage and transport conditions. Both subgroups considered ‘transport’ as prolonged ‘storage’ and therefore the indicators ‘storage conditions and quality’ and ‘transport conditions and quality’ were merged into one new indicator, being ‘storage and transport conditions’. In addition, in one subgroup, the indicator ‘drying of the kernel’ was indicated as an additional indicator.
4.3.2.3 Further definition of indicators
The most important indicators were further defined in both subgroups by determining what information (measurement) is needed and when (how often) this information should be obtained. Afterwards, these definitions were discussed in the plenary feedback session. The outcome of this part of the plenary session is presented in Table 4.4.
Table 4.4 Most important indicators as defined during the workshop.
Indicator Description
Relative humidity Relative humidity during wheat cultivation.
Ideally, relative humidity should be expressed as leaf wetness. Since this is difficult to monitor, rainfall (in combination with temperature) and irrigation could be used as an alternative. For relative humidity, three time windows during cultivation of wheat are important, being the period around/at flowering, two weeks before harvest, and delayed harvest.
Temperature Temperature (sun shine) during wheat cultivation.
Temperature is only relevant in combination with humidity. Therefore, the same three time windows as mentioned for relative humidity are important.
Crop rotation The crop that is grown previously/during the previous year(s).
Growing maize before wheat or wheat before wheat increases the possibility of occurrence of mycotoxins. Especially maize before wheat is a risk factor. Crop variety The cultivar/variety of crop.
The susceptibility of the used cultivar/variety for mycotoxin producing fungi is important. Resistance levels are variable (not absolute), not always clearly defined and not stable over time. Recommended varieties vary between countries.
Tillage policy The tillage policy that is used before the crop is planted.
Levels for tillage may include: no tillage, mediate tillage, deep-tillage (and burning). Tillage policies vary between countries. In the Netherlands, burning is prohibited and deep-ploughing not used (due to erosion).
Drying of the kernel The extent to which the kernel is dried before storage.
In the EU, a moisture content < 15% in the kernel is recommended during storage, and therefore proper drying before storage is often necessary.
Storage (and
transport) conditions
The conditions and quality of the storage (and transport) of the commodities, including relative humidity, temperature, protection against pests and/or insects, etc. The water content of the kernel can be measured and temperature differences in the storage facility can be monitored.
4.3.2.4 Interactions between indicators
Several potential interactions between the indicators were identified:
- Relative humidity and temperature during cultivation (temperature is only important in combination with humidity).
- Storage conditions and drying (when kernels are not dried properly, the storage conditions are more important).
4.4 Conclusions
On the basis of the results of the expert study, consisting of a series of in-depth interviews and a workshop, the most important indicators for the risk of occurrence of re-emerging mycotoxins
produced by Fusarium fungi in wheat include humidity, temperature, crop rotation, crop variety, tillage policy, drying, and storage and transport conditions. In total 25 experts participated in the expert study. Since during the workshop, consensus was reached on the most important indicators, it is not to be expected that consulting additional experts will change this list of most important ones. The indicators were defined for re-emerging mycotoxin, but it is to be expected that these indicators will also have predictive value, to some extent, for emerging mycotoxins. Emerging mycotoxins are addressed in more detail in the European MYCONET project (Van der Fels-Klerx et al., 2008). The indicators were further defined during the workshop by specifying what information (measurement) is needed and when (how often) this information should be obtained. Significant interactions were identified between relative humidity and temperature during cultivation; crop rotation and tillage policy; and drying and storage conditions. The results of both the interviews and the workshop are used as input into a risk model for the assessment of the risk of occurrence of mycotoxins in the three commodities.
5 Development of the model
5.1 Set-up of the model
5.1.1 Introduction
The ability to anticipate on the presence of mycotoxins on products such as wheat, maize and nuts requires observation of the correct indicators and efficient communication along the food production chain. To anticipate on this re-emerging risk, a blueprint of a model was developed to assess the risk of occurrence of mycotoxins on wheat, maize and nuts (peanuts and tree nuts).
The aim of this model is to assess the presence of mycotoxins on wheat, maize, peanuts and tree nuts (the raw commodities) and not to assess the related health risk. Furthermore, the aim of the model is to assess the risk of occurrence of re-emerging (i.e. known) mycotoxins and not of emerging (not yet identified) mycotoxins. For emerging (i.e. not yet known) mycotoxins, it will be difficult to identify specific indicators and develop a model. However, many indicators used in the model for re-emerging mycotoxins will probably also have a predictive value for emerging mycotoxins. Emerging mycotoxins will be addressed in more detail in the European project MYCONET (Van der Fels-Klerx et al., 2008). The model may be used by risk assessors/risk managers to anticipate on the potential presence of mycotoxins by proactive risk management strategies such as adjusting sampling strategies, giving advice along the food chain or obliging certain data to be provided for each lot that enters the country. For industrial stakeholders this model may be useful for purchasing strategies or other strategies to improve the quality of the purchased commodities.
In Figure 5.1, a decision tree is shown that indicates when the model that will be developed, may be used to determine sampling strategies. For some commodities, legislation enforces control. EC decision 2006/504 describes which fraction of certain commodities originating from certain countries should be sampled when entering the European Union (EU, 2006b). In these cases, sampling should be performed according to the respective legislation. For several countries, models are described that assess the presence of (certain) mycotoxins on (certain) commodities well (> 80% certainty) (e.g. DONCAST, available at: http://www.ontarioweathernetwork.ca/DONcast.cfm). These models are very valuable in assessing the presence of certain mycotoxins in a specific region and therefore, these regional models may be preferred over the new generic model that will be developed. When no legal monitoring is required and no reliable regional model is available, the new model that will be developed could be used to determine the sampling strategy (Figure 5.1).
Figure 5.1 Decision tree to determine when the new model can be used in determining the sampling strategy.
Similar decision trees can be drawn for other risk management strategies or for example for optimizing purchasing strategies for industrial stakeholders. This new predictive model will be based on the indicators and the interrelations between the indicators that were defined in the workshop (see chapter 4). Two possible set-ups for the predictive model will be discussed in the next sections, being a ‘traffic light’ model and a ‘decision tree’ model.
5.1.2 ‘Traffic light model’
In the EMRISK report, a ‘traffic light model’ is described as tool to predict (re-)emerging risks (Noteborn et al., 2006). In Figure 5.2, an example of a traffic light model is given. In a ‘traffic light model’ relevant indicators are monitored continuously or are measured at (a) certain time point(s). These indicators can be qualitative, semi-quantitative or quantitative Each indicator has several alert values (red, yellow, green). The more indicators have a yellow or red alert value, the higher the risk on a certain effect is. Next to the alert value, several other factors including urgency factors (U-factors) (included in Figure 5.2), importance factors (I-Factors) (not included in Figure 5.2) and relationship factors (R-factors) (not included in Figure 5.2) are mentioned as possible additional factors in this ‘traffic light model’. The urgency factor refers to the speed with which assessment actions should be taken. The higher the urgency factor the more urgency should be given to risk management actions in this approach. The importance factor reflects that the indicators are not all equally important. The relationship factor accounts for the relationship that can exist between indicators. Two indicators may for example have a synergistic effect (Noteborn et al., 2006). For the current purpose, the advantage of this ‘traffic light model’ is that the outcome of the model is based on the values of all indicators taking into account that some indicators are more important than others by the use of importance factors.
Figure 5.2 Example of a ‘traffic light’ model including urgency factors [Source: Noteborn et al., 2006]. * UF = urgency factor.
5.1.3 Decision tree model
Another possibility is a ‘decision tree model’ (see Figure 5.3). In a decision tree model, the outcome of each indicator indicates the next step in the model until a decision point is reached (in the model in Figure 5.3 this decision point could be ‘high risk on mycotoxin contamination’ or ‘low risk on mycotoxin contamination’). The main advantage of this model for the current purpose is that in some cases a decision can already have been achieved with information on one or two indicator(s). However, for the current purpose, this advantage is not that large, since it is never known beforehand how many indicators are necessary to arrive at a decision point. A disadvantage of this model is that it is difficult to include interrelations between indicators in the model.
5.1.4 Set-up of the model - approach
For the current purpose, the ‘traffic light model’ was used as a starting point, since it was expected that a) most reliable results will be obtained using all indicators and taking into account that some of them are more important than others and b) some interrelated indicators might need to be evaluated together (see also sections 3.2 and 4.3.2.4). During the discussion on the most important indicators in the workshop, several experts stressed that the choice for the indicators will differ for different
commodities, mycotoxins and/or fungi and that for example optimal weather circumstances will vary for different mycotoxins and/or fungi. During the development of the model, it was attempted to design a blue-print of a model that can be used for different fungi, mycotoxins on all four commodities (wheat, maize, peanuts and tree nuts). This blue-print can be specified for a certain (fungi/mycotoxin in a) commodity by inclusion of different indicators, with different importance factors and by defining the risk categories differently per commodity/fungi/mycotoxin.
For wheat, during the workshop the main indicators were defined in more detail, leading to several indicators e.g. ‘water content of the kernel’ and ‘temperature differences in the storage facility’ as sub-indicators for the indicator ‘storage and transport conditions’. For the other commodities (maize, peanuts and tree nuts), the indicators and sub-indicators defined in the workshop for wheat were critically reviewed for their predictive value for these commodities. Based on the results of the interviews and based on additional literature research additional indicators and sub-indicators were defined for maize, peanuts and tree nuts. During the interviews, peanuts and tree nuts were discussed together, but due to their differences in growth (trees versus plants), these commodities are now discussed separately.
For the (sub-)indicators that were defined for the different commodities, different risk categories were defined to facilitate inclusion in the model. Depending on the indicator, two (‘red’ and ‘green’) or three (‘red’, ‘yellow’ and ‘green’) risk categories were defined with ‘red’ referring to high risk of occurrence of mycotoxins, ‘yellow’ referring to intermediate risk of occurrence of mycotoxins and ‘green’
referring to low risk of occurrence of mycotoxins. The risk categories are separated from each other by threshold values that are referred to as ‘cut-off values’ in this report. For all commodities the definition of the cut-off values and the corresponding risk categories are described in section 5.2. These risk categories and the corresponding cut-off values are based on the interpretation of available data (obtained from literature, from the interviews, from the workshop or from other expert judgements) by the project members. Further validation of these risk categories and the corresponding cut-off values using a sufficient amount of data is needed.
Furthermore, to each (sub-)indicator, an importance factor was attributed per commodity, based on expert judgements (obtained during the interviews and workshop), existing models, or the
judgement of the project members. These importance scores are listed in section 5.3. Further validation of these importance factors using a sufficient amount of data is needed as well. In addition, as discussed in section 3.2 and during the workshop (section 4.3.2.4) several interrelationships between indicators exist. In the model, these interrelations are included in the risk categories (e.g. if intermediate tillage is performed, the risk category is yellow, but if intermediate tillage is performed and maize is pre-crop, the risk category is red).
Urgency factors are not yet included in the model. In a later stage, urgency factors may be included in the model, since this may be valuable for several proactive risk management strategies such as giving
![Table 2.1 The number of RASFF notifications on mycotoxins in 2006 for the main mycotoxins within several product categories [Source: RASFF, 2007].](https://thumb-eu.123doks.com/thumbv2/5doknet/3061799.8889/15.892.140.731.230.545/table-number-notifications-mycotoxins-mycotoxins-product-categories-source.webp)
![Table 2.3 Overview on Fusarium toxin occurrence data submitted by the countries participating in the SCOOP project [Source: Gareis et al., 2003]](https://thumb-eu.123doks.com/thumbv2/5doknet/3061799.8889/17.892.141.800.217.634/overview-fusarium-occurrence-submitted-countries-participating-project-source.webp)
![Table 2.5 Range of average dietary intakes* calculated as percentage of the TDI values [Source: Gareis et al., 2003]](https://thumb-eu.123doks.com/thumbv2/5doknet/3061799.8889/18.892.138.781.380.532/table-average-dietary-intakes-calculated-percentage-source-gareis.webp)