GAME OF NUMBERS
IN THE HUMAN GUT MICROBIOME:
QUANTITATIVE MICROBIOME PROFILING AS A NOVEL
STRATEGY TO CHARACTERISE THE EFFECT OF TRANSIT TIME
ON THE GUT MICROBIAL ECOLOGY
Karen Delbaere
Student number: 01509793
Promoters: Prof. dr. ir. Tom Van de Wiele, Dr. ir. Kim De Paepe,
Tutor: Eng. Yorick Minnebo
A dissertation submitted to Ghent University in partial fulfilment of the requirements for the degree of Master of Bio-ingenieurswetenschappen – Levensmiddelenwetenschappen en voeding
Deze pagina is niet beschikbaar omdat ze persoonsgegevens bevat.
Universiteitsbibliotheek Gent, 2021.
This page is not available because it contains personal information.
Ghent University, Library, 2021.
Woord vooraf
Deze masterproef is geschreven in het kader van het behalen van een Master diploma in de bio-ingenieurswetenschappen, levensmiddelenwetenschappen en voeding, aan de Universiteit Gent. De afgelopen vijf jaar deed ik hier veel kennis op maar leerde daarnaast ook gewoon fijne mensen kennen. Deze thesis was niet mogelijk geweest zonder hulp uit vele hoeken en daarom wil ik dan ook een aantal personen vermelden.
Als eerste wil ik professor Tom Van de Wiele bedanken, voor het aanreiken van dit leerrijk onderwerp, zijn betrokkenheid en het nalezen van de tussentijdse versies.
Vervolgens wil ik ook mijn tutor Yorick bedanken, waarmee ik vlot kon samenwerken dankzij zijn enthousiasme, geduld en vertrouwen. Ook Kim, mijn co-promotor, hielp mij met haar interessante inzichten en de aanmoedigingen om compacter te schrijven. Zij beantwoordden beide ook al mijn vragen, spendeerden veel tijd aan het kritisch nalezen van mijn thesis en stuurden bij waar nodig. Voor extra hulp bij het labowerk wil ik ook de ATP staff en de vakgroep (CMET) bedanken: in het bijzonder Jana, Greet, Tim en Mike die me bijstonden bij analyses, praktisch werk en andere technische vragen, de HAM-cluster voor de boeiende meetings en feedback momenten, de VIB nucleomics core voor het uitvoeren van de DNA-analyses en tenslotte de donoren, die het mogelijk maakten om deze thesis uit te voeren.
Tenslotte kon ik, naast rechtstreekse hulp, ook rekenen op steun en begrip van mijn omgeving. De andere thesis studenten bij CMET stonden altijd klaar voor een aangename babbel in en naast de koffiekamer. Mijn bio-ingenieurs vrienden zaten in hetzelfde ‘thesis-schuitje’ en boden me met de wekelijkse skype-sessies de voorbije maanden, tijdens de coronaperiode, een welgekomen afleiding en structuur. Bovenal wil ik hier mijn familie, mijn ‘bubbel’, bedanken die me bijstonden, stimuleerden en hielpen waar mogelijk.
Deze pagina is niet beschikbaar omdat ze persoonsgegevens bevat.
Universiteitsbibliotheek Gent, 2021.
This page is not available because it contains personal information.
Ghent University, Library, 2021.
i
CONTENT
List with abbreviations ... iii
List with tables ... iv
List with figures...v
Abstract ... viii
Introduction ...1
1 Literature study ...2
1.1 The gastrointestinal tract (GIT) ... 2
The digestive system: functional compartmentalisation along a longitudinal axis ... 2
The gastro-intestinal wall: tissue structure variation along a transverse axis ... 4
Microbiota in the GIT ... 4
1.2 Microbial load ... 10
Quantitative microbiome profiling (QMP) ... 10
Determinants of the gut microbial load ... 11
1.3 The influence of transit time on the gut microbiota ... 13
Methods to determine transit time ... 13
Determinants of transit time ... 14
Transit time and microbiota ... 15
1.4 Simulating the gastrointestinal tract ... 16
The significance of in vitro gut models ... 16
The Simulator of the Human Intestinal Microbial Ecosystem (SHIME) ... 16
1.5 Objectives ... 18
2 Materials and methods ...19
2.1 SHIME operation ... 19
Experimental setup ... 19
Donor selection ... 21
Inoculation and operation of the SHIME ... 21
2.2 Sample analyses ... 24
DNA extraction and 16S rRNA gene amplicon sequencing ... 24
Flow cytometry analysis ... 24
Short-chain fatty acids ... 25
Ammonium ... 25
Lactate ... 25
Gaseous compounds ... 25
2.3 Bioinformatics analysis ... 26
Bio-informatics processing of the amplicon sequencing data ... 26
Statistical analysis ... 27
Chemical oxygen demand and the nutrient load ... 28
3 Results ...29
Microbial load ... 29
16S rRNA gene amplicon sequencing ... 31
Metabolite production ... 41 4 Discussion ...44 Conclusion ...51 Future perspectives ...52 References ...54 5 Appendix ...1
Appendix A: Literature study ... 1
Appendix B: Materials and methods ... 4
LIST WITH ABBREVIATIONS
BSS Bristol stool scaleB-enterotype Bacteroides enterotype
COD Chemical Oxygen Demand
CTT Colonic Transit Time
CFU Colony-Forming Unit
CD Crohn's Disease
DC Distal Colon
GI Gastrointestinal
GIT Gastrointestinal tract
IBD Inflammatory Bowel Diseases
IBS Irritable Bowel Syndrome
IBS-C Irritable Bowel Syndrome with Constipation
LT Long Transit
MT Medium Transit
OTU Operational Taxonomic Unit P-enterotype Prevotella enterotype
PCoA Prinicpal Coordinates Analysis
PC Proximal Colon
QMP Quantitative Microbiome Profiling
qPCR quantitative PCR
R-enterotype Ruminococcus enterotype
ST Short Transit
SCFA Short-Chain Fatty Acid
SHIME Simulator of the Human Intestinal Microbial Ecosystem ST/SI Stomach and Small Intestinal compartment
iv
LIST WITH TABLES
Table 1 SHIME set-up: the residence time and volume per transit time (short, medium, long) and per
colon compartment. Each set-up comprised a proximal and distal colon compartment. ... 19
Table 2 SHIME set-up: volumes of nutritional SHIME feed, pancreatic juice and distilled water added
to the proximal colon each feeding cycle in the three assessed transit times (short, medium, long transit). The compounds were mixed and acclimatised to 37℃ in the stomach/small intestine vessel prior to transferal to the proximal colon. ... 19
Table 3 Characteristics of the six donors enrolled in the SHIME experiment. The donor’s transit time
is estimated by the time between corn consumption and corn defecation and corresponds well with the reported stool frequencies. The donor’s classification was based on the following timeframe: short transit ≤42h, medium transit <60h and long transit (LT) >60h. Sex: Male (M) or female (F). ... 20
Table 4 SHIME set-up: volume (mL) L-SHIME-medium and faecal inoculum added to SHIME vessels
during inoculation... 20
Table 5 SHIME set-up: Amount of nutrients, pancreatin, bile acids and NaHCO3 added to the proximal
colon compartment (g.L-1 proximal colon) each feeding cycling in all three assessed transit times.
L-SHIME medium (ProDigest, Zwijnaarde, Belgium), Pancreatin from porcine pancreas (Sigma Aldrich, St. Louis, MO, US), Bile acids Oxgall (Difco, Becton, Dickinson and Company, US), NaHCO3 (Carl
v
LIST WITH FIGURES
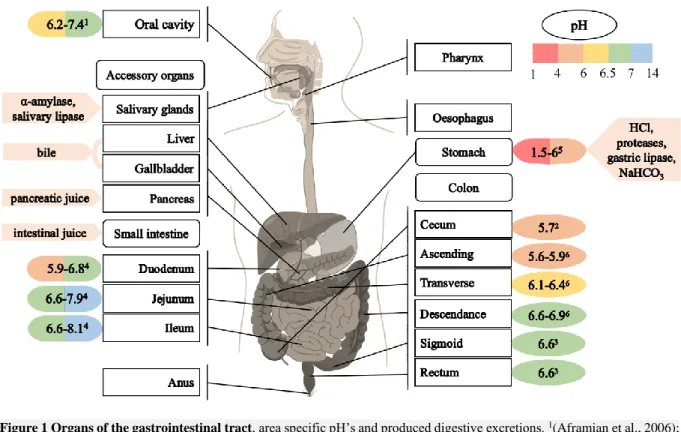
Figure 1 Organs of the gastrointestinal tract, area specific pH’s and produced digestive excretions.
1(Aframian et al., 2006); 2(Hillman et al., 2017); 3(Fallingborg et al., 2007); 4(Roussel, 2019); 5(Sams et
al., 2016); 6(Van de Wiele et al., 2015) Figure:
https://commons.wikimedia.org/wiki/File:Digestive_system_without_labels.svg. ... 2
Figure 2 Internal structure of the colon with different micro-environments (from outside to inside):
lumen and substrate particles, outer mucus layer, inner mucus layer and epithelium. Microbial colonization in the lumen and mucus layer is defined in colony forming units (CFU) g-1 or mL-1. The
epithelium is composed out of different eukaryotic cells: mostly enterocytes, but also stem, goblet, enteroendocrine, M and tuft cells. Adapted from Flint et al., (2012) and Van den Abbeele et al. (2012). ... 6
Figure 3 Schematic representation of biosynthesis metabolic pathways and cross-feeding mechanisms of the GIT microbiota. Pathway names are written between brackets and followed by
corresponding microbiota. Note that the producing microbiota and produced ratios differ individually. In faecal samples, typical molar ratios of acetate:propionate:butyrate are 60:25:15 or 60:20:20. [adapted from flint et al, 2012 and flint et al, 2014] ... 9
Figure 4 Quantitative Microbiome Profiling (QMP): relative versus absolute genus-level faecal
microbiome composition (n=40). a) relative microbiota profile deduced from Illumina sequencing b) absolute microbiota profile deduced from complementing relative sequencing data with microbial cell counts (cells per gram of faeces). (adopted from Vandeputte et al., 2017) ... 11
Figure 5 Representation of the Bristol Stool Scale, with an increasing type number being correlated
with a decreasing transit time and an increasing water content [adapted from Chumpitazi et al. (2016)] ... 14
Figure 6 Schematic representation of a Twin-SHIME A Twin-SHIME consists of two parallel
operated units, conventionally each consisting of five consecutive vessels (stomach, small intestine, colon ascendens, colon transversum and colon descendens) with their own conditions (pH, nutrient availability, microbial population). At the start of experiments, the colon vessels are inoculated with a faecal dilution. The liquid flow is maintained by pumps and liquid from the colon descendens is discarded to a waste vessel. The stomach is provided with pancreatic juice (including bile) and SHIME feed acidified to pH 2. The system operates at 37°C, vessels are constantly mixed by stirrers and vessels are kept anaerobic by N2 flushing of the stomach. pH of the colon vessels is controlled by means of pH
probes and adjusted by acids and bases. The volumes are kept constant and the residence time varies between 24 and 72h, dependent on the studied colon region. Adapted from Van den Abbeele et al. (2012). ... 17
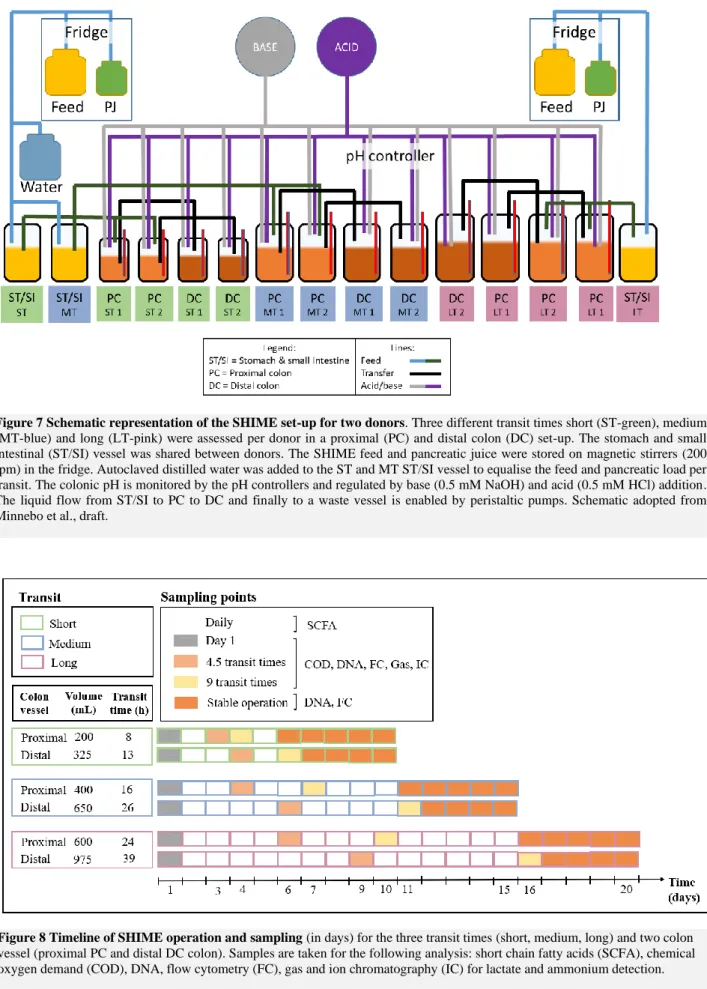
Figure 7 Schematic representation of the SHIME set-up for two donors. Three different transit times
short (ST-green), medium (MT-blue) and long (LT-pink) were assessed per donor in a proximal (PC) and distal colon (DC) set-up. The stomach and small intestinal (ST/SI) vessel was shared between donors. The SHIME feed and pancreatic juice were stored on magnetic stirrers (200 rpm) in the fridge. Autoclaved distilled water was added to the ST and MT ST/SI vessel to equalise the feed and pancreatic load per transit. The colonic pH is monitored by the pH controllers and regulated by base (0.5 mM NaOH) and acid (0.5 mM HCl) addition. The liquid flow from ST/SI to PC to DC and finally to a waste vessel is enabled by peristaltic pumps. Schematic adopted from Minnebo et al., draft. ... 23
vi
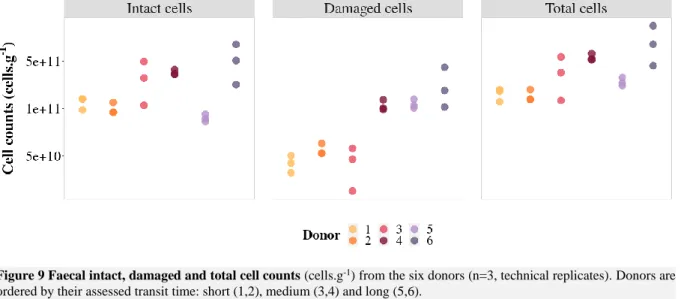
Figure 8 Timeline of SHIME operation and sampling (in days) for the three transit times (short,
medium, long) and two colon vessel (proximal (PC) and distal (DC) colon). Samples are taken for the following analysis: short chain fatty acids (SCFA), chemical oxygen demand (COD), DNA, flow cytometry (FC), gas and ion chromatography (IC) for lactate and ammonium detection. ... 23
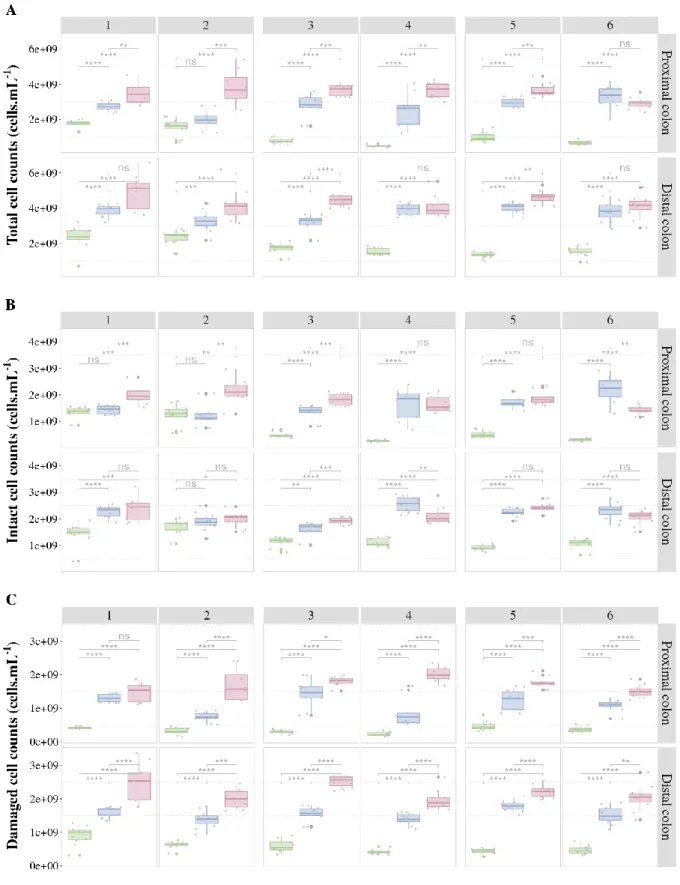
Figure 9 Faecal intact, damaged and total cell counts (cells.g-1) from the six donors (n=3, technical
replicates). Donors are ordered by their assessed transit time: short (1,2), medium (3,4) and long (5,6). ... 29
Figure 10 Cell counts (cells.mL-1) A) total B) intact and C) damaged cell counts in function of the
SHIME transit regime, separated per donor and colon compartment, averaged over 5 days of stable operation (n=5). Donors are ordered by their assessed transit time: short (1,2), medium (3,4) and long (5,6). **** = p < 0.0001, *** = p < 0.001, ** = p < 0.01, * p < 0.05, ns = no significance (unpaired Wilcoxon test with Benjamini-Hochberg correction). ... 30
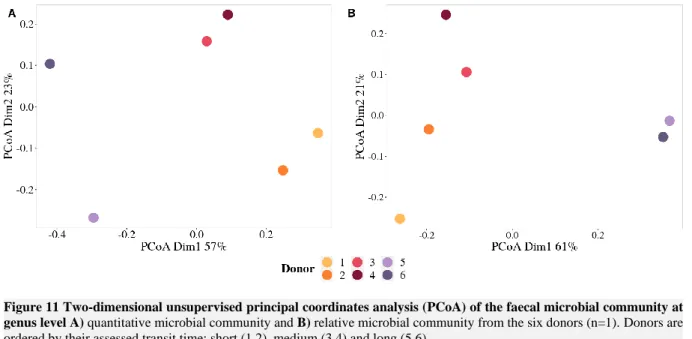
Figure 11 Two-dimensional unsupervised principal coordinates analysis (PCoA) of the faecal microbial community at genus level A) quantitative microbial community and B) relative microbial
community from the six donors (n=1). Donors are ordered by their assessed transit time: short (1,2), medium (3,4) and long (5,6). ... 31
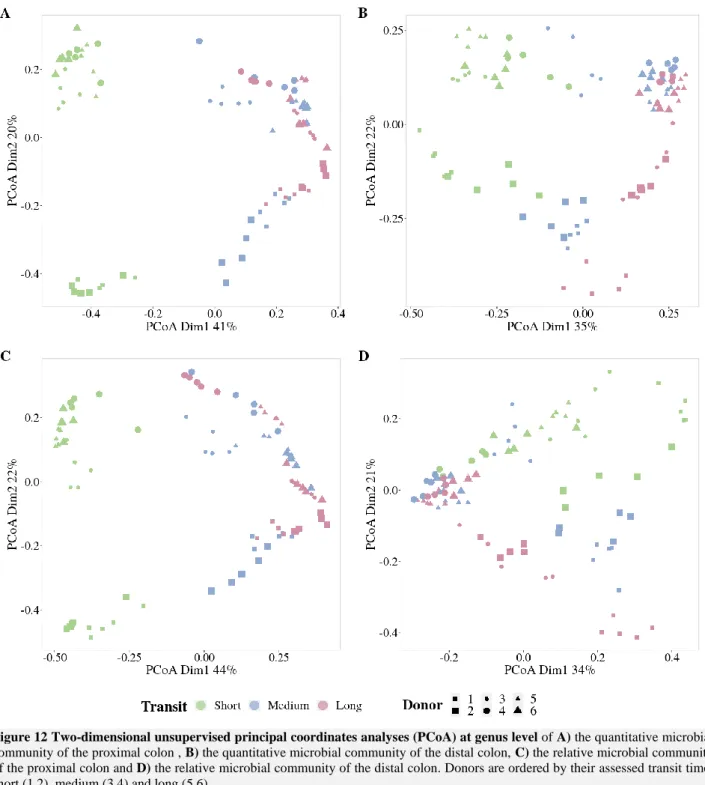
Figure 12 Two-dimensional unsupervised principal coordinates analyses (PCoA) at genus level of A) the quantitative microbial community of the proximal colon , B) the quantitative microbial
community of the distal colon, C) the relative microbial community of the proximal colon and D) the relative microbial community of the distal colon. Donors are ordered by their assessed transit time: short (1,2), medium (3,4) and long (5,6). ... 32
Figure 13 Shannon α-Diversity of the quantitative faecal microbial community at genus level for
the six donors (n=1). Donors are ordered by their assessed transit time: short (1,2), medium (3,4) and long (5,6). ... 33
Figure 14 Shannon α-Diversity of the quantitative microbial community at genus level in function
of the SHIME transit regime, separated per donor and colon compartment, averaged over 5 days of stable operation (n=5). Donors are ordered by their assessed transit time: short (1,2), medium (3,4) and long (5,6). **** = p < 0.0001, *** = p < 0.001, ** = p < 0.01, * p < 0.05, ns = no significance (unpaired Wilcoxon test). ... 33
Figure 15 16S rRNA gene amplicon sequencing results of the faecal samples from the six donors. A) The absolute abundance (cells.g-1) retrieved by multiplying the total cell counts with the
corresponding reads. B) The relative abundance (%). The twenty-two most abundant genera present in both the absolute and relative total faecal bacterial community has been plotted, of which the others were pooled as ‘Other’. Family level taxa are to be interpreted as an unclassified genus belonging to the respective family. The displayed bars represent the different donors (n=1). Donors are ordered by their assessed transit time: short (1,2), medium (3,4) and long (5,6). ... 34
Figure 16 Absolute (left) and relative (right) abundances of Clostridium XIVa and Veillonella in
the faecal samples from the six donors (n=1). The donors are ordered by their assessed transit time: short (1,2), medium (3,4) and long (5,6). ... 35
Figure 17 Absolute (left) and relative (right) abundances of Bacteroides, Bifidobacterium,
Clostridium XIVa, Prevotella, Roseburia and Veillonella in function of the SHIME transit regime,
separated per donor and colon compartment, averaged over 5 days of stable operation (n=5). The donors are ordered by their assessed transit time: short (1,2), medium (3,4) and long (5,6). 38
vii
Figure 18 Absolute abundances of the twenty-two most abundant genera as determined by 16S rRNA sequencing present in the SHIME colon compartments, inoculated with the faecal sample of six
donors. Displayed in function of the SHIME transit regime, separated per donor and colon compartment and averaged over 5 days of stable operation (n=5). Donors are ordered by their assessed transit time: short (1,2), medium (3,4) and long (5,6). The absolute abundance was retrieved by multiplying the total cell counts with the corresponding reads. Family level taxa are to be interpreted as an unclassified genus belonging to the respective family. ‘Other’ refers to the sum of the remaining genera. ... 39
Figure 19 Relative abundances of the twenty-two most abundant genera as determined by 16S rRNA sequencing present in the SHIME colon compartments, inoculated with the faecal sample of six donors.
Displayed in function of the SHIME transit regime, separated per donor and colon compartment and averaged over 5 days of stable operation (n=5). Donors are ordered by their assessed transit time: short (1,2), medium (3,4) and long (5,6). Family level taxa are to be interpreted as an unclassified genus belonging to the respective family. ‘Other’ refers to the sum of the remaining genera. ... 40
Figure 20 Faecal short-chain fatty acid levels (mmol.g-1) of the six donors. Donors are ordered by
their assessed transit time: short (1,2), medium (3,4) and long (5,6). ... 41
Figure 21 Short-chain fatty acid (SCFA) concentrations (mM) and relative amounts (%) of
microbial SHIME communities with different transit times. A) Acetate B) Propionate C) Butyrate D) Branched SCFA and E) Total SCFAs, in function of transit times, separated per donor and colon compartment, averaged over 5 days of total stability (n=5). Donors were ordered by their assessed transit time: short (1,2), medium (3,4) and long (5,6). **** = p < 0.0001, *** = p < 0.001, ** = p < 0.01, * p < 0.05, ‘blank’ = no significance (unpaired Wilcoxon test with Benjamini-Hochberg correction). ... 42
Figure 22 Linear regressions of ammonium concentrations (mM) in function of the SHIME transit
times of both proximal and distal colon compartments for all donors. Regression displays the equation and r-squared. ... 43
Figure 23 Chemical oxygen demand (COD) (g.L-1) of feed and soluble biomass in function of the SHIME transit regime, separated per donor and colon compartment during stable operation (n=1). Donors are ordered by their assessed transit time: short (1,2), medium (3,4) and long (5,6). ... 43
viii
ABSTRACT
Summary in English
Constipation, defined by an increased gastro-intestinal-transit time, is a worldwide complaint that is also related to a decreased quality of life. Recent studies suggested a correlation between transit time and the number of microorganisms (microbial load) present in human faecal samples. In this master dissertation, the impact of transit time on the human gut microbial load and community composition and functioning was studied with the Simulator of the Human Intestinal Microbial Ecosystem in vitro model, examining three different transit times. Inter-individual variability was included by repeating the experiments for six donors, who were categorized based on their transit time. The obtained results showed increased cell counts and increased total short-chain-fatty acid-, acetate-, and propionate concentrations in prolonging transit times, while the butyrate concentrations decreased in the longest transit time. This decrease was partly linked with an absolute and relative decrease of Clostridium XIVa and Roseburia in the long transit, altered cross-feeding phenomena by a decreased absolute and relative Bifidobacterium abundance, and substrate competition for propionate and butyrate production. Veillonella’s absolute and relative abundance was strongly associated to the shortest transit time. Moreover, the associations of
Clostridium XIVa, Roseburia and Veillonella to a certain transit time were confirmed in the faecal
samples. We concluded that transit time plays an important role in the functioning, composition, and load of gut microbial communities.
Keywords: Simulator of the Human Intestinal Microbial Ecosystem (SHIME), Gut microbiome, Transit
time, Microbial quantity, Quantitative Microbiome Profiling (QMP), Illumina sequencing, Flow cytometry
ix
Samenvatting in het Nederlands
Constipatie, gedefinieerd als een verlenging in gastro-intestinale transit tijd, is een frequent voorkomende aandoening die een daling in levenskwaliteit teweeg kan brengen. Recente studies gaven een link aan tussen de transit tijd en microbiële aantallen aanwezig in fecale stalen. Deze masterproef onderzocht de invloed van transit tijd op de menselijke microbiële darmgemeenschap samenstelling, hoeveelheid en functionering met behulp van het ‘Simulator of the Human Intestinal Microbial Ecosystem’ in vitro model waarin drie verschillende transit tijden werden gesimuleerd. Interindividuele verschillen werden in rekening gebracht door zes donoren te beschouwen die ingedeeld werden op basis van hun eigen transit tijd. De resultaten toonden een stijging in microbiële cel aantallen en totale korteketenvetzuur, acetaat-, en propionaat concentraties in langere transit tijden, maar een daling in butyraat concentraties in de langste transit. Deze daling werd gelinkt met een absolute en relatieve daling van Clostridium XIVa en Roseburia, in de langste transit tijd, een verandering in cross-feeding door een daling in Bifidobacterium’s absolute en relatieve aanwezigheid en substraat competitie tussen propionaat en butyraat productie. Veillonella was absoluut en relatief meest aanwezig in de kortste transit tijd. De link tussen Clostridium XIVa’s, Roseburia’s en Veillonella’s aanwezigheid en de transit tijd werd bovendien bevestigt in de fecale stalen. We besluiten dat transit tijd een belangrijke rol heeft in het functioneren, de samenstelling en de aantallen van de microbiële darmgemeenschap.
Kernwoorden: Simulator of the Human Intestinal Microbial Ecosystem (SHIME), Microbiële
darmgemeenschap, Transittijd, Microbiële aantallen, Quantitative Microbiome Profiling (QMP), Illumina sequencing, Flow cytometry
1
INTRODUCTION
“An early morning stroll Is good for people on the whole. It makes your appetite improve,
It also helps your bowels to move.” (Roald Dahl, Revolting rhymes, 1982)
In 1982, Roald Dahl poetically expressed the relation between health and an increased bowel movement. He suggested a morning walk as a cure for a weak bowel movement and a delayed transit. Today, chronic constipation is a common complaint worldwide. The reported prevalence ranges between 1% and 80%, with the highest occurrence among elderly. Chronic constipation is related to a decreased quality of life, posing and increased burden on the health care system (Forootan et al., 2018). Furthermore, the ‘reduction in intestinal transit time’ is an authorised food health claim by the European Food Safety Authority (EFSA) (Commission regulation (EU) No 432/2012).
Before the time Roald Dahl wrote down this quote, science already started to explore the influence of the gut microbiota on humans. Milestones such as cultivating anaerobes, successfully treating a
Clostridium difficile infection by a faecal microbiota transplantation, the introduction of germ-free
animals and the discovery of microbial metabolism contributed to the awareness and rise of this hot topic (Nature, 2019). In recent decades microbiome research expanded, advanced by high-throughput sequencing and multi-omics technologies, sophisticated in vitro models and the development of bioinformatics and statistics tool enabling big data processing. Today, it is well acknowledged that the gut and particularly the colon is by far the highest populated human surface. The gut microbiota is essential to the host health by fermenting undigested food components, thereby producing health-promoting metabolites and energy, by lending colonization resistance against opportunistic pathogens and by constantly interacting with the human immune system (Wang et al., 2017). The existing body of research focused mainly on relative differences, while a recent study by Vandeputte et al. (2017) reported absolute abundances could be the missing piece in microbial research, as it revealed differences between faecal samples which were not detected on a relative basis. Moreover, the influence of the transit time on the gut microbiota composition and load was suggested.
Studies of the gut microbiota are often conducted through animal experiments, on faecal samples or using in vitro models. In vitro models are appealing alternatives to perform mechanistic studies, prior to physiologic studies in vivo. Besides, they are compliant with the European three R principle in animal studies, which implies that where possible, animal studies should be Replaced, Reduced and Refined (Directive 2010/63/EU). The Simulator of the Human Intestinal Microbial Ecosystem (SHIME) developed at Ghent University and commercialised by the spin-off company ProDigest (Zwijnaarde, Belgium), mimics the gastrointestinal system with a focus on the colon microbiome and enables research into microbiome composition and dynamics.
So, what if Roald Dahl included a second paragraph questioning the effect of the transit on the microbiota load and composition. Maybe this would have triggered curiosity sooner, but thus far transit time was always considered as a fixed parameter in the SHIME model and is generally disregarded in gut microbiome research. Even though it might be a highly relevant driver of the human gut microbial ecology. This master dissertation tries to address this current knowledge gap using the SHIME system. The central research question of this dissertation revolves around how transit time affects the gut microbial ecology in terms of microbial load and community composition.
2
1 LITERATURE STUDY
This literature study provides a summary of the gastrointestinal tract its functionality and related microbiota. It zooms in on the microbial load and their drivers among which transit time. Finally, the SHIME, an in vitro model mimicking the gastrointestinal tract is described.
1.1
The gastrointestinal tract (GIT)
The digestive system: functional compartmentalisation along a longitudinal
axis
The digestive system is one of the most complex and diverse parts of the human body, breaking down, absorbing, or excreting the ingested food during the day. All of this is necessary to supply the human body with energy, nutrients and water. The digestive system can be divided in two parts, the gastrointestinal tract (GIT) and the accessory organs (Figure 1). The GIT is a continuous tube, which starts from the oral cavity and proceeds through the oesophagus, stomach, small intestine, large intestine (colon) and finally ends at the anus. Along its way, accessory organs are needed for the digestion, namely the tongue, salivary glands, pancreas, liver and gallbladder (Barrett et al., 2016). Transport through the GIT is obtained by peristaltic movements in a cephalic-to-caudal direction without the need of triggers. When food is present, additional segmentation occurs in the intestine. During segmentation, retrograde movements take place and provide mixing of the chyme which improves digestion and absorption. Unique to the colon, smooth muscles contract over a large area to move its content (Barrett et al., 2016).
Figure 1 Organs of the gastrointestinal tract, area specific pH’s and produced digestive excretions. 1(Aframian et al., 2006); 2(Hillman et al., 2017); 3(Fallingborg et al., 2007); 4(Roussel, 2019); 5(Sams et al., 2016); 6(Van de Wiele et al., 2015)
3
The digestion of food starts in the mouth, where salivary glands produce saliva, containing enzymes like amylase and lipase (Figure 1). Salivary α-amylase catalyses the breakdown of starch into smaller carbohydrate molecules, such as maltose and dextrin. Salivary lipase initiates the breakdown of fat, which is continued by gastric and pancreatic lipase further down the GIT. Saliva is buffered at pH 7 ensuring the activity of α-amylase, which has a pH range between 6.0 and 7.0. The activity of α -amylase is therefore not continued in the acidic stomach. Salivary lipase on the other hand has an optimum pH of 4-5.4, displaying a lower activity in the mouth but remaining active in the gastric environment (Figure 1) (Sams et al., 2016; Kupirovič et al., 2017; Barrett et al., 2016).
After swallowing, which is mediated by the pharynx, the food bolus is propelled down the oesophagus by peristaltic movements and enters the stomach through the oesophageal sphincter. The stomach stores, grinds and mixes the food by muscular action of the stomach wall. Furthermore, the digestion continues through the addition of HCl, proteases (e.g. pepsinogen) and gastric lipase (Barrett et al., 2016). The stomach pH is less acidic after food ingestion (5-7) and gradually decreases to 2 through HCl addition (Sams et al., 2016). The acidic pH is required to sterilize the gastric environment, to initiate the hydrolysis of dietary macromolecules and to convert pepsinogen into active pepsin. Pepsin hydrolyses peptide bonds at an optimum pH of 1.6 to 3.2. Due to a higher pH in the following GIT parts, pepsin activity is restricted to the stomach. Gastric mucus, bicarbonate and trefoil peptides (stabilization of mucus-bicarbonate layer) are secreted by the surface epithelial cells to prevent self-digestion of the stomach.
The now liquidised food, called chyme, continues its way to the small intestine, where most of the digestion and nutrient absorption takes place. The small intestine can be divided into three parts, the duodenum, jejunum and ileum, in consecutive order (Barrett et al., 2016). In the duodenum, food is further degraded through the secretions of intestinal glands and the pancreas, liver and gallbladder (Barrett et al., 2016). The pancreas secretes pancreatic juice in the duodenum, including a variety of proenzymes, such as trypsinogen. The cells of the intestinal glands, also known as Paneth cells in the crypts of Lieberkühn, excrete intestinal juice. This juice contains enteropeptidase, which converts trypsinogen into active trypsin, which in turn activates other proenzymes in the pancreatic juice. These activated enzymes break down proteins into amino acids, fats into fatty acids and glycerol and carbohydrates into glucose. Both intestinal and pancreatic juice are alkaline to neutralize the acidic gastric juice (Barrett et al., 2016). The decomposition continues in the jejunum and ileum, accompanied by additional absorption of nutrients into the bloodstream.
Meanwhile, the liver produces bile, purifies blood and recovers nutrients derived from the GIT. More specifically, the liver removes and transforms toxins (e.g. ammonia to urea), takes part in the carbohydrate and lipid metabolism, forms most of the plasma proteins and stores excess energy as glycogen. The produced bile is stored in the gallbladder prior to the release in the duodenum (Barrett et al., 2016). The most important components of bile are the bile acids, responsible for dissolving fats to facilitate breakdown. 90 to 95% of the bile acids are absorbed in the small intestine, transported to the liver and re-excreted in the bile (enterohepatic circulation) (Barrett et al., 2016). The non-reabsorbed bile acids modulate the gut microbiota and are metabolised by some into secondary bile acids (Ge et al., 2017; Ridlon et al., 2014; Hylemon et al., 2018).
4
Finally, the chyme, deprived of easily digestible nutrients, arrives in the colon. The colon can be divided into the cecum and appendix, the ascending colon, the transverse colon, the descending colon, the sigmoid colon and the rectum (Barrett et al., 2016). The main function of the colon is the absorption of minerals and remaining water (derived from ingestion and endogenous secretions) and the further fermentation of undigested food components by the gut microbiota (Section 1.1.3). Solid stool, produced at the end of the colon, is stored in the sigmoid colon and emptied into the rectum. The rectum subsequently sends a signal to the brain for defecation (Barrett et al., 2016).
The gastro-intestinal wall: tissue structure variation along a transverse axis
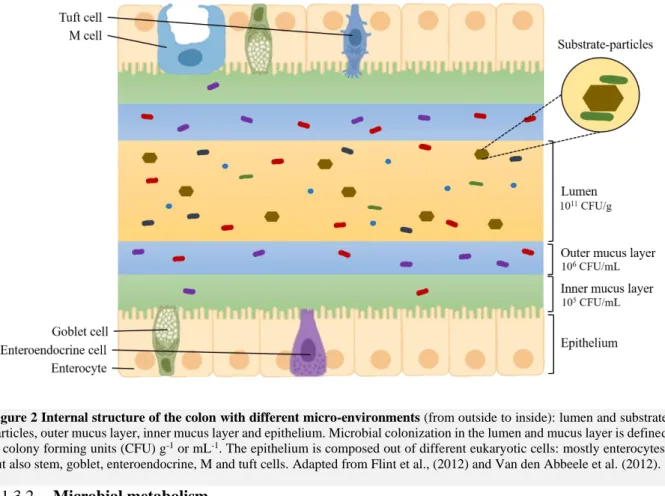
The colon contains different microenvironments as a consequence of a variation in physiological conditions, occurring along a longitudinal (pH, retention time and nutrient availability) and transverse (lumen, mucus, food particles) axis (Van den Abbeele et al., 2011; De Weirdt and Van de Wiele, 2015). As the experimental set-up of this master dissertation only simulates the luminal environment, no extensive description of the mucus layer nor food particles is provided. In short, the mucus layer is composed out of two layers, a firmly attached inner layer and a more loose, easier penetrable, outer layer (Atuma et al., 2001; Johansson et al., 2013). The food particles in the lumen serve as a distinct niche (De Paepe et al., 2017). It is important to recognize the distinction between mucus, lumen and food particles colonization. Section 1.1.3.1 briefly describes general microbial differences.
Microbiota in the GIT
The gut microbiota lives in symbiosis with the human body and is of great importance to the host’s health. It contributes to further fermentation of undigested food components, produces useful metabolites, protects the host against opportunistic pathogens and constantly interacts with the immune system ( Wang et al., 2017). Yet, the microbiota can also be related to disease such as inflammatory bowel diseases (IBD) (Ni et al., 2017), depression (Valles-Colomer et al., 2019), Clostridium difficile infections (Britton and Young, 2014) and cancer (Helmink et al., 2019).
First, to avoid confusion, a distinction between microbiota and microbiome is given as the terms are commonly (mis-)used as synonyms of each other. Microbiota is the group of microorganisms present in a certain habitat, while the term microbiome describes the entire environment, consisting of the microorganisms, their genomes and the environmental parameters (Marchesi and Ravel, 2015). For example, the gut microbiota are the microorganisms present in the gut environment, while the gut microbiome refers to the gut microbiota, their genomes and the gastrointestinal conditions.
The human gut microbiota differs among all humans and can be seen as a unique microbial fingerprint. The microbiota is composed of bacteria, eukaryotes, archaea and viruses and changes in terms of composition and quantity along the GIT (Hillman et al., 2017). The composition is generally determined by DNA based methods, such as next generation 16S rRNA gene sequencing or whole genome shotgun sequencing (Valdes et al., 2018). Variation of the gut microbiota has been linked to, amongst others, diet (Wu et al., 2011), age (Hollister et al., 2015), delivery mode (Dominguez-Bello et al., 2010), gender (Martin et al., 2016), race (Chen et al., 2016), lifestyle (Valle Gottlieb et al., 2018), antibiotic use (Marzorati et al., 2017), hygiene (Bach, 2018; Schmidt et al., 2011), geographical location (Suzuki and Worobey, 2014), genetics (Goodrich et al., 2016) and numerous diseases (Wang et al, 2017).
5
Even though interindividual differences exist, the human gut microbiota is dominated by five bacterial phyla: Bacteroidetes, Firmicutes, Actinobacteria, Proteobacteria and Verrucomicrobia and one Archaea: Euryarchaeota (Bäckhed and Tremaroli, 2012). Within these dominating phyla, Firmicutes and Bacteroidetes jointly comprise more than 90%, with a ratio altering between individuals (Bäckhed and Tremaroli, 2012). Remaining phyla are Cyanobacteria, Fusobacteria, Spirochaetes, Tenericutes,
Lentisphaerae and Saccharibacteria (Bäckhed and Tremaroli, 2012; Hillman et al., 2017).
Large scale studies, such as Flemish Gut Flora Project (FGFP) and the Human Microbiome Project (HMP) attempted to define a core human gut microbiome (Turnbaugh et al., 2007; Falony et al., 2016). However, besides the inter-individual variations, a study assessing intra-individual variations concluded that an individual’s microbiota changes across time, only maintaining about 10% of the species, which complicated characterization of the core microbiome (Caporaso et al., 2011). Even without a (yet) defined core healthy human gut microbiome, a healthy gut microbiome is often referred to as one with a high diversity and richness. The idea behind this is that a diverse microbiome permits an easier substitution of a lost species by a functionally related species (functional redundancy) (Sommer et al., 2017). The healthy gut microbiome undergoes minor fluctuations but maintains a dynamic equilibrium. When the equilibrium is not maintained the gut microbiome comes in a state of ‘dysbiosis’ (Sommer et al., 2017).
Besides bacteria, also archaea, eukaryotes (yeast and fungi), viruses and phages play an important role in the microorganism-host-interaction (Cani, 2018). The most common archaea genus in the GIT is
Methanobrevibacter, which produces methane (methanogenesis). About two out of three adults harbour
methane producers in their colon (Hillman et al., 2017; Sahakian et al., 2010). The fungal community is unstable, but the most prevalent genera are Saccharomyces, Candida and Cladosporium (Hillman et al., 2017). The viral communities are mainly bacteria-infecting phage families (±90%), modulating bacterial communities and less commonly eukaryotic viruses (±10%), interacting with host cells (Arnold et al., 2016; Hillman et al., 2017).
1.1.3.1 Luminal versus mucosal microbiota
The lumen, mucus and food particles are associated with different microbial numbers and composition (Figure 2). A lower colonisation occurs in the mucus than in the lumen, with 105 and 106 CFU mL-1 in
the inner and outer mucus layer, respectively, compared to 1011 CFU g-1 in the lumen (Van den Abbeele
et al., 2011). As mucosal bacteria are closer to the epithelium they have a higher potential to interact with the host (Van den Abbeele et al., 2011). The outer mucus layers can act as a nutritional source to bacteria, in times of low carbohydrate intake or even serve as an exclusive food source for species such as Akkermansia muciniphila (Ouwerkerk et al., 2013; Johansson et al., 2013). Colonic biopsies demonstrated a higher presence of Actinobacteria and Proteobacteria in the mucus compared to the lumen (Albenberg et al., 2014). In vitro studies showed an enrichment of Firmicutes in the mucus layer, more particular Clostridium cluster XIVa, while the lumen harbours a higher abundance of
Bacteroidetes (Etienne-Mesmin et al., 2019; Van den Abbeele et al., 2013). The luminal microbiota is
more diverse and moreover different from the substrate-particle-associated microbiota (De Paepe et al., 2017).
6 1.1.3.2 Microbial metabolism
In the colon, microbial fermentation of indigestible fibres (e.g. plant cell-wall polysaccharides, oligosaccharides and resistant starches) results in energy for microbial growth and metabolites such as short chain fatty acids (SCFAs), gases, lactate and ammonium (Flint et al., 2012).
Short chain fatty acids
SCFAs are important colonic fermentation products associated with host health. The main SCFAs, produced by carbohydrate fermentation, are acetic , propionic and butyric acid (Den Besten et al., 2013). Branched SCFAs, such as isobutyric and isovaleric acid, indicate the occurrence of amino-acid metabolization of branched amino-acids such as valine, leucine and isoleucine (Macfarlane et al., 1992). The fatty acids are mostly present in anionic form since dissociation occurs above a pH ~4.8 (Bergman, 1990). The SCFA production depends on different factors, such as diet and the microbial community composition.
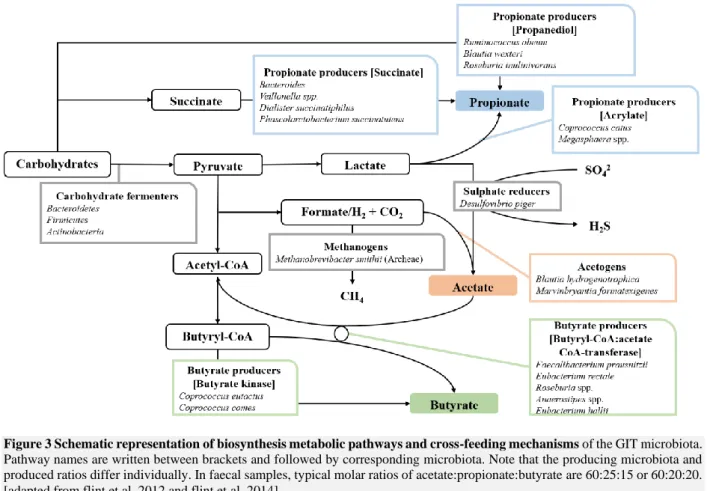
Microbial fermentation to acetate, propionate and butyrate is mediated by different pathways (Figure 3). Acetate is produced by reduction of CO2 (homoacetogenesis) or an organic acid using an electron donor,
such as formate or H2 (Gibson et al., 1990; Flint et al., 2012). Propionate is mostly produced by either
the acrylate, succinate or propanediol pathway (Figure 3) (Flint et al., 2015). Next, butyrate can be produced by the butyrate kinase or butyryl-CoA:acetate CoA-transferase pathway (Figure 3). The butyrate kinase pathway demands acetate which is often produced by other species. This interspecies exchanges of acetate demonstrates the importance of cross-feeding, a process where metabolites produced by one species are used as substrate by other species (Flint et al., 2012; Pham et al., 2017).
Figure 2 Internal structure of the colon with different micro-environments (from outside to inside): lumen and substrate
particles, outer mucus layer, inner mucus layer and epithelium. Microbial colonization in the lumen and mucus layer is defined in colony forming units (CFU) g-1 or mL-1. The epithelium is composed out of different eukaryotic cells: mostly enterocytes,
7
Absolute SCFA concentrations have been studied in animals and humans. In pigs, animals of which the GIT is most resembling to humans (Bergman, 1990), the total SCFA concentration in the proximal colon is higher than in the distal colon, about 70-140 mM and 20-70 mM respectively (Topping and Clifton, 2001; Bergman, 1990). This finding is later confirmed in humans (post-mortem), with a mean of 142mM in the proximal colon and 96mM in the distal colon (Macfarlane et al., 1992). However, the abundance of branched SCFAs increases from proximal to distal colon, from about 3.4% to 7.5%, respectively, due to a higher proteolytic metabolism (Macfarlane et al., 1992). Normally, carbohydrate fermentation is preferred over protein fermentation given its higher yield. Yet, the further down the colon, carbohydrates are depleted and more proteolytic metabolization will occur (Vieira-Silva et al., 2016). As the colon is not easily sampled, human SCFA measurements are performed via different techniques. Faecal samples are deprived of 95% SCFA by absorption in the colon with a comparable colonic uptake for acetate, propionate and butyrate (Ruppin et al., 1980; Barrett et al., 2016). This results in similar relative ratios in the faeces and colon but giving only little information about the absolute colonic quantity. Typical molar ratios of acetate:propionate:butyrate in faecal samples are 60:25:15 or 60:20:20 (Nicholson et al., 2012; Wong et al., 2006; Barrett et al., 2016) and typical total faecal SCFA concentrations are 75µmol/g (Høverstad, 1986). Alternatively, SCFA production can be analysed via stable isotope technology, in which stable isotope labelled substrates are ingested and metabolites are measured in blood , urine and exhaled breath (Boets et al., 2017; Topping and Clifton, 2001).
Absorbed SCFAs serve as an energy source for the colonic epithelium and peripheral tissues with an energy provision of about 10% of the daily requirements (Bäckhed and Tremaroli, 2012; Bergman, 1990). However, the energy yield is dependent on fermentation efficiencies and of SCFA absorption. Proof of energy harvesting by the microbiota is provided in germ free mice studies, in which germ free mice have lower intestinal SCFA production and higher caloric excretion (Wostmann et al., 1983). Butyrate, often linked to health promotion, plays a role in immune system regulation and inflammatory responses (Macfarlane and Macfarlane, 2012), maintains the gut-barrier function through regulation of tight junction proteins (Zheng et al., 2017), mucin secretion (Jung et al., 2015) and stabilisation of transcription factors (Kelly et al., 2015), modulates intestinal motility (Fukumoto et al., 2003) and satiety (Yadav et al., 2013) and has been linked to colon cancer prevention (Lupton, 2004; Morrison and Preston, 2016). Furthermore, acetate and propionate also play a role in immune system regulation, food intake by leptin stimulation and colonic motility (Macfarlane and Macfarlane, 2012). Acetate can be converted in the liver to cholesterol and fatty acids (Hosseini et al., 2011). Propionate takes part in the gluconeogenesis of the liver and lowering of cholesterol-levels and lipogenesis (Hosseini et al., 2011; Nicholson et al., 2012).
8
Gas
Colonic fermentation also results in the production of gases, more particularly in carbon dioxide (CO2),
hydrogen (H2), hydrogen sulphide (H2S) and methane (CH4) (Figure 3) (Barrett et al., 2016). Daily gas
production is around 500-1500 mL and roughly 200 mL is normally present in the GIT. These gases leave the body as flatus, of which most of the smell is due to sulphides (Barrett et al., 2016). Flatus consists of about 59% N2, 20.9% H2, 9% CO2, 7.2% CH4, 3.9% O2 and 0.00028% H2S (Kirk, 1949;
Sahakian et al., 2010).
H2 and CH4 are exclusively made through microbial fermentation (Figure 3), while CO2 and H2S are
also produced by human metabolization (Sahakian et al., 2010). CO2 and H2 are produced as by-products
of carbohydrate fermentation. H2 is, in turn, used as an electron donor for homoacetogenesis, sulphate
reduction and methanogenesis (Wolf et al., 2016). The high demand for H2, results in competition
between the pathways, controlled by pH and thermodynamics. Regarding thermodynamics, sulphate reduction (-152.2kJ/mol HS-) is the most favourable, followed by methanogenesis (-130kJ/mol CH
4)
and homoacetogenesis (-95kJ/mol acetate) (Thauer et al., 1977; Sahakian et al., 2010). In relation to the pH, acetogenesis, methanogenesis and sulphate reduction occur at an acidic, neutral and alkaline pH, respectively (Gibson et al., 1990). Therefore, methanogenesis and sulphate reduction mostly occur in the distal colon.
Not each colonic microbiota produces H2S and CH4. H2S is formed in the colon by sulphate-reducing
bacteria and is controlled by the presence of dietary sulphur, sulphate and electron donors, such as H2
(O’keefe, 2008; Gibson et al., 1990). Only two-thirds of the human population contain CH4 producers,
of which Methanobrevibacter smithii is most prevalent (Hillman et al., 2017; Sahakian et al., 2010). During methanogenesis, simple carbohydrates, or CO2, are reduced to CH4 and H2O by using H2 as an
electron donor (Abell et al., 2006). The presence of H2S is dubious as it is associated to disease such as
colorectal cancer and ulcerative colitis but on the on the other hand takes part as signal molecule in important physiological processes (Attene-Ramos et al., 2007; Gibson et al., 1988; Masi and Ascenzi, 2013).CH4 production has been linked to irritable bowel syndrome (Kim et al., 2012), diverticulosis
(Jang et al., 2010) and colon cancer (Haines et al., 1977).
Lactate
Lactate is used by cross-feeding and converted into propionate, butyrate and acetate & sulphate, mediated by members of Veillonellaceae (e.g. Megasphaera spp.), respectively, by certain Firmicutes species, such as Eubacterium hallii and Anaerostipes caccae and respectively by Desulfovibrio piger (Sylvia H Duncan et al., 2004; Flint et al., 2012). (Figure 3). A balance between lactate-producing bacteria and lactate-utilizing bacteria is needed to avoid lactate accumulation. Elevated lactate concentrations (>5mM) have been reported after a gut resection and in individuals with ulcerative colitis (Mayeur et al., 2016; Pham et al., 2017; Sylvia H Duncan et al., 2004) and are indicative of a dysbiotic community, possibly due to the restriction of lactate-utilizing bacteria at reduced pH (Flint et al., 2012). The accumulation of lactate can lead to acidosis, neurotoxicity and cardiac arrhythmia (Vella and Farrugia, 1998; Chan et al., 1994; Pham et al., 2017).
9
Figure 3 Schematic representation of biosynthesis metabolic pathways and cross-feeding mechanisms of the GIT microbiota.
Pathway names are written between brackets and followed by corresponding microbiota. Note that the producing microbiota and produced ratios differ individually. In faecal samples, typical molar ratios of acetate:propionate:butyrate are 60:25:15 or 60:20:20. [adapted from flint et al, 2012 and flint et al, 2014]
Ammonia
In the colon, ammonia (NH3) (pKa = 9.25) is mainly produced by fermentation of proteins (proteolysis)
and amino acids. Although most proteins and amino acids are digested and/or absorbed in the small intestine, up to 12g arrives in the colon (Mouillé et al., 2004). The main proteolytic bacteria are
Clostridium spp. and Bacteroides spp. (Mafra et al., 2013). Most proteolytic activity occurs in the distal
colon and increases the pH to about 6.6-6.9 (Vieira-Silva et al., 2016; Mafra et al., 2013). Most of the NH3 is absorbed in the colon, converted to urea in the liver and excreted through urine (Mafra et al.,
2013). In human faecal samples, values of 3-44mM NH3 have been found, with an increase related to a
higher protein ingestion (Cummings et al., 1979; Geypens et al., 1997; Mouillé et al., 2004). Ammonia is a toxic component at high levels and the accumulation of NH3 by liver failure, can lead to
10
1.2
Microbial load
The microbiota’s quantity, also known as microbial load, in the gut differs along the GIT and among individuals. The microbial load is relevant since it defines the intensity of the immunological responses, the extent of the metabolite production and the overall host-microbiota interactions (Vandeputte et al., 2017).
The human body hosts a high number of bacteria (4.0 x 10¹³ cells), which is estimated to be equivalent
to the number of human cells (3.0 x 10¹³ cells). The different conditions along the human body shape
the load and taxonomical composition of the microbiome (Sender et al., 2016). Along the GIT, the lowest amount of bacteria, 103 - 104 bacteria mL-1 are found in the stomach, duodenum and jejunum due
to a low pH and fast transit (Sender et al., 2016). A higher number is found in the ileum, harbouring 108
bacteria mL-1. The highest number, 1011 bacteria mL-1, and biodiversity (richness and evenness) of
bacteria is found in the colon, thanks to a low redox potential, low cell turnover rate and a relative longer transit time (Hillman et al., 2017)
.
In fact, the colon harbours the highest microbial load of all body sites, outnumbering the second highest bacterial load, dental plaque, 100 times. Therefore, the estimation of bacteria present in and on the total adult body is based on the abundance in the colon and is used as an indication of host health (Sender et al., 2016).Quantitative microbiome profiling (QMP)
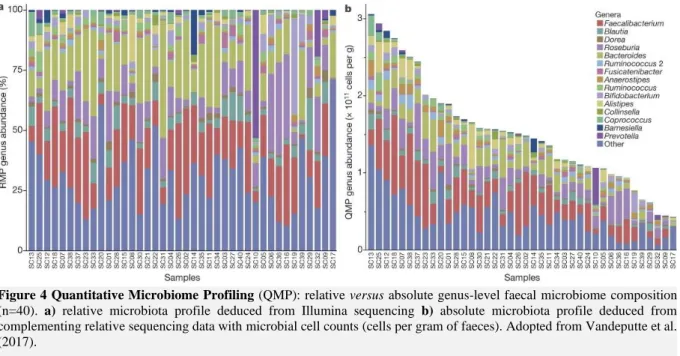
Early gut microbiota research was based on plate counting and later replaced by sequencing, which eliminates cultivation dependency, and next generation sequencing (NGS), which presents a more cost-effective method than sequencing (Tang, 2019). In addition, these substitutions mediated a shift from absolute to relative microbial data. However, relative fluctuations in the microbial composition do not always reflect changes in absolute abundances (Figure 4) (Vandeputte et al., 2017). Recently, the combination of high throughput flow cytometry with standard sequencing techniques re-established the absolute quantification of the human gut microbiome, known as quantitative microbiome profiling (QMP) (Props et al., 2016; Vandeputte et al., 2017) Moreover viability staining procedures allow a flow cytometry based characterization of the intact and damaged biomass fraction (Props et al., 2017). The overall microbial abundance could be an indicator of health. Vandeputte et al. (2017) observed an up to tenfold variation in faecal microbial cell counts between individuals, varying between 4.3 x 10¹⁰
and 3.1 x 10¹¹ cell counts per gram, with a median of 1.5 x 10¹¹ cell counts per gram (Figure 4). They
showed that the relative decrease of Bacteroides in individuals with Crohn’s disease (CD) compared to healthy controls, is not detected in an absolute approach, and that the absolute decrease of Prevotella was not detected in a relative approach (Vandeputte et al., 2017). In addition, they found a negative correlation between total cell counts and CD. So, although relative abundances are able to indicate microbial variation in some diseases, QMP is a powerful tool to gain a better insight in the microbial community dynamics and microbe-host interactions.
11
Determinants of the gut microbial load
The human microbiome is unique for every individual and the drivers behind inter-individual differences are of great interest. The drivers defining differences in relative compositions have been extensively studied, while studies on the drivers of the absolute numbers are less numerous. The existing body of quantitative data is based on quantitative PCR (qPCR) copy number, flowcytometric cell counts or plate counts and will be referred to as such. Alterations in gut microbial load are linked with diet, antibiotics, disease, gender, pregnancy and lifestyle.
The diet is generally recognized to have a dominant effect on the gut microbiota in terms of composition and functionality (Marzorati et al., 2017; Wu et al., 2011). In particular, the diet has been linked to three human gut enterotypes that are dominated by Bacteroides (B-enterotype), Prevotella (P-enterotype) and
Ruminococcus (R-enterotype) respectively (Arumugam et al., 2011; Bäckhed and Tremaroli, 2012). The
B-enterotype is associated with a standard Western diet rich in protein and animal fat and the P-enterotype is linked to a diet rich in carbohydrates, typical for rural populations (Wu et al., 2011; Bäckhed and Tremaroli, 2012). Recently, Vandeputte et al (2017) observed an association between the gut enterotypes and faecal microbial flowcytometric cell counts. The B-enterotype was divided into two clusters, B1 and B2, of which B2 was associated with lower flow cytometric counts compared to the R-, P- and B2-enterotype. Another study found that the supplementation of prebiotic foodsR-, i.e. by the host nondigestible food ingredients, in children (3-6 years) increases the relative abundance of Bifidobacteria but did not induce a change in total qPCR copy number compared to a placebo group. (Soldi et al., 2019). An absolute increase of bifidobacterial flow cytometric cell counts was, however, found in infants (1-2 years) on a prebiotic treatment compared to a non-prebiotic control group by Brunser et al., 2006. In addition, the consumption of yoghurt, a product fermented by bacterial strains, is positively associated with Lactobacillus and Staphylococcus qPCR copy number and negatively correlates to
Enterobacteriaceae qPCR copy number, without a change in total microbial qPCR copy number (Suzuki
et al., 2017).
Figure 4 Quantitative Microbiome Profiling (QMP): relative versus absolute genus-level faecal microbiome composition
(n=40). a) relative microbiota profile deduced from Illumina sequencing b) absolute microbiota profile deduced from complementing relative sequencing data with microbial cell counts (cells per gram of faeces). Adopted from Vandeputte et al. (2017).
12
Furthermore, antibiotics are found to induce changes. In infants (1-2 years), an antibiotic treatment with amoxicillin, decreased the total faecal bacterial flow cytometric cell count compared to before treatment, but did not alter Bifidobacterium and Bacteroides flow cytometric cell counts (Brunser et al., 2006). While, in elderly the use of antibiotics showed no significant decrease of microbial qPCR copy number. However, an absolute decrease in Bifidobacterium, Desulfovibrio, Faecalibacterium prausnitzii,
Clostridium clostridiiforme, Clostridium butyricum and Ruminococcus albus was reported (Bartosch et
al., 2004).
Disease also plays a role in gut microbial cell load. In CD patients the total faecal flowcytometric cell counts were found to be three times lower compared to healthy controls. Moreover, an absolute decrease of Prevotella was noticed in CD (Zhou and Zhi, 2016; Vandeputte et al., 2017). Related to this, Sokol et al. (2009) reported a lower absolute abundance of Firmicutes in patients with active IBD and infectious colitis. Besides, load is suggested to be involved in the aetiology of obesity as the qPCR copy number of Bifidobacterium in faecal samples during infancy are lower in overweight children than in normal weight children (Kalliomäki et al., 2008). Additionally, gender, pregnancy and lifestyle are reported to also have an influence. Females have significantly higher faecal qPCR copy numbers than male subjects (Suzuki et al., 2017). During a pregnancy, the microbial load increases from the first to the third semester (Collado et al., 2008). Hospitalisation of elder people leads to a decreased qPCR copy number compared to the non-hospitalised elders (Bartosch et al., 2004).
Finally, it is important for microbiome studies to consider the time-variability. Vandeputte et al (2017) reported intra-individual daily variations between 1.1 x 10⁸ and 1.1 x 10¹¹ cell counts per gram stool. In
addition, transit time, the time food takes to enter and leave the body, and stool consistency should be regarded since it could explain 4.3% of the inter-individual microbial load variation (Vandeputte et al., 2017). Therefore, transit time could be an important influencing factor on the microbial load.
13
1.3
The influence of transit time on the gut microbiota
During the process of digestion, absorption and excretion, the food bolus moves in different velocities along the GIT. This transit time can, besides total transit time, also be specified per organ of the GIT, for example gastric transit time or total colonic transit time (CTT). Not only GI organs have different transit times, but the transit time also relies on interindividual differences, food composition and other determinants outlined below.
Methods to determine transit time
The GIT is a continuous tube with only two openings and no windows, pointing out that measuring the transit time is not an easy task. Consequently, transit time determination of a designated part of the GIT needs good, and preferably non-invasive techniques. Four often used non-invasive methods to study absolute colonic transit times are radiopaque markers, scintigraphy, breath measurement and wireless motility capsules (Deroover et al., 2017; Southwell et al., 2009; Szarka & Camilleri, 2012; Wang et al., 2015).
To start, the ingestion of different radiopaque markers over multiple days accompanied with abdominal X-ray scans provides information about the total transit. The total and segmental transit times are calculated based on the amount of markers still present in the body (Abrahamsson et al., 1988). Advantages of this method are the low cost, the availability, and the standardization of the test. Disadvantages are the positioning of the markers relative to bony landmarks. This use of the skeleton as a reference point may prohibit the absolute positioning of the colon (Szarka and Camilleri, 2012). Nonetheless, radiopaque markers are the standard for clinical studies about colonic transit times. During a scintigraphy, radioisotopes are digested, on which multiple scans by gamma cameras are taken. Dependent on the method, detailed information about the passage through the stomach, small intestine and colon can be given (Southwell et al., 2009). Nonetheless, comparisons between different studies are difficult, due to differences in techniques (Southwell et al., 2009). An advantage is the well-validation of the test in different studies. Compared to radiopaque markers, the reliability of scintigraphy is higher. However, the low availability of gamma detectors, higher radiation exposure and higher costs makes it less attractive than radiopaque markers (Farmer et al., 2013; Szarka and Camilleri, 2012). An alternative method to determine the transit of ingested heavy isotopes is the CO2 measurement in breath and blood
samples (13C and 14C). The test meal contains fibres spiked with 13C and 14C, when these arrive in the
colon, heavy isotope concentrations will rise (Deroover et al., 2017).
Wireless motility capsules are ingestible telemetric devices that send real-time data to an external receiver. The data provides information on the total and segmental transit time, temperature and pH. Advantages are the non-exposure to radiation and the well-validation of the method. The higher cost and requirement for standardisation of protocols can be seen as a drawback (Szarka & Camilleri, 2012; Wang et al., 2015).
14
Next to these absolute colonic transit time determination methods, the Bristol Stool Scale (BSS) can be easily used to determine relative transit times without the need for high-end devices (Figure 5) (Lewis and Heaton, 1997b; Vazquez-Roque et al., 2013). The BSS is a 7-point scale which categorises the form of stool as a guide for total gut transit time and detection of altered transit times. The form is visually observable and acts as a proxy for consistency, which is in turn related to water content. A higher water content can be seen as a result of a faster transit with a lower colonic water absorption. Type 1 and 2 refer to hard stool and slow transit times, 3 to 5 to a normal consistency and 6 and 7 to loose stool and faster transit times (Figure 5). The BSS method has been demonstrated to be valid and reliable, although difficulties in visually categorising the stool consistency remains (Blake et al., 2016). To solve this, a training in differentiating changes in BSS (e.g. 5-point scale) could be implemented.
Determinants of transit time
The transit differs throughout the GIT, with the three most important compartments being the stomach, small intestine and colon. Gastric emptying is finished within 2 to 5 hours after food digestion, followed by a 3 to 6 hours passage through the small intestine and finally the transport through the colon, which is usually the longest. The colonic transit time (CTT) can be differentiated for the ascending, transverse and descending colon. The interindividual differences between CTTs give a broad range from 15 to 90 hours, and a mean value of about 26 to 34 hours (Appendix A, Table A. 1). These differences can depend on gender (Meier et al., 1995; Southwell et al., 2009), diet (Kelsay et al., 1978), age (Graff et al., 2001; Southwell et al., 2009), lifestyle, smoking habits (Meier et al., 1995) and disease.
To start, Madsen (1992) observed a slower colonic transit in women compared to men, which is in accordance with most studies (Cho et al., 2013; Meier et al., 1995; Sadik et al., 2003; Wang et al., 2015). In addition, for women, the hormones of the menstrual cycle can alter the rectosigmoid transit time. Meier et al. (1995) observed a faster rectosigmoid transit during the follicular phase of the menses (prior ovulation) compared to the luteal phase (after ovulation). Another transit effector is the diet, with fibre as the most important contributor. A diet rich in fibres, derived from either wheat, fruit or vegetables, accelerates the total transit (Kelsay et al., 1978). Furthermore, ageing seems to slow down the colonic transit in middle-aged women according to Graff et al. (2001). However the influence of age is not consistent (Meier et al., 1995). Similarly, the influence of smoking is ambiguous. According to Meier et al. (1995) smoking prolongs the CTT, while Sadik et al. (2003) found no significant effect of smoking. Besides, physical activity is shown to accelerate the transit (Oettle and Oettle, 1991).
Figure 5 Representation of the Bristol Stool Scale, with an increasing type number being correlated with a decreasing transit
15
An altered transit time can also indicate disease, for example Parkinson’s disease is linked to a delayed CTT, while hyperthyroidism is associated with an accelerated CTT (Stocchi and Torti, 2017; Wegener et al., 1992). In irritable bowel syndrome (IBS), a change in transit time is one of the diagnostic criteria, with a delay in IBS-C (i.e. constipation) and an acceleration in IBS-D (i.e. diarrhoea) (Van Oudenhove et al., 2012). In addition, psychological stress accelerates the CTT (Mönnikes et al., 2001). Finally, the transit not only varies between individuals but also within one individual, driven by diet (e.g. fibre, alcohol, coffee), physical activity and psychological factors and is important to recognize all these confounding factors (Degen and Phillips, 1996).
Transit time and microbiota
Besides the described transit drivers in Section 1.3.2, the gut microbiota is shown to modulate gastrointestinal motility. In rodent studies, a faecal microbial transplant from a constipated animal resulted in a slowdown of the transit (Ge et al., 2017). A possible mechanism involves propionate and butyrate playing a role in serotonin production in the GIT which regulates, among other functions, GI motility (Yano et al., 2015).
Reversely, the colonic transit also affects the microbiota by influencing gut physiology. The transit through the colon regulates the water absorption, nutrient availability, bacterial growth, bacterial metabolism and pH of the distal colon in addition to posing a wash-out stress (Lewis and Heaton, 1996; Stephen et al., 1987). Both Vandeputte et al. (2016) and Tigchelaar et al. (2016) studied the correlation between transit and microbial composition and load. Vandeputte et al., (2016) reported a positive correlation of the transit time, with species richness, determined by BSS. However, this was not reported by Tigchelaar et al. (2016) who used a larger and more diverse cohort (in terms of age). Vandeputte et al. (2016) correlated a higher faecal cell load with a longer transit. The transit time was associated to microbial compositional differentiation. Both Tigchelaar et al. (2016) and Vandeputte et al., (2016) showed an increase in Bacteroidetes to Firmicutes ratio and relative abundance of Methanobrevibacter with slower transit. Besides, Tigchelaar et al. (2016) described a correlation between fast transit and the relative abundance of Faecalibacterium prausnitzii (butyrate-producer) and the family
Lachnospiraceae. A slow transit was in turn correlated with Christensenellaceae and Dehalobacteriaceae. Vandeputte et al. (2016) linked the enterotypes to transit times. The P-enterotype,
linked to fibre rich diets, is more prevalent in looser stools (fast transit), while the RB-enterotype, linked to a diet rich in protein and animal fats, predominates in firmer stools (slow transit). Within the RB-enterotype, Akkermansia, Oxalobacter and Butyricimonas increased with a longer transit time. The latter elevates protein fermentation, by carbohydrate depletion (Falony et al., 2018) .
16
1.4
Simulating the gastrointestinal tract
The significance of in vitro gut models
To study the human gut microbiota in terms of composition, dynamics, metabolic potential, dietary response and to understand the mechanistical interplay, relevant models are necessary. Research of the human colonic microbiome is usually performed on faecal samples, since the colon and associated microbiome are difficult to access without invasive procedures. Yet it fails to distinguish the cross-sectional (mucus versus lumen) and longitudinal (proximal versus distal) heterogeneities. To resolve this, in vitro models were developed to mimic the in vivo environment.
Advantages of in vitro models include the ability to sample throughout different parts of the colon, at different time points, in order to follow up the different fermentation stages (De Paepe et al., 2020). Moreover, there are no ethical constraints and chemicals, toxins and pathogens can be evaluated ,in a standardized, reproducible manner (Venema and Van den Abbeele, 2013). On the other hand, the limitations of in vitro models should be recognized. Firstly, the in vitro models are a simplification of the reality. For example, in vitro models only simulate the liquidised state while in vivo different consistencies appear, altering the mixing ability. Next, there is limited knowledge to mimic the diseased physiology as most parameters are derived from healthy individuals (Venema and Van den Abbeele, 2013). Finally, conventional in vitro models lack the host feedback regulation, which is important for the host-microbe interaction. For these reasons, the results of in vitro models should be interpreted with care and tested as hypothesis in later in vivo studies.
A broad range of different models have been developed with the complexity varying from simple batch fermentations to multi-compartmental (semi-)continuous systems (Venema and Van den Abbeele, 2013). The more complex systems allow a more detailed view on the gut microbiome and its response, while simple models are easier, but often provide less accurate results by oversimplification or metabolite accumulation (Venema and Van den Abbeele, 2013). Five complex models which include the simulation of the colon are the MacFarlane/Gibson three-stage continuous culture system, EnteroMix, Lacroix model, TIM-2 and the Simulator of the Human Intestinal Microbial Ecosystem (SHIME®) (Venema and Van den Abbeele, 2013). The focus will lie on the SHIME, as it will be
extensively used during this dissertation.
The Simulator of the Human Intestinal Microbial Ecosystem (SHIME)
The SHIME®, Simulator of the Human Intestinal Microbial Ecosystem, is a validated in vitro model
which simulates the entire gastrointestinal tract. The SHIME set-up can be adjusted to the research question and conventionally consists of five double-jacketed vessels, mimicking the stomach, small intestine, ascending, transverse and descending colon, each with their own conditions (pH, available nutrients, microbial population) (Figure 6). The SHIME is often used to determine prebiotic digestibility and fermentation and probiotic and pathogen survival along the GIT (Van de Wiele et al., 2015).The SHIME focuses on the microbial ecosystem. An experiment typically runs over several weeks and consists of four periods. First, a stabilisation period of five to ten times the vessels residence time to stabilise the introduced faecal inoculum, derived from one donor (Van de Wiele et al., 2015). By using non-pooled faecal inocula, interindividual variability in microbial community composition and functionality can be studied (Van Duynhoven et al., 2011; Van de Wiele et al., 2015). The stabilisation period is followed by a basal period of about two weeks, where baseline conditions are maintained. Next, a treatment period of two to four weeks is applied.