THE IMPLICATIONS OF THE PARIS
CLIMATE AGREEMENT FOR THE
DUTCH CLIMATE POLICY
OBJECTIVES
Detlef P. van Vuuren, Pieter A. Boot, Jan Ros, Andries F. Hof
and Michel G.J. den Elzen
The implications of the Paris Climate Agreement for the Dutch climate policy objectives
© PBL Netherlands Environmental Assessment Agency The Hague, 2017
PBL publication number: 2894
Corresponding author
detlef.vanvuuren@pbl.nl
Authors
Detlef P. van Vuuren, Pieter A. Boot, Jan Ros, Andries F. Hof and Michel G.J. den Elzen.
Graphics
PBL Beeldredactie
Production coordination & English translation
PBL Publishers
This publication can be downloaded from: www.pbl.nl/en. Parts of this publication may be reproduced, providing the source is stated, in the form: Van Vuuren D.P. et al. (2017), The implications of the Paris Climate Agreement for the Dutch climate policy objectives. PBL Netherlands Environmental Assessment Agency, The Hague.
PBL Netherlands Environmental Assessment Agency is the national institute for strategic policy analysis in the fields of the environment, nature and spatial planning. We contribute to improving the quality of political and administrative decision-making by conducting outlook studies, analyses and evaluations in which an integrated approach is considered paramount. Policy relevance is the prime concern in all of our studies. We conduct solicited and
Contents
FINDINGS
4
1
INTRODUCTION
7
2
GLOBAL CARBON EMISSIONS BUDGET AND EMISSION
REDUCTION PATHWAYS
8
2.1 Global carbon emissions budget consistent with the Paris Climate Agreement 8 2.2 Emission pathways consistent with a carbon emissions budget based on Paris
targets 11
2.2.1
Achieving the Paris Climate Agreement targets of 1.5 °C and 2 °C requires rapid
emission reduction 11
2.2.2
Model-based scenarios 12
2.3 Effectiveness of proposed policy 14
3
CONSEQUENCES FOR THE EU AND THE NETHERLANDS
16
3.1 Possible targets for the EU and the Netherlands for 2030 and 2050, consistent with the
Paris Agreement 16
3.1.1
Distribution of emission reductions: cost-efficiency and fairness 16 3.1.2
Literature on EU emission reduction objectives, on the basis of cost-efficiency 17 3.1.3
Literature on EU emission reduction objectives, on the basis of fairness criteria 17 3.1.4
Illustrative calculations for the European Union and the Netherlands, on the basis of
new global emission targets 18
3.2 Emission reduction strategies in the Netherlands 23
3.2.1 Overall strategy 23
3.2.2 Far-reaching changes 24
3.2.3 Implementation in all areas needed to achieve target 24
Findings
Effective climate policy requires a long-term perspective. By ratifying the Paris Climate
Agreement, the Netherlands has committed to an ambitious climate policy, the
implementation of which can only be achieved through a substantial reduction in greenhouse gas emissions. The transformation of the energy system that this requires will take both time and a long-term policy perspective.
To translate the objectives of the Paris Climate Agreement into concrete targets for the Netherlands, climate knowledge needs to be combined with societal choices, on a national and EU level. The objective of the Paris Climate Agreement is to ensure that the
increase in global mean temperature stays well below 2 °C above pre-industrial levels, while aiming to limit warming to less than 1.5 °C. At the same time, international climate policy in the context of the agreement is based on national commitments, with each country being responsible for formulating and achieving its own targets. At the moment, however, the combination of national efforts will not be sufficient to achieve the overall global objective. Countries, therefore, are likely to evaluate each other’s efforts in the discussions on strengthening existing policies. Policies in the Netherlands need to be consistent with EU policies. Within this context, this report discusses the impact of scientific knowledge about the climate system and policy scenarios for the emission reduction commitment. This report presents calculations that give an indication of these conceivable targets.
The targets in the Paris Climate Agreement for keeping global temperature increases below 1.5 or 2 °C, according to the IPCC report, equalling maximum cumulative emission levels of 250–450 GtCO2 and 600–1250 GtCO2 (from 2015
onwards), respectively. Although recent studies suggest slightly higher figures, in all cases, budgets are so tight that stringent global climate policy will be needed. Such policy is far beyond that which is currently pursued by the countries involved in the agreement. The Paris Climate Agreement formulates the objective of international
climate policy as needing to be ‘consistent with holding the increase in the global average
temperature to well below 2 °C above pre-industrial levels and pursuing efforts to limit the temperature increase to 1.5 °C above pre-industrial levels.’ The IPCC report shows that,
from 2015 onwards, global maximum cumulative emissions of between 600 and 1250 GtCO2
would yield a likely chance (more than 66%) of remaining below 2 °C. A target of 1.5 °C would mean that emissions need to be limited to between 250 and 450 GtCO2. This
maximum in CO2 emissions is also referred to as the carbon emissions budget. In
comparison, under current global emission levels, a carbon emissions budget of 840 GtCO2
(central estimate for 2 °C) would be exhausted within 21 years, and for the 1.5 °C budget this would be within 5 to 10 years. The range in these budgets is caused by the uncertainty about the climate system. A recent study suggests that higher budgets (up to 700-800 GtCO2) could still be consistent with achieving a 1.5 °C target, based on a rescaling of IPCC
figures to observed temperature change and accounting for other uncertainties. In all cases, rapid emission reductions are needed.
Societal choices that play a crucial role in global CO2 reductions not only concern
the global temperature targets and the certainty with which those need to be achieved, but also the possible use of ‘negative emissions’. The carbon emissions
budget could be exceeded, temporarily, if this exceedance would be counterbalanced by ‘net negative emissions’ on a global scale. Net negative emissions could be achieved, for
instance, by large-scale reforestation, or through bio-energy combined with carbon capture and storage (BECCS). Most IPCC scenarios also include such negative emissions, varying between 0 and 350 GtCO2. A complexity is that, to some degree, the short-term reductions
are closely related to the assessment of the feasibility and attractiveness of such negative emissions. Negative emissions options could have serious impacts on other sustainability goals, and their possible availability in the future is uncertain.
The global objectives discussed above need to be translated into national targets. Important aspects here are principles of fairness and cost-effectiveness. Principles
of fairness are often categorised as equality, carrying capacity and responsibility. In combination with considerations of cost-effectiveness, these principles may be applied in order to determine whether a country’s contribution is consistent with global objectives, although there is no clear consensus on how to weigh these types of principles. The literature often considers a future situation (e.g. in 2050) of equal distribution of emissions per head of population.
CO2 emission reduction and energy transition are currently the main elements of
climate policy. In addition to CO2, there are various other greenhouse gases, such as
methane and nitrous oxide. It is wise to look at the various gases, as all of them contribute to climate change. However, CO2 plays a dominant role in the severity of climate change in
the long term, because of its long atmospheric lifetime as well as its large contribution to total emissions. CO2 emissions play an even larger role in the Netherlands, as they form 85%
of total greenhouse gas emissions(practically all of which from the energy system). The illustrative calculations in this report, therefore, focus on CO2.
Illustrative calculations in this report, based on so-called carbon budgets, show that, for both the EU and the Netherlands, achieving the 2 °C target with a likely (>66%) probability and assuming equal global emissions per head of population by 2050, would require a reduction in CO2 emissions of around 90% to 100% by 2050
(compared to 1990), among other things, depending on the reliance on long-term negative emissions. Achieving the 1.5 °C target (with a probability of around 50%) would require a reduction of more than 100% by 2050. This roughly means a complete
decarbonisation of the energy system by 2050. These numbers were derived by simple, illustrative calculations. Similar calculations can also be made using slightly different methods and assumptions (see next bullet). Here, we assumed an equal distribution of emissions per head of the global population in 2050, and three interpretations of the Paris Agreement’s climate objective: maximum temperature increase of 2 °C using negative emissions, 2 °C without using negative emissions, and 1.5 °C using negative emissions (cumulative global CO2 emissions from 2020 to 2050 vary between 550 and 950 GtCO2). The
calculations assume a linear emission reduction over time, and equal global emission per head of population, globally, by 2050.
For 2030, emission reductions for the Netherlands would be around 40% to 50% for CO2 (compared to 1990) following the illustrative calculations presented in this
report. This numbers would be around 50-55% for total greenhouse gas emissions.
There are different methods that can be used to calculate future emission targets consistent with the Paris Climate Agreement. They all show that emissions would need to be reduced substantially, in the next decades. Earlier calculations for all Kyoto greenhouse gases showed
an emission reduction of nearly 50% by 2030 for the 2 oC target, and 55% for all Kyoto
greenhouse gases for the 1.5 oC target. These numbers are consistent. The reason that
reduction percentages for 2030 for all greenhouse gases combined are larger than those for CO2 emissions only is that, in the 1990–2015 period, emissions of non-CO2 greenhouse
gases decreased more than those of CO2. For the EU, the emission reduction for the 2 oC
target for CO2 would be around 50% to 55% by 2030.
Adopted and proposed policies in the EU and the Netherlands will not lead to reductions consistent with the Paris Agreement’s climate objectives. For the
Netherlands, according to the National Energy Outlook 2017 (NEV 2017), policy will lead to a 30% reduction in greenhouse gases in total, and 20% for CO2 specifically,
by 2030. Dutch greenhouse gas emissions, currently, are decreasing rather gradually; over
the last decade, annual emission reductions were around 0.7 percentage points for all Kyoto greenhouse gases, and around 0.5 percentage points for CO2, specifically (compared with
1990 emission levels). When deriving targets for 2030 and 2050. the illustrative calculations indicate a required annual reduction of between 2.6 and 2.8 percentage points (compared with 1990 levels). The required reduction rate, therefore, is much higher than the historical rate. If, in the very near future, we are unable to realise a trend breach, we are unlikely to achieve these targets. This also takes into account that the projected reductions under adopted and proposed policy for 2030 will be insufficient.
Consistency with the Paris Climate Agreement, therefore, requires Dutch policy becoming more stringent in the short term. Reaching (nearly) zero CO2 emission by
2050 will require far-reaching changes. A certain share of such reductions may be
achieved through technological measures. In addition, behavioural changes may also contribute. If the Netherlands were to decide to implement national climate policy conform the Paris Climate Agreement, the following principles could apply:
• Focus policy on a greenhouse gas reduction of around 50% by 2030, compared with 1990 levels.
• Ensure that current decisions contribute to a long-term target value of 85% to 100% reduction by 2050.
• Ensure a transition policy that is focused on the timely implementation of all infrastructural, technological and institutional preconditions required for the large-scale application of low-carbon technologies.
• All this must be guaranteed, to create a stable environment for investments in an energy supply system with zero-carbon emissions, and the public must be involved in its implementation.
1 Introduction
By ratifying the Paris Climate Agreement, the Netherlands has committed to pursuing an ambitious climate policy. For all the countries involved, the agreement calls for far-reaching reductions in greenhouse gases. The WRR recently stated that effective climate policy requires a clear long-term perspective, to provide focus, coherence and sustainability for policy decisions (Faber et al., 2016), but also concluded that such a perspective is currently lacking in the Netherlands.
Since a few years, international climate policy has been based on so-called national efforts, with each country being responsible for formulating and achieving its own targets.
Nevertheless, countries are still able to review each other’s efforts, on the basis of the commitments they made, internationally. In addition to such commitments, the Netherlands also follows European policy, which involves two main instruments. The first is the EU Emissions Trading System (EU ETS), according to which emissions from relevant economic sectors are restricted by an emission ceiling, below which level the ‘trade’ in emissions is allowed. The second refers to emission targets that have been set for the so-called non-ETS sectors.
This report discusses the climate objectives of the Paris Climate Agreement and the possibilities for translating those into concrete emission level targets. It addresses the scientific knowledge as well as the choices that need to be made, on a global level, regarding the interpretation of the Paris Climate Agreement. In relation to this, we studied how to derive those targets for the Netherlands. What are the choices on a national level, to which objectives do they lead, and how could these be turned into concrete targets?
2 Global carbon
emissions budget and
emission reduction
pathways
2.1 Global carbon emissions budget consistent with the
Paris Climate Agreement
Under the Paris Climate Agreement (December 2015), nearly all countries in the world, including the Netherlands, have agreed to limit global temperature increase to well below 2 °C above pre-industrial levels, and to pursue efforts to limit this increase even further, to 1.5 °C (UNFCCC, 2015).
Scientific literature, among which the IPCC’s Fifth Assessment Report, shows that long-term temperature increase is particularly determined by cumulative carbon dioxide (CO2)
emissions (Figure 2.1) (IPCC, 2014a; Friedlingstein et al., 2014; Meinshausen et al., 2009). This relationship between temperature and cumulative CO2 means that, for various climate
targets, a so-called carbon emissions budget can be determined. This budget is equal to the amount of CO2 that could be emitted, worldwide, while still being able to achieve this target.
The relationship between cumulative CO2 emissions and temperature change can be used for deriving a
global carbon emissions budget conform the objectives of the Paris Climate Agreement. The coloured plane represents the range of results from climate models and, therefore, is indicative of the degree of uncertainty. The plane also shows the median and the 67th percentile. The circles depict the various scenario categories, as used in the recent IPCC report, on the basis of CO2 equivalent concentrations.
The size of the circles is determined, among other things, by the uncertainty about non-CO2 emissions.
Source: (Rogelj et al., 2016b).
The coloured plane of Figure 2.1 shows the results from a large number of climate models, thus indicating that current scientific knowledge does not allow the derivation of a single, unique relationship between temperature and cumulative CO2 emissions. The area thus
represents the uncertainty related to the limited knowledge about the climate system. Because of this uncertainty, a given temperature level (y-axis) corresponds with a range of various values of the carbon emissions budget (x-axis).
This means that Figure 2.1 can be used to derive budgets – but this requires a choice with respect to likelihood of achieving the target. Points along the median line indicate that the budget on the x-axis leads to about a 50% likelihood of staying below the temperature value on the y-axis. For each point above this line, the same carbon emissions budget provides a greater likelihood of staying below the related temperature level (y-axis). The second line in the figure shows the points at which the related temperature target could be achieved with a 66% likelihood. This value is termed likely, on the basis of IPCC uncertainty definitions. In addition to the uncertainty about the climate system and the unknown non-CO2 emissions,
and, to a lesser degree, the emission profile (timing of emission reductions) also plays a role in determining the carbon emissions budget. The impact of these factors is represented by the circles in Figure 2.1. The values, here, are based on calculations with a single climate model and, thus, only represent the factors mentioned above. As a result, the various values of the CO2 emissions budget within each circle may still result in a comparable temperature
The various emission budget values found in the literature not only depend on the uncertainties mentioned above, but also on methodological differences (e.g. types of models). The study by Rogelj et al. (2016b) compares various estimations. Some methods focus, for instance, on the total amount in CO2 emissions that would lead to exceeding the
climate target (so-called temperature-exceedance budget, TEB). Other methods, in contrast, focus on the maximum amount in emissions that can be allowed without exceeding the target (temperature-avoidance budgets, TAB). Typically, avoidance budgets are smaller than exceedance budgets as a consequence of the additional constraint of only approaching the temperature target. However, another factor in determining the carbon budget are the assumptions about non-CO2 emissions. TEB studies often assume baseline emissions for
non-CO2 – while TAB studies also assume stringent policies for these gases. As a result, in the
literature, a whole range of budgets can be found. The total uncertainty range for the carbon emissions budget that relates to a more than 66% likelihood of achieving the 2 °C target was estimated by Rogelj et al. at 600–1200 GtCO2, from 2015 onwards. For a 1.5 °C target, this
would be around 400 GtCO2 (50% likelihood) and 225 GtCO2 (66% likelihood).
A recent study by Millar et al. (2017) uses a slightly updated version of the TEB approach by, among other things, rescaling the output of climate models, on the basis of observed
temperature change (correcting for an upward bias in current temperature in these models) and by selecting specific non-CO2 forcing levels. The Millar et al. figures are considerably
higher than those published earlier by IPCC and Rogelj et al. (2016b). In response, several authors have highlighted the relatively low figure for historical warming, compared to pre-industrial levels in 2015, leading to a somewhat larger budget. The budgets published by Millar are 730–880 GtCO2 for a 1.5 oC target (with at least a 66% probability) and around
1400 GtCO2 for the 2 oC target. Using a slightly higher estimate for 2015 warming from
Visser et al. (2017) would reduce the Millar et al. budgets to 600–680 GtCO2 (1.5 oC) and
1300 GtCO2. The remaining IPCC budget figures can be understood in terms of the TEB and
TAB approaches and assumptions on non-CO2 gases.
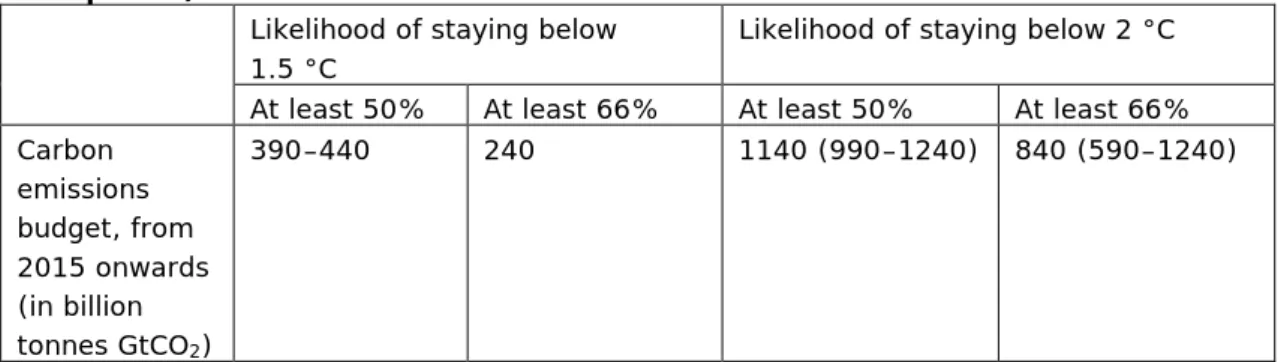
Table 2.1 provides an overview of the values from the IPCC report (IPCC, 2014a). For comparison: emissions currently are around 40 GtCO2 (Le Quéré et al., 2015) (energy
emissions are estimated at 36.3 GtCO2 per year; for land use, we used the average over the
last 10 years, i.e. 3.5 GtCO2). In this report, we use these IPCC figures for carbon budgets –
given that they are based on a larger number of publications. However, it is likely that a slightly higher budget for the 1.5 oC target (in the order of 600–700 GtCO2) could also be
correct.
Table 2.1: Overview of the carbon emissions budget in relation to two climate targets (IPCC, 2014a) (values have been corrected for emissions over the 2011– 2015 period)
Likelihood of staying below 1.5 °C
Likelihood of staying below 2 °C At least 50% At least 66% At least 50% At least 66% Carbon emissions budget, from 2015 onwards (in billion tonnes GtCO2) 390–440 240 1140 (990–1240) 840 (590–1240)
2.2 Emission pathways consistent with a carbon
emissions budget based on Paris targets
2.2.1 Achieving the Paris Climate Agreement targets of 1.5 °C and 2 °C
requires rapid emission reduction
There are several scenarios on future CO2 emission levels. Figure 2.2 illustrates the
implication of the carbon emissions budget for a number of mitigation strategies. If the emissions of carbon dioxide (CO2), the main greenhouse gas, continue to increase at the
level of the scenario in which there is additional climate policy, then global CO2 emissions
this century are projected to reach 3500–6500 billion tonnes (IPCC, 2014b) (Figure 2.2 uses a median value of 4200 billion tonnes of CO2). By 2100, this would lead to a global
temperature rise of between 3 and 7 °C, compared to pre-industrial levels.
Several emission pathways could comply with a carbon emissions budget of 1000 billion tonnes of CO2.
De graph on the left shows an emission development based on the historical trend, while the right-hand graph shows the pathways with and without negative emissions (NB 1 billion tonnes = 1 Gt).
The efforts needed to achieve the 2 °C climate target can be looked at from the perspective of the carbon emissions budget. Calculations here are based on an estimated average carbon emissions budget for a likely (over 66%) chance of achieving the target, rounded to the nearest 1000 billion tonnes of CO2 (an illustrative value, in the middle of the range of Table 2.1). This
equals 25 times the current annual 40 GtCO2. If, on a global level, emissions were to be
reduced gradually, they would need to reach zero within about 50 years, in order to stay within the carbon emissions budget (middle graph of Figure 2.2). The magnitude of this effort can be illustrated not only by the deviation from the emission trend (historical versus required level), but also by comparing the average lifespan of many types of energy
infrastructure (e.g. power plants often last for at least 40 years). This last point means that, in the coming years, the transition must be made towards new, climate-neutral
An expansion of the carbon emissions budget in the short term would be possible if, in the future, a situation of ‘net negative emissions’ could be created. This is demonstrated in the right-hand graph of Figure 2.2. ‘Negative emissions’ refers to the active removal of CO2 from
the atmosphere. There are several methods to do so; the two most-discussed options are reforestation and the use of bio-energy in combination with carbon capture and storage (BECCS). In addition, there are a number of less-often-considered options, such as direct air
capture (using carbon dioxide scrubbers to absorb the CO2 that is already in the
atmosphere). When the amount to negative emissions is larger than the fossil-fuel emissions remaining in the air, this is referred to as ‘net negative emissions’. These negative emissions are taken into account in the calculations of nearly all scenarios by the UN Intergovernmental Panel on Climate Change (IPCC) (Van Vuuren et al., 2015). Therefore, this is also the case for the derived emission reduction targets in the Paris Climate Agreement, as these were based on IPCC scenarios and the literature.
However, such negative-emission methods cannot be applied without restriction, due to the land-use consequences of bio-energy crops and reforestation (thus also affecting food supply) and the fact that carbon storage capacity is not unlimited (Smith et al., 2016). Scenarios in the literature include net negative emissions (for the second half of this century) at amounts that typically vary from zero to over 350 billion tonnes of CO2. Figure 2.2 shows
the situation for an assumed 250 billion tonnes in negative CO2 emissions (the median value
for the IPCC scenarios in the lowest category). The figure shows that this would require a slightly less rapid transition pathway for the global energy system.
Any large-scale use of negative emissions is not self-evident. CO2 storage (required for
BECCS1) and large-scale reforestation are currently hardly being applied. Moreover, both
bio-energy generation and carbon storage are controversial methods because of possible undesirable effects, such as on food security, biodiversity, possible emissions and risks related to CO2 storage. This leads to questions about how realistic the scenarios are that
include such storage (Anderson, 2015; Geden, 2015), and whether is would be possible to stay within 1000 billion tonnes of CO2 without applying negative emissions. Although this
would be extremely difficult, it would not be impossible. But only if there would be either an immediate shift towards a zero-carbon energy system (conform the middle graph of Figure 2.2), or towards a pathway that would counterbalance any slower transition before the year 2050 by a much lower CO2 emission level.
2.2.2 Model-based scenarios
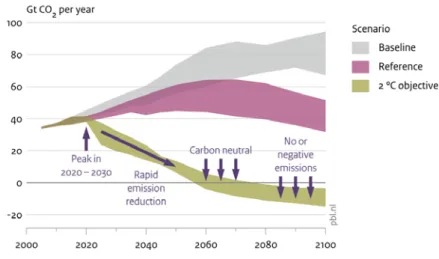
Energy model calculations show that substantial reductions are technically feasible (Figure 2.3) (Tavoni et al., 2015). Figure 2.3 presents baseline scenarios (without climate policy) and reference scenarios (current policy), as well as those that would achieve the 2 °C climate objective. The scenarios in this last category all assume negative emissions (however, there are also scenarios that reduce emissions even more rapidly, thus avoiding negative
emissions). In general, the 2 °C scenarios have global emissions peaking in the short term, followed by a period of more rapid reductions. By around 2060, CO2 emissions in such
scenarios will be zero, after which time, net negative emissions will possibly be achieved.
Scenarios to achieve the 2 °C target show global emissions peaking in the short term, followed by a period of rapid reductions and, in most cases, negative emissions, after 2060−2080.
This therefore means that, in all cases, the global energy system must be fully converted, in the coming 50 to 60 years, from being nearly fully based on fossil fuel, to using no fossil-fuel without carbon capture and storage (CCS). The related challenge, in this area, varies per country. Compared to developed nations, fast-growing developing countries will find it more difficult to achieve such a target. This leads to the expectation that the burden of achieving it is likely to be distributed in a way that is fair to all nations.
Figure 2.4 provides an overview of all the baseline and 2 °C scenarios in the IPCC scenario database. The IPCC report states that, on the basis of these data, an emission reduction of between 40% and 70% must be achieved by 2050, compared with 2010 levels. The percentage, however, depends on whether negative emission technologies are used. Without negative emissions, reductions would need to take place even more rapidly. Further analysis shows that the small number of scenarios that do not use negative emissions would involve even larger reductions in all greenhouse gases — between 60% and 75% by 2060, compared with 2010 levels. The reduction range for scenarios which include the use of negative emissions is between 40% and 60% (Figure 2.4). Figure 2.4 is based on the literature, as summarised in the IPCC AR5 report, and contains studies published over the 2008−2013 period. Many studies, therefore, assume immediate reductions from 2015 onwards.
Meanwhile, it seems unlikely that, by 2020, emission levels will be below the target for 2020, as incorporated in the illustrative calculations in the following chapter.
Considering only CO2 emissions, leads to much higher reductions — because, for many
sources of global non-CO2 emissions (e.g. methane and N2O), reductions over 50% are very
difficult to achieve (Gernaat et al., 2015). The figures for CO2 emissions, therefore, are
between 70% and 95% without the use of negative emissions and between 60% and 85% if such emissions are included.
Scenarios to achieve the 2 °C target show substantial reductions, with a global emission reduction range of between 60% and 95% by 2050 (depending on whether or not net negative emissions are included). However, most of these scenarios assume immediate reductions. The related emission reduction range for 2050 is indicated in the legend. The figure shows the baseline scenarios (grey), 2 °Cscenarios with the use of net negative emissions (green), and those without net negative emissions (blue), from the
IPCC AR5 scenario database.
2.3 Effectiveness of proposed policy
As part of the Paris Climate Agreement, countries have also submitted plans to reduce greenhouse gas emissions over the coming 10 to 15 years — the so-called Intended
Nationally Determined Commitments (INDCs) and Nationally Determined Commitments (NDCs) (from here onwards, the text refers to both as ‘NDCs’). Rogelj et al. (2016a) present
an elaborate analysis, on the basis of 10 studies into the effect of all the emission reduction plans for 2025 and 2030, submitted by those countries. For the period from 2030 onwards, those studies assume a continuation of climate policy, with reduction efforts that are comparable with those up to 2030. Combined, those studies show that realisation of the NDCs and continuation of policy could lead to a global temperature increase of between 2.6 and 3.1 °C, by 2100 (compared to pre-industrial levels). Although this increase is below that under scenarios without climate policy, it is not nearly sufficient to achieve the Paris
Agreement’s objective of limiting the global temperature increase to 2 °C, let alone 1.5 °C. In order to achieve this objective, and based on the NDCs, this would require drastic measures from 2030 onwards, with annual global reductions of 3% to 4%. Such measures
are expensive and difficult to execute. For achieving the 1.5 or 2 °C target, it would therefore be sensible for currently proposed policy for 2030 to become more stringent. To realise a cost-optimal pathway, the ambition level of current NDCs would need to increase by around a factor of three (Rogelj et al., 2016a; UNEP, 2017).
Implementation of the proposed policy and further objectives for 2030 (NDCs) will be insufficient to achieve reductions conform the Paris Agreement.
3 Consequences for the EU and the
Netherlands
3.1 Possible targets for the EU and the Netherlands for
2030 and 2050, consistent with the Paris Agreement
3.1.1 Distribution of emission reductions: cost-efficiency and fairness
Deriving objectives for Europe and the Netherlands from carbon emissions budgets and scenarios, requires a translation from global to national level. Issues such as those around the efficiency of climate policy as well as fairness also play a role, in this respect. This means that an unambiguous translation cannot be made without first identifying the substantive arguments. For a fair distribution of emission reductions, a multitude of fairness principles have been developed, over the years, describing how such reductions (or emissions) could best be distributed over the various countries (see below).
Cost efficiency
Most global scenario calculations in the literature simply focus on cost-efficiency; measures are implemented where they are the most economical. The main reason is that such an approach is transparent. Models can achieve this by using a uniform, global carbon price. As a result, the measures taken involve marginal costs that are similar in all corners of the world. A comparable situation can be achieved in reality by implementing an emission trading system that uses a uniform price level (e.g. the European Union’s Emissions Trading System (EU ETS)) or a uniform carbon tax. Both types of policy can be applied for the grouping of countries, but are not realistic instruments for global climate policy, in the current policy context. Still, such a cost-optimal solution could be approximated by
formulating national reduction commitments in line with these outcomes, and implementing measures conform model results. This could be combined with investment funds that pay for those measures. Studies aiming for cost-efficiency show that, in those cases, a large share of the reduction will take place in low-income countries, because reductions are often cheaper to achieve in these countries than in high-income countries. An important reason for this is that the current energy intensity of low-income countries is often greater and energy prices are lower. However, this also means that, under full cost-efficient implementation based on domestic policies, the resulting ultimate costs of measures per unit of income, in these low-income countries, will be higher than in high-low-income ones. As this seems politically
unacceptable, this could therefore be compensated by foreign investments or would require implementing different reduction targets.
Fairness criteria
In the allocation of emission reductions on the basis of the fairness criteria, other
considerations are in play. This mainly involves 1) responsibility (for current and possibly also historical climate change), 2) capacity (e.g. de carrying capacity of the economy), 3) equality (often interpreted in terms of emissions per person and 4) sovereignty. In the past, numerous methods have been devised for national emission reductions, using these types of fairness criteria. These could then serve as a basis for further negotiations. Since the shift in international climate policy, from striving for binding international agreements to countries taking their national responsibility, the meaning of these types of calculations has also changed. From providing an input to calculations on binding targets, they now form an interesting reference for the review of the ambition of NDCs by other countries.
Clearly, there is no worldwide consensus (e.g. among scientists, countries or NGOs) about which fairness principle to apply. Many of the proposed allocation mechanisms for reduction objectives are based on this principle (Höhne et al., 2014). The derived distribution methods include: 1) a distribution of global emissions on the basis of converting them into an equal amount of emissions per capita, in a given year, for all countries; 2) a distribution on the basis of current national emission levels; 3) a distribution on the basis of equal reduction costs per unit of GDP; 4) a distribution on the basis of equal costs per reduced emission amount; 5) a distribution on the basis of equal cumulative emissions (possibly including historical emissions); and 6) a combination of these forms of distribution. In the past, representatives from Brazil, South Africa, India and China assumed a principle of calculations on the basis of equal cumulative emissions per capita, over a certain time period (BASIC experts, 2011).
This chapter illustrates how, on the basis of global carbon emissions budgets, an indication can be given of the European and Dutch reduction tasks, based on a few simple calculations, using the figures presented in Chapter 1. Earlier reports, particularly for the EU, on regional and national climate objectives can be used to provide more insight into the levels of uncertainty of the presented outcomes (see Section 3.1.2). For example, the EU climate contribution (National Determined Contribution (NDC)) to the Paris Climate Agreement represents a domestic emission reduction target for 2030 of at least 40%, compared with 1990 emission levels.
3.1.2 Literature on EU emission reduction objectives, on the basis of
cost-efficiency
For the EU, allocation of total greenhouse gas emission reductions on the basis of cost-efficiency is around 45% (40%–55%) for 2030 and 77% (75%–80%) for 2050, compared with 1990 levels, to achieve the 2 °C target (based on the data set in Tavoni et al., 2015). Similar percentages result from the more recent data set by the MILES project (Van Soest et al., 2017). For CO2 only, the models show slightly larger reductions: 50% (40%–52%) for
2030 and 80% (70%–85%) for 2050, compared with 2010 levels. These figures are based on the use of a large amount of negative emissions. Excluding negative emissions or setting the target at 1.5 °C would lead to far greater reductions being required. As stated before, it must be noted that, for developing countries, an approach focused solely on cost-optimal allocation without compensation or international funding would result in the highest costs per unit of GDP (Hof et al., 2009; Tavoni et al., 2015).
3.1.3 Literature on EU emission reduction objectives, on the basis of
fairness criteria
A study by Höhne et al. (2014) contains a further elaboration of data from IPCC’s AR5, including a large number of studies that analyse the allocation of reduction targets on the basis of various fairness principles. They calculated an EU reduction objective of 35% to 65% for 2030 and 75% to 90% for 2050, compared with 1990 levels, for the 2 °C target based on 20th to 80th percentile results. Robiou du Pont et al. (2016) show that global reductions to achieve the 2 °C target by 2030, for the EU, would, at the extreme, be between 5% and 62% below the 2010 emission level (or 20% to 70% compared with that of 1990), depending on which fairness principle is applied. For the EU, allocation on the basis of historical responsibility and/or ability to contribute lead to relatively high reduction targets, while allocation on the basis of current emissions per capita (grandfathering; a form of equality whereby the status quo is retained) results in relatively low targets. Allocation based on a gradual transition, from current per-capita emission levels to equal emission levels per capita by 2040, for the EU, leads to targets close to the middle of the overall range (46%
compared with 2010 levels, or 54% compared with 1990). An earlier analysis by PBL (Hof et al., 2012), which was also focused on the 2 °C target based on equal reduction costs per unit of GDP for all countries, for the EU, resulted in a reduction of 45% to 47% by 2030,
compared with 1990 levels.
Table 3.1: Overview of recent studies on the EU greenhouse gas emission target for 2030
Criteria EU target for 2030 (compared with 1990)
Hof et al. (2012) Reduction costs equal percentage of GDP
45% to 47% Höhne et al. (2014) Overview of studies 35% to 65% Tavoni et al. (2015) Cost-effectiveness 40% to 55% Dupont et al. (2016) Various criteria 36% to 76% Van der Berg et al. (2017) Various criteria 25% to 100%
(mostly 35%–65%)
Note: For the second range from Van der Berg et al., 2017 the most extreme regimes were excluded.
On the basis of the studies named above (see Table 3.1) can be concluded that, depending on the various interpretations of ‘fairness’, a range of emission reduction targets can be derived for the EU. The range based on costs only is typically around 40% to 55%, while it would be slightly more stringent when based on equity principles (35%–65%). The literature also shows that allocation on the basis of an equal per-capita emission in a few decades, often, leads to a fairly average result – a relatively large number of studies use this as a benchmark. Most studies lead to a reduction target that is considerably more stringent than the ‘at least 40%’ target, which is currently used by the EU.
3.1.4 Illustrative calculations for the European Union and the Netherlands,
on the basis of new global emission targets
Here, some calculations are presented to derive targets for the EU and the Netherlands for 2030 and 2050. The outcomes should be regarded as illustrative. More complex
considerations, also taking into account other interpretations of the Paris Agreement or other fairness principles can be made.
The calculations focus on CO2 reduction targets only (see Text box 3.1). The calculations are
based of the three following scenarios (‘Paris scenarios’):
a) Achieving the 2 °C target with a likelihood of more than 66% (‘well below 2 °C’), assuming the use of negative emissions (for our calculations, we assumed a total of 200 billion tonnes in negative CO2 emissions).
b) Achieving the 2 °C target with a likelihood of more than 66% (‘well below 2 °C’), without the use of negative emissions.
c) Achieving the 1.5 °C target with a likelihood of more than 50%, using negative emissions (for our calculations, we assumed a total of 350 billion tonnes in negative CO2 emissions).
For our calculations, we also assumed that current policies, worldwide, will not become more stringent up to 2020. Studies expect global emissions to increase by around 6%, between 2015 and 2020 (Rogelj et al., 2016a). From 2020 onwards, a global linear reduction is assumed, in order to stay within the carbon emissions budget. It should be noted that the 1.5 oC target could be associated with a higher budget. In that case, results would be
The choice for a certain amount of negative emissions is not a purely scientific one – as it depends on a societal choice regarding the acceptability of the impacts and risks involved, including the risk of not achieving the long-term climate target. Here, we chose an amount of 200 billion tonnes in CO2, for both 2 °C scenarios, which is a reasonably accurate
representation of the negative emissions used in scenarios described in the literature. In addition, we show the outcome if society would not allow the use of negative emissions. Because achieving the 1.5 °C target is hardly imaginable without negative emissions (all scenarios to date apply a much larger amount of negative emissions for this target range, Rogelj et al., 2015), we assumed 350 billion tonnes in negative CO2 emissions for this target.
In order to derive the pathways for Europe and the Netherlands, for our calculations, we assumed per-capita emissions to be equal, worldwide, by 2050. As indicated in the previous section, this is only one of the possible fairness criteria, although it is one most used. The method yields results that, generally, are somewhere in the mid-range. For both Europe and the Netherlands, a linear reduction was assumed from 2020 up to 2050.
Text box 3.1 CO2 and other greenhouse gases
In addition to CO2, there are also other greenhouse gases that contribute to climate change,
such as methane (CH4), nitrous oxide (N2O), various halocarbons and certain aerosols.
Various methods can be used for an intercomparison of the contribution levels of these gases. A complicating factor is that these gases and compounds vary considerably in atmospheric lifetime. For example, for the main non-CO2 gas, this is around 15 years, while
it may take centuries for increased concentrations of CO2 to leave the atmosphere. Under the
Kyoto protocol, policy often assumes a multi-gas approach, based on so-called Global Warming Potentials (GWPs). These can be used for expressing total emissions in CO2
equivalent emissions. GWPs are an integral measure of the contribution to global warming of a certain gas, over a given period, compared to that of CO2. The value for methane is
relatively high (successive IPCC reports have adjusted it, most recently from 21 to 34 (IPCC, 2013)). However, current methane emissions will have a considerable impact on the increase in global mean temperature in the short term, but will hardly contribute in the long term, given methane’s short lifetime in the atmosphere. An emission reduction budget for which emissions are added together over a long period of time only makes sense for greenhouse gases with long lifetimes (i.e. CO2 and N2O as well as certain halocarbons). This report
focuses solely on CO2 because of the carbon budget approach, the dominant role of CO2 in
climate change in the long term, and the connected, direct relationship between CO2 and
long-term transition processes in energy and agriculture. It would in fact be useful to readdress the question of whether it makes sense to use multi-gas targets based on such a wide variety of gases. This is closely related to the climate policy objective. As methane plays a role, particularly in the short term, the importance of this gas increases with climate policy that is also aimed to prevent climate change in the short term. In most cases, it is not a good idea to make a trade-off between CO2 and methane emission reductions, because of
the differences in the effect over time. A more effective approach would seem to be that of formulating separate targets for methane and gases with a long lifetime.
Global CO2 emission pathways, based on the Paris Climate Agreement. Explanation: The dotted line
shows the hypothetical case of accelerated emission reductions by 2020, consistent with the 2 °C target. The plane shows the range for new model-based scenarios, based on the Shared Socio-economic Pathways (SSPs) with net negative emissions.
Figure 3.1 shows the global emission pathway for the three situations. All calculations show strong reductions in CO2 emissions. The results from the illustrative calculations (lines) are
compared against model results (planes). The calculation results fall within the range of those conducted by complex models. Because models sometimes assume more net negative emissions for the 1.5 °C target, our related calculations are within the lower range of the model results.
CO2 emission pathways per capita, based on the Paris Climate Agreement. Explanation: the calculations
assume equal CO2 emissions per capita by 2050, within the carbon emissions budget, for the world,
EU28 and the Netherlands. The historical global and EU emissions are based on Le Quere et al., 2015. Emissions in the Netherlands are based on the NEV 2017.
Figure 3.2 subsequently shows emission trends per capita, for the world, the EU and the Netherlands, in each of the three scenarios. From a historical perspective, there are large differences in emission trends between those regions, which also determine these trends towards 2050.
Table 3.2 provides an overview of the three illustrative calculations, based on the Paris Climate Agreement.
Depending on the scenario, CO2 emission reductions in the EU, by 2030, will be around 50%
for the 2 °C target and 60% for the 1.5 °C target, compared with 1990 levels. By 2050, CO2
reductions would be 90% to 100% for the 2 °C target and over 100% for the 1.5 °C target. These reductions, therefore, are more stringent than under the proposed policy in the EU, which currently is pursuing a 40% reduction target for 2030 and 80% to 95% for 2050. For the Netherlands, comparable calculations show an emission reduction of 40% for the 2 °C target and 45% for the 1.5 °C target for 2030, and for 2050 this is again 90% to 100% for the 2 °C target and over 100% for the 1.5 °C target. The reduction percentages for 2030 for the Netherlands seem smaller than those for the EU, compared with 1990 levels, which is due to the fact that European emissions already declined more rapidly over the 1990–2015 period. Reductions in the Netherlands are thus more stringent.
In the Netherlands, greenhouse gas emissions decreased by 11%, between 1990 and 2015. This trend is dominated by reductions in non-CO2 emissions, that is to say, in methane,
compared with 1990 levels (3.4% increase), although, over the 2010–2015 period, a clearly declining trend in CO2 emissions can be observed (but from a peak level in 2010 of 12%
above the 1990 level).
Table 3.2 CO2 emission reductions, compared with 1990 levels, according to three
illustrative calculations, based on the 2 °C target in the Paris Climate Agreement
2 °C; negative emissions 2 °C; no negative emissions 1.5 °C; negative emissions
Global budget 1000 GtCO2 1000 GtCO2 550 GtCO2
Emissions 2010−2015
160 GtCO2 160 GtCO2 160 GtCO2
Emissions 2015−2020
205 GtCO2 205 GtCO2 205 GtCO2
Net negative emissions
-200 GtCO2 -0 GtCO2 -350GtCO2
Budget from 2020 onwards
(including overshoot)
835 GtCO2 635 GtCO2 535 GtCO2
EU28 2030 50% 55% 59%
2050 88% 100% >100%
NL 2030 38% 41% 44%
2050 89% 100% >100%
CO2 emission reduction pathways for the EU and the Netherlands, based on the Paris Climate Agreement
and formulated policy. The projections for the EU are based on the NEV 2017 and the New Policies scenarios of the World Energy Outlook.
The National Energy Outlook (NEV 2017) (Schoots et al., 2017) projects a further decrease in CO2, for the coming years. By 2020, this will have led to a reduction of 12%, compared
with 1990 levels; for all greenhouse gases combined, this reduction will be 23%. According to the NEV, implementation of currently proposed policy will slightly reduce greenhouse gas emission levels, over the 2020–2030 period. The CO2 emission reduction projected for 2030,
therefore, is around 20%, and for all greenhouse gases 30% (both compared with 1990 levels). Because the contribution from non-CO2 emissions, currently, is only 15% (versus
26.5% in 1990), further reductions in greenhouse gases will mostly have to consist of CO2
emissions. Over the last 10 years, CO2 emissions have decreased by around 0.6 percentage
points, annually (as a percentage of 1990 emissions). This implies that, for the scenarios presented earlier, this reduction would be around 2 to 2.9 percentage points (2 °C target) and above 3 percentage points (1.5 °C target). This is an obvious acceleration of emission reductions, compared against historical trends. Proposed policy (NEV 2017) is also — and particularly after 2020 — clearly insufficient for achieving the 2 °C target. In contrast, the emission reduction target of 49% for 2030, compared to 1990, would be more or less consistent with the 1.5 °C and 2 oC scenarios shown here.
For the European Union, the current reduction target for 2030 is a 40% emission reduction (all greenhouse gases). The World Energy Outlook 2016 from the International Energy Agency shows emission reductions for 2030 of nearly 20% (Current Policies) and 40% (New Policies). Both are insufficient for achieving the 2 oC target – assuming per capita
convergence by 2050.
Text box 3.2 Emission reductions in all greenhouse gases combined
The illustrative calculations presented here are directly based on carbon budgets and assume a linear reduction in emissions, from 2015 to 2050. In an earlier study, emission reductions consistent with the Paris Climate Agreement for all greenhouse gases, for the Netherlands, were calculated assuming emission reduction targets of 80% to 95% (Koelemeijer et al., 2017). These previous calculations indicated a 49% emission reduction in all Kyoto
greenhouse gases would be required for achieving the 2 oC target, and for the 1.5 oC target
this would be 55%. These percentages are consistent with those presented here. The reduction percentages for 2030, for all greenhouse gases combined, are higher than those for CO2 emissions only, because non-CO2 emissions decreased more than CO2 emissions,
between 1990 and 2015. It should also be noted that a cost-efficient reduction in
greenhouse gas emissions will be based on flexible instruments and depending on the related reduction costs for each gas, at a particular time.
3.2 Emission reduction strategies in the Netherlands
3.2.1 Overall strategy
The previous section shows that the Paris Climate Agreement calls for far-reaching reduction in greenhouse gas emissions, in the EU and in the Netherlands. This final section discusses whether such emission reductions could really be achieved in the Netherlands (serving as an illustration for other European countries). Calculations show this could actually be achieved using energy-efficient processes; renewable energy instead of coal, oil and natural gas; zero-emission transportation; electrification of the heat supply; bio-based fuels; and capture and storage of CO2. These are mostly new technologies, which also require new infrastructure,
lifestyle. This last point concerns, for example, dietary changes or adjustments to transport patterns. Without strong policies, this cannot be achieved. This has been shown in previous analyses by PBL, such as in the report ‘Options for energy and climate policy’.
As a result of current EU policy, scenarios to date have mainly explored how emission reductions for the Netherlands may lead to a 40% reduction by 2030 and an 80% reduction by 2050, for all greenhouse gases. According to the calculations in the previous section, these values would need to be raised to be consistent with achieving the 2 °C Paris target, and even higher if the aim is not to depend on net negative emissions in the future, or if the 1.5 °C target would be pursued.
It is obvious, however, that, in the short term, the focus should first be more on accelerating the transition than on the exact emission reduction percentage by 2050. The Netherlands, of course, depends on European policy, but if it decides to formulate national climate policy conform the Paris Agreement, the following principles could apply:
- Focus policy on at least 40% and possibly 50% CO2 reduction by 2030, compared
with 1990 levels. This would require substantial policy adjustments. According to the NEV 2016, the emission reduction under implemented policy would yield a 12% reduction for CO2 and 24% for all greenhouse gases combined.
- Ensure that current decisions contribute to long-term ambitions for a reduction of at least 85% and possibly over 100% by 2050.
- Guarantee all this, so that a robust investment climate is created, and involve society in its implementation.
- Implement transition policy focused on timely formulation of all infrastructural, technical and institutional conditions for the large-scale application of low-carbon technology.
The Dutch Scientific Council for Government Policy (WRR) recently suggested that, for the creation of a robust investment climate, it may be important to embed a long-term
perspective for Dutch climate policy in a so-called Climate Act. The new Dutch Government (Rutte III), installed this year, has taken some of these principles into account.
3.2.2 Far-reaching changes
The Paris Climate Agreement, therefore, for the Netherlands, means an 90% to 100% reduction in CO2 emissions, by 2050. This objective can only be achieved if preparation and
implementation are realised soon, because it would involve very substantial changes. Only picking low-hanging fruit — easily realised and relatively cheap measures, such as many types of efficiency improvements — will not be sufficient to achieve this objective.
Investments over the coming decade already — and to a large degree — determine what the Dutch energy system will look like in 2050. It is therefore important that sufficient
investments are made in innovative technologies that, in the short term, are still relatively expensive but will be indispensable in the long term, if the objective is to be achieved. Because of its very drastic character, such innovation is particularly promising if the political framework guarantees the robustness of policy (such as the Climate Act). In addition, the transition is such a far-reaching process that it is prudent to give societal stakeholders and citizens an active role in it. The Energy Agreement and the National Climate Summit 2016 are the first examples of how this could be done. This clear, long-term perspective is still lacking from the ambitions of the new Dutch Government (installed in 2017).
3.2.3 Implementation in all areas needed to achieve target
The changes mentioned are all difficult to bring about. In order to achieve the objective, innovation is necessary in every sector — and the nature of such innovation differs per sector. For the built environment, this means many more natural-gas-free neighbourhoods
with heat networks or far-reaching insulation combined with electric heating. In personal transportation, there is the option of making zero-emission vehicles (e.g. electric cars) the future standard. Companies should put the possibilities for innovative process renewal more into practice. In so far as this leads to insufficient emission reduction, CO2 must be captured,
which cannot be done until the organisation of and infrastructure for the transport and storage of CO2 have been organised. It is also important that the efforts of making the power
supply more sustainable are continued, and the fluctuating supply of solar and wind energy in the power system is included. Any future possible need for natural gas and liquid fuels will call for further development of green variants of current production processes.
Figures 3.4 and 3.5 show various options — in this case, without the application of nuclear energy — for energy demand and the design of the energy system, whereby emission reductions of 80% and 95%, respectively, could be achieved (Ros and Schure, 2016). Reducing final energy use and the use of electricity by applying substantially larger amounts of renewable energy in combination with carbon capture and storage (CCS) are important elements in the approach that is needed (PBL, 2011).
To achieve an 80% emission reduction, variants without the implementation of CCS could be used, but this would require not only a substantial reduction in energy use, but also an 80% implementation of renewable energy. When also including the maximum application of CCS, around 40% in renewable energy could suffice. For 95% emission reduction, an energy system without CCS is hardly an option; dozens of megatonnes in CO2 would need to be
captured and stored. This in combination with a sizeable reduction in energy demand. The application of renewable energy (even under maximum application of CCS) would need to be at least 70%, and under most variants even over 80%. The variant combining bio-energy and CCS, therefore, is one of the main options. Under many variants, this combination delivers an important contribution due to the resulting negative emissions — particularly, the capture of CO2 emissions from the production of green gas and biofuels. If the choice would
be made for a reduction in greenhouse gases of over 90% by 2050, this could only be achieved by a simultaneous implementation of a large number of measures. Many
technologies are still surrounded by uncertainties in relation to potential availability (e.g. of biomass), costs, applicability within the system, and societal acceptance. In addition to technological measures, also behavioural adjustments are an option to achieve reductions. For example, people may opt for other transport modes, and for consuming fewer animal products.
Explanation: An 80% emission reduction would require a large transition in the Dutch energy system; the variants A to V represent the various ways of achieving this.
Explanation: A 95% emission reduction target would require an even larger change in the energy system; the variants A to L represent the various ways of achieving this.
Not all of these changes will take place automatically; they require policy support. The government may stimulate the technological and behavioural changes by facilitating them, or by adjusting regulations in various areas, entering into public–private collaborations, issuing
subsidies, or by providing some other financial incentive. In the Netherlands, European policy plays a crucial role, as well. It will therefore be necessary to promote effective policy on a European level, such as strengthening the workings of the EU Emissions Trading System (EU ETS), and implementing more stringent standards for motorised vehicles. Including
renewable energy sources also requires European coordination of energy markets and transborder energy infrastructure.
3.2.4 Coming years are crucial
The coming decade will be crucial when it comes to achieving successful climate policy, both globally and in the Netherlands. In order to comply with the Paris Climate Agreement, policy proposals, all over the world, need to become more stringent if we are to remain within the carbon emissions budget. Moreover, in the short term, governments need to consider the role of negative emissions. Negative emissions could be achieved, in the long term, but the related technology is not undisputed. Without negative emissions, the short-term policy task will only increase. This is also true for the Netherlands. Dutch proposed policy will result in an insufficient 12% CO2 emission reduction by 2030, compared with 1990 levels. For policy
to be consistent with the Paris Agreement, it should be around 50%. The new Dutch
Government (Rutte III, installed in 2017) is aware of this fact and has formulated ambitions to attain this aim. However, the policies currently formulated do not meet the ambitions yet. For the longer term (2050), CO2 emissions would need to be close to zero. The Netherlands
could also play a role in international negotiations, where is has been agreed that new emission targets should be negotiated. Postponement to a slightly longer term would mean that reductions need to be even more stringent, possibly to be achieved by shutting down or modifying power plants, as well as by behavioural changes.
References
Anderson K. (2015). Duality in climate science. Nature Geoscience, 8, 898−900.
Basic Experts (2011). Equitable access to sustainable development: Contribution to the body of scientific knowledge. BASIC expert group: Beijing, Brasilia, Cape Town and Mumbai. Du Pont YR, Jeffery ML, Gütschow J, Christoff P and Meinhausen M. (2016). National
contributions for decarbonizing the world economy in line with the G7 agreement. Environ Res Let.
Faber A, De Goede P and Weijnen M. (2016). Klimaatbeleid voor de lange termijn: van vrijblijvend naar verankerd. Scientific Council for Government Policy, The Hague.
Friedlingstein P, Andrew RM, Rogelj J, Peters GP, Canadell JG, Knutti R, Luderer G, Raupach MR, Schaeffer M, Van Vuuren DP and Le Quéré C. (2014). Persistent growth of CO2
emissions and implications for reaching climate targets. Nature Geoscience, 7, 709–715. Geden O. (2015). Policy: Climate advisers must maintain integrity. Nature, 521, 27–28. Gernaat DEHJ, Calvin K, Lucas PL, Luderer G, Otto SAC, Rao S, Strefler J and Van Vuuren
DP. (2015). Understanding the contribution of non-carbon dioxide gases in deep mitigation scenarios. Global Environmental Change, 33, 142–153.
Hof A, Brink C, Mendoza Beltran A and Den Elzen M. (2012). Greenhouse gas emission reduction targets for 2030. Conditions for an EU target of 40%. The Hague: PBL Netherlands Environmental Assessment Agency.
Hof AF, Den Elzen MGJ and Van Vuuren DP. (2009). Environmental effectiveness and economic consequences of fragmented vs. universal regimes: What can we learn from model studies? Int. Environ. Agreem.: Polit., Law and Econ, 9, 39–62.
Höhne N, Den Elzen M and Escalante D. (2014). Regional GHG reduction targets based on effort sharing: a comparison of studies. Clim Policy, 14, 122–147.
IPCC (2013). Climate Change 2013: The Physical Science Basis. Contribution of Working Group I to the Fifth Assessment Report of the Intergovernmental Panel on Climate
Change. In: Stocker TF, Qin D, Plattner GK, Tignor M, Allen SK, Boschung J, Nauels A, Xia Y and Be V. (eds.).
IPCC (2014a). Climate Change 2014 - Synthesis Report. Intergovernmental panel on Climate Change.
IPCC (2014b). Climate Change 2014: Mitigation of Climate Change. Contribution of Working Group III to the Fifth Assessment Report of the Intergovernmental Panel on Climate Change Cambridge, United Kingdom, Cambridge University Press.
Koelemeijer R, Koutstaal P, Daniels B and Boot P. (2017). Nationale kosten energietransitie in 2030. PBL Note. PBL Netherlands Environmental Assessment Agency, The Hague. Nederland.
Le Quéré C, Moriarty R, Andrew RM, Canadell JG, Sitch S, Korsbakken JI, Friedlingstein P, Peters GP, Andres RJ, Boden TA, Houghton RA, House JI, Keeling RF, Tans P, Arneth A, Bakker DCE, Barbero L, Bopp L, Chang J, Chevallier F, Chini LP, Ciais P, Fader M, Feely RA, Gkritzalis T, Harris I, Hauck J, Ilyina T, Jain AK, Kato E, Kitidis V, Klein Goldewijk K, Koven C, Landschützer P, Lauvset SK, Lefévre N, Lenton A, Lima ID, Metzl N, Millero F, Munro DR, Murata A, Nabel J, Nakaoka S, Nojiri Y, O'Brien K, Olsen A, Ono T, Pérez FF, Pfeil B, Pierrot D, Poulter B, Rehder G, Rödenbeck C, Saito S, Schuster U, Schwinger J, Séférian R, Steinhoff T, Stocker BD, Sutton AJ, Takahashi T, Tilbrook B, Van der Laan-Luijkx IT, Van der Werf GR, Van Heuven S, Vandemark D, Viovy N, Wiltshire A, Zaehle S and Zeng N. (2015). Global Carbon Budget 2015. Earth System Science Data, 7, 349– 396.
Meinshausen M, Meinshausen N, Hare W, Raper SCB, Frieler K, Knutti R, Frame DJ and Allen MR. (2009). Greenhouse-gas emission targets for limiting global warming to 2 °C. Nature, 458, 1158–1162.
Millar RJF, J.S. Friedlingstein,, P. Rogelj, J., Grubb, M.J. Matthews, H.D., Skeie, R.B. Foster, P.M. Frame, D.J., Allen MR (2017). Emission budgets and pathways consistent with limiting warming to 1.5 ° C. Nature Geoscience 10:741–747.
Rogelj J, Den Elzen M, Höhne N, Fransen T, Fekete H, Winkler H, Schaeffer R, Sha F, Riahi K and Meinshausen M. (2016a). Paris Agreement climate proposals need a boost to keep warming well below 2 °C. Nature, 534, 631–639.
Rogelj J, Luderer G, Pietzcker R, Kriegler E, Schaeffer M, Krey V and Riahi K. (2015). Energy system transformations for limiting end-of-century warming to below 1.5 °C. Nature Climate Change, 5, 519–528.
Rogelj J, Schaeffer M, Friedlingstein P, Gillett N, Van Vuuren DP, Riahi K, Allen MR and Knutti R. (2016b). Differences between carbon budget estimates unravelled. Nature Clim. Change, 6, 245–252.
Schoots K, Hekkenberg M and Hammingh P. (2017). Nationale Energieverkenning 2017. ECN Policy studies.
Smith P, Davis SJ, Creutzig F, Fuss S, Minx JC, Gabrielle B, Kato E, Jackson RB, Cowie A, Kriegler E, Van Vuuren DP, Rogelj J, Ciais P, Milne J, Canadell JG, McCollum D, Peters GM, Andrew RM, Krey V, Shrestha G, Friedlingstein P, Gasser T, Grübler A, Heidug WK, Jonas M, Jones CD, Kraxner F, Littleton E, Lowe J, Moreira JR, Nakicenovic N, Obersteiner M, Patwardhan A, Rogner M, Rubin ES, Sharifi A, Torvanger A, Yamagata Y, Edmonds J and Yongsung C. (2016). Biophysical and economic limits to negative CO2 emissions. Nature
Clim. Change, DOI: 10.1038/NCLIMATE2870.
Tavoni M, Kriegler E, Riahi K, Van Vuuren DP, Aboumahboub T, Bowen A, Calvin K, Kober T, Jewell J, Luderer G, Marangoni G, McCollum D, Van Sluisveld M, Zimmer A and Van der Zwaan B. (2015). Post-2020 climate agreements in the major economies assessed in the light of global models. Nature Clim. Change, 5, 119–126.
UNEP (2017). The Emissions Gap Report 2017. A UN Environment Synthesis Report. United Nations Environment Programme (UNEP), Nairobi.
UNFCCC (2015). 2015.FCCC/CP/2015/L.9/Rev.1: Adoption of the Paris Agreement. Paris, France: UNFCCC.
Van den Berg N, Van Soest HL, Den Elzen MGJ, Hof AF, Van Vuuren DP, Chen W, Drouet L, Emmerling J, Fujimori S, Höhne N, Köberle A, McCollum D, Schaeffer R, Shekhar S, Sudharmma Vishwanathan S, Vrontisi Z and Blok K. (2017). Implications of various effort-sharing approaches for national carbon budgets and emission pathways. Climatic Change.
Van Vuuren DP. (2015). Integrated assessment: Back to the Future. Inaugural lecture. Utrecht University.
Van Vuuren DP, Van Sluisveld M and Hof AF. (2015). Implications of long-term scenarios for medium-term targets (2050). PBL Netherlands Environmental Assessment Agency, The Hague.
Visser H, Dangendorf S, Van Vuuren DP, Bregman B and Petersen AC. (2017). Signal detection in global mean temperatures after “Paris”: an uncertainty and sensitivity analysis. Clim. Past Discuss doi.org/10.5194/cp-2017-88.