Methodologies for estimating
shipping emissions in the
Netherlands
Proper estimation of shipping emissions is essential for an impact assessment
of shipping on air quality and health in port cities and coastal regions. In
the Netherlands shipping is an important emission source for particulate
matter. Therefore, detailed methodologies were developed, since 2000, for
estimating emissions on the North Sea, in ports and from inland shipping.
This report provides an internationally accessible and transparent summary
and description of the methodologies used in the Netherlands Pollutant
Release & Transfer Register regarding PM emissions from shipping, including
any implemented updates. It describes in more detail the emission factors
and activity data that are currently in use to estimate emissions from ships
at anchor in ports, and from inland shipping. Subsequently, it presents
recommendations for further research and improvement.
This study is a BOP publication produced under the auspices of TNO.
The Netherlands Research Program on Particulate Matter (BOP) is a national
program on PM
10and PM
2.5. It is a framework of cooperation involving
the Energy research Centre of the Netherlands (ECN), the Netherlands
Environmental Assessment Agency (PBL), the Environment and Safety Division
of the National Institute for Public Health and the Environment (RIVM) and
TNO Built Environment and Geosciences.
BOP report
Methodologies for estimating shipping
emissions in the Netherlands
A documentation of currently used
emission factors and related activity data
Hugo Denier van der Gon, TNO; Jan Hulskotte, TNO
Methodologies for estimating shipping emissions in the Netherlands
A documentation of currently used emission factors and data on related activity
This is a publication of the Netherlands Research Program on Particulate Matter Report 500099012
H. Denier van der Gon, J. Hulskotte Contact: karin.vandoremalen@pbl.nl ISSN: 1875-2322 (print) ISSN: 1875-2314 (on line) This is a publication in the series: BOP reports Project assistant: Karin van Doremalen English editing: Annemieke Righart
Figure editing: PBL editing and production team Layout and design: RIVM editing and production team Cover design: Ed Buijsman (photographer: Sandsun) ECN Energy research Centre of the Netherlands PBL Netherlands Environmental Assessment Agency TNO Built Environment and Geosciences
RIVM National Institute for Public Health and the Environment
This study has been conducted under the auspices of the Netherlands Research Program on Particulate Matter (BOP), a national program on PM10 and PM2.5 funded by the Dutch Ministry of Housing, Spatial Planning and the Environment (VROM).
Parts of this publication may be reproduced provided that reference is made to the source. A comprehensive reference to the report reads as ‘Denier van der Gon, H., Hulskotte, J. (2010) Methodologies for estimating shipping emissions in the Netherlands
A documentation of currently used emission factors and related activity data’: The complete publication, can be downloaded from the website www.pbl.nl. Netherlands Environmental Assessment Agency, (PBL)
PO BOX 303, 3720 AH Bilthoven, The Netherlands; Tel: +31-30-274 274 5;
Fax: +31-30-274 4479; www.pbl.nl/en
Rapport in het kort 5 Een juiste schatting van scheepvaart emissies is essentieel
bij het in kaart brengen van de effecten door scheepvaart op luchtkwaliteit en gezondheid in havensteden en kustgebieden. In Nederland is scheepvaart een belangrijke emissiebron voor fijn stof. Sinds 2000 zijn specifieke schattingsmethodieken ontwikkeld voor de emissies op de Noordzee, in havens en voor de binnenvaart. Dit rapport geeft een samenvatting en beschrijving van de methoden om fijn stof emissies van scheepvaart te schatten zoals momenteel in gebruik bij de Nederlandse Emissie Registratie, inclusief recente aanpassingen. Extra aandacht wordt gegeven aan de huidige emissiefactoren en activiteitsdata benodigd om emissies van stilliggende schepen en de binnenvaart te schatten. De hieruit volgende aanbevelingen voor onderhoud van de basisgegevens en mogelijke verdere verbeteringen worden gepresenteerd.
Contents 7
Contents
Rapport in het kort 5
Summary 9
Guidance to the reader 11
1 Estimation of shipping emissions in the Netherlands 13
2 Emissions from seagoing vessels in Dutch territorial waters 17
2.1 Seagoing vessels on the Dutch continental shelf 17
2.2 Seagoing vessels sailing Dutch territorial waters (excluding the Dutch continental shelf) 18 2.3 The Dutch EMS approach for seagoing vessels from a European perspective 22
2.4 Comparison of EMS emission factors with measurements and adjustment of the PM10 emission factor used in the Emission Registration 22
2.5 Recommendations concerning emissions from seagoing ships 23
3 Fuel consumption and associated emissions from seagoing vessels in berth, derived from an on-board survey 1 25
3.1 Introduction 25 3.2 Methodology 25 3.3 Results 32 3.4 Conclusions 32
4 Fuel quality, S-content and PM emissions 35
4.1 Sulphur content 35 4.2 Ash content of the fuel 36
4.3 The effect of fuel quality on PM composition and emissions 37 4.4 Effect of Lube oil consumption on PM emissions 37
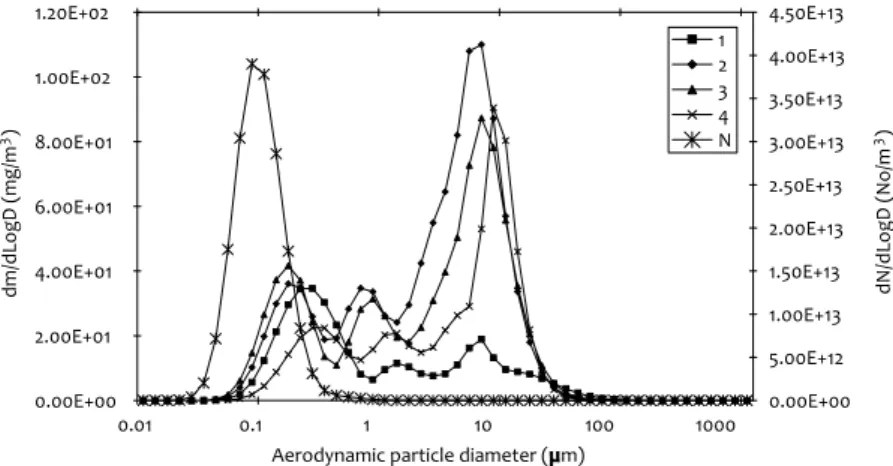
4.5 Size fractionation of PM emissions 37
4.6 Conclusions and Recommendations for further research 38
5 Emissions from inland shipping in the Netherlands 39
5.1 Calculation of actual emissions from inland shipping in the Netherlands 39 5.2 Auxiliary engines 41
5.3 Activity data 41
5.4 Emissions from inland shipping, as calculated according to Dutch methodology 42 5.5 Discussion and recommendations 42
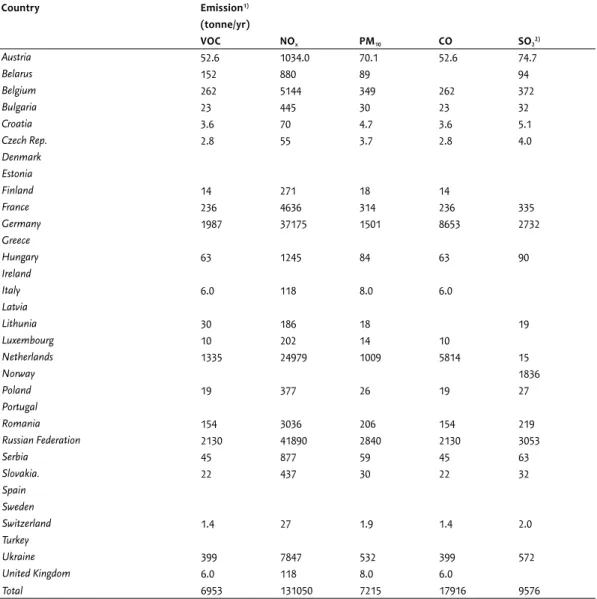
6 Emissions from inland shipping in Europe 45
6.1 Emissions from inland shipping in Europe 45 6.2 Activity data 45
6.3 Emission factors 45
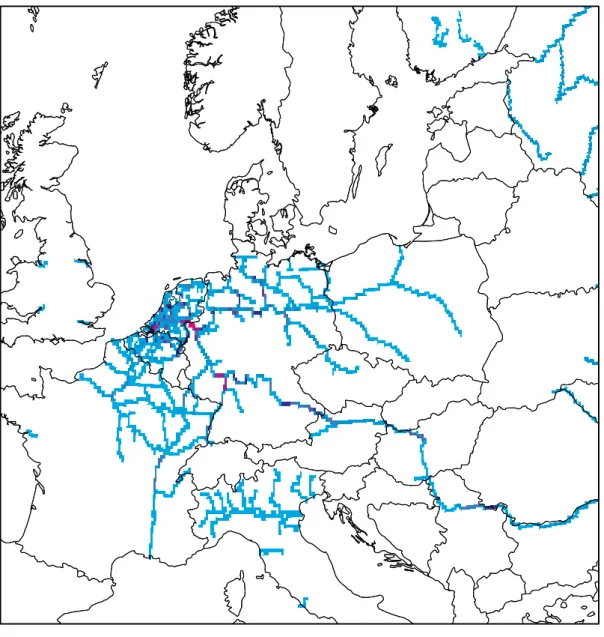
6.4 Spatial Distribution of emissions from inland shipping 47 6.5 Conclusions 48
7 New developments and research needs 51
7.1 Measurements and monitoring 51 7.2 Particle number emissions and climate
relevance of shipping emissions 52 7.3 Research needs and outlook 52
Summary 9 Shipping is an important source of PM. Total emissions of
sea shipping in and around Europe are estimated at ~300 kton annually. The Netherlands is a coastal country with major ports like Rotterdam and Amsterdam. Hence the share of shipping on Dutch territory in total Dutch emissions is significant especially for SO2, NOx and PM10. For 2008 shipping
contributed 53%, 31% en 19% to total Dutch SO2, NOx and PM10
emissions, respectively. The majority of this emission (> 80%) occurs on the Dutch part of the Continental shelf (NCP), CBS (2009).
Proper estimation and allocation of shipping emissions is crucial for understanding the impact of shipping on air quality and health in harbour cities and coastal regions. This report summarizes the emission factors and methodologies to estimate emissions from inland shipping and sea shipping by the Dutch Pollutant Release & Transfer Register (PRTR). Inland shipping is split in national and international inland shipping. Emissions from seagoing ships are split in emissions from seagoing ships on the Dutch continental shelf, seagoing ships, manoeuvring in and towards Dutch harbours and emissions from seagoing ships at berth. The core of the present report is a clear and concise documentation of the Dutch emission estimation methodology based on available (Dutch) reports and protocols developed since 2000. These methodologies rely heavily on the work done in the frame work of the project Emission registration and Monitoring Shipping (EMS) executed in 2000-2003. EMS was initiated by DG Goederenvervoer (Directorate-General freight transport1)
of the Dutch Ministry of Transport, Public Works and Water Management .
It is important to stress that the objective of the current report is not to report shipping emissions. These can be obtained through the Dutch national statistics as a product of the Pollutant Release & Transfer Register (PRTR; see CBS, 2009). The objective is to document the methodologies used in the PRTR regarding PM emissions from shipping, including any implemented updates. Furthermore, it is also considered important, now and in the future, to provide internationally accessible and transparent descriptions of the Dutch methodology. Such a concise (English) documentation was not yet available. Sometimes the PRTR methodology was updated since the original report or protocol was published. In such cases, the change has been documented 1 This is the predecessor of the current Directorate-General Civil Aviation and Maritime Affairs (DGLM)
and if applicable explained by providing reference and/or inclusion of the underlying motivation. This implies that for some specific features e.g. the correction of SO2 emission
due to introduction of low sulphur fuels the current report can be seen as an update of the in-use methodology. As such the report will be presented to the PRTR for discussion and as an optional documentation of the in-use methodology. The report also contains e.g. as a result of a review of recent literature on the impact of fuel quality on emissions, suggestions how the PRTR could be improved. An original contribution in this report is the methodology to consistently estimate emissions from total European inland shipping. Although this methodology is less accurate than the current PRTR approach, it is less data demanding and can be applied to all European countries based on freight statistics. Total PM10 emission in Europe due to inland shipping is estimated
at ~ 7kton/yr making it a minor source. However, locally it can be important. The Netherlands contributes about 15 % to this total. A review of the methodology and underlying data to estimate emissions from inland shipping in the Netherlands show that over time the vessels grow in size and an update of emission factors would be needed as it is currently based on the year 2003 survey. Especially PM10 emission factors for
inland shipping are considered uncertain.
A major achievement under the EMS project was the development of a methodology for estimating emissions from seagoing ships at berth. Accurate estimates of emissions from ships at berth demand reliable knowledge of the fuel consumption while at berth and associated fuel characteristics. Since assured information about energy use and fuel consumption of seagoing ships at berth is scarce, a survey of energy consumption and fuel use on board of 89 seagoing ships was made in 2003 as part of the EMS close cooperation with the Port of Rotterdam. In this report the survey results as well as the emission estimations are compared to the (scarce) information that is available outside the Netherlands. The compiled survey data underlie the current Dutch emission estimation methodology for emissions of ships at berth. As a part of this BOP project this methodology is now also internationally presented and published (Hulskotte and Denier van der Gon 2008, 2009). A remarkable finding from the on-board survey was that in 2003 heavy fuel oil (HFO) was the dominant energy source for ships at berth. The fuel type used in marine engines and the quality of that fuel has a major impact on the amount of PM emitted. Especially the sulphur content and ash content of heavy fuel oil has a large impact on PM emission as well as
Summary
the share of finer PM2.5 in PM10 emissions. In theory the effect
of the composition is covered by the overall emission factor. However, recent regulations e.g. SECA (sulphur emission control areas) zones, cause the fuel quality to change and hence emission factors need to be adjusted. A methodology to adjust the PM emission factors with changing sulphur content is presented in the report as well as a suggestion for adjustment of the current in-use PM2.5 fraction of PM10.
Currently the PRTR uses a PM2.5 fraction of 95% in PM10
whereas recent literature suggests this is an overestimation. Based on the present report the PRTR may consider an adjustment and/or some further study on this subject. Finally, the report notes and discusses new developments such as field measurements of shipping emissions and the use of AIS (automatic identification system) to estimate shipping emissions. Recommendations for further research, based on new developments as well as weaknesses in the current methodologies are discussed in the final section of this report Last but not least it should be stressed that the present report is not a complete documentation of shipping-related emissions in the Netherlands. The goal of BOP is to reduce uncertainties about particulate matter (PM) and hence a complete documentation of all methodologies to estimate all other (non-PM) pollutants from shipping is out of scope of the present report.
Guidance to the reader 11 Chapter 1 provides a description of the various shipping
categories covered in the Dutch Pollutant Release & Transfer Register (PRTR), a listing of the available documentation for the in-use estimation methodologies and an overview of currently estimated emissions from shipping in the Netherlands. The methodology to estimate the emissions of seagoing ships on Dutch territory is discussed in chapter 2. This methodology estimates emissions from shipping on the Dutch part of the continental shelf of the North Sea separately from emissions on other Dutch territory (mainly encompassing manoeuvring towards and in Dutch harbours). A separate chapter (chapter 3) is dedicated to estimating emissions from seagoing ships at berth based on their actual fuel consumption, which is based on a on-board survey, and the fuel type used. Fuel quality has a major impact on the amount of PM emitted. A discussion on the impact of sulphur content and ash content of heavy fuel oil on PM emission and the fraction of PM2.5 in PM10 is presented in chapter 4.
The methodology and underlying data to estimate emissions from inland shipping in the Netherlands are discussed in chapter 5. Next, an emission estimate for European inland shipping is made based on statistics of freight transport in Europe (chapter 6). This estimation approach is less accurate than the methodology presented in chapter 5, but it requires less detailed input data and therefore can be applied to all of Europe. Chapter 6 also presents the spatial distribution of the European emission by inland shipping to facilitate the use in air quality models. Finally, chapter 7 briefly discusses new developments such as field measurements of shipping emissions and the use of AIS (automatic identification system) to estimate shipping emissions. Recommendations for further research, based on new developments as well as weaknesses in the current methodologies are discussed in the final section of this report
Estimation of shipping emissions in the Netherlands 13 Emission factors for the various shipping activities in the
Netherlands have been collected in the framework of the project Emission registration and Monitoring Shipping (EMS). EMS was initiated by DG Goederenvervoer (Directorate-General freight transport1) of the Dutch Ministry of Transport,
Public Works and Water Management as outlined in “ Voortgangsnota Scheepvaart en Milieu” (DGG, 1998). In this chapter we summarize the currently used emission factors and provide reference to the underlying documentation. The primary sources for this summary are listed in Table 1.1. Most of this documentation is in Dutch. However, the methodology to calculate shipping emissions based on the reports in Table 1.1 is briefly described in English by Klein et al. (2007). The Dutch National Emission Inventory has a separate task force “Traffic and Transport” which also covers the emissions of shipping. The shipping-related emission causes, istinguished in the Dutch Pollutant Release & Transfer 1 This is the predecessor of the current Directorate-General Civil Avia-tion and Maritime Affairs (DGLM)
Register (PRTR), are presented in Table 1.2. The calculation methods used by the task force to calculate emissions for the different shipping source categories listed in Table 1.2 are described by Klein et al. (2007). The emission factors used in the calculation methods are mostly based on the results of the EMS project and can be found in the reports listed in Table 1.1.
The Dutch emission registration calculates and reports several emission estimates for the same emission cause listed Table 1.2 depending on the requirements of reporting obligations. Different reporting requirements according to Klein et al. (2007) are:
Actual emissions; The aim of calculating the actual emissions is to determine all emissions from activities within the borders of the Netherlands, including the national portion of the continental shelf.
Estimation of shipping
emissions in the
Netherlands
1
Documentation underlying the calculations of Dutch shipping emissions
Authors Title Year
Hulskotte, J., R. Koch Emissiefactoren zeeschepen (In Dutch). TNO Built
Environ-ment and Geosciences, TNO report R 2000/221, Apeldoorn. 2000
Denier van der Gon, H.A.C.,
Hulskotte, J.H.J., Emissiefactoren voor methaan en lachgas uit de luchtvaart en de scheepvaart (In Dutch)., TNO-report R2003/294. 2002
Oonk, H., J. Hulskotte, R. Koch,
G. Kuipers, J. van Ling Methodiek voor afleiding van emissiefactoren van binnenvaart-schepen (In Dutch), TNO report R2003/437, version 2. 2003a
Oonk, H., J. Hulskotte, R. Koch,
G. Kuipers, J van Ling Emissiefactoren van zeeschepen voor de toepassing in de jaarlijkse emis-sieberekeningen (In Dutch), TNO-report R2003/438, version 2. 2003b
Hulskotte, J., Bolt E., Broekhuizen, D Emissies door verbrandingsmotoren van zeeschepen op het Nederlands Continentaal Plat, EMS protocol, novem-ber 2003. (in Dutch), Ministry of traffic and transport.
2003a
Hulskotte, J., E.W.B. Bolt, D.
Broekhuizen, P. Paffen Protocol voor de berekening van emissies door verbrand-ingsmotoren van binnenvaartschepen, Adviesdienst Ver-keer en Vervoer (AVV), Rotterdam. (In Dutch).
2003b
Hulskotte, J. Protocol voor de vaststelling van het brandstofgebruik en de broeikasgasemissies van de visserij in Nederland conform de IPCC-richtlijnen (In Dutch). TNO-report 3 2004/391.
2004
Klein, J., A. Hoen, J. Hulskotte, N. van
Duyn-hoven, R. Smit, A. Hensema, D. BroekhuizenMethods for calculating the emissions of transport in the Neth-erlands, task force Traffic and Transport of the National Emis-sion Inventory, October 2007, CBS, Voorburg.
2007
Shipping emission sources, categorised by the Dutch Pollutant Release & Transfer Register (PRTR)
Source category Detailed emission cause
Inland shipping Exhaust gas, inland shipping national Exhaust gas, inland shipping national, ferries Exhaust gas, inland shipping international Exhaust gas, pleasure craft
Gasoline evaporation and other products, inland shipping, degassinga)
Seagoing ships Exhaust gas, seagoing ships, manoeuvring in and towards Dutch harbours Exhaust gas, seagoing ships, Dutch continental shelf
Exhaust gas, seagoing ships at berth
Fisheriesa) Exhaust gas, national inland and sea shore fisheries
a)Not covered in current report
Table 1.2
Current emissions of PM10, NOx, SO2 and NMVOC reported by the Dutch Pollutant Release & Transfer
Register (PRTR) differentiated by shipping category (PRTR, 2009
Emission cause 1990 1995 2000 2005 2006 2007 2008
PM10 (103 kg)
Inland shipping national; push navigation 15 20 24 40 44 44 44
Inland shipping national 218 214 290 262 241 241 241
Inland shipping international; push navigation 85 108 105 130 133 133 133
inland shipping international 868 833 748 577 551 551 551
Inland shipping national, ferries 125 144 144 144 144 144 144
Pleasure craft 48 52 54 53 52 52 52
National inland and sea shore fisheries 390 433 378 265 264 253 243
Seagoing ships, Dutch continental shelf 5198 5335 6491 6499 6813 7109 7109
Seagoing ships at berth 193 199 283 319 334 351 351
Seagoing ships, manoeuvring in and
towards Dutch harbours 744 769 949 792 842 892 892
NOx (103 kg)
Inland shipping national; push navigation 4505 4255 6461 6432 6021 6021 6021
Inland shipping national 1566 1800 1800 1800 1800 1800 1800
Inland shipping international; push navigation 370.7 393 524.7 986.5 1097 1097 1097
inland shipping international 2135 2151 2346 3190 3315 3315 3315
Inland shipping national, ferries 20210 16580 16690 14190 13770 13770 13770
Pleasure craft 1922 2080 2200 2203 2217 2232 2232
National inland and sea shore fisheries 16450 18240 15910 11150 11110 10680 10250
Seagoing ships, Dutch continental shelf 75680 77670 94400 105700 111500 117000 117000
Seagoing ships at berth 3813 3940 5313 5969 6259 6497 6497
Seagoing ships, manoeuvring in and
towards Dutch harbours 8966 9265 11130 12080 12850 13610 13610
SO2 (103 kg)
Inland shipping national; push navigation 132 159 174 236 245 245 245
Inland shipping national 304 315 478 476 446 446 446
Inland shipping international; push navigation 107 123 123 123 123 109 68
inland shipping international 23 29 39 73 81 81 81
Inland shipping national, ferries 1263 1225 1235 1050 1019 1019 1019
Pleasure craft 55 59 61 59 59 53 33
National inland and sea shore fisheries 954 1057 922 646 644 550 330
Seagoing ships, Dutch continental shelf 44330 45500 55400 53790 56270 58600 58600
Seagoing ships at berth 2431 2512 3751 4169 4372 4593 4593
Seagoing ships, manoeuvring in and
towards Dutch harbours 4975 5142 6302 5860 6227 6583 6583
NMVOC (103 kg)
Inland shipping national; push navigation 122 146 139 165 166 166 166
Inland shipping national 362 288 383 332 302 302 302
Inland shipping international; push navigation 1311 1123 989 732 690 690 690
inland shipping international 22 27 31 51 55 55 55
Inland shipping national, ferries 180 207 207 207 207 207 207
Pleasure craft 3273 3656 3737 3288 3120 2947 2947
National inland and sea shore fisheries 723 801 699 490 488 469 450
Seagoing ships, Dutch continental shelf 2239 2298 2794 3031 3194 3347 3347
Seagoing ships at berth 175 181 235 266 279 291 291
Seagoing ships, manoeuvring in and
towards Dutch harbours 319 329 395 406 432 452 452
Estimation of shipping emissions in the Netherlands 15
IPCC emissions; The IPCC emissions are the Dutch emissions of greenhouse gases as reported to the United Nations and the European Union. Various aspects of this process take place due to the reporting obligations of the UN Framework Convention on Climate Change (UNFCCC) and the EU Greenhouse Gas Monitoring Mechanism. The emissions are calculated according to the IPCC regulations. The IPCC (Intergovernmental Panel on Climate Change) provides the scientific supervision of the implementation of the Kyoto Protocol.
NEC emissions; In 2001, the European Parliament and the Council of Europe approved a Directive concerning national emission ceilings for trans-border air pollution which contributes to acidification, soil eutrophication and tropospheric ozone formation. This Directive is referred to as the NEC Directive (National Emission Ceilings). When ascertaining the national emission ceilings according to this Directive, the contribution of seagoing shipping is not taken into account. Otherwise, the calculations are in accordance with the calculations of the actual emissions.
Actual emissions are needed to access air quality in the Netherlands; therefore this report focuses on the estimation methodologies for actual emissions of inland shipping and seagoing ships. This includes the international shipping emissions on all Dutch territory, which includes the Dutch part of the continental shelf of the North Sea (NCP). Emissions on NCP are reported as a separate category due to the location and magnitude of the emissions.
Emission registration is an on-going activity and new developments and insights are being incorporated as they become available. The current estimate of shipping-related emissions of PM10, NOx, SO2 and NMVOC by the PRTR is
presented in Table 1.3. The Netherlands is a coastal country with major ports like Rotterdam and Amsterdam. Hence the share of shipping on Dutch territory in total Dutch emissions is significant, especially for SO2, NOx and PM10. For 2008
shipping contributed 53%, 31% en 19% to total Dutch SO2, NOx
and PM10 emissions, respectively. The majority of this emission
(> 80%) occurs on the NCP (CBS, 2009).
The data presented in Table 1.3 represent a “snapshot” of the current state of knowledge concerning shipping emissions in the Netherlands. The methodologies to estimate the separate shipping emission categories are discussed in the next chapters. The focus is on PM emissions, as this report is a part of the BOP programme, but where available emissions and emission factors for other pollutants are given for completeness.
This study was conducted under the auspices of the Nether-lands Research Program on Particulate Matter (BOP), a national programme on PM10 and PM2.5 funded by the Netherlands
Minis-try of Housing, Spatial planning and the Environment (VROM). The programme is a framework of cooperation, involving four Dutch institutes: the Energy research Centre of the Netherlands (ECN), the Netherlands Environmental Assessment Agency (PBL), the Environment and Safety Division of the National Insti-tute for Public Health and the Environment (RIVM), and TNO Built Environment and Geosciences.
The goal of the BOP programme is to reduce uncertainties about particulate matter (PM) and the number of policy dilem-mas which complicate development and implementation of adequate policy measures. Uncertainties concerning health aspects of PM are not explicitly addressed.
The approach for dealing with these objectives is through integration of mass and composition measurements of PM10 and
PM2.5. emission studies and model development. In addition,
dedicated measurement campaigns were conducted to research specific PM topics.
The results from the BOP research programme are published in a special series of reports. The subjects in this series, in general terms, are: sea salt, mineral dust, secondary inorganic aerosol, elemental and organic carbon (EC/OC), and mass closure and source apportionment. Some BOP reports concern specific PM topics: shipping emissions (this report), PM trend, urban background, EC and OC emissions from traffic, and attainability of PM2.5 standards. Technical details of the research programme
are condensed in two background documents; one on measure-ments and one on model developmeasure-ments. In addition, all results are combined in a special summary for policymakers.
Emissions from seagoing vessels in Dutch territorial waters 17 Maritime navigation is often referred to as international
shipping, but, strictly speaking, international shipping can also involve international inland shipping. This chapter refers to emission estimation methodologies for seagoing vessels only. The Dutch methodology for determining the emission factors of seagoing vessels has been described in the EMS protocol for seagoing vessels (Hulskotte et al., 2003a; Hulskotte and Denier van der Gon, 2009) and partly based on Oonk et al. (2003b). The Dutch methodology was previously summarised in English by Klein et al. (2007), and treated in more detail in the current report. The Dutch PRTR divides emissions from seagoing vessels into the following categories:
Seagoing vessels on the Dutch continental shelf; Seagoing vessels travelling and manoeuvring in Dutch
territorial waters, except on the Dutch continental self; Seagoing vessels anchored in ports (in berths).
The methodology for seagoing vessels anchored in ports is described in Chapter 3.
The method for determining emissions from sailing and manoeuvring with seagoing vessels in Dutch territorial waters was mainly derived from the method for seagoing vessels sailing the Dutch continental shelf. Therefore, this emission calculation method is presented first.
2.1 Seagoing vessels on the Dutch continental shelf
The calculation method used has been described in general terms in the EMEP/CORINAIR Emission Inventory Guidebook (EEA, 2000), under the heading ‘ship movement methodology’. This means that ship movement data (i.e. ships travelling distances) are used as activity data, instead of for instance fuel consumption data. Additional emission factors per travelling distance are derived for individual ships from technical data from the Lloyd’s register of shipping information. Most important input parameters are the design speed of the ship and the maximum continuous rating (MCR) of the main propulsion engine(s). Based on the assumption that the ship can maintain the design speed at 85% of the MCR, the energy consumption per distance sailed can becalculated. Emission factors per amount of energy on behalf of the EMS were derived by Oonk et al. (2003b).
In these emission factors distinction is made between two fuel types (distillate and residual fuel), the engine characteristics (two- or four-stroke, or steam or gas turbine) and the engine’s year of manufacture. Therefore, to derive emission factors per individual ship, additional information is required about fuel type, engine type and year of manufacture. For the fuel type, a generic algorithm is used, based on engine power, engine type and engine speed. The installed engine type is in most cases available from the database or can be derived from the manufacturer’s information. The year of manufacture can be either directly taken from the database or assumed to equal the age of the ship. Finally, emission factors are available for distances travelled, for each ship, from which emissions can be calculated by combining these factors with data on travelling distances for each ship, in a certain year, on the Dutch continental shelf.
For each of these categories, a distinction is made between main engines and auxiliary engines. Main engines are intended for propelling the vessel. Auxiliary engines are required for manoeuvring (bow propeller engines) and generating electricity for operations, such as loading and unloading, and housing workers or passengers (in the case of ferries).
For each year, Tables 2.1 and 2.2 show the average derived emission factors for seagoing vessels, expressed in grams per kWh. For completeness, the emission factors for ships propelled by gas turbines and steam engines are presented in Table 2.3. PM emissions are fuel type dependent and data is provided for Heavy Fuel Oil (HFO) and Marine Diesel Oil (MDO) in Tables 2.1 to 2.3.
2.1.1 NOx Emission factors from 2000 onwards
The NOx emissions are regulated according to the IMO
(International Maritime Organization) guidelines and NOx
technical code. The NOx emission factor depends on the
engine’s revolutions per minute (rpm) and is presented for
Emissions from
seagoing vessels in
various rpm categories in Table 2.4. It is assumed that the emission factors of NOx are 85% of the IMO limit value for
each individual ship.
2.2 Seagoing vessels sailing Dutch territorial waters
(excluding the Dutch continental shelf)
In this report, the term Dutch territorial waters does not apply to the Dutch continental shelf although strictly speaking this is also Dutch territory. In the EMS, distinct methods were derived for seagoing vessels sailing Dutch territorial waters. This was necessary because the Lloyd’s data on ship travels contains no exact information on port of origin or destination, and because in the calculation method the effect of travelling at reduced speeds had to be incorporated. The
miles travelled at reduced speeds depend specifically on the route to port, the ship’s volume and normal cruising speed on open sea. Furthermore, the manoeuvring time in ports depends on port layout and ship characteristics. This needed to be incorporated in the model to estimate emissions during manoeuvring.
2.2.1 Activity data
The activity data used to calculate emission in national territorial waters were number of berths per ship category (8 types; Table 2.5) for a selected number of ports responsible for more than 99 percent of freight from seagoing vessels in the Netherlands. The eight ship types were stratified in 8 or 9 ship volume ranges, expressed in Gross tonnage GT) (Table 2.6). The emission factors presented in Tables 2.1 to 2.3 were
Emission factors for low-speed engines (two-stroke engines)
Year of
manufacture HC CO NOx
PM
(HFO)a) PM (MDO) Fuel Cons.
(g/kWh) < 1974 0.6 3.0 16 1.7 0.5 210 1975-1979 0.6 3.0 18 1.7 0.5 200 1980-1984 0.6 3.0 19 1.7 0.5 190 1985-1989 0.6 2.5 20 1.7 0.5 180 1990-1994 0.5 2.0 18 1.7 0.4 175 1995-1999 0.4 2.0 15 1.5 0.3 170 2000 0.3 2.0 Table 6 1.5 0.3 168
Source: Oonk et al. (2003b)
a) Note: the current in-use PM emission factor is ~ 25% lower based on Duyzer et al. (2007a), see section 2.4.
Table 2.1
Emission factors for medium and high-speed engines (four-stroke engines)
Year of
manufacture HC CO NOx
PM
(HFO) PM (MDO) Fuel Cons.
(g/kWh) < 1974 0.6 3.0 12 0.8 0.5 225 1975-1979 0.6 3.0 14 0.8 0.5 215 1980-1984 0.6 3.0 15 0.8 0.5 205 1985-1989 0.6 2.5 16 0.8 0.5 195 1990-1994 0.5 2.0 14 0.8 0.4 190 1995-1999 0.4 2.0 11 0.7 0.3 185 2000 0.3 2.0 Table 6 0.7 0.3 183
Source: Oonk et al. (2003b)
Table 2.2
Emission factors for ships propelled by gas turbines and steam engines (kg/tonne fuel)
HC CO NO(HFO)x NO(MDO)x PM (HFO) PM (MDO)
ST 0.2 0.5 3.3 7 2.5 2.1
TB 0.1 0.5 16 1.1
Source: Hulskotte and Koch (2000)
Table 2.3
IMO limit values and NOx emission factors for seagoing vessels
revolutions per minute (rpm) IMO limit value (g/kWh) NOx emission
a) (g/kWh) NOx emission a) (kg/tonne fuel) < 130 rpm 17.0 14.5 79 130 - 2000 rpm 45 · n-0.2 b) 38 · n-0.2 b) 42-79 > 2000 rpm 9.8 8.3 42
a) Oonk et al., 2003b (assuming 184 g fuel used per kWh) b) n = value of rpm for the engine of a particular ship
Emissions from seagoing vessels in Dutch territorial waters 19 transformed from g/kWh to kg/GT.km to match these activity
data (Table 2.7).
2.2.2 Emission factors per distance travelled
Main engine emission factors that were applied in the calculation of emissions for ships in Dutch territorial waters, were derived from the emission factors of individual ships sailing the Dutch continental shelf in 2004. The emission factors, divided according to the specifications in Tables 7 and 8, are presented in Table 2.7. The emission factors per unit of GT differed widely (Table 2.7) and no linear relationship between GT and emission existed. Therefore, models that apply average ship volumes in order to calculate emissions may well end up with erroneous results.
The emission factors (Table 2.8) applied in the emission calculations for ships in Dutch territorial waters were derived from the emission factors for auxiliary engines of individual ships sailing the Dutch continental shelf in 2004.
Emission factors for auxiliary engines were taken as full engine loads from ‘First Aux’, which is the most important auxiliary engine aboard a particular ship, and which is always running. The assumption to base emission factors on full engine loads of the ‘First Aux’ is rather arbitrary, but a better documented alternative is presently not available.
The application of the emission factors of Tables 2.7 and 2.8 depended on the phase of the ships movements towards the port. The calculation of emissions for those different phases is described in the next sections.
2.2.3 Emission modelling of seagoing vessels at cruising speeds
The simplest cases are those in which ships are travelling at cruising speeds towards one of the ports. In such cases, the emission per ship type can be calculated, thus:
Emission = 2 x (Number of ships) x (ship’s Volume) x (Distance on Cruising speed) x (Emission factor)
Because it was assumed that each seagoing vessel would take the same route going back, the emissions were multiplied by two. In the EMS, the ‘Distance on cruising speed’ depends on the specific port and the individual ship (separate table in the EMA protocol (Hulskotte et al., 2003b; Table B.3 not shown in this report).
2.2.4 Modelling of seagoing vessels at reduced speeds
Somewhat more complicated are calculations for seagoing vessels travelling at reduced speeds. In such calculations, two corrections are necessary. The first correction is that in energy consumption, because of the diminished engine power at lower speeds. The second correction is for the change in emission factors at diminished engine loads.
Emission = 2 x (Number of ships) x (ship’s Volume) x (Distance on Cruising speed) x (Emission factor) x (correction factor energy consumption) x (correction factor emission factors)
For tables with correction factors for energy consumption and for emission factors used in the above equation, we refer to the EMS protocol (Hulskotte et al., 2003b).
2.2.5 Modelling of manoeuvring seagoing vessels
During manoeuvring a ship’s travelling speed is almost zero while it is slowly moving ahead, backwards or sideways. In the modelling of emissions while manoeuvring, this phenomenon is solved by estimating the ship’s power consumption as a fraction of the power consumption at sea. Because the ship’s travelling speed at sea is known, multiplication of this speed with fractions of power consumption delivers conversion factors for the emission factors at sea, from the dimension kg/GT.km to kg/GT.hour. The emissions while manoeuvring can be calculated by estimating the duration (in hours) of
Types of seagoing vessels discerned in EMS
Ship type
Oil tankers Other tankers Bulk carriers Container ships Conventional Cargo ships Ferries and RORO ships Reefers
Other ships
Average ship on the Western Scheldt
Table 2.5
Sizes of seagoing vessels discerned in EMS, (GT)
Ship sizes 100 – 499 500 – 999 1000 – 1599 1600 – 9999 10000 – 29999 29999 – 59999 60000 – 99999 > 100000 Table 2.6
Basic emission factors for main engines, (kg/GT.km)
Type of ship from GT to GT CO2 NOx PM SO2 CO VOC
Oil tankers 100 - 499 1.85E-02 4.83E-04 2.39E-05 1.96E-04 7.99E-05 1.75E-05
Oil tankers 500 - 999 2.30E-02 4.31E-04 2.53E-05 2.22E-04 9.70E-05 1.94E-05
Oil tankers 1000 - 1599 1.29E-02 2.82E-04 1.16E-05 9.63E-05 5.01E-05 1.05E-05
Oil tankers 1600 - 9999 1.30E-02 3.12E-04 2.54E-05 2.37E-04 5.86E-05 1.22E-05
Oil tankers 10000 - 29999 7.98E-03 2.49E-04 1.53E-05 1.28E-04 3.58E-05 7.83E-06
Oil tankers 29999 - 59999 3.96E-03 1.17E-04 6.85E-06 5.86E-05 1.51E-05 3.03E-06
Oil tankers 60000 - 99999 3.29E-03 9.36E-05 4.99E-06 4.36E-05 1.24E-05 2.27E-06
Oil tankers 100000 - 999999 2.55E-03 7.47E-05 3.84E-06 3.32E-05 9.73E-06 1.88E-06
Other tankers 100 - 499 2.51E-02 5.20E-04 2.22E-05 1.76E-04 1.06E-04 2.12E-05
Other tankers 500 - 999 2.11E-02 4.24E-04 1.56E-05 1.12E-04 8.98E-05 1.82E-05
Other tankers 1000 - 1599 1.63E-02 3.67E-04 2.03E-05 1.79E-04 6.10E-05 1.28E-05
Other tankers 1600 - 9999 1.22E-02 2.78E-04 1.59E-05 1.44E-04 4.54E-05 9.05E-06
Other tankers 10000 - 29999 7.23E-03 1.98E-04 1.04E-05 9.08E-05 2.76E-05 5.21E-06
Other tankers 29999 - 59999 4.36E-03 1.29E-04 7.59E-06 6.55E-05 1.73E-05 3.31E-06
Other tankers 60000 - 99999 4.64E-03 1.21E-04 3.98E-06 3.51E-05 1.67E-05 2.80E-06
Bulk carriers 100 - 499 2.19E-02 4.60E-04 2.82E-05 2.52E-04 9.67E-05 1.93E-05
Bulk carriers 500 - 999 1.54E-02 3.12E-04 1.06E-05 7.84E-05 5.84E-05 1.30E-05
Bulk carriers 1000 - 1599 1.48E-02 3.30E-04 2.07E-05 1.88E-04 6.25E-05 1.28E-05
Bulk carriers 1600 - 9999 1.03E-02 2.75E-04 1.93E-05 1.72E-04 4.42E-05 9.13E-06
Bulk carriers 10000 - 29999 7.21E-03 2.15E-04 1.33E-05 1.16E-04 3.18E-05 6.51E-06
Bulk carriers 29999 - 59999 4.58E-03 1.36E-04 7.78E-06 6.75E-05 1.89E-05 3.70E-06
Bulk carriers 60000 - 99999 3.23E-03 9.56E-05 5.95E-06 5.19E-05 1.30E-05 2.59E-06
Bulk carriers 100000 - 999999 2.16E-03 6.73E-05 4.37E-06 3.69E-05 8.84E-06 1.94E-06
Container ships 500 - 999 1.44E-02 3.75E-04 1.17E-05 7.32E-05 5.87E-05 1.41E-05
Container ships 1000 - 1599 1.72E-02 3.48E-04 1.59E-05 1.47E-04 6.01E-05 1.25E-05
Container ships 1600 - 9999 1.45E-02 2.91E-04 1.11E-05 1.04E-04 5.08E-05 8.97E-06
Container ships 10000 - 29999 9.39E-03 2.71E-04 1.37E-05 1.20E-04 3.72E-05 7.14E-06
Container ships 29999 - 59999 8.15E-03 2.42E-04 1.47E-05 1.28E-04 3.26E-05 6.54E-06
Container ships 60000 - 99999 7.54E-03 2.06E-04 9.03E-06 8.06E-05 2.83E-05 4.56E-06
Conventional Cargo ships 100 - 499 2.60E-02 5.96E-04 2.28E-05 1.69E-04 1.09E-04 2.36E-05
Conventional Cargo ships 500 - 999 1.51E-02 3.32E-04 1.13E-05 8.50E-05 6.03E-05 1.28E-05
Conventional Cargo ships 1000 - 1599 1.51E-02 3.19E-04 1.34E-05 1.16E-04 5.65E-05 1.16E-05
Conventional Cargo ships 1600 - 9999 1.32E-02 2.99E-04 1.84E-05 1.68E-04 5.03E-05 9.87E-06
Conventional Cargo ships 10000 - 29999 8.39E-03 2.41E-04 1.52E-05 1.33E-04 3.44E-05 6.92E-06
Conventional Cargo ships 29999 - 59999 5.64E-03 1.59E-04 1.12E-05 9.90E-05 2.25E-05 4.16E-06
Ferries and RORO ships 100 - 499 4.00E-02 8.58E-04 4.88E-05 3.58E-04 1.68E-04 3.41E-05
Ferries and RORO ships 500 - 999 6.25E-02 1.32E-03 1.19E-04 1.04E-03 2.78E-04 5.56E-05
Ferries and RORO ships 1000 - 1599 1.44E-02 3.29E-04 1.66E-05 1.38E-04 5.67E-05 1.25E-05
Ferries and RORO ships 1600 - 9999 1.11E-02 2.54E-04 1.68E-05 1.52E-04 4.29E-05 9.25E-06
Ferries and RORO ships 10000 - 29999 9.14E-03 1.79E-04 1.44E-05 1.45E-04 3.27E-05 6.40E-06
Ferries and RORO ships 29999 - 59999 4.71E-03 1.22E-04 6.82E-06 5.99E-05 1.87E-05 3.46E-06
Ferries and RORO ships 60000 - 99999 5.41E-03 1.05E-04 5.28E-06 5.60E-05 1.28E-05 2.25E-06
Ferries and RORO ships 100000 - 999999 6.88E-03 7.67E-05 1.72E-06 3.49E-05 7.81E-06 1.37E-06
Reefers 100 - 499 3.00E-02 6.11E-04 2.09E-05 1.52E-04 1.27E-04 2.55E-05
Reefers 500 - 999 2.52E-02 5.16E-04 3.14E-05 2.80E-04 1.12E-04 2.23E-05
Reefers 1000 - 1599 1.67E-02 4.44E-04 2.69E-05 2.30E-04 7.12E-05 1.55E-05
Reefers 1600 - 9999 1.43E-02 4.18E-04 2.64E-05 2.23E-04 5.96E-05 1.31E-05
Reefers 10000 - 29999 1.26E-02 3.84E-04 2.66E-05 2.30E-04 5.41E-05 1.16E-05
Other ships 100 - 499 1.16E-01 2.34E-03 9.19E-05 7.29E-04 4.81E-04 9.53E-05
Other ships 500 - 999 4.82E-02 1.11E-03 4.05E-05 2.79E-04 2.09E-04 4.35E-05
Other ships 1000 - 1599 2.26E-02 5.14E-04 1.86E-05 1.45E-04 8.89E-05 1.90E-05
Other ships 1600 - 9999 1.44E-02 3.00E-04 1.12E-05 9.33E-05 5.70E-05 1.13E-05
Other ships 10000 - 29999 1.07E-02 2.61E-04 1.42E-05 1.26E-04 4.51E-05 9.34E-06
Other ships 29999 - 59999 7.29E-03 2.08E-04 1.21E-05 1.08E-04 3.27E-05 6.89E-06
Other ships 60000 - 99999 2.12E-03 4.13E-05 3.09E-06 2.83E-05 8.08E-06 1.62E-06
Other ships 100000 - 999999 5.52E-03 9.35E-05 3.90E-06 2.80E-05 2.34E-05 4.67E-06
Average ship on Western Scheldt 100 - 999999 8.13E-03 2.10E-04 1.52E-05 1.07E-04 3.19E-05 6.24E-06
Emissions from seagoing vessels in Dutch territorial waters 21
Basic emission factors for auxiliary engines, (kg/GT.km)
Type of ship from GT to GT CO2 NOx PM SO2 CO VOS
Oil tankers 100 - 499 1.59E-03 3.60E-05 1.21E-06 8.08E-06 6.78E-06 1.46E-06
Oil tankers 500 - 999 1.67E-03 3.21E-05 1.15E-06 8.48E-06 7.01E-06 1.40E-06
Oil tankers 1000 - 1599 1.05E-03 2.35E-05 7.23E-07 5.35E-06 4.12E-06 8.70E-07
Oil tankers 1600 - 9999 9.67E-04 2.32E-05 7.60E-07 4.91E-06 4.32E-06 9.12E-07
Oil tankers 10000 - 29999 5.19E-04 1.25E-05 4.00E-07 2.64E-06 2.17E-06 4.80E-07
Oil tankers 29999 - 59999 2.05E-04 4.28E-06 1.21E-07 1.04E-06 7.20E-07 1.41E-07
Oil tankers 60000 - 99999 2.74E-04 5.66E-06 1.60E-07 1.39E-06 9.78E-07 1.91E-07
Oil tankers 100000 - 999999 1.02E-04 2.06E-06 5.78E-08 5.16E-07 3.57E-07 6.63E-08
Other tankers 100 - 499 1.70E-03 3.49E-05 1.22E-06 8.66E-06 7.20E-06 1.45E-06
Other tankers 500 - 999 1.61E-03 3.25E-05 1.16E-06 8.19E-06 6.87E-06 1.39E-06
Other tankers 1000 - 1599 1.74E-03 3.79E-05 1.11E-06 8.85E-06 6.34E-06 1.34E-06
Other tankers 1600 - 9999 1.16E-03 2.42E-05 7.01E-07 5.87E-06 4.24E-06 8.42E-07
Other tankers 10000 - 29999 5.27E-04 1.09E-05 3.10E-07 2.67E-06 1.90E-06 3.57E-07
Other tankers 29999 - 59999 2.81E-04 5.94E-06 1.72E-07 1.43E-06 1.02E-06 1.93E-07
Other tankers 60000 - 99999 3.79E-04 7.34E-06 2.01E-07 1.92E-06 1.31E-06 2.05E-07
Bulk carriers 100 - 499 4.03E-03 6.87E-05 2.85E-06 2.04E-05 1.71E-05 3.41E-06
Bulk carriers 500 - 999 1.36E-03 2.83E-05 9.29E-07 6.91E-06 5.02E-06 1.14E-06
Bulk carriers 1000 - 1599 1.03E-03 2.19E-05 7.09E-07 5.21E-06 4.19E-06 8.66E-07
Bulk carriers 1600 - 9999 6.80E-04 1.52E-05 4.74E-07 3.45E-06 2.66E-06 5.76E-07
Bulk carriers 10000 - 29999 4.04E-04 8.79E-06 2.71E-07 2.05E-06 1.60E-06 3.24E-07
Bulk carriers 29999 - 59999 2.56E-04 5.39E-06 1.58E-07 1.30E-06 9.51E-07 1.84E-07
Bulk carriers 60000 - 99999 1.29E-04 2.69E-06 7.84E-08 6.54E-07 4.77E-07 9.21E-08
Bulk carriers 100000 - 999999 8.50E-05 1.95E-06 5.92E-08 4.32E-07 3.31E-07 7.31E-08
Container ships 500 - 999 1.14E-03 2.97E-05 9.27E-07 5.78E-06 4.63E-06 1.11E-06
Container ships 1000 - 1599 1.75E-03 3.51E-05 9.87E-07 8.87E-06 6.09E-06 1.27E-06
Container ships 1600 - 9999 7.79E-04 1.53E-05 4.26E-07 3.95E-06 2.71E-06 4.96E-07
Container ships 10000 - 29999 4.38E-04 9.11E-06 2.64E-07 2.22E-06 1.60E-06 3.10E-07
Container ships 29999 - 59999 3.26E-04 6.91E-06 2.04E-07 1.65E-06 1.22E-06 2.42E-07
Container ships 60000 - 99999 3.67E-04 6.99E-06 1.91E-07 1.86E-06 1.27E-06 1.99E-07
Conventional Cargo ships 100 - 499 1.03E-03 2.39E-05 7.78E-07 5.25E-06 4.27E-06 9.41E-07
Conventional Cargo ships 500 - 999 1.18E-03 2.67E-05 8.42E-07 6.00E-06 4.74E-06 1.02E-06
Conventional Cargo ships 1000 - 1599 1.27E-03 2.68E-05 7.96E-07 6.47E-06 4.73E-06 9.65E-07
Conventional Cargo ships 1600 - 9999 7.35E-04 1.51E-05 4.45E-07 3.74E-06 2.72E-06 5.32E-07
Conventional Cargo ships 10000 - 29999 4.43E-04 9.74E-06 2.97E-07 2.25E-06 1.71E-06 3.53E-07
Conventional Cargo ships 29999 - 59999 3.35E-04 6.66E-06 1.96E-07 1.70E-06 1.23E-06 2.30E-07
Ferries and RORO ships 100 - 499 1.49E-03 2.93E-05 1.08E-06 7.59E-06 6.29E-06 1.29E-06
Ferries and RORO ships 500 - 999 2.41E-03 5.19E-05 1.81E-06 1.22E-05 1.09E-05 2.17E-06
Ferries and RORO ships 1000 - 1599 1.07E-03 2.40E-05 7.42E-07 5.46E-06 4.23E-06 9.15E-07
Ferries and RORO ships 1600 - 9999 8.15E-04 1.80E-05 5.51E-07 4.14E-06 3.13E-06 6.78E-07
Ferries and RORO ships 10000 - 29999 5.41E-04 1.08E-05 3.39E-07 2.75E-06 2.07E-06 4.10E-07
Ferries and RORO ships 29999 - 59999 2.97E-04 6.32E-06 1.88E-07 1.51E-06 1.14E-06 2.15E-07
Ferries and RORO ships 60000 - 99999 3.89E-04 7.96E-06 2.27E-07 1.98E-06 1.41E-06 2.55E-07
Ferries and RORO ships 100000 - 999999 4.51E-04 8.59E-06 2.34E-07 2.29E-06 1.56E-06 2.47E-07
Reefers 100 - 499 2.90E-03 5.87E-05 1.97E-06 1.47E-05 1.21E-05 2.42E-06
Reefers 500 - 999 2.64E-03 5.10E-05 1.92E-06 1.34E-05 1.15E-05 2.31E-06
Reefers 1000 - 1599 1.66E-03 3.84E-05 1.22E-06 8.45E-06 6.83E-06 1.49E-06
Reefers 1600 - 9999 9.84E-04 2.28E-05 6.98E-07 5.00E-06 3.83E-06 8.55E-07
Reefers 10000 - 29999 7.21E-04 1.60E-05 5.03E-07 3.66E-06 2.84E-06 6.10E-07
Other ships 100 - 499 9.15E-03 1.81E-04 6.15E-06 4.65E-05 3.73E-05 7.27E-06
Other ships 500 - 999 4.54E-03 1.01E-04 3.19E-06 2.30E-05 1.85E-05 3.91E-06
Other ships 1000 - 1599 3.89E-03 8.79E-05 2.65E-06 1.98E-05 1.46E-05 3.20E-06
Other ships 1600 - 9999 2.36E-03 4.77E-05 1.42E-06 1.20E-05 8.82E-06 1.74E-06
Other ships 10000 - 29999 1.10E-03 2.41E-05 7.38E-07 5.58E-06 4.31E-06 8.57E-07
Other ships 29999 - 59999 2.40E-04 5.22E-06 1.73E-07 1.22E-06 9.96E-07 2.07E-07
Other ships 60000 - 99999 2.08E-04 4.24E-06 1.45E-07 1.06E-06 8.85E-07 1.77E-07
Other ships 100000 - 999999 1.44E-03 2.44E-05 1.02E-06 7.33E-06 6.11E-06 1.22E-06
Average ship on Western Scheldt 100 - 999999 5.17E-04 1.09E-05 3.24E-07 2.63E-06 1.94E-06 3.84E-07
the ships manoeuvring, depending on the type of ship and volume, in combination with the specific port layout.
Emission = 2 x (Number of ships) x (ship’s Volume) x (Time for manoeuvring) x (Emission factor) x (conversion factor to kg/ GT.hour) x (correction factor emission factors)
The conversion factor to kg/GT.hour and correction factor mentioned above are provided in the EMS protocol (Hulskotte et al., 2003b). In the EMS, the ‘Time for
manoeuvring’ depends on the specific port and the specific ship (Hulskotte et al., 2003b; Table B.3 which is not shown in this report).
2.3 The Dutch EMS approach for seagoing
vessels from a European perspective
The following different European methodologies for estimating emissions from seagoing vessels have been evaluated by Gommers et al. (2007): MEET
The European project ‘Methodologies for estimating air pollutant emissions from transport (MEET)’ describes a methodology for calculating the emissions from seagoing vessels, among the methodologies for the other transport modes (MEET, 1999).
ENTEC
ENTEC UK Limited conducted a study on behalf of the European Commission, to quantify among other things ship emissions of SO2, NO , CO2 and hydrocarbons, for the year
2000, in the North Sea, the Irish Sea, the English Channel, the Baltic Sea and the Mediterranean. For the pollutant PM, they have only quantified the in-port emissions (manoeuvring, loading/unloading and hotelling) (ENTEC, 2002).
EMS
The project ‘Emission registration and monitoring for shipping (EMS) (Emissieregistratie en Monitoring Scheepvaart) was carried out by the Dutch advisory service for traffic and transport (DVS) (formerly known as Adviesdienst
Verkeer en Vervoer (AVV) (head performer), by order of the Directorate-General for freight transport (Directoraat-Generaal
Goederenvervoer (DGG)). The aim of the project was to
(better) map the different emissions from seagoing vessels en inland shipping for the Netherlands (AVV et al., 2003).
TREMOVE
Transport & Mobility Leuven has included maritime shipping in their transport model TREMOVE’. The model calculates the emissions from seagoing vessels with the methodology that was set up by ENTEC.
TRENDS
TRENDS stands for TRansport and ENvironment Database System (EC, 2003). The authors of TRENDS set up a methodology for determining the emissions from the four most important transport modes (road transport, railways, shipping, aviation). The module in the study ‘Energy Consumption and Air Pollutant Emissions from Rail and Maritime Transport’ (ARTEMIS; Georgakaki, 2003) was based on TRENDS. Within ARTEMIS the calculation of emissions from seagoing vessels was based on the TRENDS methodology.
Gommers et al. (2007) analysed the strengths and weaknesses of the various approaches (Table 2.9) and concluded that the methodologies do not pay any attention to the technological evolution of seagoing vessels, with the exception of the EMS approach. Moreover, the EMS approach is considered transparent, and provides a handbook with emission factors. Gommers et al., therefore, selected the EMS approach as a starting point for their MOPSEA project, which estimated Belgian emissions from shipping.
2.4 Comparison of EMS emission factors with
measurements and adjustment of the PM10
emission factor used in the Emission Registration
Current estimates on emission factors of seagoing vessels have been based on a limited number of laboratory experiments and on information on fuel usage and engine power. Especially emission of nitrogen oxides (NOx)1 havebeen reported in literature, measurements of particulate
1 NOxis the sum of concentrations of NO (nitric oxide) and NO2(nitrogen
dioxide).
Strengths and weaknesses of European activity based emission approaches for seagoing vessels
Methodology Strengths Weaknesses
MEET European accepted methodology for
emission inventory (PRTR)
distinction in different navigational stages fishing boats taken into account
good results for long journeys (amount of days)
for short journeys, like Belgian territory too rough no technological evolution taken into account
ENTEC used in Europe as input for policy distinction in different navigational stages emission factors available
fishing boats taken into account
not transparent in input and assumptions, complicating third party-use (outside an European project) ships under 500 GT are not taken into account very detailed division by which the uncertainty on the input parameters increases
no technological evolution taken into account
EMS distinction in different navigational stages
clear handbook available, so reproducible geometry of the harbour taken into account technological evolution taken into account emission factors available in detail
Dutch approach (not European)
TREMOVE analogous ENTEC analogous ENTEC
TRENDS/
ARTEMIS used in a European project common approach by ECno distinction in different navigational stages
Source: Gommers et al., 2007
Emissions from seagoing vessels in Dutch territorial waters 23 matter (PM2) are scarcer. It is important to realise that there
were large variations, especially in emissions of particulate matter, within the results from engines using HFO (Heavy Fuel Oil). These are therefore rather uncertain. In the process of developing scenarios to improve local air quality and decrease atmospheric deposition, accurate data on emissions are essential. In the Netherlands, Duyzer et al. (2007a) developed a method for measuring shipping emissions, which could be a base for validating and (if needed) adjusting emission factors. Our report only presents a summary table (Table 2.10) from their report, which compares emission factors derived from their field measurements with earlier estimates as presented in EMS (Klein et al., 2007).
The field measurements by Duyzer et al. (2007a) did not cover all categories and situations as covered by EMS. The comparison is therefore indicative. The important conclusion from Table 2.10 would be that, overall, the emission factors from both methodologies agree quite well and do not show large deviations. This builds confidence. Uncertainties of the order of 20 to 30% exist, but it is unlikely that the emission estimates are off by more than a factor of 2. However, the lower PM10 emission factor reported by Duyzer et al. (2007a)
for HFO was deemed significantly lower. The in-use PM10
emission factor in the Emission Registration is reduced by ~ 25% based on the results by Duyzer et al. (2007a).
2.5 Recommendations concerning
emissions from seagoing ships
The weakest aspect of the emission calculations for seagoing vessels in Dutch territorial waters other than the Dutch continental shelf, is that these calculations strongly depend on emission factors derived from seagoing vessels travelling on that continental shelf. These emission factors were derived on a ship-by-ship basis and can be assumed to have been relatively accurate at the time of measurement. However, the periodic actualisation remains a weak point; the emission factors were updated only once in 2004. This implies that, in 2009, the set of emission factors which plays a pivotal role in the whole emission estimation methodology is already five years old. Recently (June 2009), a project to update these factors has been commissioned to MARIN and TNO, results are expected by the end of 2009.
2 PM is particulate matter. PM10 is the mass of particles with a diameter
smaller than 10 μm. Similarly, PM2.5 and PM1 indicate particles smaller than
2.5 and 1 μm.
Another shortcoming is the lack of data on energy consumption and fuel use in auxiliary engines of seagoing vessels while they are moving towards or in ports. It is generally known that energy consumption of auxiliary engines is much higher in such situations. This phenomenon, thus far, has been neglected in the EMS protocols and is not accounted for in current emission estimation methodologies. Furthermore the fractionation of PM into different size classes (TSP, PM10 and PM2.5) is uncertain because 1) in the
past PM, TSP and PM10 have sometimes been used without exact definition of the size class included and, 2) simultaneous measurements of PM10 and PM2.5 emission from shipping are
scarce. This aspect is further addressed in chapter 4.
Emission factors of PM and NOx derived from field measurements and EMS
Duyzer et al. (2007) EMS
Four-stroke engines PM1 PM2.5 PM10 PM2.5/PM10 NOx PM10 NOx Fuel-S (g/kg) (%) Fuel (g/kg) S<1% 0.8 1.3 2.5 52 39 MDO 1.6 50 S>1% 1.7 2.9 6.0 48 63 HFO 3.9 Two-stroke engines S<1% 1.1 1.7 3.3 52 39 MDO 1.8 75 S>1% 3.0 3.9 6.5 60 70 HFO 8.8
Source: Duyzer et al. (2007)
Fuel consumption and associated emissions from seagoing vessels in berth, derived from an on-board survey 25
3.1 Introduction
Exhaust emissions from the growing marine transport sector are a significant source of air pollution. As EU land-based emission sources are abating, while shipping emissions remain largely unabated, the relative importance of shipping emissions is rapidly growing. Since many major ports are also major cities, port and near-port emissions from seagoing vessels that influence local air quality may directly affect a large population (Corbett et al., 2007). Emissions from seagoing vessels can be separated in emissions 1) on international waters, 2) on national waters and while manoeuvring in port and, 3) while in berth. Ships in berth are the main source of shipping emissions in ports because the ships typically spend one or more days there, while manoeuvring only takes about two hours. Accurate estimates of emissions from ships in berth demand reliable knowledge of the fuel consumption while in berth and associated fuel characteristics. Fuel quality (e.g. the sulphur content) is an important factor because it largely controls the emission of pollutants, such as SO2 and particulate matter (PM10) (e.g.,
Kasper et al., 2007). A common assumption is that ships are using distillates or fuels with low sulphur content in port areas. This would potentially limit the contribution from shipping to local air pollution, but a sound basis for this important assumption is lacking.
To fill this information gap, we executed a survey of energy consumption and fuel type used, for 89 seagoing vessels, in close cooperation with the Port of Rotterdam. The survey was performed in 2003, and a methodology for calculating
the emissions from ships in berth was described in a protocol that is part of the so-called EMS modelling system (Emission registration and Monitoring of Shipping; Hulskotte et al., 2003a). The EMS modelling system has been used in the Netherlands for calculating annual shipping emissions since 2003. Our report presents the assumptions made in the EMS modelling system concerning the calculation of emissions from ships in berth. Furthermore, we carried out a concise re-evaluation of the basic data that was collected in the survey on the energy consumption by ships in berth, and have provided recommendations for improving the emission inventory methodology of ships in berth.
3.2 Methodology
3.2.1 Questionnaire
We conducted a survey on shipping emissions in the Port of Rotterdam. Two former ship engineers together with the port’s ship safety inspectors went on board of 89 ships to present them with a questionnaire. Explanation for the questionnaire was given in a letter to the captain, together with a written assurance that no identifiable ships data would be published or supplied to third parties. This ensured full cooperation and a 100 per cent response rate. The questionnaire contained questions about general ship characteristics, such as the ship’s name, type, volume, year of manufacture, and IMO number (to access more detailed ship data later). Furthermore, the questionnaire asked for fuel consumption during different ship activities: cruising at open sea, manoeuvring towards port and while in berth (with most emphasis), together with duration of stay in berth. In addition, there were questions on fuel quality and on the type of engine and/or machinery. We aimed to cover the full spectrum of ship types, as well as ship volumes, and succeeded rather well at this (Figure 3.1). However, only
Fuel consumption and
associated emissions
from seagoing vessels
in berth, derived from
an on-board survey
1
3
1 Published as: Hulskotte J.H.J, H.A.C. Denier van der Gon, Emissions From Seagoing Ships At Berth Derived From An On-Board Survey, Atmospheric Environment, Doi: 10.1016/j.atmosenv.2009.10.018, 2009.
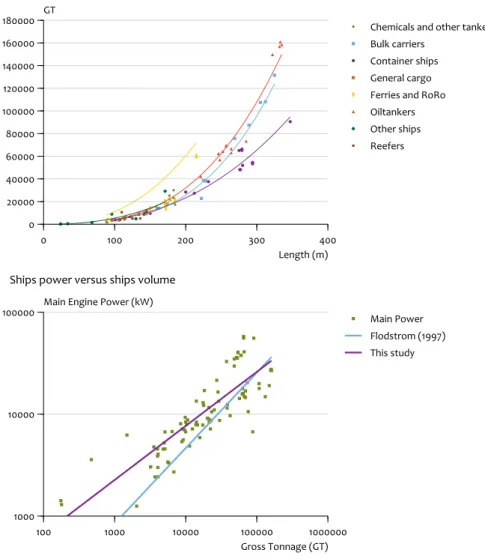
89 ships could be visited, which still implies that some ship types were under-represented. The key variable in describing the variety in ships is Gross Tonnage (GT). A ship volume measured in GT is the function of the ships length to the power of 2.6, which is slightly lower than an expected cubic relationship.
Ship’s available propulsion power is almost proportional to the square root of ship’s volume (see Figure 3.1). In Figure 1b, we also depicted the relationship found by Flodström (1997), which is slightly different because the regression line through our survey data was influenced by the presence of a limited number of small vessels. Bearing this in mind, there is good agreement between the two studies.
3.2.2 Fuel consumption
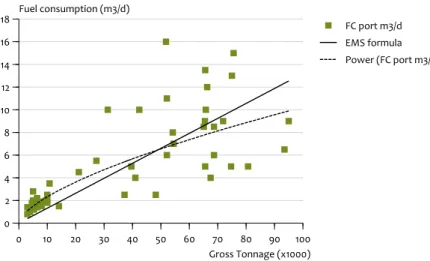
The basic activity data recorded in the PRTR are the number of berths of different ship types which are collected on a regular basis by Statistics Netherlands (2007). The number of berths is specified by ship type and by ship’s volumes measured in GT. These robust activity data were selected to make the emission calculation methodology applicable for
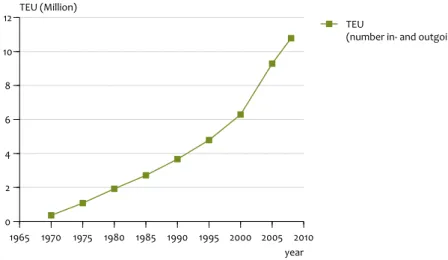
historical years as well as future years. For Figure 3.2, the total fuel use per berth per ship type, based on the ships questionnaire, was plotted as a function of an individual ship’s GT. To have a simple descriptive function, the regression was forced through zero (a ship of 0 GT using 0 kg fuel). Correlation coefficients were rather low, because the number of ships per ship type was sometimes small and the variability in the outcome rather large. Nevertheless, the fuel use rate showed overall the best correlation with GT. It showed much better correlation than, for instance, the amount of auxiliary power available on a ship, which is often applied in other studies (e.g. Whal et al., 2007). For three ship types, the correlation was poor (Figure 3.2; Container ships, General Cargo and “Other”). The weak correlation found for container ships is a serious concern as these ships contribute significantly to the total in emissions, and transport volumes of container ships are rising steeply in Rotterdam with about 6 million TEU in 2000 to 11 million TEU in 2008 (Figure 3.3). The increase in Figure 3 is expressed in the twenty-foot equivalent unit (TEU), representing the cargo capacity of a standard intermodal container.Fortunately, we were able to validate fuel consumption of container ships with an independent
Ship’s volume (GT) versus ship length and ship power versus ship’s volume (GT)
Figure 3.1 0 100 200 300 400 Length (m) 0 20000 40000 60000 80000 100000 120000 140000 160000
180000 GT Chemicals and other tankers
Bulk carriers Container ships General cargo Ferries and RoRo Oiltankers Other ships Reefers Ships length versus ships volume
Ships length versus ships volume and ships power versus ships volume
100 1000 10000 100000 1000000
Gross Tonnage (GT) 1000
10000
100000 Main Engine Power (kW) Main Power
Flodstrom (1997) This study Ships power versus ships volume
Fuel consumption and associated emissions from seagoing vessels in berth, derived from an on-board survey 27 data set. The results of the validation of energy consumption
of container ships are presented in the next section. Next to container ships, two other ship categories (General Cargo and ‘Other’, see Figure 3.2) show a poor relation between fuel use in berth and GT. However, these ship categories are of less concern as they represent a very small fraction of the total fleet and therefore have a minor influence on estimated emissions.
The derived fuel consumption rates while in berth, per ship type, are presented in Table 3.1 (Note; some small rounding errors may be seen between comparing regression coefficients in Figure 3.2 and the data in Table 3.1). The high fuel consumption rate of tankers is explained by the use of considerable amounts of installed power for the purpose of heating crude oil and for unloading operations.
Container ships and General cargo ships often carry a certain percentage of reefer containers that are refrigerated by means of on-board generated electricity. Reefer ships need to refrigerate all of their cargo, explaining the high fuel consumption rate of this ship type. Other ships differ greatly in purpose and shape, but sometimes have specialised equipment which may require extra power generation onboard. The data in Table 3.1 represent the ship category-specific fuel rates used within the EMS framework (Hulskotte
et al., 2003a). 0 10000 20000 30000 GT 0 100 200 300 400 500 600 700 800 Fuel used (kg/hr) Other tankers 0 20000 40000 60000 80000 100000 GT 0 100 200 300 400 500 Fuel used (kg/hr) Container ships 0 50000 100000 150000 GT 0 100 200 300 400 500 600 Fuel used (kg/hr) Bulk carriers 10000 20000 30000 40000 50000 60000 70000 GT 0 100 200 300 400 500 600 Fuel used (kg/hr)
Ferries and RoRo ships
4000 6000 8000 10000 12000 GT 0 50 100 150 200 250 300 350 Fuel used (kg/hr) Reefers 1000 2000 3000 4000 5000 6000 7000 GT 0 10 20 30 40 50 60 Fuel used (kg/hr)
General cargo ships
0 2000 4000 6000 8000 10000 GT 0 50 100 150 200 250 300 350 400 Fuel used (kg/hr) Other 0 50000 100000 150000 200000 GT 0 1000 2000 3000 4000 5000 6000 7000 8000 Fuel used (kg/hr) Oil tankers y = 0.02x R² ⁼ 0.38 y = 0.016xR² ⁼ 0.40 y = 0.005xR² ⁼ -0.92 y = 0.003x R² ⁼ 0.42 y = 0.007x R² ⁼ 0.29 y = 0.024xR² ⁼ 0.88 y = 0.006x R² ⁼ -0.02 y = 0.012xR² ⁼ -0.21
Analysis of fuel rate by ship type as a function of ships volume
Analysis of fuel use rate per ship type, as a function of ship’s volume (GT)