TRENDS IN
GLOBAL
CO
2
EMISSIONS
2013 REPORT
PBL Netherlands Environmental Assessment AgencyMailing address PO Box 30314 2500 GH The Hague The Netherlands Visiting address Oranjebuitensingel 6 2511VE The Hague T +31 (0)70 3288700 www.pbl.nl/en and
European Commission Joint Research Centre
Institute for Environment and Sustainability Mailing address via Fermi, 2749, TP290 21027 Ispra (VA) Italy T +39 0332 78 5831 http://edgar.jrc.ec.europa.eu www.jrc.ec.europa.eu October 2013
BACKGROUND STUDIES
TRENDS IN GLOBAL CO
2
EMISSIONS:
2013 Report
Acknowledgements
This report was drafted with input from many colleagues, gathered over several years. The authors would like to thank Pieter Boot (PBL) for the final review, Laurens Brandes (PBL), Edwin Schaaf (JRC-IES), Gabriel Oreggioni (formerly JRC-IES), Apollonia Miola (JRC-IES) for their input, and Julian Wilson (JRC-IES), Jens Hjorth (JRC-IES), Vangelis Tzimas (JRC-IET), Michel den Elzen (PBL) and Martijn Verdonk (PBL) for their review of an earlier draft. We also like to thank Willem Thomas van Ierland (EC, DG CLIMA), Velina Pendolowska (EC, DG CLIMA), Robert A. Field (University of Wyoming) and Robert Socolow (Princeton University) for their critical review and suggestions.
This publication can be downloaded from: www.pbl.nl/en or edgar.jrc.ec.europa.eu.
Parts of this publication may be reproduced, providing the source is stated, in the form: Oliver JGJ, Janssens-Maenhout G, Muntean M and Peters JAHW (2013), Trends in global CO2 emissions; 2013 Report, The Hague: PBL Netherlands Environmental Assessment Agency; Ispra: Joint Research Centre.
PBL Netherlands Environmental Assessment Agency is the national institute for strategic policy analyses in the fields of the environment, nature and spatial planning. We contribute to improving the quality of political and administrative decision-making, by conducting outlook studies, analyses and evaluations in which an integrated approach is considered paramount. Policy relevance is the prime concern in all our studies. We conduct solicited and unsolicited research that is both independent and always
scientifically sound.
As the European Commission’s in-house science service, the Joint Research Centre’s mission is to provide EU policies with
independent, evidence-based scientific and technical support throughout the whole policy cycle. Working in close cooperation with policy Directorates-General, the JRC addresses key societal challenges while stimulating innovation through developing new methods, tools and standards, and sharing its know-how with the Member States, the scientific community and international partners. Key policy areas include: environment and climate change; energy and transport; agriculture and food security; health and consumer protection; information society and digital agenda; safety and security, including nuclear; all supported through a cross-cutting and multidisciplinary approach.
Trends in global CO2 emissions: 2013 Report
© PBL Netherlands Environmental Assessment Agency The Hague, 2013
ISBN: 978-94-91506-51-2 PBL publication number: 1148 JRC Technical Note number: JRC83593 EUR number: EUR 26098 EN
Corresponding author
greet.maenhout@jrc.ec.europa.eu
Authors
Jos G.J. Olivier (PBL),Greet Janssens-Maenhout (IES-JRC), Marilena Muntean (IES-JRC), Jeroen A.H.W. Peters (PBL)
Responsibility
PBL Netherlands Environmental Assessment Agency Institute for Environment and Sustainability (IES) of the European Commission’s Joint Research Centre (JRC)
Graphics
Beeldredactie PBL
Production coordination
PBL Publishers
Layout
Contents
Summary 4 1 Introduction 6 2 Results 8
2.1 Slowdown in the historical increase in global CO2 emissions 8 2.2 Different trends in the six largest emitting countries/regions 10 2.3 Comparison between emissions in the various countries 15 2.4 Gas flaring emissions 20
2.5 Shale gas and oil production through hydraulic fracturing and oil sands exploitation 21 2.6 Industrial non-combustion sources 25
2.7 Climate change mitigation in the 21st century 26 3 Trends in energy supply and consumption 32 3.1 Introduction 32
3.2 Trends in fossil-fuel consumption and fuel mix 34 3.3 Trends in energy efficiency improvements 34 3.4 Trends in renewable energy sources 36 3.5 Trends in nuclear energy 37
3.6 Carbon capture and storage 39
4 Conclusion: signs of a slowdown in the annual increase in global CO2 42 Annex 46
Annex 1 Methodology and data sources over the 2010–2012 period 46 List of abbreviations and definitions 51
Summary
The increase in global emissions of carbon dioxide (CO2) from fossil-fuel combustion and other smaller industrial sources – the main cause of human-induced global warming – slowed down in 2012, while the global average annual growth rate of 2.4 ppm in atmospheric CO2 concentrations in 2012 was rather high.
Actual global emissions increased by 1.4% over 2011, reaching a total of 34.5 billion tonnes in 2012. After a correction for the leap year 2012, this increase was reduced to only 1.1%, compared with an average annual increase of 2.9% since 2000. The CO2 emission trend mainly reflects energy-related human activities which, over the past decade, were determined by economic growth, particularly in emerging countries. In 2012, a ‘decoupling’ of the increase in CO2 emissions from global economic growth (in GDP) took place, which points to a shift towards less fossil-fuel intensive activities, more use of renewable energy and increased energy saving. Comparing regional CO2 emission trends reveals large differences in underlying causes, which complicates the evaluation of the robustness of observed trends. For 2012, remarkable trends were seen in the top 3 emitting countries/regions, which accounted for 55% of total global CO2 emissions. Of these three, China (29% share) increased its CO2 emissions by 3%, which is low compared with annual increases of about 10% over the last decade. In the United States (16% share) and the European Union (11% share) CO2 emissions decreased by 4% and 1.6%, respectively. In addition, in India and Japan, emissions increased by 7% and 6%, and the Russian Federation
noted a 1% decrease. Although China’s CO2 emissions per capita are comparable to those in the EU and almost half of US emissions per capita, its CO2 emissions per USD in Gross Domestic Product (GDP) are almost double those of the EU and United States and similar to those of the Russian Federation.
China’s large economic stimulus package, intended to avoid a decrease in annual economic growth during the recent global recession, has come to an end. With electricity and energy increases at half the pace of GDP growth, the energy intensity per unit of GDP declined in 2012 by 3.6%, which is twice as fast as in 2011. This slower and structurally changed growth puts the country back on track, in combination with a national energy consumption target for 2015, to meet its 2015 target according to the 12th Five Year Plan, with an almost 17% cumulative reduction in energy intensity per unit of GDP, compared to 2010. China also increased its hydropower capacity and output by 23% in 2012, which had a significant mitigating effect of about 1.5 percentage points on its CO2 emissions in 2012.
In that year, China’s average carbon dioxide emissions of 7.1 tonnes CO2 per capita resulted from a smoothing of their CO2 increase by only 3% after the about 10% annual growth rates of the previous decade. This 2012 increase in fuel consumption was mainly driven by the increase in building construction and expansion of infrastructure, as indicated by the growth in cement and steel production. Although the United States, with 16.4 tonnes CO2 per capita in 2012, showed a decrease in CO2 emissions since
2005, they still ranks among the major industrialised countries with the highest emission levels. In 2012, with an economic growth of 2%, their CO2 emissions decreased by 4%, mainly because of a further fuel shift from coal to gas in the power sector, due to the low gas price. In recent years, the United States expanded shale gas fracturing and has now become the largest natural gas producer in the world. Over the past 5 years, the share of shale gas increased to one third of the total US gross gas production and the share of shale oil in 2012 was almost one quarter of total US crude oil production. The European Union, as a whole, experienced an economic recession in 2012 with the EU27’s GDP declining by 0.3%, compared to 2011, and actual CO2 emissions declining by 1.3%, which is less than the 2011 decrease of 3.1%. The main reasons for this are a decrease in primary energy consumption of oil and gas, by 4% and 2% respectively , a decrease in road freight transport by 4%, and a decrease of 2% in total emissions from power generation and manufacturing installations participating in the EU Emissions Trading System (EU ETS). While the total CO2 emissions from power generation in EU27 decreased by 2.3% in 2012, very different trends were noticed for the different EU Member States, in particular for coal. The use of coal in Europe’s energy mix for electricity production became attractive again. In 2012, increased coal consumption was observed in the United Kingdom (+24%; the highest consumption since 2006), Spain (+24%; the second year with an increase after two years of decreasing consumption), Germany (+4%) and France (+20%), versus decreases in Poland and the Czech Republic of 4% and 8%, respectively.
On a global scale, energy carriers in primary energy supply all showed continuous increases over the past decade, except for nuclear energy, which decreased since 2012 in the aftermath of the Fukushima accident.
Increases in fossil-fuel consumption in 2012 were 2.2% for natural gas, 0.9% for oil products, and 0.6% for coal. This has brought the share of coal combustion in global total CO2 emissions to almost 40%, and the share of coal-fired power plants in CO2 emissions from fossil fuels to 28%. Several measures have been implemented to level off coal use for power generation. Possible alternatives include a shift from coal to gas or renewable energy, converting coal-fired power plants to make them suitable for biomass, and making new coal-fired power plants ready for the use of carbon capture and storage (CCS) technology. However, such changes do not happen overnight.
Since 2002, however, the use of renewable energy has accelerated: the increase in the use of hydropower has accelerated and its output increased by 4.3%, between 2011 and 2012. The share of the ‘new’ renewable energy
sources solar, wind and biofuel also increased with accelerating speed: it took 15 years since 1992 for the share to double from 0.5% to 1.1%, but only 6 more years to do so again, to 2.4% in 2012.
The small increase in emissions in 2012 of 1.1% may be the first sign of a slowdown in the increase in global CO2 emissions, and ultimately of declining global emissions, if (a) China achieves its own target of a maximum level of energy consumption by 2015 and its shift to gas with a natural gas share of 10% by 2020; (b) the United States continues a shift its energy mix towards more gas and renewable energy; and (c) in the European Union, Member States agree on restoring the effectiveness of the EU Emissions Trading System to further reduce actual emissions.
Obviously, it is uncertain how the global society will develop over time and which economic and technological trends will continue; in particular, with respect to global and regional prices of different fossil fuels and the shares of nuclear power and renewable energy sources. However, there is additional uncertainty due to possible major changes in various areas that would have a large impact on global energy use.
For example:
• rising production of shale gas may affect natural gas prices worldwide;
• expansion of intercontinental trade in liquid natural gas (LNG) through increased transport and storage capacity may influence the natural gas markets; • overcapacity and flexibility in the fuel mix for power
generation may cause fast changes in the fuel mix used by utilities, in case of changes in relative prices of gas and coal (as observed in the United States and some European countries);
• the ability of China to smoothly transition towards a more service-based economy;
• a prolonged recession may hinder restoring the functioning of the carbon market of the EU ETS and thus the ability to set and meet more ambitious emission reduction targets.
These preliminary estimates have been made by PBL Netherlands Environmental Assessment Agency and the European Commission’s Joint Research Centre (JRC), on the basis of energy consumption data on 2010 to 2012, as published by energy company BP, and coal consumption data on the 2011–2012 period, published by the National Bureau of Statistics of China (NBS). The estimates are also based on production data for cement, lime, ammonia and steel, as well as on emissions per country, from 1970 to 2010, from the Emission Database for Global Atmospheric Research (EDGAR) version 4.2 FT 2010, which is a joint project of JRC and PBL.
ONE
Introduction
This report discusses the results of a trend assessment of global CO2 emissions up to 2012 and updates last year’s assessment (Olivier et al., 2012). This assessment focuses on the changes in annual CO2 emissions from 2011 to 2012, and includes not only fossil-fuel combustion on which the BP reports are based, but also incorporates other relevant CO2 emissions sources including flaring of waste gas during gas and oil production, cement clinker production and other limestone uses, feedstock and other non-energy uses of fuels, and several other small sources. The report clarifies the CO2 emission sources covered, and describes the methodology and data sources. More details are provided in Annex 1 over the 2010–2012 period, including a discussion of the degree of uncertainty in national and global CO2 emission estimates.
Chapter 2 presents a summary of recent CO2 emission trends, per main country or region, including a
comparison between emissions per capita and per unit of Gross Domestic Product (GDP), and of the underlying trend in fossil-fuel production and use, non-fossil energy and other CO2 sources. Specific attention is given to developments in shale gas and oil production and oil sands production and their impact on CO2 emissions. To provide a broader context of global emissions trends, international greenhouse gas mitigation targets and agreements are also presented, including different perspectives of emission accounting per country. In particular, annual trends with respect to the Kyoto Protocol target and Cancùn agreements and cumulative global CO2 emissions of the last decade are compared
with scientific literature that analyses global emissions in relation to the target of 2 oC maximum global warming in the 21st century, which was adopted in the UN climate negotiations. In addition, we briefly discuss the rapid development and implementation of various emission trading schemes, because of their increasing importance as a cross-cutting policy instrument for mitigating greenhouse gas emissions.
Chapter 3 focuses on the energy trends and possible fuel shifts, as the special topic for this year’s report.
Compared to last year’s report, global energy trends are described more fully, including an analysis of the main options for reducing emissions, being renewable energy, nuclear power, energy efficiency and carbon capture and storage. In addition, the extent to which structural changes have caused the observed slowdown in the increase in global CO2 emissions is discussed. Finally, Chapter 4 summarises the main conclusions on trends, mitigation achievements and prospects.
This assessment excludes CO2 emissions from deforestation and logging, forest and peat fires, from post-burn decay of remaining above-ground biomass, and from decomposition of organic carbon in drained peat soils. The latter mostly affects developing countries. These sources could add as much as a further 20% to global CO2 emissions (Van der Werf et al., 2009) or perhaps as little as 10% (Harris et al., 2012). However, these percentages are highly uncertain and show a large annual variability. This variability is also a reason that
ONE ONE
emissions and sinks from land use, land-use change and the forestry sector (LULUCF) are kept separate in reporting under the UN Climate Convention (UNFCCC) and the Kyoto Protocol. For the same reason, the emissions from the LULUCF sector are not included in this assessment. Information on recent emissions from forest and peat fires and post-burn emissions is being assessed by the Global Carbon Project, which will publish later this year a comprehensive assessment of the global carbon budget including all sources and sinks (GCP, 2013). Please note that national CO2 emissions are accounted here in accordance with the official IPCC reporting guidelines approved and used by countries to report their national greenhouse gas emissions to the UN Climate Convention (UNFCCC) and Kyoto Protocol, based on domestic activities where greenhouse gas emissions occur (‘actual’ national emissions), such as fossil-fuel consumption and cement production (IPCC, 2006).
Methodology and data sources used
For global CO2 emissions from 1970 to 2008 we use the EDGAR 4.2 data set for greenhouse gases, the results from a joint project of the European Commission’s Joint Research Centre (JRC) and the PBL Netherlands Environmental Assessment Agency, published in November 2011. This data set provides greenhouse gas emissions per country and on a 0.1 x 0.1 degree grid for all anthropogenic sources identified by the IPCC (JRC/PBL, 2011) for the period 1970-2008. Although the data set distinguishes about 25 sources categories, emissions are estimated for well over 100 detailed categories as identified in the Revised 1996 IPCC guidelines for compilation of emission inventories (IPCC, 1996). The core EDGAR 4.2 dataset was extended to 2010 using a fast-track approach based on IEA (2012) fuel-use trends for 2009-2010, for the greenhouse gas section in last year’s CO2 report of IEA (Olivier and Janssens-Maenhout, 2012) and it is this extended EDGAR 4.2 FT2010 data set that is used for this assessment.
EDGAR 4.2 includes CO2 emission factors for cement production per tonne cement produced and taking into account the decreasing share of clinker in cement. In addition to cement production, EDGAR 4.2 includes other industrial non-combustion processes, such as the production of lime and soda ash (2A) and carbon used in metal production (2C). All sources of CO2 related to non-energy/feedstock uses of fossil fuels were estimated using the Tier 1 methods and data recommended by the 2006 IPCC’sguidelines for national greenhouse gas inventories (IPCC, 2006). Collectively, the other carbonate sources added about 30% to global cement production emissions in 2008. More information on the
data sources and methodologies used can be found in Olivier et al. (2012), which is part 3 of IEA (2012e). Although not used in this study, the EDGAR 4.2 data set also includes annual CO2 emissions from forest fires and peat fires as well as fires in other wooded land and savannahs estimated by Van der Werf et al. (2006). It also includes the significant, albeit highly uncertain, CO2 emissions from the decay of organic materials of plants and trees, which remain after forest burning and logging, and from drained peat soils (JRC/PBL, 2011), while net carbon stock changes (resulting in CO2 emissions or carbon storage) for forests, based on data from the FAO’s Forest Resources Assessment (FAO, 2010) are included in the data set for completeness.
To estimate the trend for the 2008–2012 period, all CO2 emissions have been aggregated into five main source sectors (corresponding IPCC category codes in brackets): (1) fossil-fuel combustion (1A), including international ‘bunkers’, (marine and aviation), (2) fugitive emissions from fuels (1B), (3) cement production and other carbonate uses (2A), (4) feedstock and other non-energy uses of fossil fuels (2B+2C+2G+3+4D4), and (5) waste incineration and fuel fires (6C+7A).
For each country, the trend from 2008 onwards has been estimated by either using the trend in the appropriate activity data or by approximating this trend using related statistics as the estimator. For the fuel combustion emissions (1A) that account for about 90% of total global CO2 emissions, excluding forest fires, 2008 emissions were divided per country into four main fuel types for use as trend indicators. These fuel types are coal and coal products, oil products, natural gas and other fuels (e.g., fossil-carbon containing waste oils). For each sector, the 2008–2010 trend was based on IEA CO2 data (IEA, 2012e) and the 2010-2012 trend was based on BP data released in June 2013 (BP, 2013). A similar approach was used for the other source sectors. More details on the methodology and data sources are presented in Annex 1. Data quality and uncertainty in the data are also discussed in this Annex. The uncertainty in CO2 emissions from fossil-fuel combustion using international statistics is discussed in detail by Marland et al. (1999) and Andres et al. (2012) and general uncertainty characteristics in global and national emission inventories in Olivier and Peters (2002).
TWO
Results
2.1 Slowdown in the historical
increase in global CO
2emissions
For global CO2 emissions, 2012 was a remarkable year in which emissions increased by only 1.1% (including a downward correction of 0.3% for it being a leap year), which is less than half of the average annual increase of 2.9% seen over the last decade, reaching a new record of 34.5 billion tonnes (Figure 2.1). After a 1% decline in 2009, a 4.5% recovery in 2010, and a 3% increase in 2011, the actual 2012 increase in global CO2 emissions of 1.4% (i.e. excluding leap-year effect) is less than would beexpected, given that in 2012, the global economy grew by 3.5%, which is similar to 2011 and to the average annual growth rate over the last decade (IMF, 2013). With a leap-year correction of 0.3% (=-1/365), the 2012 increase in global CO2 emissions was only 1.1%. However, within this global total, there are remarkable differences between countries.
Please note that all 2012 percentages (increase/decline) for CO2, as mentioned in this chapter, include a downward correction for the extra day in the leap year, unless labelled as ‘actual’, causing reported annual trends to be 0.3% lower than actual annual trends. Thus, uncorrected (‘actual’) 2012 trend percentages are about 0.3% higher. As an example, the above mentioned global CO2 increase of 1.4% is only (1.4-0.3) %=1.1% (after leap-year
correction).
Global coal consumption (responsible for about 40% in total CO2 emissions), in 2012, grew by only 0.9% (‘actual’) in 2012, well below the decadal average of 4%. These figures were calculated using the actual coal consumption increase in China of 2.5% in 2012, as reported by the National Bureau of Statistics of China (NBS, 2013), rather than the 2012 figure provided by BP (2013) that implies a 6.4% increase in 2012 compared to 2011. The BP (2013) release contains updates for the coal consumption data for China over the last four years, with annual increases now very similar to the data reported by China’s NBS. In BP’s release of last year the increase in China’s coal consumption for 2010 was still estimated to be 10.1%, while the NBS reported this to be 5.9%. However, in their current report, BP has now revised their estimation for 2011 to 6.4%. Global consumption of natural gas and oil products increased by 2.2% and 0.9%, respectively (leap-year corrected), somewhat below the historical trends of 2.7% and 1.2%, annually (BP, 2013).
The six largest emitting countries/regions (with their share in 2012 between brackets) were: China (29%), the United States (15%), the European Union (EU271) (11%), India (6%), the Russian Federation (5%) and Japan (4%) (Figure 2.2). Remarkable trends were seen in the top three emitting countries/regions, which account for 55% of total global CO2 emissions. In China emissions increased by 3.0%, while in the United States emissions decreased by 4.0% and the European Union as a whole also saw a decrease of 1.6% in 2012 compared to 2011. In the aftermath of the Fukushima nuclear accident, Japan’s CO2
TWO TWO
emissions showed a 6.2% increase in 2012 (leap-year corrected percentages). Within the European Union, decreases were seen in, for example, Italy, Poland, Spain and the Netherlands, whereas emissions increased in the United Kingdom and Germany. The increase in China was equivalent to two-thirds of the net global CO2 increase in 2012; for India this was one quarter and for Japan almost one fifth, whereas the United States accounted for minus 40% and the European Union for minus 10%, with changes in 2012 compared to 2011 expressed as a fraction of the net emission increase in 2012.
China’s CO2 emission increase of 3% in 2012 was about 4 percentage points less than its historical average increase in emissions. This was primarily due to a decline in electricity and fuel demand by the basic materials industry, as economic growth slowed down when the stimulus package was terminated and the production of hydropower rebounded, aided by an increase in the use of renewable energy and by energy efficiency
improvements (IEA, 2013).
In the United States, a shift from coal to natural gas in power generation that caused a 12% reduction in coal consumption, together with increased renewable energy production, in particular wind and bioenergy, were the main drivers of the 4% drop in CO2 emissions. The rapid expansion of gas-fired power generation in 2012 was caused by the rapid increase in shale gas production. This, in turn, led to the lowest natural gas prices in the United States in a decade, and caused a 3% decrease in the share of coal in the national fossil-fuel mix.
The European Union’s CO2 emission reduction of 1.6% (1.3% ‘actual’) in 2012, was 1% less than the historical trend, and this was partly due to the continued weak economic condition post-2009, with a 0.3% decrease in total GDP in 2012 (in PPP units; IMF, 2013). The companies covered by the EU Emissions Trading System (EU ETS) – more than 12,000 installations covering more than 40% of the EU’s CO2 emissions (EC, 2013a) – reported 2% less in CO2 emissions for 2012 than for 2011 (EC, 2013b). The EU saw a 1.6% decrease in natural gas consumption, despite a higher demand for space heating in parts of Europe due to the cold winter (BP, 2013). Europe’s power industry took advantage of the drop in the US coal demand. The fact that the price of carbon credits in the EU ETS was too low to offset the price advantage of switching electricity production to more carbon-intensive coal, and that Europe started to import more coal, also from the United States, resulted in a 3.3% increase in EU-wide coal consumption.
The moderate 1.1% increase in global CO2 emissions in 2012 seems remarkable in times where global economic growth was almost on a par with the average growth levels over the last decade. Within this percentage however, there are notable differences in the
performance of various groups of countries. Economic growth in the industrialised OECD countries in 2012 was about two-thirds of the average over the past, while in eastern European countries (‘Economies In Transition’ or EIT) this was only half the level of the trend in recent history. In contrast, developing countries maintained their average growth of the previous decade (IMF, 2013; World Bank, 2013a). However, since a substantial part of a Figure 2.1 1990 1994 1998 2002 2006 2010 2014 0 10 20 30 40 1000 million tonnes CO2
Source: EDGAR 4.2FT2010 (JRC/PBL, 2012); BP, 2013; NBS China, 2013; USGS, 2013; WSA, 2013; NOAA, 2012
pb l.n l / jr c. eu .e ur op a. eu International transport Developing countries
Other developing countries Other large developing countries China
Industrialised countries (Annex I) Other Economies In Transition (EIT) Russian Federation
Other OECD1990 countries Japan
EU12 (new Member States) EU15
United States
TWO
country’s economy is made up of its service and agricultural sectors, which are not energy-intensive activities, increases in energy consumption are not always closely related to overall economic growth. It is obvious that energy-intensive activities are of the highest relevance and that fossil-fuel combustion accounts for 90% of the total CO2 emissions (excluding deforestation and other land uses). Power generation remains the most import sector related to fossil-fuel consumption; therefore, the choice of fossil fuel by the power sector is of the utmost importance. More details on recent energy trends are given in Chapter 3. Contrary to the power industry, for which a relatively large variety of fuels can be selected (from fossil fuel to nuclear energy to renewable energy), other energy-intensive sectors, such as those of manufacturing and construction, are less flexible in the short term.
CO2 emissions from cement clinker production (the largest source of non-combustion-related CO2 emissions, contributing 4.5% to the global total) increased globally by 5% in 2012, mainly due to a 5% increase in the production in China, which accounts for more than half of total global production. The 2012 trend for CO2 emissions from gas flaring (with a much smaller share in global emissions), generally contributing less than 1% to the global total, is not yet known, due to the absence of data updates from the NOAA satellite observation systems following changes in sensors.
The uncertainty in these figures varies between countries, ranging from 5% to 10% (95% confidence interval), with the largest uncertainties concerning data for countries with fast changing or emerging economies, such as the Russian Federation in the early 1990s and China since the late 1990s, and for the most recent statistics, based on Marland et al. (1999), Tu (2011), Andres et al. (2012) and Guan et al. (2012). Moreover, newly published statistics are often subject to subsequent revisions. Therefore, for China and the Russian Federation, we assumed 10% uncertainty, whereas for the European Union, the United States, Japan and India2, a 5% uncertainty was assumed. Our preliminary estimate for total global CO2 emissions in 2012 is believed to have an uncertainty of about 5% and the increase of 2.9% may be accurate to within 0.5%. For more details see Section A1.4 of Annex 1.
2.2 Different trends in the six largest
emitting countries/regions
This section discusses each of the six largest emitting countries/regions in a descending order of importance.
The largest CO2 emitting country by far was China, which share of 29% in 2012 was much larger than the second-largest, the United States, with 16% and the European Union with 11% (Figure 2.2).
A comparison between the shares of national GDP (on the basis of Purchasing Power-Parity (PPP)) in global GDP showed that China’s share in the world economy in 2012 was 15%, while the United States and the European Union each had a share of 19%, followed by India (6%), the Russian Federation (3%) and Brazil (3%). However, when looking at their contributions to the global economic growth over the last decade, which was 44% since 2002, China contributed 31%, India 10%, United States 9%, EU 8%, Russian Federation 4% and Brazil 3% (World Bank, 2013; IMF, 2013). In 2012, the growth in the world economy was around 3.8%, about the same level as that in the last ten years, apart from the global credit crunch years 2008-2009, but with large differences between the largest countries/regions: China’s annual economic growth in 2012 was only about three quarters of the decadal trend, so far the lowest this century. Economic growth rates of India (4.0%) and the Russian Federation (3.4%) were only half those of the recent past and that of Brazil (0.9%) only one quarter. The economy of the United States and Japan grew in 2012 by 2.2% and 2.0%, respectively, which closely represents their average historical growth rates, whereas the EU economy decreased by 0.3% (World Bank, 2013a; IMF, 2013).
For most industrialised countries, the past decade has been characterised mainly by the 2008–2009 recession, which has since been slowly recovering. In 2012, most OECD countries outside Europe saw their historical economic growth rates continued. The United States, Canada and Japan showed a GDP growth of about 2%, whereas in many EU countries, economic growth was very small or even negative.
China
In 2012, China’s CO2 emissions increased by 3.3% (‘actual’) to 9.9 billion tonnes, the slowest rate of increase in a decade. This mainly was caused by a relatively small increase of 2.5% in domestic coal consumption, as reported by NBS (2013), whereas in the receding decade, the annual growth rate was mostly around 10%. Coal consumption was responsible for three quarters of China’s CO2 emissions from fossil-fuel combustion. In contrast, natural gas consumption reached 10% in 2012, following annual increases of about 20%. If we had used BP’s coal growth rate of 6.4% for China, the increase in CO2 emissions would come to 6.1% (BP, 2013). Annex 1 provides a further analysis of the uncertainties in these values. The increase of about 3% was the lowest since 2001, the year after which the increase in Chinese emissions on average accelerated from about 3% to 10%,
TWO TWO
annually. Even in the recent ‘global recession’ years, China’s CO2 emissions continued to increase by about 6% per year.
This relatively small increase in 2012 was consistent with the very small increase of 0.6% in thermal power generation (predominantly coal-fired power plants), 4.7% in steel production (also a large user of coal) and 5.3% in cement production, reported by the National Bureau of Statistics of China (NBS, 2013). The small increase in the kWhs generated by coal-fired power plants mainly was due to the large decline in the growth rate of electricity consumption to 4.8% in 2012, mainly from reduced industrial demand. In addition, power generation using hydropower increased by 23%, due to the expansion of installed capacity and recovery from the drop in 2011 due to drought. This large increase in hydropower production had a mitigating effect of around 1.5 percentage points on China’s CO2 emissions in 2012.
After years of double digit increases in GDP, China’s increase in 2012 was only 7.8% (NBS, 2013; IMF, 2013). Unlike in developed countries, China’s manufacturing industry is the sector with the largest consumption of electricity and fuels. Therefore, the demand for energy in general is largely driven by trends in basic materials production (Houser, 2013). At the end of 2008, China implemented a large economic stimulus package that effectively helped avoid the recession suffered by many other countries during 2008 and 2009. This package was aimed at countering a decline in economic growth; it included investment in transport infrastructure and housing development, and was terminated in 2011. Together with restrictions on investments in construction activities (buildings, power plants, infrastructure) this
termination resulted in a substantial slowdown in the growth rate of the demand for materials, halving the growth in this sector. Thus, not only the growth of the Chinese economy but also of other key energy trend indicators, such as production of cement, steel and electricity, decreased significantly in 2012, compared to the high annual growth rates over the 2002–2011 period. The growth rate in cement, steel and electricity
production was around 5.3% in 2012, which was almost half of that observed in previous years (except for 2007-20083) (see Table 2.1)). Nevertheless, China’s 2012 GDP growth of 7.8% was only about 3% less than the decadal average of around 10%.
With energy and, in particular, electricity demand in China growing half as fast as GDP in 2012, the energy intensity per unit of GDP declined by 3.6%, twice as fast as in 2011. This was caused by a slower economic growth and a structural change in growth. In this way, the country is expected to be able to achieve its 2015 target of a 16% cumulative reduction by the end of the 12th Five Year Plan, compared to 2010 (Houser, 2013). The much smaller growth of 3.3% in total CO2 emissions (3.1% of which related to energy) and the relatively large GDP growth of 7.8% meant a reduction in carbon intensity of 4.3% in 2012 (Houser, 2013).
To meet the intensity reduction target of close to 17% by 2015, relative to 2010, according to the 12th Five Year Plan (Fung, 2012), China’s carbon intensity will need to continue to decrease but at a slightly higher rate (4.6%) for the three years following 2012. One strategy to reduce energy consumption would be to reorient the economy to the service sectors instead of manufacturing. In addition, more energy-intensive industries have begun to Figure 2.2 1990 1994 1998 2002 2006 2010 2014 0 2 4 6 8 10 12 1000 million tonnes CO2
Source: EDGAR 4.2FT2010 (JRC/PBL, 2012); BP, 2013; NBS China, 2013; USGS, 2013; WSA, 2013; NOAA, 2012
pb l.n l / jr c. eu .e ur op a. eu
Industrialised countries (Annex I) United States
Russian Federation European Union (EU27) Japan
Developing countries China India Uncertainty
TWO
shift from the eastern provinces to less-developed central and western regions, to improve their energy efficiency and promote low-carbon development, and this trend appears to be continuing (Fung, 2012). Moreover, the Chinese Government approved an energy consumption control target with the aim of bringing total energy consumption below 4 billion tonnes in standard coal equivalents by 2015 (Xinhua, 2013; Bloomberg, 2012). A more detailed discussion on the uncertainty in Chinese fuel consumption data as reported by different sources is presented in Annex 1, Section A1.4. This discussion, which includes conclusions from recent literature on the accuracy of China’s CO2 emissions (Tu, 2011; Andres et al., 2012; Guan et al., 2012), yields an uncertainty for our estimates of about 5% for most industrialised countries, and in the range of 10% for China and the Russian Federation.
United States
In the United States, in 2012, CO2 emissions decreased by 4% to 5.2 billion tonnes, following a 2% decrease in 2011. This emissions level was the lowest since 1993 and occurred while the economy was growing, whereas, since 2005, CO2 emissions had been increasing every year, with the exception of 2010.
The large decrease in 2012 was mainly due to a decrease in the use of coal (mostly used in power generation). The large increase in shale gas production (see Section 2.5) caused natural gas prices to decline in the first half of 2012, to the lowest level in a decade, leading to a switch to gas-fired power generation and less coal-fired power generation. Compared to coal, natural gas contains roughly about half the amount of carbon (C) per unit of energy; therefore, gas-fired electricity generation produces about half as much CO2 as that from coal. In addition, since they operate at a higher temperature, gas-fired plants can achieve up to almost 15 percentage points higher energy efficiency than coal-fired power plants. Thus, this shift from coal to less carbon-intensive natural gas resulted in a decrease in CO2 emissions. In addition, a
2.2% decrease in transport emissions (but no change in biofuel consumption) and mild winter temperatures reducing the demand for space heating also contributed to the decrease. In the United States, the demand for air conditioning in the summer months may also significantly influence annual trends in fuel consumption, but this was not the case in 2012 (EIA, 2013a,b). Although higher natural gas prices, later in the year, reduced the gas share in power generation below the record level of April 2012, the share of coal in power generation on average remained about 10 percentage points below the annual range of 48% to 51%, prior to 2009 (EIA, 2013d). MacMillan et al. (2013) and EIA (2013b,e) provide further insight into the fuel price incentives for coal- or gas-fired power plant operators and into the reasons for the natural gas price developments in 2012 and early 2013. CO2 emissions from fossil-fuel combustion decreased by 13% in 2012, thus falling below 2005 levels. Houser and Mohan (2013a,b) analysed the causes of the decrease for the United States, and concluded that the shift from coal to natural gas in power generation, from 20% in 2008 to 30% in 2012, contributed greatly to this change, but the increase in the share of renewable energy in power generation, from 7.9% in 2005 to about 11% in 2012, contributed as much. Houser and Mohan conclude that the total reduction in the carbon intensity of the US energy mix from 2005 to 2012 for about 40% was due to the shift towards natural gas, for 25% due to the shift towards wind energy, for 25% due to more use of biofuels and for the remaining 10% due to solar energy,
hydropower and nuclear power. These changes
contributed to about half the decrease in CO2 emissions, the other half was due to a much slower economic growth; between 2005 and 2012, GDP grew on average by 1.1%, annually, compared to 3.1% between 1990 and 2005 (IMF, 2013). However, Shellenberger et al. (2013) claim that this analysis ignored the 10% decline in the energy intensity of the economy in 2012, compared with 2005, due to more efficient gas-fired power generation than the previous coal-fired plants, increases in energy efficiency in other sectors, and economy-wide sectoral shifts. Table 2.1
Growth rates in 2012 of selected energy trend indicators in China, compared to average growth rates since 2002.
Indicator Growth rate 2011 to 2012 Average annual
growth rate, 2002–2011 Standard deviation GDP 7.8% 10.6% 1.7% Cement 5.3% 12.2% 4.7% Crude steel 4.7% [3.7%] 16.5% 7.5% Electricity consumption 5.5% 12.3% 3.4% Sources:
2002–2011: GDP (constant prices) (IMF), cement and crude steel (USGS), electricity (IEA, BP); 2012: NBS (2013); between brackets: WSA (2013).
TWO TWO
Moreover, they point out that renewable energy not only replaced coal-fired power, but rather several specific mixes of fuels, differing per region. In their response, Houser and Mohan (2013b) addressed these issues and concluded that regardless of how large the role of natural gas has been in CO2 reductions to date, recent data and forecasts suggest that ‘it will take new policy to extend those emission cuts forward as both the economy and the natural gas prices begin to recover’.
Natural gas prices in the United States are determined by the North American gas market. By 2012, the production of natural gas increased by 28.9%, relative to 2006. Shale gas production started in 2007 and, by 2013, it had already a one-third share in total US gas production. In comparison, production of shale oil started around 2005 and by 2012 had a share of almost one-quarter in total US crude oil production (EIA, 2013d). For a further discussion on gas flaring, we refer to Section 2.4, and a description of hydraulic fracturing is given in Section 2.5.
European Union
The European Union, as a whole, remained in an economic recession in 2012; its GDP in that year declined by 0.3% compared to 2011 (in PPP units, IMF, 2013). However, CO2 emissions declined by 1.3% (‘actual’) in 2012 compared with 2011 (1.6% with leap-year correction), less than the 3.1% decrease in 2011. The main causes of the decline are:
• Decreasing emissions in the EU’s primary energy consumption of oil and gas by 4% and 2%, respectively. These decreases were mainly driven by a 1% reduction in electricity production and a reduction in emissions from the residential and services sectors, despite the colder winter (with 10% more heating degree days in 2012, compared to 2011) (Eurostat, 2013a and 2013c). • Decreasing transport emissions in the EU, determined
from a decrease in road freight of 4.1% and air freight of 18.4% between 2011 and 2012. Only rail and sea freight increased by 0.9% and 1.3%, respectively (International Transport Forum, 2013).
• A 2% decrease in emissions from the power plants and manufacturing industry installations in the EU27 participating in the EU Emissions Trading System (EC, 2013b). This includes a 4.5% emission reduction in the iron and steel industry between 2011 and 2012. All EU countries (except the United Kingdom and Slovakia) saw a decline in 2012; in particular, Bulgaria and Spain, with 24.2% and 12.6%, respectively. The chemical industry remained fairly constant, with only a slight increase of 0.8% in Germany (Eurostat, 2013b). Finally, a slight decrease in emissions from cement production; in particular, with a decrease between 2011 and 2012 in Spain with 10% and Italy with 3%. Only in Germany cement production increased by 1.5% (USGS, 2013).
Very different trends were noticed in EU Member States, between 2011 and 2012, for power generation, with a total CO2 emissions reduction of 2.3% for the EU27 (Eurostat, 2013c).
For 2012, increased coal consumption was observed in the United Kingdom (+24%, the highest consumption level since 2006), Spain (+24%, the second year with an increase after two years of decreasing consumption), Germany (+4%) and France (+20%), versus decreases in Poland and the Czech Republic of 4% and 8%, respectively (BP, 2013). Almost all coal consumption in these countries was for power generation, except in France, where iron and steel production also had a substantial share (IEA, 2012d).
The German Government has been shifting away from nuclear energy, and over the past decade, has expanded its renewable energy sector, but no specific policy is in place for coal and lignite. Coal mining in Germany is subsidised until 2018; lignite production does not need subsidies and more than 90% is used for electricity and heat generation (Pöyry, 2013). In 2011 and 2012, old coal-fired power plants with a total capacity of 1,700 MW were permanently closed down. However, also 2 new coal-fired plants with a total capacity of 2,700 MW started
production in 2012, 3 more plants have applied for a permit and 6 are currently (2013) under construction, which will provide a total additional capacity of 10,700 MW in the coming years (Sourcewatch, 2013a;
Bundesnetzagentur, 2013).
New coal-fired plants also became operational in Italy (1,980 MW plant, operating since 2008) and Bulgaria (675 MW plant, operational since 2011). Relatively large construction activities for new coal-fired plants are still on-going (in 2013) within Europe: three in the Netherlands (with a total additional capacity of 3,500 MW), 2 in the Czech Republic (835 MW), 1 in Poland (910 MW) and 1 in Slovenia (600 MW). These plants will not replace closed down old power plants, but may be built in anticipation of the closure of some old plants, for which complying with the emission standards set in the Large Combustion Plants Directive (LCPD, 2001/80/EC) is expensive. For example, 85% of Poland’s power generation is supplied by coal-fired plants, of which two thirds are over 30 years old (CCE Bankwatch, 2013). In most EU27 Member States, these new coal plants are said to be ‘CCS ready’, i.e. the infrastructure would allow for a carbon capture and storage (CCS) facility next to the power plant. More information on CCS is given in Section 3.6.
The United Kingdom has not constructed any new coal-fired power plants over the last decade (DECC, 2012). Moreover, it is phasing out these plants, having already
TWO
converted 3 plants to biomass with a total capacity of 5,160 MW, and has closed another 4 coal-fired plants with a total capacity of 14,670 MW (Sourcewatch, 2013b; Reuters, 2012d, Airlie, 2011).
Spain has also decreased the share of coal in its power generation, considerably, and continues to do so by quadrupling the tax rate on coal and not renewing the subsidies for such coal-fired plants. Since 2010, Spain has been delivering more than 20% of its electricity from renewable sources by widespread deployment of wind power and is investing further in wind and solar technologies (Pöyry, 2013). Recently, Spain has made a series of large legislative changes to its renewable energy policy, in order to control the country’s growing electricity tariff deficit, turning renewable energy into a fully regulated business and bringing growth under control (Economist, 2013b; Ernst and Young, 2012).
India
India, where domestic demand makes up three quarters of the national economy (Damodaran, 2011), has been relatively unaffected by the global financial recession because this recession in fact stimulated the already high share of domestic consumption in total national expenditure. Nevertheless, India’s GDP growth of about 4% in 2012 was the lowest in a decade. India’s CO2 emissions in 2012 continued to increase by 6.8% to about 2.0 billion tonnes, making it the fourth largest CO2 emitting country, following the European Union, and well ahead of the Russian Federation, which is the fifth largest emitting country (Figure 2.2). This high ranking is partly caused by the size of its population and economy. Per capita, India’s CO2 emissions were much lower than those of most developed countries and China (Figure 2.3). The increase in 2012 mainly was caused by a 10% increase in coal consumption, which accounted for two thirds of India’s total emissions from fossil-fuel combustion and 55% of those from its electricity production. This growth rate was much higher than in the previous two years, but similar to those of 2008 and 2009. Coal-based power production, accounting for almost 70% of all of India’s coal-related CO2 emissions, grew by about 13% in 2012, the highest annual growth ever. Both the additional capacity and generation level were higher (Saikia, 2013). Although not as large as those of China and South Africa, which had a 75% share of coal in their fossil-fuel mix, India ‘s share was also large with 57%. Poland and Kazakhstan, other countries with large coal resources, had similar coal shares, whereas the global average share in 2012 was about 34%.
Russian Federation
In 2012, the Russian Federation alone accounted for a share of 5.1% in global CO2 and this represented half of
the emissions from the so-called economies in transition (EIT countries). After the large decrease of 5.6% in emissions in 2009, due to the global recession, the Russian Federation in 2011 recorded an increase of 4.1% in emissions over the last twenty years, going back to the CO2 emissions level of 2006. However, in 2012, CO2 emissions in the Russian Federation decreased by 0.9%.
Japan
The share of Japan in global CO2 emissions decreased slowly, from 5.2% in the 1990s, to 4.5% in following decade, to 3.8% in 2012. However, economic recovery following the recession of 2009 and the closure of nuclear plants after the Fukushima accident led to the highest increases in CO2 emissions of the past twenty years, with 6.2% in 2012. The increase in 2012 was partly due to a 5.4% increase in the use of coal, with consumption levels back at those of the years 2007 to 2010. Following the nuclear disaster in 2011, renewable energy in Japan is seen as an alternative for the future and could account for about one-fifth of Japan’s energy mix by the 2020s. Renewable energy in 2012 accounted for about 10% of the energy supply, most of which from hydroelectric sources. At the end of 2012, Japan’s total solar capacity reached 7.4 GW and this is expected to grow further (Guardian, 2013).
Other OECD and EIT countries
In ‘other OECD-1990’ countries4, not included in the group of six largest emitting countries/regions, CO2 emissions decreased by 1% in 2012. Their share in global CO2 emissions was 4.2%, with the largest contributions from Canada, Australia and Turkey. Over the course of 2012, emissions dropped in Canada by 0.3%, in Turkey by 2.0% and in Australia by 2.5%.
The eastern European countries, excluding the Russian Federation and EU’s 12 new Member States, recorded an increase of only 1% in 2012, following large increases in CO2 emissions in 2010 and 2011 of about 8% and 6.6%, respectively. This group of countries accounted for a share of 3% in global CO2, with the largest emitting country being the Ukraine (0.9%) with an emission increase of 0.9% in 2012.
Other developing countries
In 2012, emissions from the category of ‘other developing countries’5 represented more than one fifth of the total in global CO2 emissions, with South Korea having a share of 1.8%, and Indonesia and Mexico 1.4% each. After the economic recovery in most of these countries following the recession of 2009, large increases in CO2 emissions were recorded for 2010. However, in the subsequent years, CO2 emissions increased much less. Total CO2 emissions in these ‘other developing countries’ increased by 2.9% in 2011 and 2.5% in 2012, down from the large
TWO TWO
jump of 5.5% in 2010, following the economic recovery in these countries after the global recession of 2009. Of the larger of these countries, CO2 emission levels in South Korea and Indonesia did not change in 2012, compared to 2011, but increases were seen in Saudi Arabia (7%), Mexico (4%) and Brazil and Iran (both 2%).
2.3 Comparison between emissions
in the various countries
Although emissions in China and other countries with emerging economies increased very rapidly in recent years (Table 2.2 and Figure 2.3), in both relative and absolute figures, the picture is different for CO2 emissions per capita (see Table A1.2 and Figure 2.4) and per unit of
GDP (Figure 2.5). Where, since 1990, in the EU27, CO2 emissions decreased from 9.1 to 7.4 tonnes per capita, and in the United States from 19.6 to 16.4 tonnes per capita, they increased in China from 2.1 to 7.1. As such, Chinese citizens, together representing 20% of the world population, on average emitted about the same amount of CO2 per capita in 2012 as the average European citizen. The EU27 saw a decrease of 1.3% in total CO2 emissions from fossil fuel and cement production between 2011 and 2012, which is a smaller decrease than in the United States (3.7%). China’s total CO2 emissions increased by 3.3%, and for India this was even more, with 7.1%. Japan, with 6.5%, showed one of the strongest increases in total CO2 emissions, mainly due to the use of fossil fuel instead of nuclear energy in their power generation.
Figure 2.3 China United States EU27 India Russian Federation Japan Germany South Korea Canada Indonesia Mexico United Kingdom Brazil Saudi Arabia Australia Iran Italy France South Africa Ukraine Poland Spain Taiwan Thailand Netherlands 0 2000 4000 6000 8000 10000 million tonnes CO2
Source: EDGAR 4.2FT2010 (1990–2010); BP, 2013; NBS China, 2013; USGS, 2013; WSA, 2013; NOAA, 2012
pbl.nl / jrc.eu.europa.eu Industrialised countries (Annex I) 1990 2000 2012 Developing countries 1990 2000 2012
TWO
Table 2.2
Trends in CO2 emissions per region/country, 1990–2012 (unit: billion tonnes of CO2)
1990 1991 1992 1993 1994 1995 1996 1997 1998 1999 2000 2001 2002 2003 2004 2005 2006 2007 2008 2009 2010 2011 2012 United States 4.99 4.96 5.04 5.18 5.26 5.26 5.44 5.58 5.65 5.69 5.87 5.75 5.83 5.87 5.94 5.94 5.84 5.91 5.74 5.32 5.50 5.39 5.19 EU27 4.32 4.27 4.12 4.04 4.02 4.08 4.15 4.06 4.07 4.01 4.06 4.13 4.11 4.22 4.23 4.19 4.21 4.15 4.09 3.82 3.91 3.79 3.74 EU15 3.33 3.36 3.29 3.22 3.23 3.27 3.34 3.28 3.32 3.29 3.33 3.39 3.39 3.47 3.47 3.43 3.43 3.37 3.32 3.10 3.16 3.03 3.00 - France 0.39 0.42 0.41 0.39 0.38 0.39 0.40 0.39 0.42 0.41 0.41 0.42 0.41 0.42 0.41 0.41 0.40 0.39 0.40 0.38 0.39 0.37 0.37 - Germany 1.02 0.99 0.94 0.93 0.92 0.92 0.94 0.91 0.90 0.87 0.87 0.89 0.87 0.88 0.88 0.85 0.86 0.84 0.86 0.81 0.82 0.80 0.81 - Italy 0.43 0.42 0.42 0.42 0.41 0.44 0.42 0.42 0.43 0.43 0.46 0.46 0.47 0.48 0.48 0.48 0.49 0.47 0.46 0.41 0.42 0.41 0.39 - Spain 0.23 0.24 0.25 0.23 0.24 0.25 0.24 0.26 0.27 0.29 0.31 0.31 0.33 0.33 0.35 0.36 0.35 0.37 0.33 0.30 0.28 0.29 0.29 - United Kingdom 0.59 0.60 0.58 0.56 0.56 0.56 0.57 0.55 0.55 0.54 0.55 0.56 0.55 0.56 0.55 0.55 0.56 0.54 0.53 0.49 0.51 0.47 0.49 - Netherlands 0.16 0.17 0.17 0.17 0.17 0.17 0.18 0.18 0.18 0.17 0.17 0.18 0.18 0.18 0.18 0.18 0.17 0.17 0.17 0.17 0.18 0.17 0.16
EU12 (new Member States) 1.00 0.91 0.83 0.81 0.79 0.81 0.80 0.78 0.75 0.71 0.73 0.73 0.72 0.75 0.76 0.76 0.78 0.78 0.77 0.72 0.75 0.76 0.74
- Poland 0.31 0.31 0.30 0.31 0.31 0.32 0.30 0.30 0.29 0.28 0.29 0.28 0.28 0.29 0.31 0.31 0.32 0.32 0.32 0.31 0.33 0.33 0.32 Japan 1.16 1.17 1.18 1.18 1.23 1.25 1.26 1.26 1.22 1.26 1.28 1.26 1.30 1.31 1.31 1.32 1.30 1.33 1.25 1.18 1.24 1.24 1.32 Other Annex II 0.83 0.83 0.85 0.85 0.87 0.89 0.92 0.96 0.99 1.01 1.03 1.03 1.05 1.08 1.10 1.12 1.11 1.15 1.14 1.10 1.12 1.13 1.12 - Australia 0.27 0.28 0.28 0.28 0.29 0.30 0.31 0.33 0.35 0.36 0.36 0.36 0.37 0.38 0.40 0.41 0.42 0.42 0.44 0.43 0.43 0.44 0.43 - Canada 0.45 0.44 0.45 0.45 0.47 0.48 0.49 0.51 0.52 0.53 0.55 0.54 0.55 0.57 0.57 0.57 0.55 0.59 0.57 0.54 0.55 0.56 0.56 Russian Federation 2.44 2.30 2.08 2.00 1.76 1.75 1.72 1.59 1.57 1.62 1.66 1.67 1.66 1.72 1.73 1.72 1.79 1.81 1.80 1.70 1.71 1.78 1.77
Other Annex I-EIT* 1.62 1.53 1.35 1.19 1.02 0.97 0.89 0.87 0.87 0.85 0.85 0.86 0.89 0.93 0.93 0.89 0.92 0.97 0.99 0.90 0.97 1.03 1.04
- Ukraine 0.77 0.71 0.63 0.55 0.45 0.45 0.39 0.38 0.36 0.36 0.35 0.35 0.35 0.38 0.36 0.34 0.33 0.35 0.34 0.28 0.30 0.32 0.32
China 2.51 2.65 2.78 3.02 3.19 3.52 3.62 3.59 3.65 3.57 3.56 3.64 3.90 4.50 5.28 5.85 6.51 7.01 7.79 8.26 8.74 9.55 9.86
- cement production in China 0.09 0.11 0.13 0.16 0.18 0.20 0.21 0.21 0.22 0.24 0.24 0.27 0.29 0.34 0.38 0.42 0.48 0.53 0.54 0.64 0.73 0.85 0.89
Other large DC*** 1.83 1.91 1.99 2.03 2.15 2.24 2.35 2.46 2.53 2.60 2.69 2.72 2.81 2.91 3.09 3.20 3.37 3.56 3.54 3.65 3.81 3.91 4.11 - India 0.66 0.70 0.74 0.76 0.81 0.87 0.92 0.96 0.97 1.03 1.06 1.08 1.12 1.15 1.24 1.29 1.38 1.48 1.56 1.69 1.78 1.84 1.97 - Brazil 0.22 0.23 0.23 0.24 0.25 0.27 0.29 0.31 0.32 0.33 0.35 0.35 0.35 0.34 0.36 0.37 0.37 0.39 0.41 0.38 0.44 0.45 0.46 - Mexico 0.31 0.32 0.32 0.32 0.34 0.33 0.34 0.35 0.38 0.37 0.38 0.38 0.38 0.39 0.40 0.42 0.44 0.45 0.45 0.44 0.46 0.47 0.49 - Iran 0.21 0.23 0.24 0.24 0.27 0.28 0.29 0.30 0.31 0.32 0.34 0.35 0.37 0.40 0.43 0.45 0.48 0.51 0.37 0.38 0.39 0.40 0.41 - Saudi Arabia 0.17 0.17 0.19 0.20 0.21 0.21 0.23 0.23 0.24 0.25 0.26 0.27 0.28 0.30 0.31 0.32 0.34 0.36 0.38 0.41 0.43 0.43 0.46 - South Africa 0.27 0.26 0.27 0.27 0.27 0.29 0.30 0.31 0.32 0.30 0.31 0.29 0.31 0.34 0.36 0.36 0.36 0.37 0.37 0.35 0.33 0.33 0.33 Other non-Annex I **** 2.31 2.42 2.51 2.65 2.76 2.94 3.13 3.27 3.26 3.38 3.53 3.60 3.69 3.81 4.03 4.17 4.31 4.47 4.58 4.64 4.93 5.09 5.22 - Asian tigers** 0.71 0.79 0.84 0.92 0.99 1.07 1.17 1.24 1.17 1.25 1.31 1.36 1.41 1.46 1.53 1.57 1.61 1.65 1.68 1.67 1.80 1.89 1.91 - South Korea** 0.25 0.28 0.30 0.33 0.37 0.40 0.43 0.45 0.39 0.42 0.45 0.46 0.48 0.49 0.51 0.50 0.51 0.52 0.54 0.55 0.59 0.63 0.64 - Indonesia** 0.16 0.17 0.18 0.19 0.20 0.21 0.23 0.26 0.26 0.28 0.29 0.32 0.32 0.33 0.35 0.36 0.38 0.40 0.41 0.42 0.45 0.49 0.49 - Taiwan** 0.13 0.14 0.14 0.16 0.16 0.17 0.18 0.19 0.21 0.22 0.23 0.24 0.25 0.25 0.26 0.27 0.28 0.28 0.27 0.25 0.27 0.28 0.28 - Thailand** 0.09 0.10 0.11 0.13 0.14 0.16 0.18 0.18 0.17 0.17 0.17 0.18 0.19 0.20 0.22 0.23 0.23 0.22 0.23 0.22 0.24 0.25 0.26 International transport 0.66 0.66 0.69 0.68 0.69 0.72 0.73 0.76 0.77 0.82 0.83 0.80 0.84 0.85 0.93 0.95 1.00 1.05 1.04 1.00 1.07 1.07 1.06 Total 22.7 22.7 22.6 22.8 22.9 23.6 24.2 24.4 24.6 24.8 25.4 25.4 26.1 27.2 28.5 29.3 30.3 31.4 32.0 31.6 33.0 34.0 34.5
* EIT = economies in transition. Including all other countries of the former Soviet Union (excl. the Russian Federation) and including Turkey. ** Asian tigers here are: Indonesia, Singapore, Malaysia, Thailand, South Korea and Taiwan.
*** DCs = developing countries. Other large developing countries are: Brazil, Mexico, South Africa, Saudi Arabia, India and Iran. **** Remaining developing countries.
TWO TWO
Table 2.2
Trends in CO2 emissions per region/country, 1990–2012 (unit: billion tonnes of CO2)
1990 1991 1992 1993 1994 1995 1996 1997 1998 1999 2000 2001 2002 2003 2004 2005 2006 2007 2008 2009 2010 2011 2012 United States 4.99 4.96 5.04 5.18 5.26 5.26 5.44 5.58 5.65 5.69 5.87 5.75 5.83 5.87 5.94 5.94 5.84 5.91 5.74 5.32 5.50 5.39 5.19 EU27 4.32 4.27 4.12 4.04 4.02 4.08 4.15 4.06 4.07 4.01 4.06 4.13 4.11 4.22 4.23 4.19 4.21 4.15 4.09 3.82 3.91 3.79 3.74 EU15 3.33 3.36 3.29 3.22 3.23 3.27 3.34 3.28 3.32 3.29 3.33 3.39 3.39 3.47 3.47 3.43 3.43 3.37 3.32 3.10 3.16 3.03 3.00 - France 0.39 0.42 0.41 0.39 0.38 0.39 0.40 0.39 0.42 0.41 0.41 0.42 0.41 0.42 0.41 0.41 0.40 0.39 0.40 0.38 0.39 0.37 0.37 - Germany 1.02 0.99 0.94 0.93 0.92 0.92 0.94 0.91 0.90 0.87 0.87 0.89 0.87 0.88 0.88 0.85 0.86 0.84 0.86 0.81 0.82 0.80 0.81 - Italy 0.43 0.42 0.42 0.42 0.41 0.44 0.42 0.42 0.43 0.43 0.46 0.46 0.47 0.48 0.48 0.48 0.49 0.47 0.46 0.41 0.42 0.41 0.39 - Spain 0.23 0.24 0.25 0.23 0.24 0.25 0.24 0.26 0.27 0.29 0.31 0.31 0.33 0.33 0.35 0.36 0.35 0.37 0.33 0.30 0.28 0.29 0.29 - United Kingdom 0.59 0.60 0.58 0.56 0.56 0.56 0.57 0.55 0.55 0.54 0.55 0.56 0.55 0.56 0.55 0.55 0.56 0.54 0.53 0.49 0.51 0.47 0.49 - Netherlands 0.16 0.17 0.17 0.17 0.17 0.17 0.18 0.18 0.18 0.17 0.17 0.18 0.18 0.18 0.18 0.18 0.17 0.17 0.17 0.17 0.18 0.17 0.16
EU12 (new Member States) 1.00 0.91 0.83 0.81 0.79 0.81 0.80 0.78 0.75 0.71 0.73 0.73 0.72 0.75 0.76 0.76 0.78 0.78 0.77 0.72 0.75 0.76 0.74
- Poland 0.31 0.31 0.30 0.31 0.31 0.32 0.30 0.30 0.29 0.28 0.29 0.28 0.28 0.29 0.31 0.31 0.32 0.32 0.32 0.31 0.33 0.33 0.32 Japan 1.16 1.17 1.18 1.18 1.23 1.25 1.26 1.26 1.22 1.26 1.28 1.26 1.30 1.31 1.31 1.32 1.30 1.33 1.25 1.18 1.24 1.24 1.32 Other Annex II 0.83 0.83 0.85 0.85 0.87 0.89 0.92 0.96 0.99 1.01 1.03 1.03 1.05 1.08 1.10 1.12 1.11 1.15 1.14 1.10 1.12 1.13 1.12 - Australia 0.27 0.28 0.28 0.28 0.29 0.30 0.31 0.33 0.35 0.36 0.36 0.36 0.37 0.38 0.40 0.41 0.42 0.42 0.44 0.43 0.43 0.44 0.43 - Canada 0.45 0.44 0.45 0.45 0.47 0.48 0.49 0.51 0.52 0.53 0.55 0.54 0.55 0.57 0.57 0.57 0.55 0.59 0.57 0.54 0.55 0.56 0.56 Russian Federation 2.44 2.30 2.08 2.00 1.76 1.75 1.72 1.59 1.57 1.62 1.66 1.67 1.66 1.72 1.73 1.72 1.79 1.81 1.80 1.70 1.71 1.78 1.77
Other Annex I-EIT* 1.62 1.53 1.35 1.19 1.02 0.97 0.89 0.87 0.87 0.85 0.85 0.86 0.89 0.93 0.93 0.89 0.92 0.97 0.99 0.90 0.97 1.03 1.04
- Ukraine 0.77 0.71 0.63 0.55 0.45 0.45 0.39 0.38 0.36 0.36 0.35 0.35 0.35 0.38 0.36 0.34 0.33 0.35 0.34 0.28 0.30 0.32 0.32
China 2.51 2.65 2.78 3.02 3.19 3.52 3.62 3.59 3.65 3.57 3.56 3.64 3.90 4.50 5.28 5.85 6.51 7.01 7.79 8.26 8.74 9.55 9.86
- cement production in China 0.09 0.11 0.13 0.16 0.18 0.20 0.21 0.21 0.22 0.24 0.24 0.27 0.29 0.34 0.38 0.42 0.48 0.53 0.54 0.64 0.73 0.85 0.89
Other large DC*** 1.83 1.91 1.99 2.03 2.15 2.24 2.35 2.46 2.53 2.60 2.69 2.72 2.81 2.91 3.09 3.20 3.37 3.56 3.54 3.65 3.81 3.91 4.11 - India 0.66 0.70 0.74 0.76 0.81 0.87 0.92 0.96 0.97 1.03 1.06 1.08 1.12 1.15 1.24 1.29 1.38 1.48 1.56 1.69 1.78 1.84 1.97 - Brazil 0.22 0.23 0.23 0.24 0.25 0.27 0.29 0.31 0.32 0.33 0.35 0.35 0.35 0.34 0.36 0.37 0.37 0.39 0.41 0.38 0.44 0.45 0.46 - Mexico 0.31 0.32 0.32 0.32 0.34 0.33 0.34 0.35 0.38 0.37 0.38 0.38 0.38 0.39 0.40 0.42 0.44 0.45 0.45 0.44 0.46 0.47 0.49 - Iran 0.21 0.23 0.24 0.24 0.27 0.28 0.29 0.30 0.31 0.32 0.34 0.35 0.37 0.40 0.43 0.45 0.48 0.51 0.37 0.38 0.39 0.40 0.41 - Saudi Arabia 0.17 0.17 0.19 0.20 0.21 0.21 0.23 0.23 0.24 0.25 0.26 0.27 0.28 0.30 0.31 0.32 0.34 0.36 0.38 0.41 0.43 0.43 0.46 - South Africa 0.27 0.26 0.27 0.27 0.27 0.29 0.30 0.31 0.32 0.30 0.31 0.29 0.31 0.34 0.36 0.36 0.36 0.37 0.37 0.35 0.33 0.33 0.33 Other non-Annex I **** 2.31 2.42 2.51 2.65 2.76 2.94 3.13 3.27 3.26 3.38 3.53 3.60 3.69 3.81 4.03 4.17 4.31 4.47 4.58 4.64 4.93 5.09 5.22 - Asian tigers** 0.71 0.79 0.84 0.92 0.99 1.07 1.17 1.24 1.17 1.25 1.31 1.36 1.41 1.46 1.53 1.57 1.61 1.65 1.68 1.67 1.80 1.89 1.91 - South Korea** 0.25 0.28 0.30 0.33 0.37 0.40 0.43 0.45 0.39 0.42 0.45 0.46 0.48 0.49 0.51 0.50 0.51 0.52 0.54 0.55 0.59 0.63 0.64 - Indonesia** 0.16 0.17 0.18 0.19 0.20 0.21 0.23 0.26 0.26 0.28 0.29 0.32 0.32 0.33 0.35 0.36 0.38 0.40 0.41 0.42 0.45 0.49 0.49 - Taiwan** 0.13 0.14 0.14 0.16 0.16 0.17 0.18 0.19 0.21 0.22 0.23 0.24 0.25 0.25 0.26 0.27 0.28 0.28 0.27 0.25 0.27 0.28 0.28 - Thailand** 0.09 0.10 0.11 0.13 0.14 0.16 0.18 0.18 0.17 0.17 0.17 0.18 0.19 0.20 0.22 0.23 0.23 0.22 0.23 0.22 0.24 0.25 0.26 International transport 0.66 0.66 0.69 0.68 0.69 0.72 0.73 0.76 0.77 0.82 0.83 0.80 0.84 0.85 0.93 0.95 1.00 1.05 1.04 1.00 1.07 1.07 1.06 Total 22.7 22.7 22.6 22.8 22.9 23.6 24.2 24.4 24.6 24.8 25.4 25.4 26.1 27.2 28.5 29.3 30.3 31.4 32.0 31.6 33.0 34.0 34.5
* EIT = economies in transition. Including all other countries of the former Soviet Union (excl. the Russian Federation) and including Turkey. ** Asian tigers here are: Indonesia, Singapore, Malaysia, Thailand, South Korea and Taiwan.
*** DCs = developing countries. Other large developing countries are: Brazil, Mexico, South Africa, Saudi Arabia, India and Iran. **** Remaining developing countries.
TWO
The trends in CO2 emissions per capita in the top 6 emitting countries are shown in Figure 2.6a. These trends reflect a number of factors, including the large economic developments in China, structural changes in national and global economies, the impacts of major economic downturns in the Russian Federation in the early 1990s and in the United States in 2008, 2009 and 2011, and in Europe in 2009 (for the whole of the EU27) and 2011 and 2012 (mainly in some EU15 countries). Factors that also contributed to the emission decrease in the United States between 2007 and 2012, were high oil prices with a relatively large impact on retail prices due to low fuel taxes and an increased share of 3% natural gas in total national fossil-fuel consumption (EIA, 2012a,b). The EU saw a smaller decrease in emissions during the recession years, among other things, because of high fuel taxes,
which dampened the impact of strong international variations in oil prices on retail prices.
The two dashed lines in Figure 2.6a represent the range of CO2 emissions per capita (minimum and maximum) for the major industrialised countries (the Annex I countries listed in Figure 2.2), the lowest levels of CO2 per capita being those in France (5.8 tonnes CO2/cap because of the amount of nuclear power used in that country) and the highest levels were seen in Australia (18.8 tonnes CO2/cap because of natural resource depletion). The per-capita CO2 emissions in the United States decreased in 2012 down to 16.4 tonnes CO2/cap, and in Kazakhstan emissions increased with precisely that amount, due to its intensive mining. When comparing CO2 trends between countries over a decade or more, trends in population numbers also should be taken into account, as Figure 2.4 Australia United States Saudi Arabia Canada South Korea Russian Federation Taiwan Japan Netherlands Germany Poland United Kingdom EU27 Ukraine China Italy South Africa Spain France Iran Mexico Thailand Brazil Indonesia India 0 4 8 12 16 20 24 tonnes CO2 / capita
Source: EDGAR 4.2FT2010 (1990–2010); UNDP, 2013 (WPP Rev. 2012); BP, 2013; NBS China, 2013; USGS, 2013; WSA, 2013; NOAA, 2012
pbl.nl / jrc.eu.europa.eu Industrialised countries (Annex I) 1990 2000 2012 Developing countries 1990 2000 2012
TWO TWO
population growth differs considerably, also between Annex I countries, with the highest growth rate since 1990 seen in Australia (+32% between 1990 and 2011) and in the United States and Canada (both +24%). The populations of the EU and Japan, however, increased much less (by 7% and 3%, respectively), and the Russian Federation even saw a decline of 4% (see Table A1.2). Over the past decade, all countries experienced a declining trend for CO2 in terms of GDP6, but the ranking order of countries more or less remains the same: with a lower emission level in the European Union; Japan emitting less CO2 per invested USD in GDP than all the other countries of the world7; medium levels in the United States and India; and higher levels in the Russian
Federation and China, the last two emitting relatively high amounts of CO2 per USD of GDP. The trends for the
Russian Federation and China were less smooth; partially due to very large and fast changes in their economies. In 2012, the emission intensity of the EU was about three quarters that of the United States and about one third that of China. The higher levels for the Russian Federation and China indicated either a larger share of more intensive economic activities, the use of less energy-efficient technologies, a larger share of coal in the energy mix, or a combination of these factors. This also applied to the Ukraine, which is depicted in Figure 2.6b by the upper dashed line.
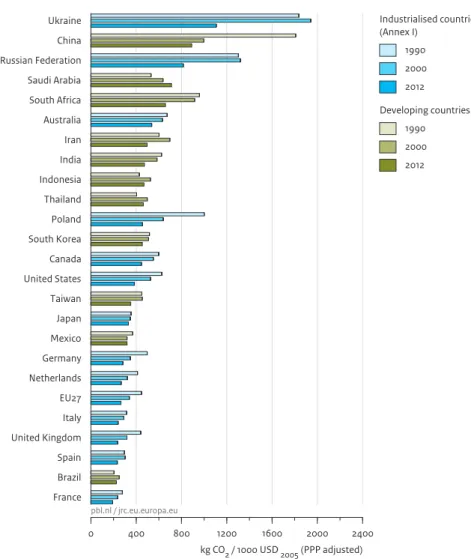
Figure 2.5 Ukraine China Russian Federation Saudi Arabia South Africa Australia Iran India Indonesia Thailand Poland South Korea Canada United States Taiwan Japan Mexico Germany Netherlands EU27 Italy United Kingdom Spain Brazil France 0 400 800 1200 1600 2000 2400
Source: EDGAR 4.2FT2010 (1990–2010); World Bank, 2013; IMF, 2013; BP, 2013;NBS China, 2013; USGS, 2013; WSA, 2013; NOAA, 2012
pbl.nl / jrc.eu.europa.eu Industrialised countries (Annex I) 1990 2000 2012 Developing countries 1990 2000 2012
CO2 emissions per unit of GDP from fossil-fuel use and cement production
TWO
2.4 Gas flaring emissions
When natural gas is co-produced during conventional or unconventional oil production and cannot be marketed, this ‘associated’ gas is either vented or flared. Venting or flaring occurs in areas that are remote from market demand and from gas transport infrastructure. Both practices lead to the emissions of greenhouse gases: methane from venting and CO2 from flaring.
The global CO2 emissions of about 250 million tonnes from flaring of unused gas during oil production – comparable in magnitude with total CO2 emissions in a medium-sized country such as Spain – did not
significantly change in 2011, after a steady decrease by about a quarter since 2003. These estimates on natural gas flaring were derived from DMSP-OLS and MODIS satellite measurements, analysed by the US National Oceanic and Atmospheric Administration (NOAA) and supported by the Global Gas Flaring Reduction
Partnership (GGFR), a public-private partnership which is led by the World Bank. The night-time lights from gas flares observed by the satellites provide an estimate of the amounts of gas flared, when related to reported flaring volumes available from the GGFR Partnership (Elvidge et al., 2009a). Countries with the largest satellite observed flaring emissions are the Russian Federation and Nigeria, with shares of global flaring emissions of Figure 2.6a 1990 1994 1998 2002 2006 2010 2014 0 5 10 15 20 25
tonnes CO2 per capita
Source: EDGAR 4.2FT2010 (1990–2010); UNDP (WPP, Rev. 2013), 2013
pb l.n l / jr c. eu .e ur op a. eu
Industrialised countries (Annex I) United States
Russian Federation European Union (EU27) Japan Annex I range Developing countries China India Uncertainty
CO2 emissions per capita from fossil-fuel use and cement production in the top 6 emitting countries and the EU
Figure 2.6b 1990 1994 1998 2002 2006 2010 2014 0 500 1000 1500 2000 2500
kg CO2 / thousand USD2005 (PPP adjusted)
Source: EDGAR 4.2FT2010 (1990–2010); World Bank, 2013; IMF, 2013
pb l.n l / jr c. eu .e ur op a. eu
Industrialised countries (Annex I) United States
Russian Federation European Union (EU27) Japan Annex I range Developing countries China India Uncertainty