PROPAGATION OF UNCERTAINTIES IN SOIL AND PESTICIDE PROPERTIES TO PREDICTED PESTICIDE LEACHING IN THE NETHERLANDS USING THE GEOPEARL MODEL
BERG F. VAN DEN1, TIKTAK A. 2, HEUVELINK G.B.M1, BURGERS S.L.G.E 3, BRUS D.J. 1, DE VRIES F. 1, STOLTE J. 1, KROES J.G. 1
1
Alterra, Wageningen University and Research Centre, PO Box 47, 6700 AA Wageningen, the Netherlands
2
Netherlands Environmental Assessment Agency (MNP), PO Box 303, 3720 AH Bilthoven The Netherlands
3
Biometris, Wageningen University and Research Centre, PO Box 47, 6700 AA Wageningen, the Netherlands
ABSTRACT
In the new Dutch decision tree for the evaluation of pesticide leaching to groundwater, data on the spatial distribution of soils are used by the GeoPEARL model to calculate the 90th percentile of the leaching concentration in the area of potential usage (P90). So far it was not known to what extent the uncertainties in soil properties propagate to the predicted leaching concentrations. Therefore, a study was set up to quantify the uncertainties in the soil data and analyse their contribution to the uncertainty in the leaching concentrations. The contribution from uncertain soil properties (e.g. soil horizon thickness, texture, organic matter content hydraulic conductivity and water retention characteristics) was compared to that caused by uncertainties in the most important pesticide properties, i.e. the coefficient of sorption on organic matter (Kom) and the half-life of transformation in soil (DT50). Firstly, the uncertainties in the soil and pesticide properties were quantified. Next, a regular grid sample of points covering the whole of the agricultural area in the Netherlands was randomly selected. At the grid nodes, realisations from the probability distributions of uncertain inputs were generated and used as input to a Monte Carlo uncertainty propagation analysis. Uncertainties in DT50 and Kom contributed most to the uncertainty in the leaching concentrations. Recommendations are made for further improvement of the model predictions.
KEY WORDS: leaching, groundwater, soil map, Monte Carlo technique
INTRODUCTION
In the environmental assessments by the Netherlands Environmental Assessment Agency, the GeoPEARL model is used to calculate the leaching of pesticides to the groundwater at a national scale. The target quantity to report the risk to leaching at a specific location is the 50th percentile over time of the predicted environmental concentration (PEC50), i.e. the leaching concentration for the pesticide at a depth in soil of 1 m, which is considered to be representative for the concentration in ground water. In the new Dutch decision tree for leaching of pesticides to groundwater, the 90th percentile (P90) of the spatial frequency distribution of the PEC50 is taken in its area of use.
The GeoPEARL model has various components (Tiktak et al., 2004; Kroon et al., 2001) Inaccuracies in a component can propagate to the next component and finally to the outcome of the calculations. An uncertainty and sensitivity analysis of the various components results in information on the accuracy of the final outcome and on the contribution of the uncertainty in one component on the outcome of the results. Such information can be used to identify the model components that need to be improved.
Sensitivity analysis is the study of how variation in the output of a model can be apportioned to different sources of variation, and of how the given model depends upon the information fed into it. Uncertainty analysis quantifies the overall uncertainty associated with the response as a result
of uncertainties in the model input (Saltelli et al., 2000). These inputs may comprise model parameters, exogenous variables and initial conditions.
The primary goal of the present study is to identify the weakest parts in the GeoPEARL model. As a complete analysis for all components in the GeoPEARL model would be very time consuming, the uncertainty analysis focussed on the soil schematisation and the two most important substance properties, i.e. the coefficient for the sorption on organic matter and the half-life in soil (Boesten, 1991). The analysis helps to quantify the contribution of uncertainty in a parameter on the outcome of the GeoPEARL model. The uncertainty analysis also gives the possibility to quantify the reliability of the model outcome. From the results recommendations can be formulated how to improve the soil schematisation in the GeoPEARL model.
MATERIAL AND METHODS
The sensitivity analysis in this study was done using the Monte Carlo method. Probability distributions of the uncertain input parameters of the GeoPEARL model were derived using the data on which the soil map of the Netherlands is based. From these probability distributions a large number of draws were made for a finite number of locations (in this case a grid) within the Netherlands. At these locations, the model is run for all draws, thus allowing an analysis of how uncertainties in the inputs propagate to the GeoPEARL output.
Soil properties
The following basic soil properties and inputs to GeoPEARL are considered uncertain in this work: clay content, silt content, sand content and organic matter content. These basic properties were chosen because GeoPEARL is sensitive to these properties and because at the national scale, where these properties must be derived from the 1 : 50,000 Dutch soil map, uncertainties can be substantial. The variation in depth is modelled by assuming constant values within the soil horizons of the soil profile at any location. To simulate soil properties in three dimensions use was made of the reference soil profile descriptions of the Dutch 1 : 50,000 soil map units, which typically contain between three and seven soil horizons. Although there is uncertainty in the spatial pattern of the soil map units, it was neglected in this study. At each sampling location, values for the soil properties of each soil horizon were simulated independently from the other soil properties in the same horizon and independently from all properties in all other horizons. The thickness of the soil horizon was considered uncertain as well. GeoPEARL also requires soil hydraulic properties, which often show strong spatial variation within mapping units of the 1 ; 50,000 soil map. In this study, uncertainty quantification in basic soil properties is based on findings from de Vries (1999), whereas uncertainty in soil hydraulic properties are based on variability in curves fitted to soil samples from the Staring series database.
Soil physical parameters refer to parameters that characterise the water retention and hydraulic conductivity characteristics of the soil. In the Netherlands, these characteristics are described in the Staring series, which is a database containing measured data of the water retention and hydraulic conductivity characteristics of soils (Wösten et al., 2001). The series present measured data of 36 different building blocks (18 for top- and subsoil, respectively). The number of samples in the database is 832. Curves were fitted for each of these samples using the RETC program (Van Genuchten et al., 1991). Each of the 36 building blocks has multiple associated curves. Some have over 100 curves, others fewer than 10. Each curve representing a building block was treated as a random sample from all curves that populate the building block. Thus, the differences between curves of a building block represent the uncertainty about them. However, this was not the only source of uncertainty in soil physical parameters, because the building
determined by entering a scheme that uniquely derives the building block from parent material, texture, organic matter and M50. Some of these inputs are uncertain and consequently so is the building block.
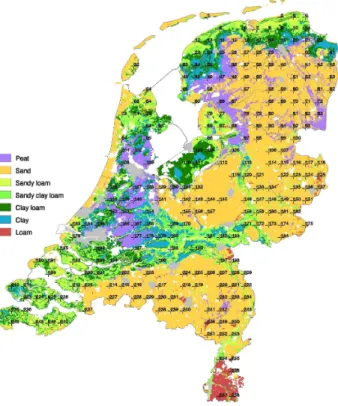
Figure 1: Randomly placed square grid sample used in the uncertainty analysis
In this study, GeoPEARL calculations were done for the nodes of a coarse grid with a grid mesh of 9.5 km (See Figure 1). The distances between locations are sufficiently large that spatial correlation in soil properties may safely be ignored. In addition, as stated above, correlation between soil properties from different horizons at the same location was also ignored. This greatly facilitates the subsequent analysis, although a critical analysis of the validity of this decision and its consequences for the results of the uncertainty analysis would be sensible. Pesticide properties
Probability distributions for the half-life of the pesticide in soil and for the coefficient of sorption to organic matter these properties were derived from data reported in the literature. Allen and Walker (1987) and Walker and Thompson (1977) studied the effect of soil properties on the rate of degradation of various pesticide in 18 soils, with a clay percentage greater than 15%..For these soils, the coefficient of variation was on average about 25%. They also studied the effect of soil properties on the sorption coefficient on organic matter. On average the coefficient of variation was about 25%.
As little is known on the relationship between half-life and sorption coefficient on the one hand and soil properties on the other, the coefficient of variation was assumed to be 25% for both pesticide properties. In this study, the uncertainty propagation from pesticide properties is evaluated for two representative substances. The mean half-life of substance 1 in soil is 20 days and that for substance 2 is 60 days. The mean Kom values were taken to be 35 and 60 L/kg for
substances 1 and 2, respectively. Both DT50 (under reference conditions) and Kom were assumed
constant in space and time and were represented by lognormal probability distributions with mean values equal to the mean values derived from experiments.
Statistical analysis
In the analysis of the PEC50 of a specified location, it is possible to use a regression-based approach. For each location, the probability distribution of the eight soil properties is known for a number of layers and in the simulation a number of draws are taken from these distributions. The model outputs (PEC50) for a range of values of a property can be used to derive the relationship between this property and PEC50 by a linear or spline regression, resulting in the top marginal variance for this property. The top marginal variance is also called the first-order sensitivity index or correlation ratio (Brus and Jansen, 2004). In case of an ordinary random sample, bootstrap methods can be used to constitute a (1-2α) bootstrap percentile confidence interval (Efron and Tibshirani, 1993) for the top marginal variance.
For the 90 percentile (P90) of the PEC50, it is not possible to analyse the relationship between the P90 and a soil property, because it varies in space. Therefore, a regression-free sensitivity analysis was used for the P90 (Jansen et al., 2005). In this study, four groups of independent input variables were defined: 1) organic matter content, 2) texture and van Genuchten-parameters, 3) half-life of the pesticide (DT50) and 4) sorption coefficient of the pesticide (Kom).
Unfortunately, a large number of the soil properties that are considered ended up in the second group. This is due to the fact that these properties could not be assumed (and drawn) independently. The organic matter content was assumed independent from the other soil properties, although this is not entirely correct.
A sensitivity and uncertainty analysis was done for six locations with soil types considered to be representative for large areas in the Netherlands. The area, soil type and some soil characteristics of each location are given in Table 1. First, a sensitivity analysis was done to assess the sensitivity for a specific input parameter on the PEC50 using the regression-free approach. The range of interest for the PEC50 are values between 0.0001 and 10.0 µg L-1. By transforming the data and calculating the top marginal variance after transformation, it is possible to look at the effect of the input variables with emphasis on this range. A suitable transformation is log(PEC50 + 1E-5). This results in a scale from -4 to 1 on the range of interest. By adding 1E-5 the very small values become -5 after transformation.
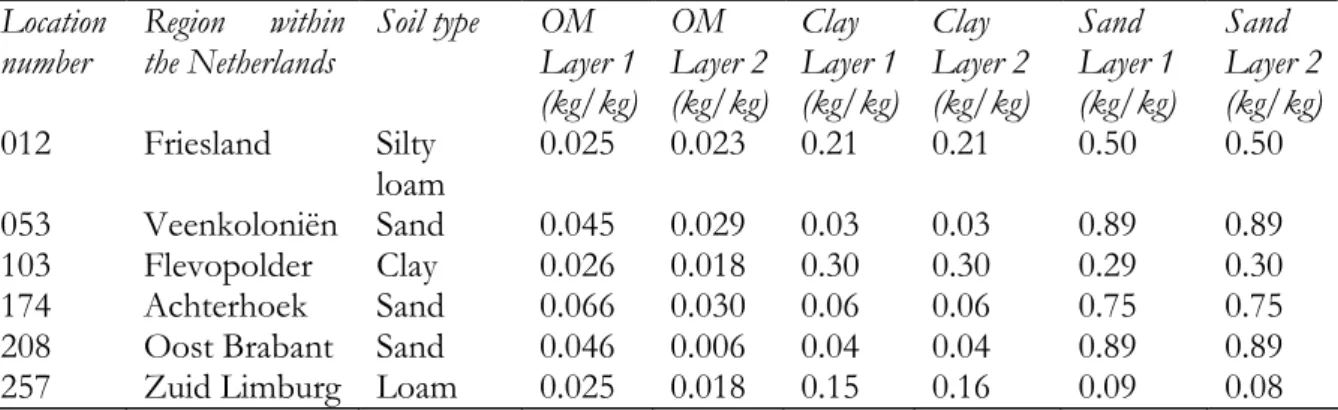
Table 1: Location number, region and soil type and some soil characteristics at the six locations
Location number Region within the Netherlands Soil type OM Layer 1 (kg/kg) OM Layer 2 (kg/kg) Clay Layer 1 (kg/kg) Clay Layer 2 (kg/kg) Sand Layer 1 (kg/kg) Sand Layer 2 (kg/kg) 012 Friesland Silty loam 0.025 0.023 0.21 0.21 0.50 0.50 053 Veenkoloniën Sand 0.045 0.029 0.03 0.03 0.89 0.89 103 Flevopolder Clay 0.026 0.018 0.30 0.30 0.29 0.30 174 Achterhoek Sand 0.066 0.030 0.06 0.06 0.75 0.75
208 Oost Brabant Sand 0.046 0.006 0.04 0.04 0.89 0.89
257 Zuid Limburg Loam 0.025 0.018 0.15 0.16 0.09 0.08
Secondly, a regression-based sensitivity analysis was done for the six locations. The top marginal variance was calculated by means of a spline regression using 1000 Monte Carlo runs of each location. The analysis is again based on the log-transformed PEC50. The R2-adjusted is the percentage variance accounted for when all input-parameters are fitted to the regression model. The splines are based on two degrees of freedom for all input parameters.
A sensitivity analysis was done for the spatial 90 percentile of the leaching concentrations at a depth of 1 m. The regression-free approach was followed for this analysis. The top marginal variance was calculated for these four groups of input-variables.
RESULTS
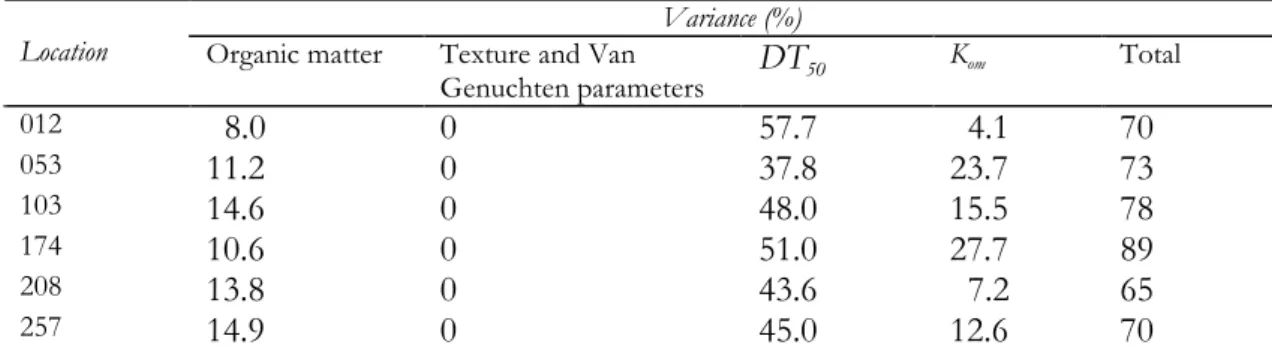
The top marginal variance (TMV) in the median Predicted Environmental Concentration (PEC50, in µg L-1) as calculated for the independent input groups of input-variables for substance 1 are given in Table 2. The TMV of DT50 at location 012 is 58 %. This means that the
variance in PEC50 would reduce with 58 % if the DT50 is known exactly. It also means that the
bottom marginal variance (BMV) of organic matter, Texture and VanGenuchten parameters and Kom is 42%. So, 42% of the variance in the model output will remain as long as these variables
remain uncertain (with their given distributions).
Table 2 shows that the uncertainty in DT50 is the main cause for the uncertainty in the PEC50.
The uncertainty in organic matter has some influence and the influence of Kom depends very
much on the location. The uncertainty of texture and VanGenuchten parameters do not result in uncertainty in the model output. The total TMV is 89% for location 174 which leaves only 11% unexplained. However, for location 208 these percentages are 65 and 35%. This suggests that interaction between the uncertain input parameters are important.
Table 2: Top marginal variance for different parameters for each location based on the PEC50 for substance 1.
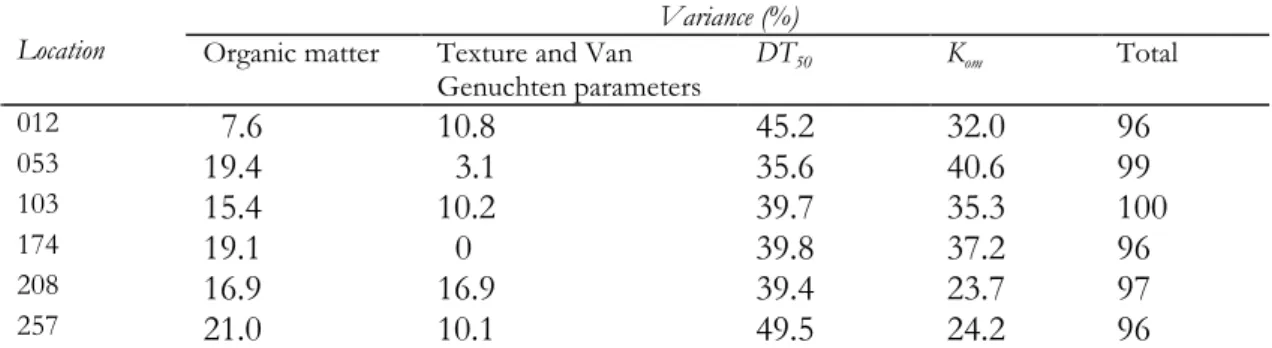
The results for substance 2 are given in Table 3. For this substance the uncertainties in both the DT50 and the Kom are the main cause for uncertainty in the PEC50. The effect of the uncertainty
in organic matter is substantially smaller. For this substance, there is some influence of uncertainty of texture and Van Genuchten parameters on the model output. This may be due to the effect of the longer half-life of substance 2 as compared with that of substance 1. A longer half-life in soil means that there is more time for interaction of the pesticide with the soil matrix in the subsoil. The total TMV is more than 96% for all six locations. For this substance there is no apparent interaction between the uncertain input parameters.
Variance (%) Location Organic matter Texture and Van
Genuchten parameters DT50 Kom Total 012 8.0 0 57.7 4.1 70 053 11.2 0 37.8 23.7 73 103 14.6 0 48.0 15.5 78 174 10.6 0 51.0 27.7 89 208 13.8 0 43.6 7.2 65 257 14.9 0 45.0 12.6 70
Table 3: Top marginal variance for different parameters for each location based on the PEC50 for substance 2.
The results of the regression-based sensitivity analyses for the 6 locations are given in Table 4. Here again, the highest TMVs were obtained for DT50 and Kom. The TMVs for texture and Van
Genuchten were small, the total ranging up to a few percent for location 012. The results using spline regression are very comparable with the results of the regression free approach shown in Tables 2 and 3. The TMVs for DT50 are more or less the same for all locations and substances.
For organic matter content the sum of the top marginal variances of the two layers are a few percent smaller for all locations. The TMVs are zero for the sum of the texture and Van Genuchten-parameters. For substance 1 the TMV is substantially larger for locations 012, 208 and 257.
Table 4. Top marginal variance (percentage) of inputs for each location for substance 1 using spline regression Input 012 053 103 174 208 257 DT50 58.1 46.0 51.2 49.1 52.7 49.5 Kom 23.7 32.9 24.9 30.4 20.6 25.5 OM layer 1 5.0 9.7 2.7 4.7 1.4 4.7 OM layer 2 0.3 2.4 2.2 0.7 1.7 4.4 Clay layer 1 0.0 0.4 0.0 0.0 0.0 0.0 Clay layer 2 0.1 0.3 0.2 0.3 0.0 0.0 Sand layer1 0.0 0.0 0.0 0.2 0.0 0.0 Sand layer2 0.3 0.1 0.3 0.2 0.5 0.0 Theta Sat 1.2 0.3 0.0 0.0 0.2 0.3 Alpha dry 0.4 0.2 0.5 0.0 0.1 0.6 Param N 0.7 0.4 0.0 0.0 0.3 0.1 Param L 0.7 0.0 1.0 0.0 0.3 0.0 R2adjusted 87.9 89.5 83.0 85.8 78.3 82.9
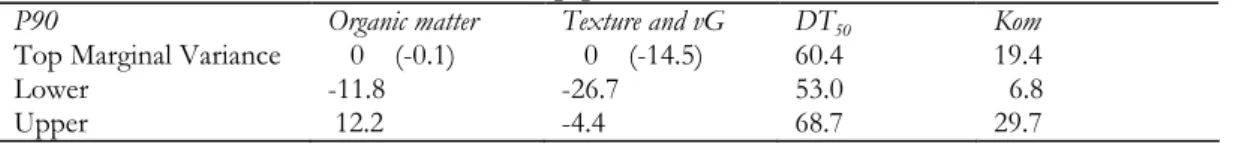
The results of the sensitivity analysis of P90 for substance 1 are presented in Table 5. The TMV for DT50 for substance 1 is 60%. This means that the variance in P90 would reduce with 60% if
the DT50 is known exactly for this substance. It also means that the BMV for organic matter,
texture and VanGenuchten and Kom is 40%. Hence, 40% of the variance in P90 will remain as
long as these variables remain uncertain (with their given distributions). The TMVs for organic matter and texture and VanGenuchten and Kom are zero and for Kom the top marginal variance is
19%, resulting in a total TMV of 79%. The 90% bootstrap percentile confidence interval for DT50 is comparatively small, whereas the interval is substantially broader for Kom.
Variance (%) Location Organic matter Texture and Van
Genuchten parameters DT50 Kom Total 012 7.6 10.8 45.2 32.0 96 053 19.4 3.1 35.6 40.6 99 103 15.4 10.2 39.7 35.3 100 174 19.1 0 39.8 37.2 96 208 16.9 16.9 39.4 23.7 97 257 21.0 10.1 49.5 24.2 96
Table 5. Top marginal variance (percentage) of input for each location based on the transformed P90 and the 90% bootstrap percentile confidence interval for substance 1.
P90 Organic matter Texture and vG DT50 Kom
Top Marginal Variance 0 (-0.1) 0 (-14.5) 60.4 19.4
Lower -11.8 -26.7 53.0 6.8
Upper 12.2 -4.4 68.7 29.7
DISCUSSION
For the median leaching concentration over time (PEC50) at a location, the highest TMVs were calculated for DT50, meaning that uncertainty in this input parameter results in comparatively
large uncertainty in PEC50. The TMVs calculated for Kom and organic matter were smaller, but
uncertainty in these parameters will also result in a substantial uncertainty in the PEC50. For the substance with a comparatively short half-life (mean value 20 days) there was no effect of uncertainty in texture and Van Genuchten parameters on PEC50, but for the substance with higher DT50 and Kom this effect was substantial. Possibly this is due to the increased time for
interaction beteen pesticide and soil. For the substance with a comparatively low half-life in soil the total variance at the six locations was substantially smaller than for the substance with the longer half-life in soil (mean value 60 days).
For the 90 percentile leaching concentration in space, the most important source of uncertainty on the model output is DT50 and to a lesser degree Kom. To reduce the uncertainty in the target
concentration used in exposure assessment studies, accurate input of this parameter is needed. To achieve this, more insight is needed on dependence of half-life on soil type. This dependency can be introduced into GeoPEARL using the concept of a reference half-life and correction factors to take the different soil parameters (e.g. organic matter) into account (Tiktak et al., 2004).
Both DT50 and Kom were assumed to be constant in space within the same MonteCarlo run for all
locations, whereas in reality values for these parameters are likely to differ between locations. Therefore, further improvement of the uncertainty analysis is undertaken by drawing values of these parameters from the probability functions for all locations. It may be expected that the effect of uncertainty in these parameters on the spatial P90 will decrease somewhat.
The correlation between uncertainties in soil properties at different depths was also neglected. This assumption was primarily based on pragmatism, because of a lack of knowledge how to describe these correlations. However, the effect of this assumption can be that the effect of uncertainties are leveled out. To quantify the impact of this assumption more measurements of soil properties for the same soil type would be required for a comparison of simulated soil properties with and without taking these correlations into account.
In the uncertainty analysis it was assumed that there was no spatial correlation in the uncertainty of the soil properties. This was considered justifiable because use was made of a comparatively wide network of grid points, so locations were not close to each other. However, if an assessment is needed on the effect of uncertainty in the soil properties on a regional scale then spatial correlation can no longer be neglected.
In this study only the soil parameters and the pesticide parameters were studied. However, there is also uncertainty in other input data, such as the bottom boundary condition, land use data and drainage data. It would be of interest to study the effect of these uncertainties on the spatial 90 percentile of leaching concentrations. In this way an overall view would be obtained of the effect of all uncertainties and such information can be used to identify the weakest parts of the GeoPEARL model chain to prioritize further improvements.
CONCLUSION
The most important sources of uncertainty are the half-life of the pesticide in soil and its coefficient for sorption to organic matter. Uncertainty in the VanGenuchten parameters and the mineral composition had little effect on the uncertainty in the model output.
To reduce the uncertainty in median leaching concentration in time at a location and that in the 90-percentile leaching concentration in space, more accurate data are needed on the DT50 in
various soil types. This would require measurements on this parameter in different soil types under prevailing field conditions, as well as a method to quantify the effect of relevant soil parameters on DT50. Further, the procedure to derive input values for these parameters need to be
improved to take the spatial variability of these values better into account.
The conclusions regarding the sensitivity analyses are in general the same in the regression-based and regression-free approach. However, the number of independent groups in the regression free analysis is limited. For a more detailed analysis of uncertainties in all relevant input parameters a regression-based approach is needed.
To improve the quantification of the effect of uncertainty in organic matter content on model output the correlation between the organic matter content between layers in the same soil profile should be taken into account. A method needs to be developed to describe this correlation.
ACKNOWLEDGEMENTS
This project was part of KwaliteitsSlag, a research programme to improve the quality of models of Wageningen-UR used by the Netherlands Environmental Assessment Agency.
REFERENCES
Allen, R., Walker, A., 1987. The influence of soil properties on the rates of degradation of metamitron, metazachlor and metribuzin. Pesticide Science 18: 95-111.
Boesten, J.J.T.I., 1991. Sensitivity analysis of a mathematical model for pesticide leaching to groundwater, Pest. Sci. 31, 375-388.
Brus, D., Jansen M.J.W., 2004. Uncertainty and sensitivity analysis of spatial predictions of heavy metals in wheat. Journal Environmental Quality 33, 882-890.
Efron B., Tibshirani, R.J., 1993. An introduction to the bootstrap. Chapman & Hall, New York, USA, p 436.
Jansen M.J.W., Thissen J.T.N.M., Withagen J.C.M., 2005. USAGE uncertainty and sensitivity in a GenStat environment. Manual, version 2.0. Biometris report 11.12.05, Wageningen, The Netherlands.
Kroon, T., Finke, P., Peereboom, I., Beuzen, A., 2001. Redesign STONE. De nieuwe schematisatie voor Stone: de ruimtelijke indeling en de toekenning van hydrologische en bodemchemische paramaters. Lelystad, RIZA, rapport 2001.017.
Saltelli A., Chan K., Scott E.M., 2000. Sensitivity analysis. John Wiley & Sons, Ltd, Chichester, UK, p 475.
Tiktak, A., van der Linden, A.M.A., Boesten J.J.T.I., Kruijne, R., van Kraalingen, D., 2004. The GeoPEARL model. Part II. User guide and model description update. RIVM report 716601008.
Van Genuchten, M. Th., Leij, F.J., Yates, S.R., 1991. The RETC code for quantifying the hydraulic functions of unsaturated soils. U.S. Salinity Laboratory, Riverside, California, USA. Vries, F. de, 1999. Karakterisering van Nederlandse gronden naar fysisch-chemische kenmerken.
Walker A., Thompson, J.A., 1977. The degradation of simazine, linuron and propyzamide in different soils. Weed Research 17, 399-405.
Wösten, J.H.M., Veerman, G.J., de Groot, W.J.M., Stolte J., 2001. Waterretentie- en doorlatendheidskarakteristieken van boven- en ondergronden in Nederland: de Staringreeks. Vernieuwde uitgave 2001. Wageningen, ALTERRA rapport 153.