<,5
RIJKSINSTITUUT VOOR VOLKSGEZONDHEID E N M I L I E U H Y G I Ë N E BILTHOVEN
Rapportnummer 730501.044
INTERLABORATORY COMPARISON STUDY ON DIOXINS IN COW'S MILK
A.P.J.M. de Jong, A.K.D.Liem and R. Hoogerbrugge
February 1992.
Onderzoek in samenwerking met:
Bundesgesundheitsamt, Berlin, FRG (dr. A. Dross);
Chemisches Landesuntersuchungsamt Nordrhein Westfalen, Munster, FRG (dr. P. Fürst);
Institute of Environmental Chemistry, University of Umea, Umea, Sweden (dr. G. Lindström);
Ergo Forschungsgesellschaft, Hamburg, FRG (dr. 0. Papke);
Ministry of Agriculture, Fisheries and Food, Food Science Laboratory, Norwich, UK (dr. J.R. Startin)
Dit onderzoek werd uitgevoerd ten behoeve van het project
^Persistente Stoffen' (project nummer 730501) in het kader van het onderzoek naar dioxineproblematiek rondom stationaire bronnen in Nederland.
1 1
MAILING LIST
1-5 Hoofdinspectie van de Volksgezondheid voor de Hygiëne, van het Milieu
6-9 Hoofdinspectie Gezondheidsbescherming
10-13 Directie Voedings- en Veterinaire Aangelegenheden en Produktveiligheid
14-16 Geneeskundige Hoofdinspectie van de Volksgezondheid 17-21 Veterinaire Hoofdinspectie van de Volksgezondheid
22 Hoofdinspecteur van de Inspectie Gezondheidsbescherming 23 Hoofdinspecteur voor de Geestelijke Volksgezondheid 24 Directeur-Generaal voor de Volksgezondheid
25 Directeur-Generaal Milieubeheer
26 Plv. Directeur-Generaal Milieubeheer
27-42 Voorzitter Interdepartementale Coördinatiecommissie Dioxineproblematiek
43-53 Voorzitter Begeleidingscomissie Dioxine-onderzoek 54-63 Overleggroep Dioxine-onderzoek RIKILT/RIVM
64-73 Projectgroep Dioxine-onderzoek RIVM
74 Depot voor Nederlandse Publicaties en Nederlandse Bibliografie
75 Directie RIVM
76 Dr. R.M. van Aalst
77 Dr.Ir. C. van den Akker 78 Ir. A.H.M. Bresser
79 Dr. F.J.J. Brinkmann 80 Drs. A. van der Giessen 81 Dr. H.A. van 't Klooster 82 Mw.Drs. A.G.A.C. Knaap 83 Mw. L.M. Oostwouder
84-94 Auteurs en medewerkenden 95 Documentatiecentrum ACT 96-97 Bibliotheek RIVM
98 Bureau Projecten en Rapportenregistratie 99-111 Reserve-exemplaren
CONTENTS Mailing list ii Contents iii Summary iv Samenvatting iv Introduction 1 Materials and methods 2
Results 4 Discussion 5 Acknowledgement 7
References 7
Table 1. PCDD/F levels in cow's milk samples by individual
participants. Means of triplicate samples. 8
Table 2. Analytical performance of methods. 9 Table 3. Comparison of relative levels of three major
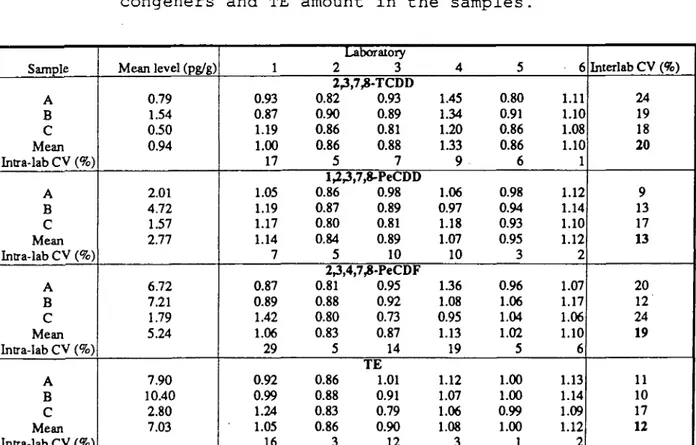
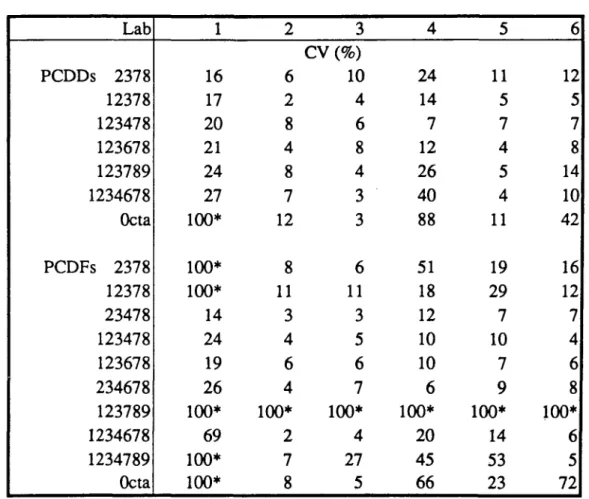
congeners and TE amount in the samples. 9 Table 4. Reproducibility for the determination of individual
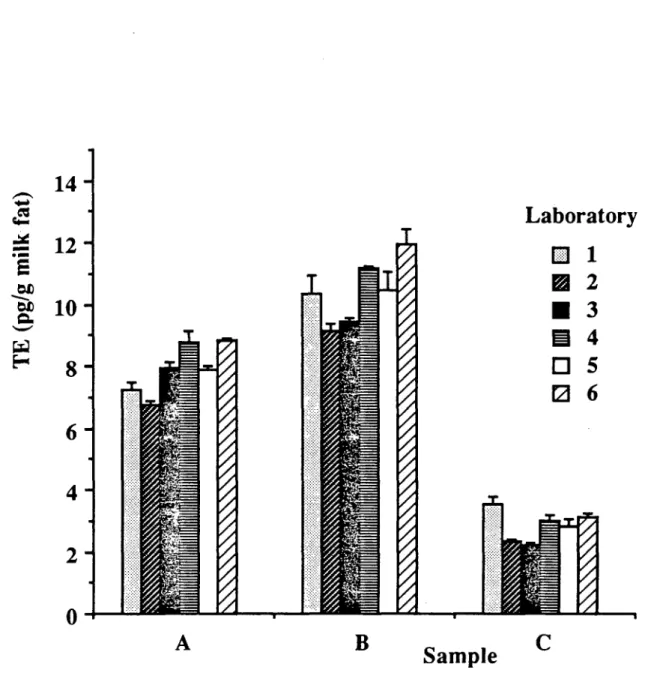
congeners in cow's milk. 10 Figure 1. TE levels (mean n=3) in cow's milk samples as
determined by participants. 11 Figure 2. Comparison of relative TE levels by participants. 12
IV
SUMMARY
Six laboratories in four European countries (GER, GB, S, NL) have conducted an interlaboratory comparison study on the analysis of dioxins in cow's milk. The study comprised a cross comparison of standards and the analysis of the 2,3,7,8-substituted congeners of PCDD/Fs in three different milk pools (no spiking). Participants have used their own procedures and methods for fat and dioxin determination in biological samples, all using non-polar gas chromatography and medium to high resolution mass spectrometry (RP=3.000-10.000). Quantification was performed by the use of a common quantification standard mixture of the native PCDD/Fs (4 labs) or the own quantification standards (2 labs).
Within-laboratory reproducibilities for the determination of the major toxic isomers and the total TCDD toxicity equivalence (TE)
level were between 2 and 16% (relative standard deviation (RSD)) with a mean of 8%. The interlaboratory variabilty in TE values was less than 12% (RSD) for TE values between 2.8 and 10.4 pg/g milk fat. The reliability of participant standards was difficult to assess and probably less good than expected. Deviations between found and expected concentrations in these standards were on average within 25% and for some congeners to 50% in some laboratories, when quantified against a common standard.
SAMENVATTING
Dit rapport beschrijft de resultaten van een ringonderzoek gehouden tussen zes laboratoria uit vier Europese landen (GER, GB, S, NL) voor de analyse van dioxinen in koemelk. Het onderzoek omvatte de vergelijking van standaarden en de analyse van de 2,3,7,8-gesubstitueerde congeneren van PCDD/F in drie verschillende melkmonsters (zonder toevoegingen). Deelnemers hebben gebruik gemaakt van de eigen methoden en technieken voor extractie en clean-up en de analyse van dioxinen in biologisch materiaal door middel van hoogoplossend vermogen gas chromatografie-massaspectrometrie (RP=3-10,000). Voor kwantificering is gebruik gemaakt van gemeenschappelijke standaarden (4 laboratoria) dan wel van de eigen standaarden (2 laboratoria).
De intra-laboratorium reproduceerbaarheid voor de bepaling van de belangrijkste congeneren en het TCDD toxiciteitsgehalte (TEQ) lag gemiddeld binnen een spreiding van 8% (range 2-16%) . De vergelijkbaarheid tussen de laboratoria onderling van de resultaten op TE basis kwamen overeen binnen een spreiding van 12%
(RSD), voor gehalten tussen 2.8 en 10.4 pg TEQ/g melkvet. De kwantitatieve betrouwbaarheid van de standaarden van de deelnemers in dit ringonderzoek kon niet eenduidig worden vastgesteld. De resultaten van de kwantificering tegen de gemeenschappelijke standaard lieten afwijkingen zien tot 25% tussen gemeten en verwachte waarden en voor enkele van de zeventien congeneren tot 50% in sommige laboratoria.
INTRODUCTION
Dairy products are known to be an important route for human intake of dioxins. Estimates from diet studies by Fürst [1], Beck [2] and, more recently, by Liem et al [3] indicate that dioxins in cow's milk contribute about half of the daily intake. Nevertheless, levels in cow's milk are normally low and difficult to assess. Background levels in most countries are typically below 1-2 pg 2,3,7,8-TCDD equivalence amounts (TE) per gram of milk fat (ppt). Increased levels may occur in milk when cows graze in areas with elevated ambient air levels and associated increased deposition rates, for example in the vicinity of municipal waste incinerators and other processes with dioxins emissions to air [4,5] . Rappe et al [4] have reported for the first time on the phenomenom of the entering of dioxins to a significant extent into the dairy food chain in areas with increased deposition rates. This has been confirmed by others for different areas and sources [5,6,7]. Since then, dioxins in cow's milk have become an issue of general public interest and health risk concern. As a result, some countries have established regulatory measures to prevent the population from extra-ordinary daily exposures by consumption of contaminated milk and other dairy products. Such regulatory measures imply a strong demand for sensitive and reliable analytical methods for the determination of dioxins in dairy products.
In recent years, analysis of ultra-trace levels in biological samples has become possible by the availability of highly sensitive high-resolution gas chromatography-mass spectrometry
(GC-HRMS) instrumentation and by the development of effective and reliable sample extraction and clean-up procedures. Detection limits of modern GC-HRMS instruments are in the low femtogram range on column, enabling the analysis of the individual toxic congeners at the sub-ppt level in biological samples.
Recent round robin studies [8] have shown that the analysis of dioxins in biological samples can be performed by experienced laboratories with reasonably good precision and good agreement between laboratories when using modern methods and techniques.
This interlaboratory calibration study was conducted by six laboratories in Europe in order to establish the state-of-the-art of present methods for analysis of dioxins at the low ppt-level in cow's milk.
-2-MATERIALS AND METHODS
Source of milk. Fresh cow's milk samples (3 L) were obtained from dairy farms (A, B and C) in the vicinity of dioxin emitting sources. Samples were collected from the milk storage containers and immediately thereafter divided into twenty aliquots of approximately 150 ml each. Sampling was carried out by the end of January 1990. Samples were stored at -20°C until shipment to participants. Sample sizes were determined by weight. Selection of farms was based on results of previous milk analysis, being between 5 and 8 in milk of dairy farm A, between 8 and 11 for B and between 2 and 3 pg TEQ/g milk fat in the milk of farm C. Farm A is situated close (about 1 km NE) to a metal reclamation plant, B at approx. 3 km North of a municpal waste incinerator (MSW) with known high dioxin emission rates and C approx. 5 km South-East of a small capacity MSW. It is noted that dioxin levels in cow's milk may vary considerably with time, particularly with the change of
seasons due to differences in the diet of cows.
Standards. 2,3,7,8-substituted PCDD/F reference compounds in n-nonane, referred to in this work as study standards, were obtained from Cambridge Isotope Laboratories (CIL, Woburn, MA, USA). From these stock solutions, two mixtures have been prepared containing accurately known amounts of the seventeen native 2,3,7,8-substituted congeners of PCDD/Fs and ten 2,3,7,8-2,3,7,8-substituted carbon-13 labeled analogues, respectively. Participants were provided with essentially equally amounts of each mixture in dry
film form, the solvent being evaporated to dryness under a gentle stream of nitrogen at 4 0°C. Transportation of the carefully sealed vials from the laboratory responsible for the preparation to the coordinating laboratory was done without further precautions
(ambient temperature, by air ) .
Shipment. Frozen milk samples together with the standards were placed together with excess of dry ice in well isolated boxes and shipped from the coordinating laboratory to the participant laboratories. On receipt, the condition of samples and standards, e.g.frozen, no leakage or damage was back reported, and samples were restored at approx. -20°C until analysis.
Protocol. The protocol for the study of dioxins in cow's milk and comparison of standards included the following:
A. Cross-comparison of standards. Participants were instructed to prepare two separate mixtures in about one to one ratio, one containing the own native PCDD/Fs and the study carbon-13 standards (mix-I) and the other containing the study native
PCDD/Fs and the own ^•^Ci2~l^^®l®'^ standards (mix-II) . Both mixtures were analysed by each laboratory in seven consecutive injections . B. M i l k a n a l y s i s . After thawing, milk samples were fortified and incubated within the original flasks with exactly the same aliquot of the 'own' carbon-13-PCDD/F internal standard mixture as was used in the standard mixture-II. Participants were instructed to use their own methods and procedures for fat and dioxin determination in biological samples.
Ouality a.ssurance and control. Participant laboratories are using certain QA/QC procedures to document the quality of their analysis. Generally, procedures comprises the analyses of method and procedural blanks and the use of criteria to be met for isomer-specificity of GC separations, the sensitivity and resolving power of the mass spectrometer, and criteria for identification and quantitation of congeners (retention times, S/N ratios and isotope ratios for both analytes and internal standards). In this study, participants were asked to demonstrate their actual analytical performance at each individual analysis by reporting on: (1) the separation obtained between 1,2,3,4,7,8-HxCDF and 1,2,3, 6,7,8-1,2,3,4,7,8-HxCDF; (2) S/N ratios for the ion traces of 1,2,3,7,8-PeCDF and (3) the intensity ratio for the two isotope ions of the molecular ion chlorine cluster of 1,2,3,7,8-PeCDF
(M/M-t-2 or M-I-2/M+4) .
Quantification. Positively identified PCDD/Fs in samples with a S/N ratio ,> 3, were quantified on the basis of the response ratios to the native standards in the quantifying mixture (mix-II) by the use of the common C-13 labeled internal standards. In case of doubt on the quality of the provided study PCDD/F standard mixture, the protocol allowed the use of the own quantification standards. Laboratry 3, 4, 5 and 6 have used the study standards and laboratory 1 and 2 their own standards. Response ratios used in the quantification procedure were determined from sevenfold analyses of standard mixture mix-II (see protocol section).
Reporting- The following results were included in the reporting: A. Comparison o f s t a n d a r d s : (1) the amount for each congener and surrogate in standard mixtures mix-I and II (in ng/ml); (2) mean response ratios relative to the own C-13 internal standards, ranges and standard deviations for the native PCDD/Fs in mix-I and II, as determined by sevenfold analysis.
B. M i l k a n a l y s i s . For each milk sample separately: (1) amounts of added carbon-13 labeled internal standards (in pg absolute); (2) the sample size (in g) (3) the fat content (in w - % ) ; (4)
r
-4-concentrations of individual 2,3,7,8-substituted PCDD/Fs, expressed both on fat basis (in pg/g milk fat) and whole milk basis (in pg/kg); (5) for analytes below the detection limit, the appropriate determination limit at S/N=3; (6) S/N and isotope ratios for 1,2,3,7,8-PeCDF and (7) the overlap between 1,2,3,4,7,8-HxCDF and 1,2,3,6,7,8-HxCDF (in % of the heighest peak).
Statistical evaluation
The analytical results of the various laboratories were evaluated using straight forward statistics. Differences in results were relatively small and no need was found for any transformation of the data. The means of the 6 participants were interpreted as the most reliable estimate of the ^true' values. The data have been tested for outliers, but outliers found were not rejected from the data set as their influence on the overall evaluation was neglectabe. Prior to statistical evalution, data have been normalised to the corresponding mean (relative values) in the sample. The interlaboratory coefficient of variation (CV) was calculated from the standard deviation of the normalised values by each participant and sample and the intralaboratory CV from the comparison of the triplicate analysis of the three samples by each laboratory .
Intra-assay precisions were computed from the average variances in triplicate analysis of each sample. In this calculation, a level of half the reported determination limit and a confidence interval of 100% was used for undetected analytes
RESULTS
The analytical results reported by the participant laboratories are given in table 1. Results are the means of triplicate samples in each milk pool. In addition, 2,3,7,8-TCDD toxic equivalence values (TE) were calculated from the weighed sum of TE values by individual PCDD/F isomers using the international toxicity equivalence factors (i-TEF). TE levels in samples A, B and C (mean of six laboratories) were 7.9, 10.4 and 2.8 pg TE/g milk fat, respectively (fig. 1) . Data on the analysis performance are given in table 2. For comparison of intra and inter-laboratory variabilities, isomer and TE values by individual laboratories are expressed relative to the corresponding means (table 3, figure 2) . From this table, it follows that the intralaboratory reproducibility for TE values was between 2-16% (RSD) with a mean of 8%. Deviations from the mean by individual laboratories were between -14 and +12 %, with relative standard deviations of 11, 10 and 17% in pool A, B and C, respectively. Together, the inter and
intra-laboratory variabilities correspond to an interlaboratory agreement on TE basis within 12 %.
Results for the indiviudal isomers parallel that of TE values, particularly for the three major toxic constituents in cow's milk 2,3,4,7,8-PeCDF, 1,2,3,7,8-PeCDD and 2,3,7,8-TCDD. Mean values for these isomers in sample A, B and C were 5.2, 2.8 and 0.9 pg/g milk fat, respectively. The agreement was within RSD values of 19, 13 and 20%, respectively. Differences in standards were possibly a major reason for the systematic differences (see table 2) in this study. Observed differences in the study standard (fig. 3) were in the range of 5 - 25 % for most of the isomers and laboratories to 50% in some cases. The means (four labs) were quite close (±10%) to the expected values, except for 2,3,7,8-TCDF and octa-CDD. These were found significantly lower in the study standard. This relatively large deviations may reflect the problems that have been introduced by the use of standards in dry film form, and may have varied for the different aliquots and reconstitution methods used in the laboratories.
In table 4, the inter-assay reproducibility in cow's milk are shown for each isomer and participant. In general, reproducibilities were within 10% (RSD) for levels above 1 pg/g milk fat (ppt), between 10 and 20% for levels between 0.5 and 1 ppt and approximately 75% for isomers near the determination limit (S/N=3). Levels of undetected isomers were taken equal to half the corresponding limit of determination (LOD) with a confidence interval of 100%. LCDs were close for most participants, except for laboratory 1, which had limits about 5 times higher due to the use of a less sensitive mass spectrometer. In general, LCDs were between 0.1 and 0.5 pg/g fat (ppt) for tetra through octachloro congeners. Some of the congeners, particularly octa-CDD/F, appeared to be more difficult to assess than the lower chlorinated congers. Results for these congeners show not only larger intra-laboratory variability but also lager differences between laboratories. The latter might be due to possible cross-contamination of samples in laboratories and the first owing to the less good GC properties of highly substituted congeners, which is accompanied by less acurate peak area determinations.
DISCUSSION
The results of this study clearly show that ultra-trace levels of dioxins in cow's milk can currently be analysed with sufficient sensitivity and with good precision and agreement between laboratories when using advanced analysis methods and techniques. Limits of determination of methods used in this work were between 0.1 and 0.5 pg/g milk fat for the different congeners. Detection
-6-limits on TE basis at the sub-ppt level are in part facilitated by the typical isomer pattern in milk, which is dominated by three congeners 2,3,7,8-TCDD (i-TEF=l), 1,2,3,7,8-PeCDD and 2,3,4,7,8-PeCD (both i-TEF=0.5). The ratio in which they normally occur in milk , i.e. background as well as fly ash exposed cows, about 1:3:5 (concentration) or in a ratio of 2:3:5 on TE basis. In practice, this means that about 80% of the TE level can be quantified with a lowest congener level (TCDD) near the detection limit of about 0,1 pg/g. Based on the results of this work, the confidence level for such low TE values is estimated on between 25 to 50%. The precison for the higher levels in the present study work was about 8% for a mean TE value of 7.03 pg/g milk fat.
Contrary to expected, major difficulties in this calibration study occurred in the comparison of standards, and not in the analysis of real samples. A major problem was the comparison and calibration of the different standard mixtures. The main reason obviously was the apparant differences in concentration in study standard at the different laboratories. These standards have been shipped in dry film form to prevent from other possible difficulties which may occur with the transport of standards in solution. However, dry standards are known to be sensitive for adsorption to glass ware which may give rise to irreversible losses. This can possibly be avoided to a large extent by a prior deactivation of the vials, e.g. by silylation. The systematic errors in this study which were between -14±3% (lab 2) to -l-12±2%
(lab 6) , are most likely introduced by the erratic concentrations in quantifying mixtures. These are estimated to account for an additional error of about 5% onto the overall intralaboratory variability of 7.4%.
The results of this study clearly demonstrate that progress has been continued in the last few years on the improvement of methods and techniques for analysis of dioxins in biological samples. The present results compare favourably with results of previous calibration studies on dioxins in human milk from 1989, of which in turn results were considerably better when compared to a similar study held in 1987 [9].
In summary, it is concluded that present methods are capable of sensitive and precise analysis of the toxic TCDD/F congeners in cow's milk at a level below 1 pg TE/g milk fat. A second, more general conclusion is that there is a great need for certified standards, which are indispensable for a proper calibration and validation of methods and for the assessment of true dioxin levels in different biological species.
ACKNOWLEDGEMENT
We are very greatful to Mr. J.A. Marsman and Mrs. W.C. Hijman for sample extractions and clean-up and Mr. A.C. den Boer and Mr. R.S. den Hartog for perporming GCMS analysis.
REFERENCES
1. Fürst, P., C. Fürst, W. Goebel. Levels of PCDDs and PCDFs in food-stuffs from the federal republic of Germany. Chemosphere 1990; 20: 787-92.
2. Beck, H., K. Eckart, W. Mathar and R. Wittkowski. PCDD and PCDF body burden from food intake in the FRG. Chemosphere 1989; 18: 417-24.
3. Liem, A.K.D., A.P.J.M. de Jong, R.M.C. Theelen, J.H. Wijnen, P.C. Beijen, H.A. van der Schee, H.A.M.G. Vaessen, G. Kleter and J.A. Van Zorge. Occurrence of dioxins and related compounds in Dutch foodstuffs. Part I: sampling strategy and analytical results. Presented at 11th International Symposium on Chlorinated Dioxins and Related Compounds, Dioxin 91. Research Triangle Park, NO, USA, 23-27 September 1991.
4. Rappe C , M. Nygren, G. Lindström, H.R. Buser, O. Blaser, C. Wütrich. Polychlorinated dibenzofurans and dibenzo-p-dioxins and other chlorinated contaminants in cow's milk from various location in Switzerland. Environ. Sci. Techn. 1987; 21: 964-70.
5. Liem, A.D.K., Hoogerbrugge, R., Kootstra, P.R., Van der Velde E,G, De Jong, A.P.J.M. Occurrence of dioxins in cow's milk in the vicinity of municipal waste incinerators and a metal reclamation plant in the Netherlands. Chemosphere, 1991, in press.
6. Startin, J.R., C, Wright, M. Kelly and J. Gilbert. PCDDs and PCDFs in UK foods. Presented at 11th International Symposium on Chlorinated Dioxins and Related Compounds, Dioxin 91. Research Triangle Park, NC, USA, 23-27 September 1991.
7. Riss, A., Hagenmaier H. Comparison of PCDD/PCDF levels'in soil, grass, cow's milk, human blood and spruce needles in an area of PCDD/PCDF contamination through emissions from a metal reclamation plant in Austria. Proceedings of DIOXIN '88, Umea, September 21-26, 1988.
8. Stephens, R.D., C. Rappe, D. Hayward, M. Nygren, J. Startin, P. Christensen, E. Yrjanheikki . WHO international interlaboratory calibration study on PCDD and PCDFs in huiman blood and milk; Analysis of results of laboratories, analytical methods and data quality for the seventeen toxic congeners. Presented at the 11th International Symposium on Chlorinated Dioxins and Related Compounds, Dioxin 91. Research Triangle Park, NC, USA, 23-27 September 1991.
9. Yrjanheikki E.J. (ed.). Levels of PCBs, PCDD s and PCDFs in breast milk. Envirinmental Health series 34, World Health Organization, Regional Office for Europe, FADL Publishers, Copenhagen, Denmark, 1989.
Sample Lab PCDDs 2378 12378 123478 123678 123789 1234678 12346789 PCDFs 2378 12378 23478 123478 123678 234678 123789 1234678 1234789 12346789 Total I-TEQ Fat content (%) A 1 0.7 2.1 1.0 3.6 1.1 3.5 ND ND ND 6.2 6.7 6.0 4.1 ND 5.3 ND ND 7.211.2 4.1 2 0.7 1.7 1.3 2.9 0.9 3.4 2.9 0.7 0.6 5.8 8.3 4.4 4.2 ND 2.9 0.5 0.5 6.7±0.2 4 3 0.7 2.0 1.2 3.5 1.0 3.1 1.3 0.6 0.6 6.8 9.3 5.9 5.7 ND 4.0 1.0 0.4 8.0±1.0 4.1 4 1.2 2.1 1.6 3.5 1.4 5.3 12.0 1.3 0.9 7.3 10.2 5.0 4.7 0.2 4.6 0.9 1.6 8.8±03 4.3 5 0.6 2.0 1.2 2.9 1.5 3.0 2.7 0.7 0.7 6.9 10.2 5.3 4.9 ND 3.5 1.2 0.5 7.810.1 4.4 6 0.9 2.3 1.6 2.9 1.1 3.6 4.9 0.8 0.9 7.9 11.3 5.4 5.8 ND 4.0 1.3 1.9 8.810.2 3.9 B 1 1.3 5.6 2.7 6.8 2.1 4.4 ND ND ND 6.4 5.6 6.1 5.6 ND 4.3 ND ND 10.311.6 4.2 2 1.4 4.1 2.5 5.2 1.5 4.3 3.8 0.2 0.3 6.3 5.4 4.7 5.5 ND 2.9 0.2 ND 9.210.3 4.1 3 1.4 4.2 2.2 5.1 1.5 4.3 2.1 0.2 0.3 6.6 5.4 5.3 6.1 ND 3.3 0.3 0.3 9.511.1 4.2 4 2.0 4.6 3.0 5.1 1.8 6.5 12.5 1.2 0.4 7.8 6.4 5.0 5.4 0.2 3.8 0.5 1.4 5 1.4 4.4 2.6 5.1 2.6 4.0 3.7 0.3 0.4 7.7 6.8 5.4 6.4 ND 3.5 0.3^ 0.5 11.210.3 10.510.1 4.4 4.5 6 1.6 5.0 3.0 4.8 1.7 5.0 3.3 0.3 0.4 7.8 6.4 5.0 7.3 ND 3.5 0.3 0.2 11.910.2 3.9
c . 1
1 0.6 1.8 0.6 1.3 0.6 1.3 ND ND ND 2.5 1.9 1.5 1.0 ND 1.9 ND ND 3.5ifl.6 4.8 2 0.4 1.3 0.6 1.3 0.5 1.3 2.1 0.1 0.1 1.4 1.2 0.9 0.8 ND 0.4 ND ND 2.310.1 4.8 3 0.4 1.3 0.6 1.2 0.5 0.9 0.7 0.1 0.1 1 3 1.2 1.0 0.7 ND 0.5 0.1 0.1 2.310.3 4.8 4 0.6 1.9 0.6 1.5 0.6 2.1 8.5 0.6 0.2 1.7 1.4 1.1 0.8 ND 0.7 . N D 1.0 S.lifl.l 4.7 5 0.4 1.5 0.7 1.2 0.8 1.1 1.9 0.2 0.1 1.9 1.8 0.2 I.O ND 1.1 0.2 0.4 2.710.0 5.1 6 0.6 1.8 0.9 1.4 0.6 1.3 1.3 0.2 0.2 2.0 1.6 1.2 1.1 ND 0.6 ND ND 3.110.1 4.4 I CD IND: below detection limit (S/N = 3)
Table 1. PCDD/F levels in cow's milk samples by
Table 2. Analytical performance of methods. Lab/sample 1 2 3 4 5 6 A NR 13 22 10 13 9 S/N B NR 8 20 4 10 17 C NR 5 6 3 6 3 Isotope.ratio A B NR NR 1.64* 1.51* 1.62* 1.65* 0.74 0.87 0.57 0.63 0.65 0.64 C NR 1.76* 1.51* 1.16 0.54 0.67 Separation A B NR NR 13 15 28 28 12 11 10 10 8 12 C NR 12 25 10 10 13
S/N: for M of 1,2,3,7,8-PeCDF in sample
Isotope ratio for M/M+2 or (*) M+2/M+4 of 1,2,3.7.8-PeCDF (theoreücal raüo 0.61 and 1.52, resp.) Separation: height of valley between 1,2,3,4,7,8 and 1,2,3,6,7,8-HxCDF
NR: not reported
Table 3. Comparison of relative levels of three major congeners and TE amount in the samples.
Sample A B C Mean Inlra-lab CV (%) A B C Mean Intra-lab CV (%) A B C Mean Intra-lab CV (%) A B C Mean Intra-lab CV (%) Mean level (pg/g) 0.79 1.54 0.50 0.94 2.01 4.72 1.57 2.77 6.72 7.21 1.79 5.24 7.90 10.40 2.80 7.03 1 0.93 0.87 1.19 1.00 17 1.05 1.19 1.17 1.14 7 0.87 0.89 1.42 1.06 29 0.92 0.99 1.24 1.05 16 Laboratory 2 3 2^,7^-TCDD 0.82 0.93 0.90 0.89 0.86 0.81 0.86 0.88 5 7 1^^,7,8-PeCDD 0.86 0.98 0.87 0.89 0.80 0.81 0.84 0.89 5 10 2;j,4,7^-PeCDF 0.81 0.95 0.88 0.92 0.80 0.73 0.83 0.87 5 14 TE 0.86 1.01 0.88 0.91 0.83 0.79 0.86 0.90 3 12 4 1.45 1.34 1.20 1.33 9 1.06 0.97 1.18 1.07 10 1.36 1.08 0.95 1.13 19 1.12 1.07 1.06 1.08 3 5 0.80 0.91 0.86 0.86 6 0.98 0.94 0.93 0.95 3 0.96 1.06 1.04 1.02 5 1.00 1.00 0.99 1.00 1 6 1.11 1.10 1.08 1.10 1 1.12 1.14 1.10 1.12 2 1.07 1.17 1.06 1.10 6 1.13 1.14 1.09 1.12 2 Interlab CV (%) 24 19 18 20 9 13 17 13 20 12 24 19 11 10 17 12
-10-Table 4. Reproducibility for the determination of individual congeners in cow's milk.
Lab P C D D s 2378 12378 123478 123678 123789 1234678 Octa PCDFs 2378 12378 23478 123478 123678 234678 123789 1234678 1234789 Octa 1 16 17 20 21 24 27 100* 100* 100* 14 24 19 26 100* 69 100* 100* 2 6 2 8 4 8 7 12 8 11 3 4 6 4 100* 2 7 8 3 CV (%) 10 4 6 8 4 3 3 6 11 3 5 6 7 100* 4 27 5 4 24 14 7 12 26 40 88 51 18 12 10 10 6 100* 20 45 66 5 11 5 7 4 5 4 11 19 29 7 10 7 9 100* 14 53 23 6 12 5 7 8 14 10 42 16 12 7 4 6 8 100* 6 5 72
B
Sample
Fig. 1. TE levels (mean n=3) in cow's milk samples as determined by participants.
1 2
-a
H
> 'S "ai1.5-
1.4-1.3
1.2
1.1
1.0
0.9
0.8
0.7
0.6-1
0.5
Sample
A O B a c
i
o
— I 1 1 1 1 1 1 1 — — I 1 1 —l-own 2-own 3-study 4-study 5-study 6-study
Lab-standard
ÜJ n »-( o tfl w o o 3 t) 0) H-to O o H l 0) r t H-o p-' d 0) 3 r t tn Ü3 ri-0) D a a w 2378-TCDD- 12378-PCDD- 123478-HCDD- 123678-HCDD- 123789--HCDD- 1234678-HCDD- Octa-CDD- 2378-TCDF- 12378-PCDF- 23478-PCDF- 123478-HCDF- 123678-HCDF- 234678-HCDF- 123789-HCDF- 1234678-HCDF- 1234789HCDFOctaCDF -o _L_ f o u n d / g i v e n (mean±SD) o co _ L _ o o I I I O O O a> ' ^ 00 I • I I I P ;-^ CO Ö I I I -* ^^ w I > I I I I — » -_ i -_ UI 3 (U \+ CO