Towards a world of
cities in 2050
Background report to the UN-Habitat Global Report
An outlook on
water-related challenges
Towards a world of cities in 2050
An outlook on water-related challenges
Background report to the UN-Habitat Global Report
In collaboration with
ARCADIS Shelter program UNESCO-IHE
This publication can be downloaded from: www.pbl.nl/en.
Parts of this publication may be reproduced, providing the source is stated, in the form: Ligtvoet W. et al. (2014), Towards a world of
cities in 2050 – an outlook on water-related challenges. Background report to the UN-Habitat Global Report, The Hague: PBL Netherlands
Environmental Assessment Agency.
PBL Netherlands Environmental Assessment Agency is the national institute for strategic policy analyses in the fields of the environment, nature and spatial planning. We contribute to improving the quality of political and administrative decision-making, by conducting outlook studies, analyses and evaluations in which an integrated approach is considered paramount. Policy relevance is the prime concern in all our studies. We conduct solicited and unsolicited research that is both independent and always
scientifically sound.
Towards a world of cities in 2050 – an outlook on water-related challenges
Background report to the UN-Habitat Global Report
© PBL Netherlands Environmental Assessment Agency ISBN: 978-94-91506-75-8
PBL publication number: 1325
This study was conducted at the request of UN-Habitat, Nairobi, Kenya.
Authors
Willem Ligtvoet & Henk Hilderink (editors), Arno Bouwman, Peter van Puijenbroek, Paul Lucas, Maria Witmer
Corresponding author
willem.ligtvoet@pbl.nl
Contributions
Joost Knoop, Hans Visser (PBL), Philip Ward, Jeroen Aerts, Ralph Lasage (VU University Amsterdam),
Assela Pathirana, Peter van der Steen (UNESCO IHE), Bert Smolders, Daan Stolker, Floris Zevenbergen (ARCADIS Shelter program)
English-language editing
Serena Lyon, Second Soul
Graphics PBL Beeldredactie Production coordination PBL Publishers Layout Textcetera
Contents
Summary 61 Introduction 12 1.1 Main messages 12
1.2 Context: towards a world of cities 12 1.3 Fourth UN-Habitat report 12
1.4 OECD Environmental Outlook-based approach 13 1.5 Conceptual framework 13
1.6 Water-related policy options 14 1.7 This report 14
2 Baseline Scenario 16 2.1 Main messages 16 2.2 Introduction 16
2.3 Main drivers: demography, urbanisation and economy 16 2.4 Energy, land and climate in relation to water 19
2.5 Water demand and water stress 21 3 Water supply and sanitation 22 3.1 Main messages 22
3.2 Introduction 22
3.3 Modelling water supply and sanitation and associated health impacts 24 3.4 Trends and projection 26
3.5 Impacts on human health 26 3.6 Policy options 26
4 Water quality: nutrients in surface water 30 4.1 Main messages 30
4.2 Introduction 30
4.3 Modelling emissions from urban areas to surface water 31 4.4 Trends and projection 32
4.5 Negative effects of eutrophication on cities and coastal areas 35 4.6 Policy options 37
5 Flood risks 40 5.1 Main messages 40 5.2 Introduction 40 5.3 Modelling flood risks 42 5.4 Trends and projection 44 5.5 Cost of reducing flood risk 49 5.6 Inequality and flood risks 52 5.7 Policy options 53
6 Concluding remarks 60
6.1 Outlook on water-related challenges in cities: main findings 60 6.2 Towards integrated urban development 61
References 64 Appendix 70
Summary
An increasing population and expanding cities are
challenging water management
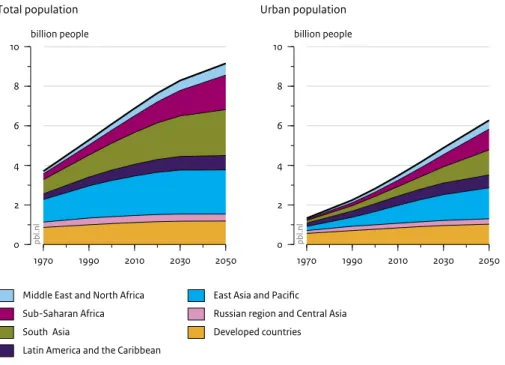
Around 50% of the world’s population currently lives in an urban environment, and this percentage is expected to increase over the coming decades. Under the Baseline Scenario used in this study, major changes in socio-economic and environmental trends are projected. The world’s population is expected to grow by more than 2 billion people, to 9.2 billion by 2050. Most of this growth will take place in developing countries and, more specifically, in the urban areas there. By 2050, around 70% of the world’s population is expected to live in an urban environment (Figure 1).
As a result, demand for water, food and energy will increase and is expected to put pressure on the environment. Climate change, with higher average temperatures and changing precipitation patterns, combined with increasing competition for available water resources, may result in substantial increases in the number of people living under severe water stress. Without major policy changes, substantial improvements in water management and techniques as well as ‘smart’ spatial development, this trend is likely to affect quality of life; for example, through increasing impacts on human health.
Access to clean drinking water and protection against flooding is fundamental to human well-being. The water management that is needed to meet those needs poses a
major and growing challenge – especially in the fast growing cities in developing countries.
Access to water is expected to improve; sanitation
to lag behind. The cost-benefit ratio of investments
in water supply and sanitation will be positive, with
respect to human health
In the coming years, substantial progress may be expected in the access to safe drinking water and improved sanitation. As a result of income increases (which make a higher standard of living more affordable) and increasing urbanisation (which enables more cost-efficient higher coverage rates), the Millennium Development Goals that target water supply have already been attained, globally, and further progress is projected. With respect to access to sanitation, however, current developments show that many countries still lag behind, particularly in sub-Saharan Africa, although here future progress also is projected.
Despite this progress, policy challenges remain. First of all, the Millennium Development Goals only focus on
halving the number of people without access to improved sanitation. Secondly, the MDGs also only aim to achieve
improved drinking water services, which even then would still be far from those ensuring a decent standard of living (i.e. in the form of household connections). Thirdly, achieving coverage still does not necessarily mean that connections are safe. For example, increasing water stress may affect water quality, causing negative health impacts.
UN-Habitat will publish their fourth global report on water and sanitation in cities. At their request, PBL Netherlands Environmental Assessment Agency has conducted a study on future trends and challenges as input for this global report. Topics addressed are water supply and sanitation, nutrient emissions and water quality, and flood risks.
Figure 1 1970 1990 2010 2030 2050 0 2 4 6 8 10 billion people Source: UN DESA (2009; 2010) pb l.n l
Middle East and North Africa Sub-Saharan Africa South Asia
Latin America and the Caribbean
Total population 1970 1990 2010 2030 2050 0 2 4 6 8 10 billion people pb l.n l Urban population
East Asia and Pacific Russian region and Central Asia Developed countries
Population and urbanisation under the Baseline Scenario
Baseline Scenario for population and urbanisation up to 2050, used in this study for exploring future trends and challenges with respect to water and sanitation in cities.
Figure 2
Developed countries Latin America and the Caribbean
East Asia and Pacific Russian region and Central Asia Middle East and North Africa South Asia Sub-Saharan Africa
0 100 200 300 400
million people Source: Hilderink et al. (2008)
pbl.nl
1990 2010 2030 2050
Urban population without improved sanitation
Figure 3 1970 1990 2010 2030 2050 0 1 2 3 4 5
million tonnes N/year
Source: OECD (2012)
pb
l.n
l
East Asia and Pacific South Asia Sub-Saharan Africa Developed countries Nitrogen emissions 1970 1990 2010 2030 2050 0 200 400 600 800
thousand tonnes P/year
pb
l.n
l
Phosphorus emissions
Household nutrient emissions to surface water
Latin America and the Caribbean Middle East and North Africa Russian region and Central Asia
Trends in household nitrogen and phosphorus emissions to surface water
Investments in water supply and sanitation are projected to have a positive cost-benefit ratio, in terms of health impacts and their valuation. Aiming for universal coverage by 2050, an annual 70,000 deaths could be avoided in sub-Saharan Africa alone.
Without action, nutrient emissions will increase.
Improved sanitation requires improved
waste-water treatment.
A century ago, the dominant pathway for nutrients was their reuse in agriculture; today, the dominant pathway is for them to end up in surface water. Continued investments in waste-water treatment in developed countries are expected to stabilise and restore surface water quality. The quality of surface water in other countries, however, is expected to deteriorate between 2010 and 2050. Under the Baseline Scenario, nutrient emissions in Asia and Africa are projected to double or triple over next 40 years (Figure 3). This will lead to increased eutrophication and biodiversity loss, as well as an increased threat to drinking water, fishery, aquaculture and tourism ecosystem services.
Higher sanitation coverage rates could have a direct positive effect on human health, but may also have adverse effects on the environment if these improved sanitation connections are not combined with
waste-water treatment. Population growth combined with higher income levels will further increase nutrient emissions from cities. This poses an increased risk to the quality of drinking water and food production in and around cities.
It is increasingly recognised that the urban water system is best designed, planned and managed in an integrated manner. Waste-water treatment should be part of a larger system, aimed at delivering services to urban dwellers without compromising on sustainability. Options for reducing emission levels and achieving a more sustainable city include better sewage and waste-water treatment systems and the reuse of nutrients in agriculture.
There are many examples of successful large-scale developments in sanitation, sewage and waste-water treatment systems in cities. New technologies and incentives for local reuse of nutrients from sewage sludge may favour comparatively low-cost decentralised options when costs for large-scale systems are too high. For local communities in rural areas, on-site sanitation and better management of faecal sludge may be interesting options. In transboundary catchment areas, agreements between countries are necessary to improve water quality and
prevent excessive pollution of coastal waters, resulting in large-scale fish kills and algae blooms.
By 2050, 15% of the global population will live in
flood-prone areas. Integrating flood risk strategies
in urban development may strongly reduce the loss
of lives as well as economic losses
Over the past 30 years (1980–2010), on average, close to 90 million people were affected by flood disasters, and each year around 5,000 people were killed. Average annual global losses due to floods over this period amounted to almost USD 20 billion. Floods make up
over 40% of all weather-related disasters, affect the most people and are the second-largest natural cause of economic loss. No climate change signal has been detected in flood disasters in the historical trend up to 2010. Population growth and economic development were the dominant drivers of increases in the numbers of people affected and economic losses due to coastal and river floods.
Leaving aside the effects of climate change, the number of people living in flood-prone areas is estimated to be 1.3 billion by 2050, or 15% of the global population. This is Figure 4 2010 2050 0 20 40 60 80 million people pb l.n l World 2010 2050 0 2 4 6 8 million people pb l.n l Developed countries 2010 2050 0 1 2 3 4 million people pb l.n l 2010 2050 0 5 10 15 20 25 million people pb l.n l South Asia Annual exposed population to floods
2010 2050 0 5 10 15 20 25 million people pb l.n l
East Asia and Pacific
2010 2050 0 1 2 3 4 5 million people pb l.n l 2010 2050 0 2 4 6 8 million people pb l.n l Sub-Saharan Africa 2010 2050 0.0 0.3 0.6 0.9 1.2 1.5 million people pb l.n l Protection standard 1:10 Rural Urban Protection standard 1:100 Rural Urban Protection standard 1:1000 Urban
Russian region and Central Asia Middle East and North Africa Latin America and the Caribbean
Source: PBL
Comparison of urban and rural populations’ annual exposure to floods, in 2010 and in 2050 applying different protection standards. Note the difference between the y-axis scales
an increase of 0.3 billion compared with the present situation. As urban areas expand, hundreds of trillions of dollars in infrastructure, industrial and office buildings and homes will be increasingly at risk from river and coastal flooding – particularly in Asia. Under the Baseline Scenario, by 2050, there could be 670 cities of 500,000 inhabitants or more, and 88 of which will have more than 5 million inhabitants. Of these 88 cities, 50% will rank highest with respect to vulnerability to flooding, based on the size of the population exposed and GDP per capita. The most vulnerable megacities could be Dhaka, Kolkata, Shanghai, Mumbai, Jakarta, Bangkok and Hoh Chi Minh City.
There is a wide range of measures available to reduce flood risk. Figure 4 shows both the strong increases in annual exposed population by 2050 – especially in the urban areas – and the potentially large effects of improving flood protection. Given the potentially large effect of these measures, it is important for cities and countries to pay serious attention to the development of adequate flood risk strategies. The costs of adequate flood protection measures may not necessarily be high, and high concentrations of assets and people in cities may provide an opportunity for highly cost-effective flood protection strategies, strongly reducing both loss of lives and economic losses
Flood vulnerability is unevenly distributed within cities and, often, the poorest suffer disproportionally. Within the context of environmental justice, public authorities face the challenge of improving the level of protection against flooding without increasing the inequality with respect to flood risk.
Towards integration of water-related challenges in
urban development
The findings of this report show that, in the coming decades, major changes and challenges lie ahead. Despite positive developments policy challenges remain; for example, regarding the health impacts of improved water supply and sanitation. Each chapter in this report identifies potentially successful policy options that would result in an improvement regarding the issues at hand. However, there are also important interconnections between the various water issues. For example, investing in sanitation without adequate investment in waste-water treatment would, in fact, deteriorate the water quality in rivers, lakes and coastal waters. In turn, poorer water quality could impact human health. Also, despite sufficient investment in water supply, sanitation and waste-water treatment infrastructure, urban expansion – which will take place particularly in developing countries – could still be at risk if flooding is not taken into account. This calls for a more integrated
approach in urban development, in which these aspects are considered in combination. A promising concept that allows for such an integrated approach is that of ‘smart cities’. Applying such a concept to the water challenges of the future (‘smart water’) may help create cities that use water and energy more efficiently, reuse water and waste-water treatment products (such as nutrients), and achieve the smart and climate-proof design of sewage and waste-water treatment systems, urban development plans and green and blue infrastructure, preventing urban flooding and reducing flood risks.
Existing and newly developed city networks are
important platforms to exchange knowledge, understand the common challenges and share best practices and innovations that can support cities in their economic, spatial and social development strategies.
ONE
Introduction
ONE
1.1 Main messages
– UN-Habitat will publish a report entitled ‘Global report on water and sanitation in cities of the future’ (working title). PBL Netherlands Environmental Assessment Agency (PBL) has been commissioned by UN-Habitat to produce an input report for this global report.
– This input report provides future projections of relevant issues relating to water and sanitation, making use of PBL’s global modelling suite. PBL has a proven track record in producing integrated assessments with a strong modelling component. Given the limited resources available, the projections have been based on available scenario studies, such as the OECD Environmental Outlook, Roads from Rio, and studies commissioned by the Dutch Ministry of Foreign Affairs.
– Based on an inventory of PBL studies, the following topics were included: 1) water supply and sanitation, 2) nutrients in surface water and wastewater treatment, and 3) flood risks.
1.2 Context: towards a world of cities
Around 50% of the world’s population currently lives in an urban environment, and this percentage is expected to increase in the coming decades. A growing urban population provides both opportunities and challenges. Opportunities, because a high concentration of people makes it easier to supply a larger part of the population with adequate health and water services, as well as improve the efficiency of energy, water and land use. Growing cities will also provide opportunities for implementing and disseminating new knowledge and technologies relating to urban planning and building design, as well as the development of traffic, energy and water service systems (Glaeser, 2011).
At the same time challenges arise about how to protect the environmental quality in and around these fast-growing cities. To connect more people to a sewerage system is one important step, but without proper wastewater treatment the receiving rivers and coastal zones will become polluted with excess nutrients, heavy metals and other health-threatening substances. History shows that failure to acknowledge this results in a decline in environmental quality. Consequently, poor air quality, water quality and spatial quality will strongly reduce the quality of the living environment and health of the city population. Very often, the effects of environmental pollution, poor water availability and poor health services, and the resulting losses in health and quality of living are unequally distributed among the urban population, with the poor often suffering the most (MEA, 2005). Segregation and inequality in cities is of all times and all regions (Nightingale, 2012), but in many cities – especially in developing countries – slum dwellers number more than 50% of the population and have little or no access to shelter, water and sanitation (UN-Habitat, 2005). Reducing inequality and poverty in cities on the path towards 2050 may well be one of the major challenges of the future.
Climate change forms an additional challenge for these urban areas (IPCC, 2013). Temperature rises, the increa-sing frequency and intensity of rainfall or drought, riincrea-sing sea levels and changing river discharges need to be addressed while developing new urban areas and restructuring the old.
1.3 Fourth UN-Habitat report
UN-Habitat will publish a report entitled ‘Global report on water and sanitation in cities of the future’ (working title). This report will be the fourth report on this topic. Following the mandate of the 19th Governing Council, resolution 19/6, UN-Habitat has made ‘Water and sanitation in the world’s cities’ a recurrent publication,
ONE ONE
published every three years. In 2003, UN-Habitat published the first edition entitled ‘Water and sanitation in the world’s cities: local action for global goals’. The second report, ‘Water and sanitation in the world’s cities: meeting development goals in small urban centres’ was published in 2006, and the third report, ‘Water and sanitation in the world’s cities: solid waste management in the world’s cities’ was published in 2010. This report focused on the management of solid waste and bio-solids in urban centres. A forward-looking perspective will be taken in the fourth report in 2014. It is with regards to such a forward-looking perspective that PBL can make a particularly useful contribution, based on recent PBL scenario studies that include the OECD Environmental Outlook, Roads from Rio, and other projects for the Dutch Ministry of Foreign Affairs. It is for this reason that UN-Habitat has asked PBL to write a background report to be used an input for the upcoming UN-Habitat report.
1.4 OECD Environmental
Outlook-based approach
Based on an inventory of PBL studies, the following topics were identified as being of interest: 1) water supply and sanitation, 2) nutrients in surface water and wastewater treatment, and 3) flooding risks. The approach taken in this report is based on recent PBL scenario studies. One of the most relevant studies used is the OECD Environmental Outlook, which includes a thematic water
chapter (OECD, 2012). The OECD Environmental Outlook covers all three topics at the global level, while also allowing differentiation by urban and rural populations or certain regions. Another relevant study is the Roads from Rio report (PBL, 2012), which focused on potential policy pathways for achieving globally agreed policy targets. Choosing an existing scenario study has the advantage that some parts of the work – including the capacity-intensive ones – have already been done. It obviously also has its disadvantages, as the selection of issues cannot be altered, the time horizon and units of analysis (i.e. regional breakdown) are already fixed, and the scenario logics, for example a baseline approach with a single incarnation of the future, are determined without having this particular application in mind. However, given the topics covered in the OECD Environmental Outlook, the relatively detailed unit of analysis of the simulation models used and the time horizon of 2050, it was considered to provide a sound basis for this study.
1.5 Conceptual framework
The following conceptual framework was used to position and analyse the water-related issues in cities. This framework (see Figure 1.1) shows the most relevant contextual socio-economic and environmental factors related to various aspects of water addressed in this report. These are demand, availability, use and impacts. The different policies that may influence these water aspects are also shown. These policies are water resource Figure 1.1
Conceptual framework of water-related issues
pbl.nl
Socio-economic factors Environmental factors Climate change, agricultural productivity, land use and land cover Population, economic growth,
urbanisation Water demand • Agriculture • Industry • Domestic Water availability • Ground water • Surface water • Precipitation • Variability Water use
• Coverage of water supply and sanitation • Waste-water treatment Impacts • Health impacts • Water stress • Water quality • Flood risks Policies: Water resource management Access to water sanitation and hygiene Waste-water management and water quality Flood risk management
ONE
management, access to water supply and sanitation, wastewater management and flood risk management.
1.6 Water-related policy options
There are many ways to position water-related policies in the urban environment, at various scales, and with many actors involved in the planning and implementation. This requires close cooperation between the various social actors and a clear division of responsibilities between government, public parties, private companies and the general public. Figure 1.2 provides an overview of the relationships between the various scales and associated policy options and actors, using adaptation measures as an example. In this report, we focus on policy interventions that aim to improve water supply and sanitation and water quality, and that anticipate and lower flood-related risks.
1.7 This report
The outline of this report is as follows. The Baseline Scenario is described in Chapter 2. This includes the most important socio-economic and environmental drivers (such as population, urbanisation and climate change). Other aspects of water that are not specifically covered by other chapters, such as water demand and water stress, are also presented in Chapter 2. Drinking water and sanitation are discussed in Chapter 3, and water quality in Chapter 4. In Chapter 5, the possible impact of flooding in terms of people and assets at risk is calculated. In the final chapter, Chapter 6, the overall findings and conclusions are presented and discussed within the broader context of the concept of smart cities. The analyses in this report are mostly conducted at a grid level of 0.5 by 0.5 degrees for environmental aspects such as land use and climate change, and 30 by 30 seconds for flood risks. For socio-economic aspects such as economic growth, population and health the analyses are carried out for the 27 world regions and countries in the IMAGE modelling suite (Bouwman et al., 2006). The final results are presented at the aggregated level of the seven World Bank regions (see Figure 1.3).
Figure 1.2
Adaptation measures at various scales within the urban environment
Source: PBL Buildings Flexibility pbl.nl High Low Districts City Infrastructure Surrounding areas
ONE ONE
Figure 1.3
World Bank Regions
pbl.nl
World Bank region Developed countries East Asia and Pacific Russian region and Central Asia Latin America and the Caribbean
Middle East and North Africa South Asia
Sub-Saharan Africa Source: World Bank
Regional presentation used in this report (World Bank, 2014)
Text box 1.1 Water and the Sustainable Development Goals
The definition, design and implementation of long-term sustainability goals has taken centre stage in the United Nations with the discussion on the post-2015 development agenda, as a follow-up to the Millennium Development Goals (MDGs), and the Sustainable Development Goals (SDGs) that emerged from the 2012 UN Conference on Sustainable Development (Rio+20). It was recognised at Rio+20 that ‘water is at the core of sustainable development’, and Member States reconfirmed previous commitments made in the Johannesburg Plan of Implementation and the Millennium Declaration, also regarding the right to safe drinking water and sanitation. Furthermore, the pervasive links between water and other priority areas were reflected in the Rio+20 outcome document.
The open consultation on water concluded that Water, Sanitation and Hygiene (WASH), Water Resources Management and Wastewater Management and Water Quality are all indispensable elements for building a water-secure world (UN-Water, 2013). This is also recognised in the many proposals for a post-2015 development agenda, many of which integrate the social, economic and environmental dimensions of the water challenge in one single goal (Griggs et al., 2013; HLP, 2013; UNGC, 2013; UNSGAB, 2013). UN-Water (2014) builds on all these reports and proposes a goal to ‘secure sustainable water for all’, with five underlying targets that address: – drinking water, sanitation and hygiene;
– water resources; – water governance; – water-related disasters;
– wastewater pollution and water quality.
It should be noted that the very local nature of water poses challenges regarding the reconciliation of a universal agenda with the variety of national, local or basin-specific realities. This report provides insights into the magnitude of these future challenges and possible policy interventions for achieving these five targets.
TWO
Baseline Scenario
TWO
2.1 Main messages
– Under the Baseline Scenario, the world population is projected to grow by 2.2 billion between 2010 and 2050, reaching almost 9.2 billion by 2050. In the 49 least developed countries, the population is projected to double in size.
– In 2050, nearly 70% of the world’s population will live in cities, which implies an urban population increase of 2.8 billion compared with today. This will have positive economic consequences, but may also lead to higher environmental pressures.
– World GDP is projected to quadruple between 2010 and 2050. Between 2010 and 2030, GDP growth will be largely driven by the increased use of physical capital.
– The world energy demand by 2050 is projected to be about 80% higher than today; the area of agricultural land is projected to peak before 2030 and decline thereafter; the area of irrigated land is assumed to remain constant up to 2050. This latter assumption may result in an underestimation of future water stress in some regions.
– By the end of the 21st century, the global average temperature is likely to be 3 °C to 6 °C higher than pre-industrial levels. Temperature rises and precipitation changes will be unequally geographically distributed.
– Global water demand is projected to increase by 55% between 2000 and 2050, with sharp rises expected in the emerging economies. Competition for water between urban claims and water for irrigation will intensify. By 2050, 3.9 billion people – over 40% of the world’s population – are projected to live in river basins under severe water stress.
2.2 Introduction
This chapter describes the Baseline Scenario used for the analysis in the following chapters. The scenario stems from the third OECD Environmental Outlook (OECD, 2012). It assumes that no new policies are introduced and provides a benchmark against which the different policy variants are assessed.
2.3 Main drivers: demography,
urbanisation and economy
Demographic developments
Future population growth is based on the medium projection of the UN World Population Prospects (UN DESA, 2009). According to this projection, the world population will grow by 2.2 billion between 2010 and 2050, reaching almost 9.2 billion people. Most population growth will take place in developing countries, and in the 49 least developed countries in particular, where the population will double in size (Figure 2.1).
Between 2010 and 2050, nine countries are expected to account for half of the world’s projected population increase. These are India, Pakistan, Nigeria, Ethiopia, the United States of America, the Democratic Republic of Congo, the United Republic of Tanzania, China and Bangladesh (listed according to the size of their contri-bution to global population growth). The population of Africa could double by the middle of the century, from around one billion in 2010 to two billion by 2050. According to the 2012 UN World Population Prospects (UN DESA, 2013), the global population may increase up to 9.6 billion by 2050, with a margin of plus or minus 1.3 billion in the high and low variants, meaning that the projections used in the Baseline Scenario are within the lower margin of uncertainty of this newer projection. The 2012 revision projections are particularly higher for Africa, with the medium variant projecting a population of 2.4 billion by 2050.
TWO TWO
Urbanisation
Future urbanisation is based on the UN World Urbaniza-tion Prospects (UN DESA 2010). By 2050, 2.8 billion more people than today are projected to be living in urban areas, which is more than the total population growth. In 2050, nearly 70% of the world’s population will live in cities (Figures 2.1 and 2.2). The urban population is projected to be unevenly distributed around the world. In OECD countries, it is projected to be 86% of the total population by 2050, and in sub-Saharan Africa it is projected to increase from 37% in 2010 to 60% by 2050, implying high growth rates. Growth rates are also high in urban agglomerations in Southeast Asia. Small urban centres of less than 0.5 million inhabitants are projected to grow more rapidly than other urban areas.
A positive consequence of urbanisation may be higher economic growth because of the higher concentration of activities leading to economies of scale. The provision of infrastructure for the delivery of energy, water and sanitation may also be easier with higher concentrations of people. On the other hand, concentrated economic activities and traffic can lead to environmental problems caused by air and water pollution (OECD, 2012). High growth rates also put pressure on the ability to keep pace with the required provision of water and sanitation facilities. Furthermore, one in every three city dwellers worldwide – about one billion people – currently lives in a slum (UN-Habitat, 2003; 2006). The total number of
slum dwellers is expected to grow, especially in rapidly growing cities in developing countries. Problems with substandard housing and inadequate water, sanitation and waste management services could therefore become magnified (OECD, 2012).
Economic developments
GDP growth under the Baseline Scenario is driven by: i) increasing the value added of production through the increased use of capital, labour and natural resources (including land), ii) increasing the productivity of these primary production factors, and iii) reallocating produc-tion factors to those activities that yield the highest value added. Between 2010 and 2030, GDP growth will be largely driven by the increased use of physical capital (such as buildings, machines and infrastructure). In the longer term, GDP growth will partially converge across economies and physical capital accumulation and human capital will contribute more equally to GDP growth. As a result, global GDP will nearly quadruple between 2010 and 2050. The share of the developing countries Brazil, Russia, Indonesia, China and South Africa is projected to grow to more than 40%, while the share of developed countries is projected to decline from 54% in 2010 to around 30% by 2050. Africa is projected to experience high economic growth between 2030 and 2050, but will remain the poorest continent (Figure 2.3). Figure 2.1 1970 1990 2010 2030 2050 0 2 4 6 8 10 billion people Source: UN DESA (2009; 2010) pb l.n l
Middle East and North Africa Sub-Saharan Africa South Asia
Latin America and the Caribbean
Total population 1970 1990 2010 2030 2050 0 2 4 6 8 10 billion people pb l.n l Urban population
East Asia and Pacific Russian region and Central Asia Developed countries
Population and urbanisation under the Baseline Scenario
TWO
Figure 2.2 1970 1980 1990 2000 2010 2020 2030 0 1000 2000 3000 4000 5000 million people Source: UN DESA (2010) pb l.n l City size 10 million or more 5 to 10 million 1 to 5 million 500,000 to 1 million Fewer than 500,000Global urban population, according to city size, under the Baseline Scenario
World urban population by city size, 1970–2025
Figure 2.3
Developing countries Central and South America Middle East and North Africa Sub-Saharan Africa South Asia China region Southeast Asia Industrialised countries North America West and Central Europe
Russian region and Central Asia Japan, Korea and Oceania
GDP per region
Global GDP growth under the Baseline Scenario
1970 1990 2010 2030 2050 0 100 200 300 400 trillion USD2005 pb l.n l History Baseline Scenario Range from literature
10% – 90% 25% – 75%
Range from literature
1970 1990 2010 2030 2050 0 100 200 300 400 trillion USD2005 pb l.n l
Source: World Bank (2009), OECD (2012) and literature range from Van Vuuren et al. (2012)
TWO TWO
2.4 Energy, land and climate in
relation to water
The trends sketched above will make demands on the Earth’s natural resources. In this section, the impacts on energy use, land and climate are outlined.
Energy production
Energy use is essentially driven by economic activity and technological developments. Assuming no change in current policies, the world energy demand by 2050 is projected to be about 80% higher than it is today, with fossil fuels retaining a large market share of 85% (OECD, 2012). This growing need for energy will lead to a growing water demand for cooling in power stations (see Section 2.5). Other energy-use related impacts on the water system are higher flood peaks and lower basic Figure 2.4
Regional climate change, temperature and precipitation, in 2050, under the Baseline Scenario
Change in annual temperature
Change in annual precipitation
Temperature change (°C) < 0.5 0.5 - 1.0 1.0 - 1.5 1.5 - 2.0 2.0 - 2.5 2.5 - 3.0 3.0 - 3.5 3.5 - 4.0 > 4.0 pbl.nl
Precipitation change (mm/day) < -0.6 -0.6 - -0.4 -0.4 - -0.2 -0.2 - 0.0 0.0 - 0.2 0.2 - 0.4 0.4 - 0.6 0.6 - 0.8 0.8 - 1.0 > 1.0 Source: OECD (2012) pbl.nl
TWO
river flows due to deforestation caused by the use of traditional bio-energy, water withdrawal and pollution related to the growing of irrigated bio-energy crops and the building of dams for hydropower generation. Overall land-use change and irrigation are included in the Baseline Scenario; the effects of river dams on water availability and quality are not.
Land use
The area of agricultural land is projected to expand in the next decade to match the increase in food demand from a growing population. Agricultural land is projected to peak before 2030 and decline thereafter as population growth slows and yield improvements continue. Agricultural land area will increase most in the less developed countries, especially sub-Saharan Africa, where population and economic growth are projected to be the largest. There is significant uncertainty about the current extent of and future increase in irrigated land and irrigation water use. Under the Baseline Scenario, the area of irrigated agricultural land is assumed to stay constant up to 2050 for several reasons. For example, available land for irrigation is scarce and where it is available it is unlikely to be irrigated soon because of lack of
infrastructure and limited public funds. Furthermore, there will be increasing competition with other water demands, and water resources in highly irrigated areas are declining. The assumption that the area of irrigated agricultural land will remain constant means that the Baseline Scenario may underestimate future water stress in some regions.
Climate change
As a result of increasing energy production based on fossil fuels and increasing agricultural area expansion, the atmospheric concentrations of greenhouse gases are projected to increase to almost 685 ppm CO2 equivalents by 2050. By the end of the 21st century, the global average temperature is likely to be 3 °C to 6 °C higher than pre-industrial levels. This will continue to alter precipitation patterns, melt glaciers and ice caps, cause sea-level rise and intensify extreme weather events (OECD, 2012). Temperature rises and changes in annual precipitation are geographically unequally distributed, thereby also differently affecting local agriculture and water systems (Figure 2.4).
Figure 2.5
Developed countries
2000 2050
Latin America and the Caribbean
2000 2050
East Asia and Pacific
2000 2050
Russian region and Central Asia
2000 2050
Middle East and North Africa
2000 2050 South Asia 2000 2050 Sub-Saharan Africa 2000 2050 0 500 1000 1500 2000 km3 Source: OECD (2012) pbl.nl Irrigation Households Livestock Manufacturing Electricity
Blue-water demand under the Baseline Scenario
Blue water demand: 2000 and 2050 under the Baseline Scenario
Please note: Blue water here describes fresh water in aquifers, rivers and lakes, suitable for human use; for example, for irrigation, human consumption and livestock, and in manufacturing and power generation.
TWO TWO
Figure 2.6
Developed countries
2000 2050
Latin America and the Caribbean
2000 2050
East Asia and Pacific
2000 2050
Russian region and Central Asia
2000 2050
Middle East and North Africa
2000 2050 South Asia 2000 2050 Sub-Saharan Africa 2000 2050 0 1000 2000 3000 million people Source: OECD (2012) pbl.nl No water stress Low water stress Medium water stress Severe water stress
Number of people living under water stress under the Baseline Scenario
People experiencing water stress, under the Baseline Scenario
2.5 Water demand and water stress
This section discusses water demand and water stress under the Baseline Scenario. The Baseline Scenario’s results for water supply and sanitation, water quality and flooding risks are described in Chapters 3, 4 and 5, respectively.
Water demand
Over the last century, water demand has risen twice as fast as population growth. In 2000, agriculture – primarily for irrigation – accounted for about 70% of the total global freshwater demand. Electricity generation – primarily for cooling thermal (steam cycle-based) power generation – accounted for the second largest share. Under the Baseline Scenario, global water demand is projected to increase by 55% between 2000 and 2050, mainly caused by increased demand from manufacturing (+400%), electricity production (+140%) and domestic use (+130%) (Figure 2.5). Sharp rises in water demand are expected in South Asia and China, as well as in other emerging economies. In the face of these growing demands, competition between urban claims and water for irrigation will intensify.
Water stress
Increasing demand for water will exacerbate water stress (a water exploitation rate of more than 40%) in many river basins, in particular in densely-populated areas in rapidly-developing economies. More river basins are projected to come under severe water stress by 2050 under the Baseline Scenario, mainly as a result of growing water demand. By 2050, 3.9 billion people – over 40% of the world’s population – are projected to live under severe water stress (Figure 2.6). This holds for almost the entire population of South Asia and the Middle East, and large parts of China and North Africa’s population. In many regions of the world, groundwater is being exploited faster than it can be replenished. The rate of groundwater depletion more than doubled between 1960 and 2000, reaching over 280 km3 a year in 2000. The consequences for daily life are uncertain, and depend greatly on the adequacy of water management strategies put in place.
THREE
Water supply and sanitation
THREE
3.1 Main messages
– The number of people with access to a safe water supply is projected to increase, while developments with respect to basic sanitation will lag behind, especially in sub-Saharan Africa.
– Investments in safe water supply and improved sanitation show a positive cost-benefit ratio in terms of costs, health impacts and valuation of the health impacts.
– The Millennium Development Goal relating to an ‘improved source’ should be advanced towards a ‘safe source’.
3.2 Introduction
In 2011, almost 800 million people did not have access to an improved drinking water source, while around 2.5 billion people lacked access to an improved sanitation facility (WHO/UNICEF, 2013). Around 70% of all people without improved sanitation live in Asia, while progress has been slowest over the last decade in sub-Saharan Africa. Although almost 1.9 billion people have gained access to an improved sanitation facility since 1990, in relative terms the situation has worsened in South Asia and sub-Saharan Africa (Figure 3.1). Of these 1.9 billion people, 1.1 billion people gained access in urban areas, while the total urban population grew during the same period by 1.3 billion. An important question therefore is whether future increases in connection rates will be able to keep up with further rising urbanisation rates.
Safe drinking water and basic sanitation are important to human health. Furthermore, improvements in safe drinking water and basic sanitation can have significant economic benefits. These benefits relate to an improved health status (in relation to morbidity and mortality), time saved in water collection and increased potential for small enterprises.
In 2004, unsafe water supply and sanitation (WSS) and the associated exposure to pathogenic micro-organisms were responsible for around 1.8 million deaths and 6.3% of worldwide disability-adjusted life years (DALYs) (WHO, 2013). The DALY is a measure of disease burden that, as well as mortality, also accounts for morbidity and disability. The vast majority (around 80%) of these deaths were observed in Africa and Southeast Asia. More than 80% of all water-supply and sanitation-related deaths were in children under 5 years of age. Children have an even larger share (85%) of total DALYs related to water supply and sanitation (Prüss-Üstün et al., 2008). Unsafe water supply and sanitation is an important determinant of diarrhoeal diseases. Approximately 88% of diarrhoeal deaths globally are caused by unsafe water, poor sanitation or poor hygiene, and 99% of these are in developing countries (WHO, 2009a). Unsafe water supply and sanitation is therefore the fourth largest cause of disease burden in low-income countries, after child underweight, high blood pressure and unsafe sex. It is important to note that the risk factors cannot be considered independently, as the effects of unsafe drinking water and sanitation can be aggravated by child underweight. In addition, climate change, through temperature increases that affect water quality, also has a negative effect on diarrhoeal diseases. It is not only in health terms that the significance of water supply and sanitation is high, but it also has a substantial impact in financial terms. In Africa alone, economic losses due to a lack of access to safe drinking water for human con-sumption and sanitation is estimated to total about 5% of GDP per year (UN-WWAP, 2009).
Access to clean drinking water and sanitation has economic, environmental and social benefits. Benefit-to-cost ratios have been reported to be as high as 7 to 1 in developing countries (OECD, 2011). Three quarters of these benefits stem from time gains, due to less time being spent having to walk long distances to collect water or to queue at the water source. The other benefits are largely linked to a reduction in diarrhoea.
THREE THREE
Other non-health benefits must therefore be taken into consideration when adding up the full benefits of improved access to water and sanitation. These benefits mean that there is more time available for education, and a more productive labour force.
Health experts have debated whether water quantity or water quality matters most in terms of driving health benefits. Cairncross and Valdmanis (2006) estimate that most of the benefits from a water supply are attributable to improved convenience of access to water in terms of quantity. Other experts argue that water quality is a critical determinant driving health benefits. Waddington (2009) points out that while water supply interventions appear ineffective – with a negligible or insignificant impact on diarrhoea morbidity on average – water quality interventions can reduce the incidence of diarrhoea in children by about 40%. Prüss et al. (2002) state that point
of use treatment solutions (such as boiling) can significantly improve the impact of water supply interventions, with an estimated 45% reduction in diarrhoea rates. Such analysts argue that treatment at the point of use is more effective than treatment at the point of source.
Large benefits were reaped in many developed countries in the late 19th and early 20th centuries when basic water and sanitation infrastructure was extended to much larger parts of the population. For instance, the introduction of water chlorination and filtration in 13 major US cities during the early 20th century led to significant reductions in mortality, with a calculated benefit to cost ratio to society of 23 to 1 and a saving of about USD 500 per person in 2003 (OECD, 2011). The benefits of wastewater treatment are not obvious to the public and are more difficult to assess in monetary terms. Figure 3.1
I II III I II III I II III I II III I II III I II III I II III
1 2 3 4 5 6 7 0 500 1000 1500 2000 2500 million people Source: WHO/UNICEF (2013) pb l.n l Type of sanitation: Improved Unimproved
Population grouped by type of sanitation
1 Developed countries
2 Latin America and the Caribbean 3 East Asia and Pacific
4 Russian region and Central Asia 5 Middle East and North Africa 6 South Asia
7 Sub-Saharan Africa I: 1990 II: 2000 III: 2010
Population grouped per type of sanitation, 1990, 2000 and 2010
Table 3.1
Deaths and burden of disease attributable to water, sanitation and hygiene in 2004 (WHO, 2013)
Region Attributable deaths (thousands) Attributable DALYs (thousands)
Total Children Total Children
Africa 895 677 28,685 23,703 Americas 59 44 2,211 1,657 Southeast Asia 599 528 20,176 18,580 Europe 31 28 1,125 998 Eastern Mediterranean 217 179 6,993 6,281 Western Pacific 95 79 4,538 2,904 Total 1,896 1,535 63,727 54,123
THREE
However, anecdotal evidence can be derived from case studies. For instance, the health benefits of quality improvements in recreational waters in south-west Scotland have been calculated at GBP 1.3 million per year (Hanley et al., 2003).
3.3 Modelling water supply and
sanitation and associated health
impacts
Water supply and sanitation can be categorised according to three levels of service: no coverage, improved services (such as public standpipes or boreholes) and household connections. Each of these levels has a particular risk potential for incidence of diarrhoea (Cairncross and Valdmanis, 2006). The proportion of the population that lacks access to safe drinking water and basic sanitation was modelled for these different service levels (note: the third service level was only modelled for drinking water). The service levels were modelled by applying linear regressions with GDP per capita, urbanisation rate and population density. Service level data were taken from the Joint Monitoring Programme (JMP) for Water Supply and Sanitation (WHO/UNICEF, 2012). Developments in water supply were assumed to be implemented ahead of sanitation and were modelled separately for urban and rural populations. It is important to emphasise the safety of the water provided, as household connections may not necessarily provide safer water than improved services. It is also important to note that the JMP measures access
to specific water supply and sanitation technologies, rather than the actual quality of service to which people have access. The projections might therefore overestimate water supply and sanitation coverage rates. The costs of the projected connection rates are based on Hutton and Haller (2004), who estimated the annual cost of various levels of connection. Their annual cost assumptions are based on investment and recurrent costs, using values from the literature. For example, the annual cost of in-house piped water is USD 10 to 15 per person, while other improved water supply connections cost USD 1 to 4 per person. It is important to note that the costs in this simulation are approximate, since the categories and regions do not fully match those applied by Hutton and Haller.
The water-supply- and sanitation-related health impacts were modelled using risk factor-attributable mortality, based on a multi-state approach, distinguishing exposure, disease and death (Cairncross and Valdmanis, 2006; WHO, 2002). Mortality rates due to specific diseases (e.g. diarrhoea) were obtained by multiplying the incidence rate with the case fatality rate. The impacts of water supply and sanitation were only calculated for children under the age of five. Given the different connection levels to water supply and sanitation facilities, relative risks were used to calculate incidence rates. These relative risks were based on the estimates of the ‘realistic scenario’ used in the Disease Control Priorities Project (DCPP; Cairncross and Valdmanis, 2006). The incidence rate was modified by the extent to which a child is underweight (categorised as mild, moderate or severe underweight; see Edejer et al., 2005) and climate change
Text box 3.1 Overcoming health concerns surrounding water reuse and recycling
Reused water (either reclaimed water or grey water, such as domestic wastewater used for laundry, dishwashing or bathing) is increasingly seen as a sustainable source for some water uses, in particular irrigation, groundwater recharge and possibly non-potable domestic uses. It could be an option for addressing the increasing mismatch between rising demand and available water resources in both OECD and developing countries. Reused water can be supplied from either centralised or decentralised distribution systems.
Markets for water reuse are booming. In addition, emerging economies and rural areas are gaining experience with distributed water infrastructure systems for water supply and sanitation services, although this is less the case in urban areas in OECD countries. Australia, Israel, Spain and some states in the United States are pioneer-ing these new technologies, spurred on by serious constraints to water resources. However, health-related issues are a major driver, or constraint, in the development of such systems. First of all, these systems can gen-erate public health risks (such as possible water contamination during domestic use, or the salinisation of irri-gated soils). Secondly, the payback period of the additional investment cost for such systems (due to additional equipment, or in-house dual plumbing, for instance) depends on the standards set by the regulatory agencies (environment and/or health authorities) for reused water. These standards govern what water can be harvested, quality standards for reused water for specific applications, building standards, agricultural standards, and so on. The National Water Quality Management Strategy in Australia, for example, addresses health risks by in-cluding quality guidelines and monitoring for the safe use of recycled water, and includes an easy-to-use Deci-sion Support Tool to help users create a draft management plan for their water recycling scheme.
THREE THREE
Figure 3.2
Developed countries Latin America and the Caribbean East Asia and Pacific Russian region and Central Asia Middle East and North Africa South Asia Sub-Saharan Africa
0 100 200 300 400 500
million people Source: Hilderink et al. (2008)
pbl.nl
1990 2010 2030 2050
Rural population without an improved drinking water supply
Population without improved water supply in rural areas, 1990, 2010, 2030 and 2050
Figure 3.3
Developed countries Latin America and the Caribbean East Asia and Pacific Russian region and Central Asia Middle East and North Africa South Asia Sub-Saharan Africa
0 20 40 60 80
million people Source: Hilderink et al. (2008)
pbl.nl
1990 2010 2030 2050
Urban population without an improved drinking water supply
Population without improved water supply in urban areas, 1990, 2010, 2030 and 2050
(McMichael, 2004). The case fatality rates were modified by underweight levels and the use of oral rehydration therapy (ORT). Underweight levels were derived from average food consumption levels.
The category ‘improved water supply and sanitation’ encompasses a broad range of possible types of
connection, each of which is assumed to lead to the same health risk potential. The analysis considers only two classes of urbanisation – urban and rural. However, this may not reflect all situations within urban areas (which can include slums and more affluent areas). While increasing water and sanitation connections may be easier to achieve in urban areas, it is not always the case
that increased urbanisation leads to more connections. It may instead lead to greater health risks, such as less favourable living conditions. Empirical data on the combination of water supply and sanitation categories are lacking, although the health risks are specifically related to combinations of the two. The assumption was therefore made that there is no dependency between the two, which may affect the estimation of health risks.
THREE
3.4 Trends and projection
The Millennium Development Goals (MDGs) set targets for human development, including a target for water supply and sanitation (UN, 2000). The target is to ‘halve, by 2015, the proportion of people without sustainable access to safe drinking water and basic sanitation’ (Target 7.C). The reference year for this target is 1990. Under the Baseline Scenario, the world as a whole would meet the MDG drinking water target by 2015, although this will mainly be due to the rapid progress made in large emerging economies such as China and India. In East Asia in particular, remarkable progress has been made in water supply coverage rates in recent decades, and with continuing economic growth universal coverage in this region will almost be achieved by 2030 (Figures 3.2 and 3.3). Other regions, such as sub-Saharan Africa, are unlikely to meet the water supply target. The number of city dwellers without access to an improved water source actually increased between 1990 and 2008, as
urbanisation outpaced progress in access. By 2050, socio-economic progress in urban areas is projected in all regions. In rural areas, and especially in sub-Saharan Africa, the number of people lacking an improved water supply will increase up to 2030 and only slightly decrease afterwards. Under the Baseline Scenario, access to an improved water supply is expected to be universal in more developed countries before 2050.
Progress is slower with regard to access to sanitation. Under the Baseline Scenario, the MDG sanitation target will not be met, while by 2030 more than two billion people will still lack basic sanitation facilities (Figures 3.4 and 3.5). This number will only drop in the longer term, to 1.5 billion by 2050. In 2030, the majority of those without improved sanitation will live in developing countries, and this proportion will continue to grow towards 2050. Today, the vast majority of people without access to a water supply and sanitation live in rural areas. However, towards 2050 the number of people in rural areas without access to sanitation will drop significantly and become comparable to numbers in urban areas.
3.5 Impacts on human health
With greater access to an improved water supply and sanitation facilities, the Baseline Scenario projects that the coming decades will see a substantial reduction in child mortality from diarrhoea. At the beginning of this century, almost two million annual deaths, mostly children, could be attributed to a lack of basic water supply and sanitation facilities. Under the Baseline Scenario, this number is projected to be around 1 million by 2030 and about 0.5 million by 2050 (Figure 3.6). As a
result of the coverage rate projections, most of these deaths will occur in sub-Saharan Africa, although the number will also decline steadily in this region. These projections implicitly assume that increasing urbanisation will make it easier and cheaper to connect residents to water supplies and sanitation facilities, that greater economic growth will increase the basic standard of living (including access to medical treatment), and that the number of people most susceptible to unsafe water and sanitation (i.e. children under the age of five) will decrease due to the continuing ageing of the population in most countries, including developing countries. Despite these assumptions, it is important to note that greater urbanisation can in some cases magnify water challenges – such as the management of waste and water in slums (see Chapter 4) – with serious consequences for human health.
3.6 Policy options
To assess the impacts of improved access to safe drinking water and improved sanitation, an Accelerated Access Scenario was constructed. This policy simulation was used to estimate the expected additional annual cost and health benefits of achieving universal access to improved water supply and sanitation by 2050. Compared with the Baseline Scenario, this simulation assumes: i) halving, by 2030, the population without access to an improved water source and basic sanitation compared with the base year 2005, and then ii) moving to universal access by 2050. The results are presented in Table 3.2.
Compared with the Baseline Scenario, almost 100 million additional people will have access to an improved source of water by 2030 under the Accelerated Access Scenario, and around 470 million more will have access to sani-tation facilities. By 2050, universal access will mean that an additional 242 million people will have access to an improved water source, and an additional 1.36 billion people will have access to basic sanitation facilities. In terms of health impacts over the next 40 years, the highest number of avoided deaths under this policy will be in sub-Saharan Africa, where every year around 70,000 deaths related to unsafe drinking water and sanitation will be avoided. It is important to note that while access to improved water sources will increase substantially, there will not be a commensurate reduction in mortality. One reason is that an improved water source still involves relatively high health risks compared with a household connection. Also, a connection does not necessarily ensure access to ‘safe’ water.
The policy simulation indicates that an average of USD 1.9 billion globally would need to be invested each year between 2010 and 2030 to achieve the 2030 target, and USD 7.6 billion would be needed annually between 2031 and 2050 to achieve the 2050 target.
THREE THREE
Figure 3.4
Developed countries Latin America and the Caribbean East Asia and Pacific Russian region and Central Asia Middle East and North Africa South Asia Sub-Saharan Africa
0 200 400 600 800 1000
million people Source: Hilderink et al. (2008)
pbl.nl
1990 2010 2030 2050
Rural population without improved sanitation
Population without improved sanitation in urban areas, 1990, 2010, 2030 and 2050
Figure 3.5
Developed countries Latin America and the Caribbean East Asia and Pacific Russian region and Central Asia Middle East and North Africa South Asia Sub-Saharan Africa
0 100 200 300 400
million people Source: Hilderink et al. (2008)
pbl.nl
1990 2010 2030 2050
Urban population without improved sanitation
THREE
Figure 3.6 2000 2010 2020 2030 2040 2050 0.0 0.4 0.8 1.2 1.6 2.0Child deaths (millions)
Source: Hilderink et al. (2008)
pb
l.n
l
Developed countries
Latin America and the Caribbean East Asia and Pacific
Russian region and Central Asia Middle East and North Africa South Asia
Sub-Saharan Africa
Annual child deaths due to the lack of basic water supply and sanitation
Annual child deaths due to lack of basic water supply and sanitation, 2000–2050
Table 3.2
Impacts of accelerated access to water supply and sanitation, 2030 and 2050, compared with the Baseline Scenario
Additional water Supply
Additional sanitation
Additional cost Avoided deaths Additional value of statistical life
(VSL)
2030 Thousands Thousands Million USD Thousands % of GDP
Developed countries 0 0 0 0 0.00
Latin America & the Caribbean
21 5,786 52 0 0.00
East Asia & Pacific 0 24,173 174 0 0.02
Russian region & Central Asia
0 357 3 0 0.01
Middle East & North Africa 277 8,556 65 0 0.01
South Asia 855 198,889 1,435 7 0.19
Sub-Saharan Africa 93,719 234,201 2,123 68 1.89 2050
Developed countries 0 34 0 0 0.00
Latin America & the Caribbean
976 13,226 126 0 0.00
East Asia & Pacific 1,770 182,453 1,319 3 0.26
Russian region & Central Asia
0 3,044 24 0 0.00
Middle East & North Africa 694 10,883 87 0 0.01
South Asia 8,024 529,032 3,843 8 0.23
FOUR
Water quality: nutrients in
surface water
FOUR4.1 Main messages
– The most important drivers for deteriorating water quality in many developing countries are population growth and urbanisation, and in several countries the construction of sewage systems without wastewater treatment. A century ago, the dominant pathway for nutrients was reuse in agriculture; nowadays the dominant pathway ends in surface water.
– Continued investments in wastewater treatment in developed countries are expected to stabilise and restore surface water quality.
– The quality of surface water in other countries is expected to deteriorate between 2010 and 2050. This will lead to increased eutrophication, biodiversity loss and a higher risk to drinking water, fishery, aquaculture and tourism ecosystem services. – An option for improving wastewater quality is the
expansion of wastewater collection with wastewater treatment to avoid the discharge of untreated wastewater.
– Agreements between countries are necessary to improve water quality in transboundary catchment areas and prevent excessive pollution of coastal waters, resulting in large scale fish kills and algae blooms.
4.2 Introduction
Wastewater from urban areas, along with emissions of organic compounds, pathogens, nutrients, heavy metals and micro-pollutants such as pesticides, medicines and cosmetics, is a major pollutant of surface water. Sewage systems and wastewater treatment plants are built to remove and transport human waste, reduce oxygen demand and remove nutrients from the effluent. Even so, two thirds of the world’s population was not connected to a sewage system in 2010, and wastewater from households with a sewage systems was sometimes discharged without treatment (6% of the total
population) or with some treatment to remove organic compounds or nutrients (28%).
Wastewater treatment plants are built to improve the water quality of surface water. The first treatment plants were constructed to reduce the biological oxygen demand of the effluent, while the next generation also reduced the nutrient load to the surface water. The past 30 years have seen major changes in many countries in emissions of nitrogen and phosphorus from households to surface water. In 1950, most of the cities in developed countries had sewage systems that directly discharged wastewater effluent to surface waters, resulting in a decline in water quality.
Emissions of the nutrients nitrogen and phosphorus cause eutrophication, which is the stimulation of plant or algae production in the water column. One phenomena caused by severe eutrophication is oxygen depletion during the decomposition of this excess plant biomass. Eutrophication is currently the foremost aquatic ecosystem management problem in rivers, lakes and estuaries worldwide. Eutrophication resulting from nutrient loading first became evident in lakes and rivers suffering from an excessive growth of macrophytes and floating algal scum (Butcher, 1947). In its most serious manifestation, the eutrophication of surface waters leads to turbid waters with decreased oxygen concentrations (hypoxia), the production of toxins by algae and bacteria, and fish-kills (Diaz and Rosenberg, 2008). Algal blooms can also have a negative impact on ecosystem services such as tourism and the drinking water supply. Wastewater treatment is necessary to improve water quality and reduce the negative effects of nutrient emissions. For example, in around 1970 the water quality in the Rhine River had decreased to such an extent that fish could no longer survive in the low oxygen levels. Since then, countries in the Rhine catchment area have improved their sewage systems by constructing wastewater treatment plants, and this has led to a substantial improvement in the quality of water in the Rhine. Wastewater treatment systems have improved from primary (mechanical) treatment to secondary