Enhanced policy
scenarios for
major emitting
countries
ANALYSIS OF CURRENT AND PLANNED
CLIMATE POLICIES, AND SELECTED
ENHANCED MITIGATION MEASURES
Policy Study
Enhanced policy scenarios for
major emitting countries
Enhanced policy scenarios for
major emitting countries
Analysis of current and planned
climate policies, and selected
enhanced mitigation measures
This report provides an overview of projected greenhouse gas emissions in 13 major emitting countries/ regions (Australia, Brazil, Canada, China, European Union, India, Indonesia, Japan, Mexico, the Russian Federation, South Korea, Turkey, and the United States) up to 2030, taking into account the emission trajectories based on current and planned policies, and selected enhanced mitigation measures.
Enhanced policy scenarios for major emitting countries. Analysis of current and planned climate policies, and selected enhanced mitigation measures © PBL Netherlands Environmental Assessment Agency The Hague, 2015
ISBN: 978-94-91506-92-5 PBL publication number: 1631 Authors
Michel den Elzen (PBL), Hanna Fekete (NewClimate Institute), Annemiek Admiraal (PBL), Nicklas Forsell (IIASA), Niklas Höhne (NewClimate Institute), Anu Korosuo (IIASA), Mark Roelfsema (PBL), Heleen van Soest (PBL), Karlien Wouters (Ecofys), Thomas Day (NewClimate Institute), Markus Hagemann (NewClimate Institute), Andries Hof (PBL), Aline Mosnier (IIASA)
Contributing authors
Petr Havlik (IIASA), Mykola Gusti (IIASA),
Michael Obersteiner (IIASA) and Lindee Wong (Ecofys)
Corresponding author michel.denelzen@pbl.nl Graphics PBL Beeldredactie English-language editing Annemieke Righart Production coordination PBL Publishers Layout
Textcetera, The Hague
This report has been prepared by PBL/NewClimate Institute/IIASA/Ecofys under contract to DG CLIMA (Service Contract n°071303/2011/662342/SER/CLIMA.A4 – Renewal (Ares (2013)3407741)) renewed in November 2013.
The information and views set out in this study are those of the authors and do not necessarily reflect the official opinion of the Commission. The Commission does not guarantee the accuracy of the data included in this study. Neither the Commission nor any person acting on the Commission’s behalf can be held responsible for the use of any information from this study.
This publication can be downloaded from: www.pbl.nl/en. Parts of this publication may be reproduced, providing the source is stated, in the form: Elzen, M. den et al. (2015), Enhanced policy scenarios for major emitting countries. Analysis of current and planned climate
policies, and selected enhanced mitigation measures, The Hague: PBL Netherlands Environmental Assessment Agency.
PBL Netherlands Environmental Assessment Agency is the national institute for strategic policy analyses in the fields of the environment, nature and spatial planning. We contribute to improving the quality of political and administrative decision-making, by conducting outlook studies, analyses and evaluations in which an integrated approach is considered paramount. Policy relevance is the prime concern in all our studies. We conduct solicited and unsolicited research that is both independent and always scientifi-cally sound.
This project was funded by the European Union.
Contents
Main findings 6 Executive summary 8
1 Introduction 8
2 Results per country 9
3 Results of enhanced policies (top-down scenario) 28
4. The impact of mitigation enhancement measures on
narrowing the emission gap to achieve the 2 °C target by 2030 31 1 Introduction 32 2 Country sections 36 2.1 Australia 37 2.2 Brazil 43 2.3 Canada 51 2.4 China 56 2.5 European Union 64 2.6 India 70 2.7 Indonesia 77 2.8 Japan 84 2.9 Mexico 89
2.10 The Russian Federation 94 2.11 South Korea 100 2.12 Turkey 105 2.13 United States 109 References 116 Appendix A 125 Appendix B 130
Main findings
This report provides an overview of projected
greenhouse gas emissions in 13 major emitting countries/ regions (Australia, Brazil, Canada, China, the European Union, India, Indonesia, Japan, Mexico, the Russian Federation, South Korea, Turkey, and the United States) up to 2030, taking into account the emission trajectories based on current and planned policies and a selection of enhancement measures. In 2010, these countries/regions were responsible for about 65% of global greenhouse gas emissions.
The main findings of this study are:
– The degree to which countries/regions are likely to achieve their 2020 pledges under current policies varies: of those considered in this report, Brazil, China, the EU, India, Japan and the Russian Federation are likely to achieve their pledges through existing policies. Australia, Canada, Indonesia, Mexico, South Korea and the United States require additional measures to achieve their 2020 pledges. The United States and Mexico could achieve their pledges if planned policies are effectively implemented. Turkey has not submitted a mitigation pledge.
– In all the countries/regions considered, significant further reductions are possible through a selection of policy enhancement measures that are in line with national priorities. By replicating ‘best-in-class’ policies or progressing to identified benchmarks, it is possible to significantly enhance current efforts so that all countries/regions considered here would achieve or overachieve their pledges by 2020. The selection of policies and measures is illustrative and not exhaustive.
– Even though current and planned policies are projected to have an effect on emissions, increases would still occur in Australia, China, India, Indonesia, Mexico and Turkey until 2030, due to their projected high economic growth. Emissions in Brazil, Canada, South Korea, the Russian Federation and the United States would remain stable approximately at current
levels. In Japan and the EU, emissions are projected to decrease further under current policies.
– With the selected enhancement measures included here, China and Mexico would stabilise emissions by 2030, at the latest. The EU, Japan, South Korea, and the United States would achieve a pathway with further reductions in line with their long-term targets. Emissions in India, Indonesia and Turkey would continue to increase strongly, but less so than under current and planned policies.
– The priority sectors for current mitigation efforts and the selected enhancement measures vary per country. In most countries/regions, the energy sector has the highest emission levels so that mitigation efforts in this sector – notably that of reducing coal use in power generation – could lead to rapid emission reductions. Other important measures include improving efficiency in transport, industry, and buildings. Apart from reducing greenhouse gases, these measures have significant co-benefits such as improving air quality and energy saving. For Brazil and Indonesia, measures in the land-use sector are of great importance, given the sector’s current high share in total emissions, but also because that is expected lead to significant environmental and social benefits.
– Looking only at 13 major emitting countries/regions, the enhanced policy scenarios in this report could reduce emissions by 6.1 GtCO2e by 2030, compared to
under current policies. This is roughly a third of the difference in global emission levels between a scenario consistent with the 2 °C limit and a current policies scenario based on the UNEP’s Emissions Gap Report 2014 (UNEP, 2014). By 2020, reductions of up to 2.3 GtCO2e below what can be expected from current
policies would be possible. Hence, our selected enhancement measures for these 13 countries/regions (representing about 65% of global emissions in 2010) will not be sufficient to stay below the target of 2 °C maximum global temperature increase.
7
Main findings |
– Uncertainty around future estimates remains high. For example in Japan, decisions on the future of nuclear energy will strongly influence the development of emissions in the power sector. Whether South Korea will achieve its unconditional pledge depends on the enforcement of their emissions trading system. In Australia, the effect of policies replacing the carbon pricing mechanism is difficult to assess. China and India have pledges indexed to economic growth, implying that the absolute emission target level is very uncertain. Emission projections for Turkey are subject to considerable uncertainty which is related to economic growth. In Indonesia, emissions from land use, which are very uncertain, strongly determine total emission projections.
Executive summary
1 Introduction
This report provides an overview of projected
greenhouse gas emissions in 13 major emitting countries/ regions (Australia, Brazil, Canada, China, European Union, India, Indonesia, Japan, Mexico, the Russian Federation, South Korea, Turkey and the United States) up to 2030, taking into account the emission trajectories based on the most effective current and planned climate and energy policies, as well as selected enhanced mitigation measures. Earlier studies have explored the extent to which major economies are on track to achieving their 2020 pledges in the Cancún Agreements made under the United Nations Framework Convention on Climate Change (UNFCCC). This report extends these earlier analyses for 13 countries, in several ways. First, the effect of most effective current policies is analysed, in addition to planned ones. As policies are subject to change, this report represents the current state of affairs. Second, this report analyses the impact of a selection of enhanced mitigation measures that are related to current national priorities. Third, it projects the impact of these current, planned, and enhanced policies up to 2030. Finally, an estimation is presented of the aggregated emission reduction that could result from the enhanced policies to narrow the gap between the global emission levels in 2025 and 2030 consistent with achieving the climate target of 2 °C, and those that would result from current and planned policies.
The impact of the most effective current and planned policies on greenhouse gas emissions was estimated by Ecofys & NewClimate Institute, IIASA and PBL. The selection of current and planned policies was based on literature research and expert knowledge. Ecofys & NewClimate Institute based their calculations on existing scenarios from national and international studies (e.g. IEA’s World Energy Outlook 2014), as well as their own calculations of the impact of individual policies in
various subsectors. PBL based their calculations on the FAIR policy and TIMER energy models, and IIASA’s were based on their global land-use model GLOBIOM and global forest model G4M.
A new element in this analysis is the inclusion of enhanced policy scenarios. This study presents two variants of these scenarios:
1. Enhanced bottom-up policy scenario: Bottom-up analysis of selected country-specific mitigation policies in promising areas for enhancement measures, given the relevance and opportunities in a national context (e.g. co-benefits)
2. Enhanced top-down policy scenario: Implementation of sector-specific best available technologies. Calculations for the enhanced bottom-up policy scenario were done by Ecofys & NewClimate Institute (based on existing scenarios) and PBL (based on FAIR policy and TIMER energy models). The top-down scenario
calculations were done by PBL, using the PBL FAIR policy and the TIMER energy models for most of the 13 major emitting countries/regions. Both bottom-up and top-down scenario calculations were supplemented with those on land-use and agricultural policies using IIASA’s global land-use model GLOBIOM and global forest model G4M. Emission projections for all policy scenarios were extended to 2030, based on existing scenarios and PBL TIMER model calculations and, where applicable, on current and scenario targets for 2030.
The main findings regarding the current and planned policies and the enhanced bottom-up policy scenario are presented below, followed by the main findings from the enhanced top-down scenario. The last section of this summary presents the aggregate effect under the enhanced police scenarios (for both bottom-up and top-down) on narrowing the emission gap to achieve the 2 °C temperature target.
9
Executive summary |
It should be noted that the bottom-up and top-down ‘enhanced policy’ scenarios aim to show that by replicating ‘best-in-class’ policies or progressing to identified benchmarks, it is possible to significantly enhance current efforts. The selection of policies and measures is illustrative and not exhaustive. The selected enhancement measures are still insufficient to stay below 2 °C global temperature increase, or to achieve long-term goals as adopted by some countries.
2 Results per country
This section summarises the results per country, for both current and planned policies, and under the enhanced bottom-up policy scenario. The emission projections under the enhanced top-down policy scenario for the selected countries/regions are also shown in the figures below, and are described in more detail in Section 3. It should be noted that Australia, Brazil, India and the United States are the only countries in this analysis for which a clear distinction has been made between current and planned policies. This section also briefly describes the co-benefits and opportunities in implementing these options for mitigation enhancement. Finally, the presented countries/regions’ shares of global greenhouse gas emissions (including LULUCF1) of 2010 are calculated
using a global emission level of 49.5 GtCO2e for 2010
(Figure SPM.1, IPCC, 2014), as also used by UNEP (2014). The EDGAR database gives 2010 emissions of 50.9 GtCO2e; this difference is mainly due to differences in
LULUCF emissions. It should be noted that, for the Annex I countries excluding Australia and the United States, emission projections are presented excluding those from LULUCF, due to the uncertainties around future LULUCF emissions and accounting rules. For all other countries, the results are presented including LULUCF emissions.
Australia
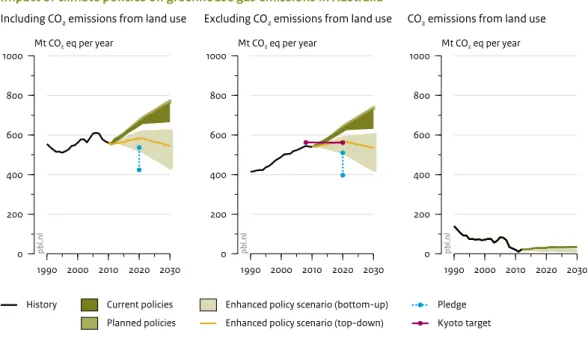
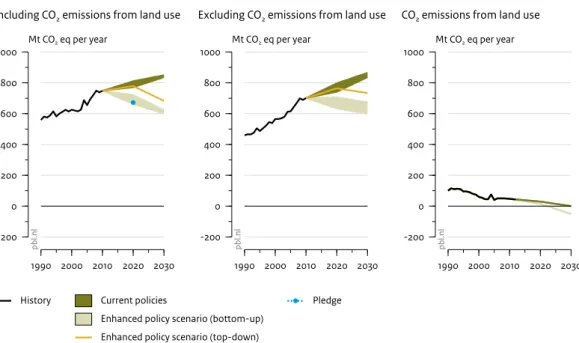
Under current policies, Australia’s emissions (including those from LULUCF) are estimated to be between 650 and 665 million tonnes of carbon dioxide equivalent emissions2 (MtCO
2e) by 2020 (16% to 19% above 2010
levels) and 670 to 760 MtCO2e by 2030 (20% to 36% above
2010 levels). The expected increase, in contrast to earlier projections, is mainly due to the repeal of the Carbon Pricing Mechanism in August 2014. Australia is currently also considering to cut the Renewable Energy Target, a financial incentive that has successfully stimulated the installation of renewable energy over the last decade, which would further increase emissions. Additional measures in renewable electricity generation and reintroducing an ambitious carbon pricing mechanism may reduce emissions to a level of between 430 and 625 MtCO2e by 2030 (from 24% below to 12% above 2010
levels), dependent on the assumed price levels. Only the lower end of the range would possibly bring Australia’s emissions back onto a pathway of achieving their earlier committed target for 2050 of 80% below 2000 levels. Increasing renewable electricity generation could have co-benefits, such as stimulating economic development in remote areas.
Brazil
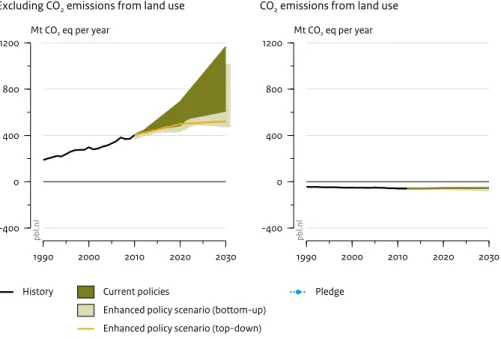
Under current policies, Brazil is expected to reduce emissions by about 10% to 13% below 2010 levels, by 2020, thereby achieving its pledged emission level. Policies on the forestry sector have a significant impact on total emissions; in particular the enforcement of the Brazilian Forest Code and efforts to reduce deforestation in the Amazon and Cerrado regions. The impact of the proposed measures in Cerrado depends on the success of policy implementation. If all current and planned policies are successful, emissions (including those from LULUCF) may reach 9% to 16% below 2010 levels by 2030. The identified enhancement options for achieving additional emission reductions are mainly in the LULUCF sector (including enhancement measures related to cattle intensification) and in the transport sector. Measures in these sectors may further decrease emissions to levels of 15% to 26% below 2010 levels, by 2030. Some of these policies have co-benefits; in particular in improvements in cattle management and cattle product output. Examples of such co-benefits connected to those improvements are the smaller land requirement to produce the same amount of output, thus sparing land for other uses, and reduced deforestation.
Figure 1 1990 2000 2010 2020 2030 0 200 400 600 800 1000 Mt CO2 eq per year
Source: PBL FAIR/TIMER model; Ecofys & NewClimate Institute calculations
pb
l.n
l
History Current policies Planned policies
Enhanced policy scenario (bottom-up) Enhanced policy scenario (top-down)
Pledge Kyoto target
Including CO2 emissions from land use
Impact of climate policies on greenhouse gas emissions in Australia
1990 2000 2010 2020 2030 0 200 400 600 800 1000 Mt CO2 eq per year pb l.n l
Excluding CO2 emissions from land use
1990 2000 2010 2020 2030 0 200 400 600 800 1000 Mt CO2 eq per year pb l.n l
CO2 emissions from land use
Historical greenhouse gas emissions (excluding LULUCF) based on national inventories submitted to UNFCCC, and LULUCF emissions from Climate Change Authority (2014). Section 3 describes the details of the enhanced (top-down) policy scenario.
Table 1
Impact of climate policies on greenhouse gas emissions (including LULUCF) in Australia
2010 GHG emissions, incl. LULUCF
Current policies Selection of possible mitigation enhancement measures (bottom-up scenario)
560 MtCO2e
1.1% of global emissions
25.1 tCO2e/capita
– Renewable energy targets (mix and capacity) – Closure of 2,000 MW brown coal-fired power
plants and replacement by highly efficient gas-fired power plants
Result (absolute; relative to 2010 levels):
650 to 665 MtCO2e; 16% to 19% by 2020
670 to 760 MtCO2e; 20% to 36% by 2030
25.2 to 25.9 tCO2e/capita by 2020
23.1 to 26.3 tCO2e/capita by 2030
– Enhanced renewable energy targets – Reintroduction of carbon pricing mechanism – Phase-down of consumption and production of
hydrofluorocarbons
Result (absolute; relative to 2010 levels):
520 to 615 MtCO2e; -7% to 10% by 2020
430 to 625 MtCO2e; -24% to 12% by 2030
20.3 to 23.9 tCO2e/capita by 2020
14.9 to 21.6 tCO2e/capita by 2030
Planned policies
– Reduce the target for large-scale renewable energy installations
Result (absolute; relative to 2010 levels):
660 to 680 MtCO2e; 18% to 22% by 2020
765 to 775 MtCO2e; 37% to 39% by 2030
25.7 to 26.3 tCO2e/capita by 2020
11
Executive summary |
Table 2
Impact of climate policies on greenhouse gas emissions (including LULUCF) in Brazil
2010 GHG emissions, incl. LULUCF
Current policies Selection of possible mitigation enhancement measures (bottom-up scenario)
1,690 MtCO2e
3.4% of global emissions
8.7 tCO2e/capita
– Pledge anchored in national law
– Forestry policy (Brazilian Forest Code for Amazon region and Cerrado region)
– Pasture management
– 10 year National Energy Expansion Plan (renewable energy targets)
– Transport: National Plan on Climate Change
Result (absolute; relative to 2010 levels):
1,470 to 1,520 MtCO2e; -10% to -13% by 2020
1,490 to 1,540 MtCO2e; -9% to -12% by 2030
7.0 to 7.2 tCO2e/capita by 2020
6.7 to 6.9 tCO2e/capita by 2030
– Intensification cattle farming
– Avoid recarbonisation in electricity sector – Improved vehicle efficiency standards – Phase-down of hydrofluorocarbons
Result (absolute; relative to 2010 levels):
1,330 to 1,445 MtCO2e; -15% to -22% by 2020
1,260 to 1,435 MtCO2e; -15% to -26% by 2030
6.3 to 6.9 tCO2e/capita by 2020
5.7 to 6.4 tCO2e/capita by 2030
Planned policies
– Forestry policy (Brazilian Forest Code for the Cerrado region and rest of Brazil)
Result (absolute; relative to 2010 levels):
1,390 to 1,520 MtCO2e; -10% to -18% by 2020 1,425 to 1,540 MtCO2e; -9% to -16% by 2030 6.6 to 7.2 tCO2e/capita by 2020 6.4 to 6.9 tCO2e/capita by 2030 Figure 2 1990 2000 2010 2020 2030 0 500 1000 1500 2000 2500 Mt CO2 eq per year
Source: PBL FAIR/TIMER model; Ecofys & NewClimate Institute calculations; IIASA GLOBIOM/G4M model
pb
l.n
l
History Current policies Planned policies
Enhanced policy scenario (bottom-up) Enhanced policy scenario (top-down)
Pledge
Including CO2 emissions from land use
Impact of climate policies on greenhouse gas emissions in Brazil
1990 2000 2010 2020 2030 0 500 1000 1500 2000 2500 Mt CO2 eq per year pb l.n l
Excluding CO2 emissions from land use
1990 2000 2010 2020 2030 0 500 1000 1500 2000 2500 Mt CO2 eq per year pb l.n l
CO2 emissions from land use
Historical greenhouse gas emissions (excluding LULUCF) are based on inventory data submitted to the UNFCCC (until 2005), energy-related CO2 emissions
from IEA (2013a), non-energy-related emissions from EDGAR 4.2 (JRC and PBL, 2012) and LULUCF emissions from FAOSTAT data (http://faostat3.fao.org/ faostat-gateway).
Canada
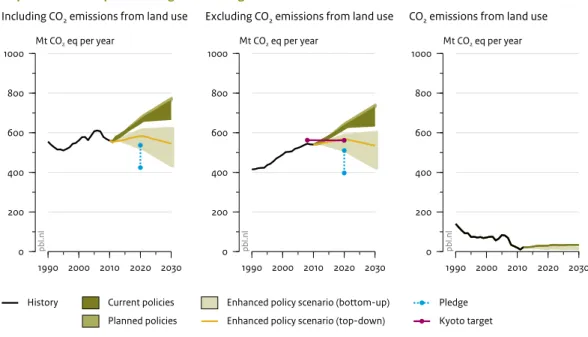
Under current policies, Canada’s emissions are projected to be about 720 to 760 MtCO2e by 2020 and 665 to 815
MtCO2e by 2030 (excluding LULUCF emissions). Projected
emissions that include those from LULUCFs are lower (see Table 3), but this highly depends on the projected LULUCF emissions, which are uncertain. Canada’s policy with the largest projected effect is that on the fuel efficiency standard for passenger vehicles, which is harmonised with US standards and will be introduced in two phases. Another policy is the carbon standard for newly built coal-fired power plants. This standard is projected to have only a small effect on 2020 emission levels, as it does not affect existing power plants. Under current and planned policies, Canada will not achieve its Copenhagen pledge of 610 MtCO2 e by 2020 (excluding land-use
emissions). Our analysis assumes no significant additional effect of planned policies for Canada.
Enhancement measures in the transport and power sectors and the reduction in methane emissions could result in emission levels of 680 to 720 MtCO2e by 2020
and 585 to 710 MtCO2e by 2030. Although this represents
a significant reduction in emissions below the level under current and planned policies, it would not be sufficient to meet the Copenhagen pledge. A co-benefit of these policies is the expected improvement in air quality.
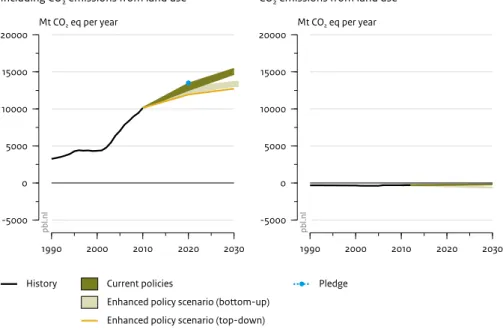
China
National policies from China’s 12th Five-Year Plan (FYP) and 12th FYP for Renewable Development are projected to lead to approximately the same emission levels as would be required to achieve the pledge for 2020 (13.5 GtCO2e, about 33% above 2010 levels). The expected
emission levels under current policies strongly depend on future economic growth and will range between 14.7 and 15.4 GtCO2e by 2030 (including LULUCF), which is about
46% to 53% above the 2010 level. The emission targets of China’s pledge and its national policies are coupled to GDP, implying that the absolute emission target is very uncertain.
Under policy enhancement measures in the forestry, transport, buildings, and power sectors, and with reductions in hydrofluorocarbons, total emissions would keep increasing up to 2020 and subsequently would more or less stabilise up to 2030 (13.1–13.7 GtCO2e by 2030). All
enhancement measures considered here have large potential for co-benefits, most importantly the improvement in local air quality. Air quality is a concern China is aiming to tackle already, and policies such as efficiency standards for passenger vehicles and buildings, and limits to coal combustion support existing air pollution mitigation policies.
13 Executive summary |
Figure 3 1990 2000 2010 2020 2030 -200 0 200 400 600 800 1000 Mt CO2 eq per year
Source: PBL FAIR/TIMER model; Ecofys & NewClimate Institute calculations
pb
l.n
l
History Current policies
Enhanced policy scenario (bottom-up) Enhanced policy scenario (top-down)
Pledge
Excluding CO2 emissions from land use
Impact of climate policies on greenhouse gas emissions in Canada
1990 2000 2010 2020 2030 -200 0 200 400 600 800 1000 Mt CO2 eq per year pb l.n l
CO2 emissions from land use
Historical greenhouse gas emissions (including LULUCF) are based on national inventories submitted to UNFCCC.
Table 3
Impact of climate policies on greenhouse gas emissions (excluding LULUCF) in Canada
2010 GHG emissions, excl. LULUCF
Current policies Selection of possible mitigation enhancement measures (bottom-up scenario)
700 MtCO2e
1.6% of global emissions (incl. LULUCF) 20.6 tCO2e/capita
– CO2 standard for new power plants
– Vehicle efficiency standards
Result (absolute; relative to 2010 levels*):
720 to 760 MtCO2e; 3% to 9% by 2020
665 to 815 MtCO2e; 17% to -5% by 2030
19.0 to 20.2 tCO2e/capita by 2020
16.1 to 19.7 tCO2e/capita by 2030
– Increased share of non-hydrogen renewable energy in electricity generation
– Improved vehicle efficiency standards – Methane emission reductions – Phase-down of hydrofluorocarbons
Result (absolute; relative to 2010 levels):
680 to 720 MtCO2e; 3% to -3% by 2020
585 to 710 MtCO2e; 2% to -17% by 2030
18.0 to 19.0 tCO2e/capita by 2020
14.1 to 17.2 tCO2e/capita by 2030
* Reductions presented here are relative to 2010, excluding LULUCF. The reductions relative to 2010 levels (including LULUCF) highly depend on the
Figure 4 1990 2000 2010 2020 2030 -5000 0 5000 10000 15000 20000 Mt CO2 eq per year
Source: PBL FAIR/TIMER model; Ecofys & NewClimate Institute calculations; IIASA GLOBIOM/G4M model
pb
l.n
l
History Current policies
Enhanced policy scenario (bottom-up) Enhanced policy scenario (top-down)
Pledge
Including CO2 emissions from land use
Impact of climate policies on greenhouse gas emissions in China
1990 2000 2010 2020 2030 -5000 0 5000 10000 15000 20000 Mt CO2 eq per year pb l.n l
CO2 emissions from land use
Historical greenhouse gas emissions are based on energy-related emissions (IEA, 2013a), non-energy-related emissions (EDGAR 4.2) (JRC and PBL, 2012) and LULUCF emissions (FAOSTAT). For reporting reasons, the emission projections excluding LULUCF are not presented, as these are similar to those including LULUCF.
Table 4
Impact of climate policies on greenhouse gas emissions (including LULUCF) in China
2010 GHG emissions, incl. LULUCF
Current policies Selection of possible mitigation enhancement measures (bottom-up scenario)
10,130 MtCO2e
20.5% of global emissions
7.3 tCO2e/capita
– The 12th Five-Year Plan for renewable energy – CO2 / energy intensity targets
– Cap on coal consumption from 2020 onwards – A 10% target share of gas in primary energy supply
by 2020
– Subsidies for hybrid and electric vehicles – Biofuel targets
– Energy efficiency in industry – Forestry policy
Result (absolute; relative to 2010 levels):
12,535 to 13,420 MtCO2e; 24% to 33% by 2020
14,700 to 15,415 MtCO2e; 46% to 53% by 2030
8.8 to 9.5 tCO2e/capita by 2020
10.3 to 10.8 tCO2e/capita by 2030
– Targets for forest cover for 2020 and 2050 – Increased renewable energy targets in electricity
generation
– Improved vehicle efficiency standards – Energy efficiency in buildings – Phase-down of hydrofluorocarbons
Result (absolute; relative to 2010 levels):
12,135 to 12,890 MtCO2e; 20% to 28% by 2020
13,075 to 13,660 MtCO2e; 30% to 35% by 2030
8.5 to 9.1 tCO2e/capita by 2020
15
Executive summary |
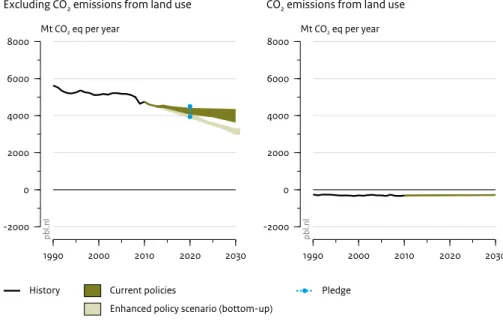
European Union
The EU is likely to overachieve its unconditional pledge of reducing greenhouse gas emissions by 20%, below 1990 levels, by 2020. Current policies could result in reductions of 22% to 27%, relative to 1990 levels, by 2020, and 23% to 35%, by 2030.
Enhanced policies could reduce emissions further. With additional measures for energy efficiency in passenger transport and buildings and a phase-down of hydro-fluorocarbons, the announced 40% reduction, below 1990 level, by 2030, could already be achieved. Scenarios exploiting all mitigation options show that further reductions would be possible. An important co-benefit of these enhancement measures for the EU is that of increased energy security.
India
Under current domestic measures, we project that India is likely to achieve its pledge for 2020, with policies consisting of renewable energy targets and the market-based mechanism Perform Achieve and Trade (PAT) scheme for energy efficiency. As for China, emission projections highly depend on future economic growth. Therefore, uncertainty in projections resulting from the pledges is high, because both baseline emission projections and GDP developments are uncertain. Projected emission levels under current policies will reach about 4.8 to 5.5 GtCO2e by 2030 (including LULUCF),
which is about 103% to 132% above 2010 levels. Under planned policies (on solar and wind power), emission levels will reach about 4.5 to 5.3 GtCO2e by 2030.
The selected mitigation enhancement measures could further reduce emissions by about0.3 GtCO2e by 2020 and
about 0.5 to 0.7 GtCO2e by 2030, compared to under
current policies. The total emission level would be 3.3 to 3.7 GtCO2e by 2020 and 4.3 to 4.8 GtCO2e by 2030 (80% to
101% above 2010 levels). All enhancement measures considered here hold large potential for co-benefits, most importantly those of enabling access to electricity through renewable energy and electricity saving on the consumers’ side.
Figure 5 1990 2000 2010 2020 2030 -2000 0 2000 4000 6000 8000 Mt CO2 eq per year
Source: Ecofys & NewClimate Institute calculations
pb
l.n
l
History Current policies
Enhanced policy scenario (bottom-up)
Pledge
Excluding CO2 emissions from land use
Impact of climate policies on greenhouse gas emissions in EU28
1990 2000 2010 2020 2030 -2000 0 2000 4000 6000 8000 Mt CO2 eq per year pb l.n l
CO2 emissions from land use
Historical greenhouse gas emissions (excluding LULUCF) are based on national inventories submitted to UNFCCC.
Table 5
Impact of climate policies on greenhouse gas emissions (excluding LULUCF) in the EU28
2010 GHG emissions, excl. LULUCF
Current policies Selection of possible mitigation enhancement measures (bottom-up scenario)
4,750 MtCO2e (excl. LULUCF) 9.0% of global emissions (incl. LULUCF) 9.2 tCO2e/capita (excl. LULUCF) – EU ETS
– Renewable Energy Roadmap – Energy Efficiency Directive – Eco-Design Framework
– Regulation on CO2 emissions from vehicles
Result (absolute; relative to 2010 levels):
4,105 to 4,370 MtCO2e; -9% to -14% by 2020
3,670 to 4,315 MtCO2e; -10% to -23% by 2030
7.8 to 8.4 tCO2e/capita by 2020
7.0 to 8.2 tCO2e/capita by 2030
– Energy efficiency in passenger transport – Energy efficiency in buildings
– Phase-down of hydrofluorocarbons
Result (absolute; relative to 2010 levels):
3,900 to 4,075 MtCO2e; -15% to -18% by 2020
3,020 to 3,275 MtCO2e; -32% to -37% by 2030
7.5 to 7.8 tCO2e/capita by 2020
17
Executive summary |
Table 6
Impact of climate policies on greenhouse gas emissions (including LULUCF) in India
2010 GHG emissions, incl. LULUCF
Current policies Selection of possible mitigation enhancement measures (bottom-up scenario)
2,380 MtCO2e
4.8% of global emissions
2.0 tCO2e/capita
– Renewable energy targets (mix and capacity) – Efficiency in industry (PAT scheme)
– Support for biofuels
– Forestry policy (Green India Mission)
Result (absolute; relative to 2010 levels):
3,535 to 3,960 MtCO2e; 49% to 67% by 2020
4,805 to 5,520 MtCO2e; 103% to 132% by 2030
2.6 to 2.9 tCO2e/capita by 2020
3.2 to 3.6 tCO2e/capita by 2030
– Targets for forest cover for 2020
– Enable access to electricity through renewable energy, decentralised solar photovoltaic (PV) system units
– Improved vehicle efficiency standards – Energy efficiency in buildings – Energy efficiency in industry – Phase-down of hydrofluorocarbons
Result (absolute; relative to 2010 levels):
3,265 to 3,650 MtCO2 e; 38% to 54% by 2020
4,270 to 4,775 MtCO2 e; 80% to 101% by 2030
2.4 to 2.7 tCO2e/capita by 2020
2.8 to 3.2 tCO2e/capita by 2030
Planned policies
– Increased renewable energy targets (solar and wind missions)
Result (absolute; relative to 2010 levels):
3,300 to 3,855 MtCO2e; 39% to 63% by 2020 4,455 to 5,265 MtCO2e; 88% to 122% by 2030 2.4 to 2.8 tCO2e/capita by 2020 2.9 to 3.5 tCO2e/capita by 2030 Figure 6 1990 2000 2010 2020 2030 -2000 0 2000 4000 6000 8000 Mt CO2 eq per year
Source: PBL FAIR/TIMER model; Ecofys & NewClimate Institute calculations; IIASA GLOBIOM/G4M model
pb
l.n
l
History Current policies Planned policies
Enhanced policy scenario (bottom-up) Enhanced policy scenario (top-down)
Pledge
Including CO2 emissions from land use
Impact of climate policies on greenhouse gas emissions in India
1990 2000 2010 2020 2030 -2000 0 2000 4000 6000 8000 Mt CO2 eq per year pb l.n l
CO2 emissions from land use
Historical greenhouse gas emissions are based on energy-related emissions (IEA, 2013a), non-energy-related emissions (EDGAR 4.2) (JRC and PBL, 2012) and LULUCF emissions (FAOSTAT). For reporting reasons, the emission projections excluding LULUCF are not presented, as these are similar to those including LULUCF.
Indonesia
A significant share of Indonesia’s emissions is connected to forestry and land use, due to deforestation, peatland destruction, and land-use change. There is a large uncertainty in LULUCF emissions, particularly related to peat oxidations (not including peat fires), which can be in the order of 30% to 50% of total LULUCF emissions. Uncertainty concerning emissions from peat fires is also high and it is well known that these emissions vary significantly between years. This has made it difficult to determine the emission projections for Indonesia and to assess whether the 2020 pledge will be achieved. As a result, Indonesia’s emission reductions resulting from the policies assessed in our analysis are projected to be smaller than the uncertain amount of emissions from land-use changes and forestry. Therefore, emission projections that assume the implementation of these policies are mainly illustrative. Successful implementation of policies on reducing deforestation and forest degradation can lead to significant emission reductions. If all current policies are successful, Indonesia would reduce emissions from LULUCF (including peat oxidation from deforestation, but excluding peat fires) by 35% below 2010 levels by 2030. For the energy sector, the renewable energy and biofuel targets set for 2025 are expected to lead to emission reductions, compared to baseline projections; however, emissions are still projected to increase further.
Overall, current and planned policies will lead to total greenhouse gas emission levels (including LULUCF) of 6% to 8% below 2010 levels by 2020, and 1% to 5% above 2010 levels by 2030. Enhanced policies on the deforestation of peatlands and in the transport sector may lead to further emission reductions, towards a projected emission level of 9% to 10% by 2020 and 2% to 5% by 2030, below 2010 levels. However, uncertainties concerning the implementation of such policies are still high. Furthermore, the emissions projected for 2020 and 2030 strongly depend on the assumed LULUCF emissions.
Japan
Under current policies Japan’s emissions (excluding LULUCF) are estimated to be between 1,135 to 1,330 MtCO2e by 2020 (10% below to 6% above 2010
levels) and 1,045 to 1,190 MtCO2e by 2030 (6% to 17%
below 2010 levels). The large range is caused by the uncertainty about the phase-out of nuclear energy, as it is not yet fully clear whether this will occur and which energy carriers will replace the nuclear energy capacity. The upper end of the range basically assumes a full phase-out of nuclear energy, while the lower end assumes that some plants will be reconnected to the grid. This means that meeting its new tentative 2020 target, i.e. to reduce emissions by 3.8% from 2005 levels by 2020 (excluding LULUCF; corresponding to a 3.4% increase on 2010 levels), could be challenging for Japan under full nuclear energy phase-out.
Additional enhancement measures in renewable electricity generation and in the areas of efficiency in buildings and transport may reduce emissions to a level of between 965 and 1,065 MtCO2e by 2030 (16% to 24%
below 2010), and could compensate potential emissions from a nuclear energy phase-out. Co-benefits of these policies include increased energy security due to fuel saving and less import dependency on coal and other fossil fuels. Furthermore, fuel efficiency in transport might reduce smog-related respiratory and visibility problems.
19 Executive summary |
Figure 7 1990 2000 2010 2020 2030 0 500 1000 1500 2000 2500 3000 Mt CO2 eq per year
Source: PBL FAIR/TIMER model; Ecofys & NewClimate Institute calculations; IIASA GLOBIOM/G4M model
pb l.n l History History (National Communication) Current policies
Enhanced policy scenario (bottom-up) Enhanced policy scenario (top-down)
Pledge
NB: historical land-use emissions include those from peat oxidation caused by deforestation, estimated by IIASA
Including CO2 emissions from land use
Impact of climate policies on greenhouse gas emissions in Indonesia
1990 2000 2010 2020 2030 0 500 1000 1500 2000 2500 3000 Mt CO2 eq per year pb l.n l
Excluding CO2 emissions from land use
1990 2000 2010 2020 2030 0 500 1000 1500 2000 2500 3000 Mt CO2 eq per year pb l.n l
CO2 emissions from land use
Historical emissions are based on energy-related emissions (IEA, 2013a), non-energy-related emissions (EDGAR 4.2) (JRC and PBL, 2012), LULUCF emissions (FAOSTAT), and emissions from peat oxidation from deforestation estimated by IIASA.
Table 7
Impact of climate policies on greenhouse gas emissions (including LULUCF) in Indonesia
2010 GHG emissions, incl. LULUCF
Current policies Selection of possible mitigation enhancement measures (bottom-up scenario)
2,060 MtCO2e
4.2% of global emissions
8.6 tCO2e/capita
– Forestry policy (implementation of FLEGT and policies on peatland fires)
– Renewable energy and biofuel targets
Result (absolute; relative to 2010 levels):
1,910 to 1,950 MtCO2 e; -6% to -8% by 2020
2,070 to 2,145 MtCO2 e; 1% to 5% by 2030
7.3 to 7.5 tCO2e/capita by 2020
7.5 to 7.7 tCO2e/capita by 2030
– Reduced deforestation on peatlands – Improved vehicle efficiency standards – Phase-down of hydrofluorocarbons
Result (absolute; relative to 2010 levels):
1,855 to 1,895 MtCO2 e; -9% to -10% by 2020
1,960 to 2,035 MtCO2 e; -2% to -5% by 2030
7.1 to 7.3 tCO2e/capita by 2020
Figure 8 1990 2000 2010 2020 2030 -500 0 500 1000 1500 2000 Mt CO2 eq per year
Source: PBL FAIR/TIMER model; Ecofys & NewClimate Institute calculations
pb
l.n
l
History Current policies
Enhanced policy scenario (bottom-up) Enhanced policy scenario (top-down)
Pledge
Excluding CO2 emissions from land use
Impact of climate policies on greenhouse gas emissions in Japan
1990 2000 2010 2020 2030 -500 0 500 1000 1500 2000 Mt CO2 eq per year pb l.n l
CO2 emissions from land use
Historical greenhouse gas emissions (excluding LULUCF) are based on national inventories submitted to UNFCCC.
Table 8
Impact of climate policies on greenhouse gas emissions (excluding LULUCF) in Japan
2010 GHG emissions, excl. LULUCF
Current policies Selection of possible mitigation enhancement measures (bottom-up scenario)
1,255 MtCO2e
2.4% of global emissions (incl. LULUCF)
9.8 tCO2e/capita
– Basic Energy Plan for renewable energy targets – Top Runner Programme (vehicle efficiency
standards, fuel efficiency)
Result (absolute; relative to 2010 levels):
1,135 to 1,330 MtCO2e; -10% to 6% by 2020
1,045 to 1,190 MtCO2e; -6% to -17% by 2030
9.0 to 10.6 tCO2e/capita by 2020
8.6 to 9.8 tCO2e/capita by 2030
– Next to phase-out of nuclear energy, phase-in of renewable energy
– Improved vehicle efficiency standards – Energy efficiency in buildings – Phase-down of hydrofluorocarbons
Result (absolute; relative to 2010 levels):
1,040 to 1,250 MtCO2e; -12% to 6% by 2020
965 to 1,065 MtCO2e; -16% to -24% by 2030
8.9 to 10.5 tCO2e/capita by 2020
21
Executive summary |
Mexico
Projections of current and planned policies show that Mexico is expected to achieve emission reductions, but these are not sufficient to meet its conditional pledge of 30% emission reduction by 2020, relative to the national baseline levels (about 670 MtCO2e).
Under policy enhancement measures in the energy, transport and forestry sectors, emissions (including LULUCF) could be about 4% to 12% below 2010 levels by 2020 (665–720 MtCO2e), and 17% to 20% below 2010
levels by 2030 (600–625 MtCO2e). The selected mitigation
enhancement measures will halt deforestation, increase vehicle efficiency standards, with a strong continuation of renewable energy implementation and strong cuts in gas flaring, as well as phasing-down hydrofluorocarbons. Such measures would have multiple co-benefits in terms of reducing air pollution and agricultural damage, providing energy security and reducing the dependence on fossil fuels.
The Russian Federation
Under the Copenhagen Accord, the Russian Federation pledged an emission reduction of 15% to 25%, relative to 1990 levels, by 2020. In September 2013, the Russian Government committed to the higher end of the target. This could be achieved with already implemented policies. The Russian State Programme includes targets for energy efficiency and renewable electricity generation. Russia’s gas flaring policy could lead to additional emission reductions, but it is unclear whether this policy will be fully implemented. The current policies analysed in this assessment could lead to an emission level of 2,295 to 2,375 MtCO2e by 2020 (4% to 8% above
2010 levels) and 2,175 to 2,770 MtCO2e by 2030 (3% below
2010 levels to 25% above 2010 levels), excluding land-use emissions. Enhanced policies in the transport, energy and buildings sectors could lead to additional emission reductions, resulting in emission levels of 2,260 to 2,340 MtCO2e by 2020 and 2,055 to 2,315 MtCO2e by 2030 (8%
below to 5% above 2010 levels). One of the co-benefits of these enhanced policies is that of improved air quality.
Figure 9 1990 2000 2010 2020 2030 -200 0 200 400 600 800 1000 Mt CO2 eq per year
Source: PBL FAIR/TIMER model; Ecofys & NewClimate Institute calculations; IIASA GLOBIOM/G4M model
pb
l.n
l
History Current policies
Enhanced policy scenario (bottom-up) Enhanced policy scenario (top-down)
Pledge
Including CO2 emissions from land use
Impact of climate policies on greenhouse gas emissions in Mexico
1990 2000 2010 2020 2030 -200 0 200 400 600 800 1000 Mt CO2 eq per year pb l.n l
Excluding CO2 emissions from land use
1990 2000 2010 2020 2030 -200 0 200 400 600 800 1000 Mt CO2 eq per year pb l.n l
CO2 emissions from land use
Historical greenhouse gas emissions (excluding LULUCF) are based on inventory data of the Fifth National Communication to the UNFCCC (Government of Mexico, 2012)
Table 9
Impact of climate policies on greenhouse gas emissions (including LULUCF) in Mexico
2010 GHG emissions, incl. LULUCF
Current policies Selection of possible mitigation enhancement measures (bottom-up scenario)
750 MtCO2e
1.5% of global emissions
6.7 tCO2e/capita
– Renewable energy targets (national Climate Change Strategy and the Special Climate Change Programme)
– Forestry target
Result (absolute; relative to 2010 levels):
770 to 810 MtCO2e; 4% to 9% by 2020
835 to 850 MtCO2e; 12% to 14% by 2030
6.2 to 6.5 tCO2e/capita by 2020
6.2 to 6.3 tCO2e/capita by 2030
– Forestry policy
– Enhanced renewable energy targets – Improved vehicle efficiency standards
– Decrease venting and flaring of methane in oil and gas production
– Phase-down of hydrofluorocarbons
Result (absolute; relative to 2010 levels):
665 to 720 MtCO2e; -4% to -12% by 2020
600 to 625 MtCO2e; -17% to -20% by 2030
5.3 to 5.8 tCO2e/capita by 2020
23 Executive summary |
Figure 10 1990 2000 2010 2020 2030 -1000 0 1000 2000 3000 4000 Mt CO2 eq per year
Source: PBL FAIR/TIMER model; Ecofys & NewClimate Institute calculations
pb
l.n
l
History Current policies
Enhanced policy scenario (bottom-up) Enhanced policy scenario (top-down)
Pledge
Excluding CO2 emissions from land use
Impact of climate policies on greenhouse gas emissions in the Russian Federation
1990 2000 2010 2020 2030 -1000 0 1000 2000 3000 4000 Mt CO2 eq per year pb l.n l
CO2 emissions from land use
Historical greenhouse gas emissions (excluding LULUCF) are based on national inventories submitted to UNFCCC, and forestry emissions from the Sixth National Communication (Russian Federation, 2013).
Table 10
Impact of climate policies on greenhouse gas emissions (excluding LULUCF) in the Russian Federation
2010 GHG emissions, excl. LULUCF
Current policies Selection of possible mitigation enhancement measures (bottom-up scenario)
2,220 MtCO2e
3.3% of global emissions (incl. LULUCF)
14.0 tCO2e/capita
– Renewable energy targets – Energy intensity targets
– Decrease venting and flaring of methane in oil and gas production
Result (absolute; relative to 2010 levels*):
2,295 to 2,375 MtCO2e; 4% to 8% by 2020
2,175 to 2,770 MtCO2e; -3% to 25% by 2030
14.5 to 15.0 tCO2e/capita by 2020
13.9 to 17.7 tCO2e/capita by 2030
– Enhanced renewable energy targets – Improved vehicle efficiency standards – Energy efficiency in buildings – Phase-down of hydrofluorocarbons
Result (absolute; relative to 2010 levels):
2,260 to 2,340 MtCO2e; 2% to 6% by 2020
2,055 to 2,315 MtCO2e; -8% to 5% by 2030
14.3 to 14.8 tCO2e/capita by 2020
13.1 to 14.8 tCO2e/capita by 2030
* Here, reductions relative to 2010 excluding LULUCF are presented. Reductions relative to 2010 levels (including LULUCF) highly depend on the projected
South Korea
South Korea introduced a green growth strategy to stimulate green technologies and industries. Based on this strategy, South Korea pledged to reduce emissions unconditionally by 30%, compared to baseline levels, by 2020, implying an emission target level of about 545 MtCO2e, excluding LULUCF. The green growth strategy
is supported by renewable targets for 2020 and 2030, which were introduced in the 2010 National Basic Energy Plan. South Korea launched a national emissions trading system (ETS) in January 2015. According to our assessment, the ETS and the renewable energy target could result in stabilisation of South Korea’s emission levels (excluding LULUCF) at 585 to 640 MtCO2e by 2020
and 585 to 700 MtCO2e by 2030. This is a deviation from
the historical trend of strongly increasing emissions and is an important step towards achieving the pledge. However, it is not expected to be sufficient to achieve the pledged emission level by 2020. Whether South Korea will achieve its unconditional pledge depends on the enforcement of its emissions trading system.
Under enhancement measures in the power, transport and buildings sectors and a phase-down of hydro-fluorocarbons, South Korea may reduce its emissions to a level of 565 to 635 MtCO2e by 2020 and 450 to 535 MtCO2e
by 2030 (excluding LULUCF; about 15% to 29% below 2010 levels). Especially replacing coal by renewable energy in power generation could contribute to significant emission reductions beyond those resulting from current policies. Co-benefits of these enhanced policies consist of improved air quality and a decreased dependency on imported fuels.
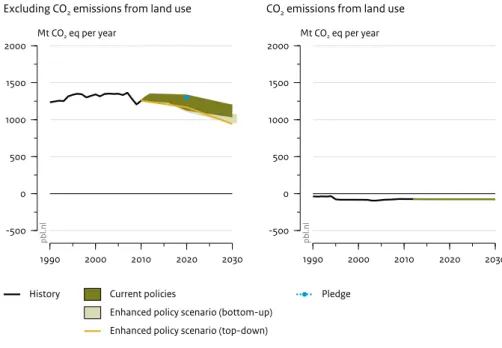
Turkey
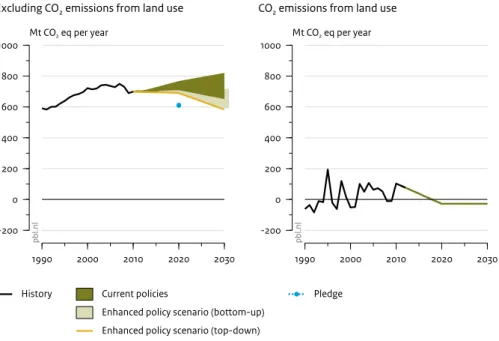
Although Turkey did not submit an international pledge, it has a renewable electricity target and an energy intensity target. If effective policies are implemented to achieve these targets, they could lead to emission levels of 21% to 71% above 2010 levels (excluding LULUCF) by 2020 and 52% to 189% above 2010 levels by 2030. Enhanced policies in the transport, energy and buildings sectors could further reduce emissions to levels of 10% to 64% above 2010 levels by 2020 and 19% to 151% above 2010 levels by 2030. Co-benefits of these enhanced policies include improved air quality and increased energy security, and will also lead to further alignment with EU policies. The actual emission level resulting from the energy intensity target strongly depends on the future development of GDP and is thus surrounded by large uncertainties.
United States
Current policies in the United States are likely not yet sufficient to reduce emissions as pledged to the UNFCCC (17% below 2005 levels, by 2020; corresponding to 13% below 2010 levels). The emissions under current policies (excluding the Climate Action Plan, which is considered as planned policies) are estimated to reach about 8% below to 5% above 2010 levels by 2020, and 12% below to 10% above 2010 levels by 2030. The large range is caused by the uncertainty about whether the planned policies will be implemented. Recent US policy assessments show that emissions could stabilise or even increase between 2010 and 2020. Full implementation of all additional planned policies covered by the Climate Action Plan is expected to reduce emissions close to the level needed to achieve the pledge by 2020, depending on how land-use-related emissions are accounted for. By 2030, these additional policies would achieve an emission level of about 5% to 27% below the 2010 level, including land-use emissions.
The enhanced policies we selected could achieve additional emission reductions in key sectors such as the power sector (including enhancement measures to increase levels of clean electricity generation and tightening energy efficiency standards of power plants) and the industrial sector (improving energy efficiency), and would further reduce emissions to about 17% to 38%, below 2010 levels, by 2030. Such measures would have co-benefits in terms of reducing air pollution and reducing the dependence on fossil fuels.
25
Executive summary |
Table 11
Impact of climate policies on greenhouse gas emissions (excluding LULUCF) in South Korea
2010 GHG emissions, excl. LULUCF
Current policies Selection of possible mitigation enhancement measures (bottom-up scenario)
630 MtCO2e 1.2 % of global emissions (incl. LULUCF) 12.9–13.0 tCO2e/ capita
– Emissions Trading System – Renewable energy target
Result (absolute; relative to 2010 levels):
585 to 640 MtCO2e; -7% to 2% by 2020
585 to 700 MtCO2e; -7% to 11% by 2030
11.6 to 12.6 tCO2e/capita by 2020
11.2 to 13.4 tCO2e/capita by 2030
– Enhanced renewable energy target – Energy efficiency in buildings – Improved vehicle efficiency standards – Phase-down of hydrofluorocarbons
Result (absolute; relative to 2010 levels):
565 to 635 MtCO2e; -10% to 1% by 2020 450 to 535 MtCO2e; -15% to -29% by 2030 11.1 to 12.5 tCO2e/capita by 2020 8.6 to 10.3 tCO2e/capita by 2030 Figure 11 1990 2000 2010 2020 2030 -200 0 200 400 600 800 1000 Mt CO2 eq per year
Source: PBL FAIR/TIMER model; Ecofys & NewClimate Institute calculations
pb
l.n
l
History Current policies
Enhanced policy scenario (bottom-up)
Pledge
Excluding CO2 emissions from land use
Impact of climate policies on greenhouse gas emissions in South Korea
1990 2000 2010 2020 2030 -200 0 200 400 600 800 1000 Mt CO2 eq per year pb l.n l
CO2 emissions from land use
Historical greenhouse gas emissions (excluding LULUCF) are based on national inventories submitted to UNFCCC, the Third National Communication (South Korea. Ministry of Environment, 2012). The emission projection does not include emissions from LULUCF, as these are also excluded from South Korea’s pledge.
Figure 12 1990 2000 2010 2020 2030 -400 0 400 800 1200 Mt CO2 eq per year
Source: PBL FAIR/TIMER model; Ecofys & NewClimate Institute calculations
pb
l.n
l
History Current policies
Enhanced policy scenario (bottom-up) Enhanced policy scenario (top-down)
Pledge
Excluding CO2 emissions from land use
Impact of climate policies on greenhouse gas emissions in Turkey
1990 2000 2010 2020 2030 -400 0 400 800 1200 Mt CO2 eq per year pb l.n l
CO2 emissions from land use
Historical greenhouse gas emissions are based on national inventories submitted to UNFCCC. For reporting reasons, the emission projections including LULUCF are not presented, as these are similar to those excluding LULUCF.
Table 12
Impact of climate policies on greenhouse gas emissions (excluding LULUCF) in Turkey
2010 GHG emissions, excl. LULUCF
Current policies Selection of possible mitigation enhancement measures (bottom-up scenario)
405 MtCO2e 0.7% of global emissions (including LULUCF) 5.3 tCO2e/capita
– Renewable energy target – Energy intensity target
Result (absolute; relative to 2010 levels):
485 to 690 MtCO2e; 21% to 71% by 2020
615 to 1,165 MtCO2e; 52% to 189% by 2030
5.8 to 8.2 tCO2e/capita by 2020
6.7 to 12.7 tCO2e/capita by 2030
– Enhanced renewable energy target – Improved vehicle efficiency standards – Phase-down of hydrofluorocarbons
Result (absolute; relative to 2010 levels):
440 to 660 MtCO2e; 10% to 64% by 2020
480 to 1,015 MtCO2e; 19% to 151% by 2030
5.2 to 7.8 tCO2e/capita by 2020
27 Executive summary |
Figure 13 1990 2000 2010 2020 2030 -2000 0 2000 4000 6000 8000 Mt CO2 eq per year
Source: PBL FAIR/TIMER model; Ecofys & NewClimate Institute calculations
pb
l.n
l
History Current policies Planned policies
Enhanced policy scenario (bottom-up) Enhanced policy scenario (top-down)
Pledge
Including CO2 emissions from land use
Impact of climate policies on greenhouse gas emissions in the United States
1990 2000 2010 2020 2030 -2000 0 2000 4000 6000 8000 Mt CO2 eq per year pb l.n l
Excluding CO2 emissions from land use
1990 2000 2010 2020 2030 -2000 0 2000 4000 6000 8000 Mt CO2 eq per year pb l.n l
CO2 emissions from land use
Historical greenhouse gas emissions (excluding LULUCF) are based on national inventories submitted to UNFCCC, and LULUCF emissions from the Sixth National Communication of the United States of America (United States, 2014).
Table 13
Impact of climate policies on greenhouse gas emissions (including LULUCF) in the United States
2010 GHG emissions, incl. LULUCF
Current policies Selection of possible mitigation enhancement measures (bottom-up scenario)
5,905 MtCO2e
11.9% of global emissions
18.7 tCO2e/capita
– Vehicle efficiency standards – State renewable energy targets (REN) – ETS California
– Biofuel target
Result (absolute; relative to 2010 levels):
5,445 to 6,170 MtCO2e; -8% to 5% by 2020
5,250 to 6,465 MtCO2e; -12% to 10% by 2030
15.9 to 18.0 tCO2e/capita by 2020
14.3 to 17.6 tCO2e/capita by 2030
– Enhanced CO2 standard for new power plants
– Improved vehicle efficiency standards – Efficiency improvement in industry – Phase-down of hydrofluorocarbons
Result (absolute; relative to 2010 levels):
4,400 to 5,565 MtCO2e; -6% to -26% by 2020
3,710 to 4,920 MtCO2e; -17% to -38% by 2030
12.8 to 16.3 tCO2e/capita by 2020
10.1 to 13.4 tCO2e/capita by 2030
Planned policies
– CO2 standard for new and existing power plants
– Methane emission reductions in oil and gas production
– Obama climate plan
Result (absolute; relative to 2010 levels):
4,715 to 5,905 MtCO2e; -1% to -21% by 2020
4,315 to 5,655 MtCO2e; -5% to -27% by 2030
13.8 to 17.2 tCO2e/capita by 2020
3
Results of enhanced policies
(top-down scenario)
PBL also explored an additional set of mitigation options in a modelling framework. The impact of mitigation options in the power, transport, buildings, and industry sectors on energy-related CO2 emissions in 11 of the 13
major emitting countries/regions were analysed (South Koreas was excluded from this analysis due to data constraints and EU data were based on a literature study) (Figure 14). The options in the energy sector range from specific energy efficiency measures, such as banning traditional light bulbs and enforcing ‘A’ label appliances, to broader policies, such as introducing passenger vehicle efficiency standards and carbon emission standards for power plants (for details, see Table 14). These options were not tailor-made to specific countries/regions, but were assumed to be implemented in a top-down way, by making the same assumptions for countries/regions. The outcomes are only explorative, but it is expected that full implementation of these mitigation measures could decrease emissions for each country, compared to under current policies.
Implementation of these mitigation measures in the United States could lead to major reductions in energy-related CO2 emissions in the power and transport sectors,
compared to under current policies. The reductions are smaller compared to planned policies that also include emission standards for power plants. The potential in these sectors is large as existing fuel efficiencies in light commercial vehicles and power plants are relatively low. The same holds for Brazil and Japan, where the largest potential to reduce emissions is in the transport and industry sectors. For the latter sector, increased efficiencies in steel production could have large effects, partly because demand for these industrial products is expected to rise.
For China and India, we identified the largest
opportunities for emission reductions to be in the power and industry sectors. The explored mitigation measures
in the electricity sector are particularly effective in India, mostly because India has a high dependence on coal-based electricity, both historically and in the PBL baseline projections. The study shows that, for India, reductions in the industry sector can be achieved by a combination of the use of advanced steel furnaces, good housekeeping and an improved clinker–cement ratio. In China, the effect is mainly due to improved housekeeping. The effects of increased efficiencies in steel and cement production are relatively large in China and India, partly because demand for these industrial products is expected to rise in the underlying scenarios. In China and the European Union, substantial reductions could also be achieved in the buildings sector, due to increased efficiency in heating and insulation and by a ban on incandescent light bulbs.
In Australia, Mexico and Turkey, the largest potential for reduction is projected to be in the transport sector, due to existing fuel inefficiencies, followed by the industry and electricity sectors. For the last two sectors, significant reductions can be achieved by a lower dependency on coal and improved efficiencies. In Indonesia, certain emission reductions can be achieved in all sectors, none of the sectors in particular.
For Canada, the analysis shows that the largest potential to reduce emissions can be found in the transport and buildings sectors. Emission reductions in the transport sector are mainly high because existing fuel efficiencies are relatively low in Canada, while the level of private car ownership is relatively high. Furthermore, insulation measures in the buildings sector can be particularly effective in Canada.
In the Russian Federation, the largest reduction potential is in the industry sector. Here, the effects of an increased efficiency in steel production are relatively large, in the form of the use of advanced steel furnaces and the implementation of good housekeeping measures. Emission reductions in the transport sector are also high because of low existing fuel efficiencies and a high level of private car ownership.
29
Executive summary |
Table 14
Overview of policies analysed in the enhanced top-down policy scenario
Sector Policy/measure Target
Energy – Emission standard for new power plants (ban on new coal-fired power plants)
– 1000 lbCO2/GWh (450 gCO2/kWh) by 2015
Transport – Enhanced vehicle efficiency standards – Achieve standards as currently discussed in the EU (46–49 km/l for new passenger cars by 2030 for developed countries, and by 2035 for developing countries)
Industry – Improving the clinker-to-cement ratio – Improved energy efficiency in steel and cement
industries
– The use of advanced type steel furnaces
– Maximum standard for clinker-to-cement ratios of 65% by 2030, linearly decreasing from 2015 levels
– Implementation of efficiency measures between 2015 and 2030
– Installation of most efficient steel blast furnace types from 2015 onwards
Buildings – Light-bulb standard
– Implementation of advanced heating and cooling – Efficient appliances
– Increased use of renewable energy
– A ban on incandescent light bulbs from 2015 onwards. To be replaced with compact fluorescent lighting or light emitting diodes (LEDs)
– Implementation of advanced heating and insulation technologies, leading to a standard in energy consumption of 15 KJ per square metre of living space per heating degree day (HDD) for newly built houses by 2030
– Enforcement of ‘A’ label appliances between 2015 and 2030
– Implementation of 1m2 solar PV for every
household between 2015 and 2030 Hydrofluorocarbons – Phase-down of production and consumption
of HFCs
– Implementation of a reduction scheme for the production and consumption of HFCs in Article 5 and non-Article 5 countries, leading to an 85% reduction by 2045 and 2035. This is based on the North American 2014 HFC submission to the Montreal Protocol. For further details see Appendix A.5 Figure 14 Australia Brazil Canada China India Indonesia Japan Mexico Russian Federation Turkey United States 0 20 40 60 80 100 % Source: PBL FAIR/TIMER model
pbl.nl
Electricity Industry Transport Buildings
Emission reduction in enhanced policies (top-down) compared to implemented policies
Table 15
The impact of mitigation enhancement measures on narrowing the emission gap to achieving the 2 °C target by 2030
Global 2010 greenhouse gas emissions, incl. LULUCF
Current policies Selection of possible mitigation enhancement measures (bottom-up scenario) (additional to planned policies)
49.5 GtCO2e* – Current emission trajectories from the
implemented policies (Section 3.1.3 of UNEP’s Emissions Gap Report 2014)
Result (absolute; relative to 2010 levels):
54.5 GtCO2e; 10% by 2020
59.0 GtCO2e; 19% by 2030
– Enhanced policy bottom-up scenario for 13 countries/regions
Result (absolute; relative to 2010 levels):
52.2 GtCO2e; 6% by 2020
52.9 GtCO2e; 7% by 2030
Planned policies (additional to current policies)
– Planned policies in 13 countries/regions
Result (absolute; relative to 2010 levels):
54.0 GtCO2e; 9% by 2020
58.0 GtCO2e ; 17% by 2030
* Source: IPCC (2014). Note that the Edgar database gives 2010 emissions of 50.9 GtCO 2e. Figure 15 1990 2000 2010 2020 2030 2040 0 20 40 60 80 Gt CO2 eq per year Source: UNEP 2014; PBL 2015 pb l.n l History Business-as-usual emission levels (UNEP 2014) Current policy trajectory (UNEP 2014)
Emission levels consistent with 2 °C target (UNEP 2014) Enhanced policy scenarios
Bottom-up Top-down
Emission gap (UNEP 2014)
Impact of enhanced policy scenarios on narrowing the global greenhouse gas emissions gap
The impact of the identified enhancement measures for the 13 countries/regions, in selected areas for achieving additional emission reductions, on narrowing the emission gaps in 2025 and 2030. The emission gap is based on the difference between emission levels of 2025 and 2030 consistent with meeting the climate target of 2 °C (UNEP, 2014), and levels expected in those two years, based on current emission trajectories.