GREENHOUSE GAS
EMISSION REDUCTION
TARGETS FOR 2030
CONDITIONS FOR AN
EU TARGET OF 40%
This policy study is a publication by
PBL Netherlands Environmental Assessment Agency Mailing address PO Box 30314 2500 GH The Hague The Netherlands Visiting address Oranjebuitensingel 6 2511VE The Hague T +31 (0)70 3288700 www.pbl.nl/en November 2012
Greenhouse gas emission reduction
targets for 2030
Greenhouse gas emission reduction targets for 2030. Conditions for an EU target of 40%
© PBL Netherlands Environmental Assessment Agency The Hague, 2012 ISBN: 978-94-91506-20-8 PBL publication number: 500114023 Corresponding author andries.hof@pbl.nl Authors
Andries Hof, Corjan Brink, Angelica Mendoza Beltran, Michel den Elzen
Acknowledgements
This project was financed by the Dutch Ministry of Infrastructure and the Environment. The report has benefited from comments by Pieter Boot, Ton Manders, Henk Hilderink, Leo Meyer, Herman Vollebergh (all PBL),
Marcel Berk, Linda van Houwelingen, Erwin Mulders (Ministry of Infrastructure and the Environment), Maurits Blanson Henkemans, Mark te Pas (Ministry of Economic Affairs, Agriculture and Innovation) and Linda ten Brinke (Ministry of Finance). English-language editing Serena Lyon Annemieke Righart Graphics PBL Beeldredactie Production coordination PBL Publishers Layout
Martin Middelburg, VijfKeerBlauw
This publication can be downloaded from: www.pbl.nl/en. Parts of this publication may be reproduced, providing the source is stated, in the form: Hof, A .et al. (2012), Greenhouse gas emission reduction targets for 2030. Conditions for an EU target of 40%, The Hague: PBL
Netherlands Environmental Assessment Agency.
PBL Netherlands Environmental Assessment Agency is the national institute for strategic policy analyses in the fields of the
environment, nature and spatial planning. We contribute to improving the quality of political and administrative decision-making, by conducting outlook studies, analyses and evaluations in which an integrated approach is considered paramount. Policy relevance is the prime concern in all our studies. We conduct solicited and unsolicited research that is both independent and always scientifically sound.
Contents
Findings 5
Greenhouse gas emission reduction targets for 2030 Conditions for an EU target of 40% 6 Main findings 6
Summary 8 Full Results 13
1 Background and research questions 14
2 Trends in greenhouse gas emissions without climate policies 16
3 Which global emission level by 2030 would be consistent with achieving the 2 °C target? 20 3.1 Technology assumptions 20
3.2 Assumptions on short-term emission reductions 20 4 Effort-sharing and reduction targets 22
4.1 Assumptions for emission reductions by 2020 22 4.2 Description of effort-sharing regimes 22 4.3 Equity principles 24
4.4 Emission reduction targets 24
5 Mitigation costs and welfare effects 30 5.1 Mitigation costs 30
5.2 Welfare effects, global action 31
5.3 Welfare, competitiveness and carbon leakage effects, fragmented and EU unilateral action 33 5.4 Co-benefits of the EU 40% reduction target 35
6 Robustness of results 38
6.1 Reduction targets based on the EU 40% target 38
6.2 Reduction targets for an equal relative costs, 2 °C regime 40 6.3 Mitigation costs 42
Annexes 44
Annex A: Methods and assumptions 44 Annex B: Pledges and long-term targets 47 Annex C: Detailed results emission allowances 48 Annex D: Detailed results on sectoral effects 49 References 50
5 |
FINDINGS FINDINGS
Greenhouse gas emission
reduction targets for 2030
Conditions for an EU target of
40%
Main findings
The Dutch Government calls for a conditional, European greenhouse gas (GHG) emission reduction target of 40% below 1990 levels by 2030, to be achieved within Europe, dependent on adequate global action and the adequate safeguarding of the competitiveness of EU industries (Dutch Government, 2011). To be able to define these conditions more concretely, PBL has been asked to evaluate two specific issues:
1. What efforts, in case of such a 40% reduction target, would be required by other countries according to different effort-sharing regimes for allocating emission allowances (taking into account differences in
economic development).
2. What would be the economic impact for the EU if other EU countries take on less stringent or no climate targets.
The analyses cover the period from 2020 onwards, at emission levels based on countries’ least ambitious pledged reduction targets for that year (20% below 1990 levels for the EU).
The main findings are:
• For the main developed countries, the effort-sharing regimes lead to the following ranges in reduction targets (all expressed relative to 1990 emission levels): 25% to 31% for the United States, 38% to 48% for Japan, 26% to 41% for Canada, and 14% to 27% for Russia.
• For some main developing countries, the ranges in reduction targets are (all expressed relative to baseline levels): 19% to 34% for China, 13% to 17% for India, 30% to 37% for Mexico, 32% to 49% for Brazil, and 12% to 21% for Indonesia.
• Direct mitigation costs for achieving the EU 40% target are projected to be 0.25% to 0.4% of GDP by 2030. The global average cost for staying within an emission range consistent with 2 °C is projected to be at least 0.43% of GDP, assuming that emissions are reduced wherever it is cheapest to do so.
• With equal costs as share of GDP for all countries by 2030, a 40% reduction target would result in a global emission level that is higher than the range consistent with achieving the 2 °C climate target.
• To arrive at a global emission level that is consistent with the 2 °C climate target, with equal costs as share of GDP for all countries by 2030, the EU would need to reduce emissions by 45% to 47% relative to the 1990 level.
• EU welfare losses resulting from achieving the EU 40% target are projected to be about 0.3% in the case of global action and 0.4% in the case of EU unilateral action, in which case almost one third of the reduction in the EU is projected to be offset by increased
emissions in the rest of the world (carbon leakage). This is mainly due to lower energy prices caused by a decrease in EU energy demand.
• The projected reduction in air pollution resulting from the 40% reduction target will be 17% below baseline levels by 2030. This would lead to a decrease in deaths
7 Findings |
from air pollution of about 3.5% relative to the baseline.
• The uncertainty ranges in the results may be larger than the ranges given here. More insight into the uncertainty ranges could be obtained by using different models to perform these calculations.
Summary
The long-term Dutch and European climate policy targets focus on limiting global temperature change to 2 °C above pre-industrial levels. In 2007, the EU made a unilateral commitment to reduce its greenhouse gas emissions to 20% below 1990 levels. This commitment, together with an EU renewable energy target of 20% for 2020, was translated into EU legislation through the ‘climate and energy package’, which was agreed by Council and Parliament at the end of 2008.
EU leaders also made a conditional commitment to scale up the EU greenhouse gas emission reduction target of 20% to 30% by 2020, on the condition that other developed countries commit to comparable emission reductions, and that more advanced developing countries would contribute to such a global effort in a manner consistent with their individual responsibilities and capabilities. These 20% unconditional and 30%
conditional targets have become part of the pledges that were entered into the Cancún Agreements (UNFCCC, 2011c). For 2050, there is ‘an EU objective, in the context of necessary reductions according to the IPCC by developed countries as a group, to reduce emissions by 80% to 95% by 2050 compared to 1990’, as agreed in October 2009 and reaffirmed by the European Council in February 2011. The European Commission’s report ‘Roadmap for moving to a competitive low-carbon economy in 2050’ provides cost-efficient pathways towards an overall 80% reduction in emissions within the EU by 2050, representing reductions of between 40% and 44% by 2030. However, the EU has not decided on a greenhouse gas emission reduction target for 2030, and this is still under discussion.
The Dutch Government has called for such a greenhouse gas emission reduction target by 2030. More specifically, it has proposed a conditional, European greenhouse gas emission reduction target of 40% below 1990 levels by 2030 (Dutch Government, 2011). The conditions relate to adequate global action and the adequate safeguarding of the competitiveness of European industry. To further elaborate these conditions, PBL has been asked to shed light on a number of questions, using its integrated assessment modelling framework for the analysis. These questions are dealt with one-by-one below, with a reference to the chapter in the full results in which more information can be found. The integrated modelling framework FAIR and computable general equilibrium model WorldScan were used for the analysis. These models use information on the potential and costs of reducing greenhouse gas emissions taken from the energy model TIMER, the land-use model IMAGE and the forestry model G4M. To analyse the uncertainty in
results, an analysis with abatement cost curves from the POLES energy model is included.
What are the expected trends in greenhouse gas
emissions without climate policy for the largest
economies up to 2030? (Chapter 2)
According to the most recent PBL baseline emission projection, global emissions will reach about 62 Gt CO2 eq
by 2030 (including CO2 emissions from land use), up from
49 Gt CO2 eq in 2010, if countries do not implement any
climate policies. About 60% of this increase will occur in China (5.5 Gt CO2 eq) and India (2.7 Gt CO2 eq), while
emissions in most developed countries are expected to remain more or less constant between 2010 and 2030.
What global emission level is needed by 2030 to
keep the 2 °C target within reach? To what extent
does the emission level in 2020 influence this level?
(Chapter 3)
There are multiple pathways towards achieving a 2 °C climate target, varying from early reductions in the short term to delayed action with deeper reductions in the long term. In the literature, most emission pathways towards achieving the 2 °C target have been developed from a lowest cost perspective over the century. However, the projected global emission level resulting from the greenhouse gas emission reductions pledged under the Cancún Agreements is higher than the level under the cost-optimal pathways towards achieving the 2 °C target. The emission level in 2020 strongly influences the emission level in 2030 consistent with 2 °C pathways. In a 2 °C cost-optimal pathway (defined as the pathway with the lowest discounted costs over the century), the global emission level by 2030 is about 41 Gt CO2 eq, which is
about 4% above the 1990 level and almost 25% below the 2010 level. With early action, the 2030 emission level could be 3 Gt CO2 eq lower. However, if the pledges for
2020 are taken into account the global emission level consistent with a 2 °C pathway would be about 4 Gt CO2
eq higher by 2030. This implies that a delay in emission reductions can only be compensated after 2030. Higher 2020 emission levels also imply higher costs throughout the century and a higher dependence on future technological developments, compared with a scenario with lower 2020 emission levels.
Very few studies have analysed the global emission level by 2030 consistent with 2 °C pathways that take into account the pledges made for 2020. We have therefore relied on the range given in the OECD Environmental Outlook, which does include such an emission pathway and was developed using PBL’s integrated assessment models. This would result in an emission range consistent with 2 °C of about 38 to 45 Gt CO2 eq by 2030.
9 Findings |
What kind of emission reduction targets would
other countries need to adopt according to
different effort-sharing regimes if the EU sets an
internal reduction target of 40% for 2030?
(Chapter 4)
To gain insight into the range of targets for other countries that would be comparable with the EU 40% reduction target we calculated emission reduction targets
for other countries based on three effort-sharing approaches. These approaches are based on either i) convergence in per-capita emissions by 2055 for the least developed countries (South Asia and Southeast Asia and sub-Saharan Africa) and by 2050 for all other countries; ii) an equal carbon tax by 2030, with regional convergence between 2020 and 2030; or iii) equal relative costs (as share of GDP) by 2030, also with regional convergence
Table S.1
Emission reduction targets relative to PBL baseline, 2030
Convergence in per-capita emissions (%)
Equal carbon tax (%) Equal relative costs (%)
Equal relative costs, 2 °C (%)
Announced targets1
(%) Relative to 2030 baseline levels:
EU -35 -35 -35 -43 USA -35 -38 -33 -43 Canada -41 -31 -26 -35 Oceania -43 -33 -28 -34 Japan -48 -40 -38 -48 Russia -27 -22 -14 -19 China -34 -27 -19 -25 India -16 -17 -13 -19 Indonesia -12 -21 -12 -19 Mexico -37 -35 -30 -39 -38* Brazil -35 -49 -32 -46 World -29 -28 -22 -28 Relative to 1990 levels: EU -40 -40 -40 -47 -41 – -45* USA -27 -31 -25 -37 -33 Canada -30 -17 -12 -22 -14 – -18 Oceania -22 -8 -1 -10 -1* Japan -45 -36 -34 -45 -36 – -43 Russia -49 -46 -41 -44 -33 China +163 +191 +225 +200 India +215 +210 +223 +203 Indonesia +51 +35 +52 +41 Mexico -9 -6 +2 -10 Brazil -15 -34 -11 -29 World +13 +14 +24 +13
Source: PBL FAIR/IMAGE/TIMER model calculations, and based on individual country assessments according to http://climateactiontracker. org/
1 Announced targets are either announced or adopted targets: adopted targets are denoted by a *. The United States is the only country that has announced
a target for 2030. Other countries have announced long-term targets for 2050; for these countries the implied reductions for 2030 are shown here, assuming that the targets for 2050 are reached linearly between 2020 and 2050, based on UNFCCC data (submission 2010) taken from http://unfccc.int/ ghg_data/ghg_data_unfccc/items/4146.php. The targets are excluding CO2 emissions from land use. See Annex B for more detail on announced long-term targets.
between 2020 and 2030. For the second and third approaches, the targets for the least developed regions are based on a tax or cost level that is 30% of that of the other countries.
Table S.1 shows the range of emission reduction targets resulting from these effort-sharing principles (in which the EU has a domestic reduction target of 40%). The regime based on equal relative costs leads to a global emission level by 2030 that is 4 to 11 Gt CO2 eq higher than
the range of a 2 °C pathway. Therefore, Table S.1 also gives reduction targets resulting from an equal relative
costs regime that limits the global emission level by 2030
to the maximum level consistent with a 2 °C pathway (called equal relative costs, 2 °C).
The emission reduction targets of the United States, India and Mexico are relatively independent of the choice of effort-sharing regime. For Canada, Oceania, China and Brazil, the range in reduction targets is relatively large. This is due to a much higher reduction target for Canada, Oceania and China resulting from a convergence in
per-capita emissions regime (due to the relatively high
per-capita emissions in these countries), and for Brazil under the equal carbon tax regime (due to the relatively high number of low-cost measures for reducing deforestation emissions).
What targets for 2030 for the EU and other
countries under a regime of equal costs as percentage
of GDP would be consistent with the 2 °C target?
(Chapter 4) How robust are these results?
(Chapter 6)
Table S.1 shows that for a regime of equal relative costs that would lead to a global emission level just within the range consistent with 2 °C (about 45 Gt CO2 eq), the target of the
EU would need to be 47% instead of 40% below 1990 levels. The reduction targets of such a regime would lie outside the range of the three default regimes for the United States and India (and just outside the range for Mexico). These targets are relatively robust for one alternative set of cost curves with corresponding baseline projection. Using data from POLES would lead to a reduction target for the EU of 45%, compared with 47% using FAIR data. Using POLES data also leads to less stringent targets for India (4% lower), Mexico (4% lower) and Japan (3% lower).
Could the range of reduction targets lead to i)
higher costs for richer countries, ii) similar costs
for countries with similar welfare levels, and/or iii)
countries profiting from climate policy, even when
the benefits of reduced climate change are not
taken into account? (Chapter 5)
Table S.2 shows the projected direct mitigation costs in 2030, as a percentage of GDP, of domestically achieving the targets given in Table S.1. The projected cost of achieving the EU 40% target is about 0.25% of GDP in 2030. This rises to almost 0.6% of GDP for the equal
relative costs, 2 °C regime, in which the EU has a reduction
Table S.2
Projected direct mitigation costs as share of GDP, 2030
Convergence in per-capita emissions (%)
Equal carbon tax (%) Equal relative costs (%) Equal relative costs, 2 °C (%) EU 0.24 0.24 0.25 0.57 USA 0.29 0.39 0.25 0.58 Canada 1.03 0.39 0.25 0.58 Oceania 1.07 0.48 0.25 0.57 Japan 0.51 0.28 0.25 0.58 Russia 1.57 0.75 0.25 0.57 China 1.58 0.74 0.25 0.57 India 0.13 0.14 0.07 0.17 Indonesia 0.09 0.25 0.07 0.17 Mexico 0.51 0.40 0.25 0.57 Brazil 0.27 0.82 0.25 0.57 World 0.66 0.43 0.23 0.53
11 Findings |
target of 47% below the 1990 level. This relatively large increase is due to only more expensive reduction measures being available for reductions of more than 40%. The differences in costs between regimes and countries mainly reflect the differences in the emission reduction targets.
The convergence in per-capita emissions regime shows the largest differences in costs between regions. For Russia and China, direct mitigation costs as share of GDP are even a factor of six to seven higher than those of the EU in this regime. This outcome is a result of a regime based on per-capita emissions not taking into account
circumstances such as mitigation potential. This potential is limited for Russia due to their large overcapacity in existing coal-fired power plants, which prevents the building of new, low-carbon power plants. The potential for reducing emissions is also limited for China: China has expanded its energy sector considerably with coal power plants in the past decade, which makes replacement of or adjustments to these investments very expensive, so that it is more difficult for China to move to low-carbon technologies.
Mitigation costs for Russia, China, India, Indonesia and Brazil are relatively high under an equal carbon tax regime. This is mainly because these regions have relatively high emission intensities (China, India and Russia) and/or a large potential for reducing land-use emissions (Brazil, Indonesia and Russia).
The reduction targets do not lead to higher costs for richer countries, for the reasons mentioned above. The projected welfare losses, which take into account indirect costs of mitigation policies, are also not necessarily higher for richer countries for the regimes analysed. Welfare losses are relatively high for fossil fuel exporting countries such as Russia. By definition, costs between countries are similar in an equal relative costs regime, but for the other regimes large differences in costs were found. As we have assumed that all targets are achieved through domestic emission reduction, we do not project that countries profit from climate policy.
How robust are the results for different
assumptions about baseline and cost curves?
(Chapter 6)
To test the robustness of the range of reduction targets and related costs found for the various countries we calculated emission reduction targets and mitigation costs based on cost curves from a different model (the POLES energy model). For regimes based on convergence in per-capita emissions and costs, the emission reduction targets and mitigation costs seem to be relatively robust for this different set of cost curves. For the equal carbon tax
regime, the targets and costs are not robust since the uncertainty in the carbon tax level needed to achieve the EU 40% target is substantial. Using the POLES cost curves would increase the carbon tax level to achieve the EU 40% target from USD 80/t CO2 to USD 150/t CO2. The
carbon tax level as found by FAIR is similar to the level found in the Roadmap 2050 study (European
Commission, 2011). The EU target for the equal relative cost,
2 °C regime is 45% below 1990 levels according to the POLES cost curves (compared with 47% using FAIR).
What are the expected carbon leakage and
economic effects if the EU decides to unilaterally
implement the 40% target? What are the effects if
all other countries are less ambitious than the EU?
(Chapter 5)
To analyse the carbon leakage and economic effects of EU unilateral action we included two scenarios. In both scenarios, the EU achieves its 40% reduction target by 2030. In one scenario, the rest of the world has no constraints on emissions (EU only). In the other scenario, the rest of the world reduces greenhouse gas emissions at levels of 50% of the reductions found in the convergence
in per-capita emissions regime, except for the least
developed regions (sub-Saharan Africa (excluding South Africa), South Asia and Southeast Asia (including India and Indonesia)) and the Middle East and northern Africa, which have no constraints on emissions (fragmented action).
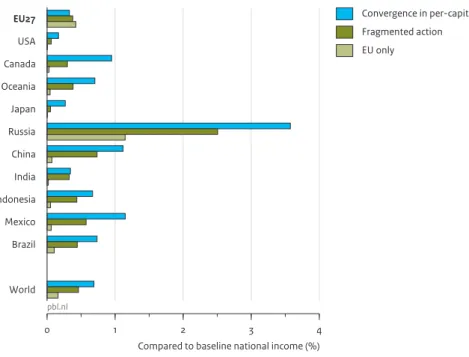
Figure S.1 shows the welfare effects of these scenarios compared with a global action scenario based on convergence in per-capita emissions. Welfare losses in 2030 for the EU are projected to increase from 0.3% with global action to 0.4% with EU unilateral action, but the impact of unilateral action may be much larger for specific sectors, notable for the energy-intensive industrial sector. Welfare losses for the EU in the convergence in
per-capita emissions regime are much lower than the world
average, as is also the case with direct mitigation costs. Even in the fragmented action scenario, the projected welfare losses for the EU are slightly lower than the world average. Relatively high welfare losses were found for Russia, also for the EU only case, as the EU climate policy reduces imports from Russia – an important trading partner.
Through indirect effects of climate policies in the EU, emissions in the rest of the world may increase (carbon leakage). This may happen i) as a result of lower world energy prices as the demand for energy in the EU decreases, leading to a higher demand for energy in the rest of the world, and ii) as a result of industry relocating from the EU to other regions. In the EU only scenario, we project that for each Mt CO2 eq reduction in the EU, an
increase in emissions of 0.3 Mt CO2 eq occurs in the rest of
the world. The major part of this carbon leakage is not due to the relocation of industry, but to lower energy prices. This means that the amount of carbon leakage strongly depends on how a change in energy demand influences energy prices. In the fragmented action scenario, in which more than 70% of global greenhouse gas emissions are capped, carbon leakage is limited to 6%.
How can carbon leakage and welfare effects be
mitigated? (Chapter 5)
Carbon border measures are often proposed as a way of protecting energy-intensive production sectors in countries with carbon costs against unfair competition from countries without carbon costs. To study the effect of such measures we imposed a levy on the import and a subsidy on the export of energy-intensive products at levels determined by the emissions associated with their production at the same price as faced by domestic producers.
Introducing border measures would have little effect, as they do not address the issue of decreasing energy prices
– the main cause of carbon leakage. Therefore, border measures are not effective in reducing carbon leakage. Border measures do however reduce the decline in energy-intensive production in the EU as the burden to reduce emissions is shifted to other sectors.
What are the co-benefits of a 40% reduction in
greenhouse gas emissions by 2030 for the EU?
(Chapter 5)
Emissions of greenhouse gases and air pollutants originate to a large extent from the same sources, namely from fossil-fuel combustion and agricultural activities. A reduction in air pollution yields health benefits by reducing mortality. The projected reduction in deaths associated with exposure to air pollution is about 3.5% by 2030, compared with the baseline level, resulting from a 17% reduction in total SO2, NOx and particulate matter
emissions, due to greenhouse gas mitigation, by 2030.
Figure S.1 EU27 USA Canada Oceania Japan Russia China India Indonesia Mexico Brazil World 0 1 2 3 4
Compared to baseline national income (%)
pbl.nl
Convergence in per-capita emissions Fragmented action
EU only
Welfare loss due to greenhouse gas reductions under 'fragmented action' and 'EU only' scenarios, 2030
Source: PBL WorldScan model.
Under the Fragmented action scenario, the EU achieves its 40% reduction target by 2030 and the rest of the world reduces greenhouse gas emissions at levels of 50% of the reductions found in the convergence in per-capita emissions regime, except for the least developed regions and the Middle East and northern Africa, which have no constraint on emissions
13 Findings |
FULL RESUL
TS
FULL RESUL
TS
ONE
Background and research
questions
The long-term Dutch and European climate policy targets focus on limiting global temperature change to 2 °C above pre-industrial levels. As part of the Cancún Agreements (UNFCCC, 2011c), the EU has made an unconditional pledge to reduce greenhouse gas emissions by 20% compared with 1990 levels by 2020, and a conditional pledge of 30%, under the precondition that other developed countries commit to comparable emission reductions and that more advanced developing countries contribute adequately according to their responsibilities and respective capabilities. For 2050, there is ‘an EU objective, in the context of necessary reductions according to the IPCC by developed countries as a group, to reduce emissions by 80–95% by 2050 compared to 1990’, as agreed in October 2009 (Council of the European Union, 2009; European Parliament, 2009) and reaffirmed by the European Council in February 2011. Some other developed countries have also announced long-term reduction targets (mainly for 2050, see www. climateactiontracker.org). For example, the United States announced a 42% emission reduction by 2030, compared with 2005 levels, in its Copenhagen Accord submission, which was reconfirmed in 2011 (UNFCCC, 2011a). Australia has adopted a reduction target for 2050 of 60% below 2000 levels. Mexico is the only developing country that has adopted a target for 2050 of 50% below 2000 levels. In the ‘Roadmap for moving to a competitive low-carbon economy in 2050’ (European Commission, 2011), the European Commission sets out a plan to meet the 80%
long-term target. It provides emission pathways towards 80% reduction in domestic emissions by 2050, which show cost-effective reductions by 2030 between 40% and 44% below 1990 levels. However, the EU has not yet decided on a greenhouse gas emission reduction target for 2030, and this is still under discussion1.
The Dutch Government has called for such a greenhouse gas emission reduction target for 2030. More specifically, it has proposed a conditional European greenhouse gas emission reduction target for 2030 of 40% below 1990 levels (Dutch Government, 2011). The conditions relate to adequate global action and the adequate safeguarding of the competitiveness of European industry. The adequacy of global action depends both on whether the 2 °C objective remains within reach and whether contributions made by other countries are reasonable compared with the EU 40% reduction target for 2030. Factors
determining whether or not the contributions of other countries are reasonable include their level of
development and emission reduction potential. A greater effort is expected from richer countries than from poorer countries, while countries with a similar level of
development would have to make a similar effort. To work out the conditions, a working group was established, including representatives of the Dutch Ministry of Foreign Affairs, Ministry of Economic Affairs, Agriculture and Innovation, Ministry of Finance and Ministry of Infrastructure and the Environment. This working group asked PBL a number of questions that
15 Background and research questions |
ONE ONE
should shed light on the conditions under which the EU could implement a greenhouse gas emission reduction target for 2030 of 40% below 1990 levels. PBL’s integrated assessment modelling framework IMAGE/TIMER/FAIR and WorldScan (Annex A) was used for the analysis. The research questions included:
• What are the expected trends in greenhouse gas emissions without climate policy for the largest economies up to 2030? (Chapter 2)
• What global emission level is needed by 2030 to keep the 2 °C target within reach? To what extent does the emission level in 2020 influence this level? (Chapter 3) • What kind of emission reduction targets would other
countries need to adopt according to different effort-sharing regimes if the EU sets an internal reduction target for 2030 of 40%? (Chapter 4) − Would this lead to higher costs for richer countries?
(Chapter 5);
− Would this lead to similar efforts/costs for countries with similar welfare levels? (Chapter 5);
− Would this lead to countries profiting from climate policy, even if the benefits of reduced climate change are not taken into account? (Chapter 5);
− How robust are the results for different assumptions about baseline and cost curves? (Chapter 6)
• What targets for 2030 for the EU and other countries, under a regime of equal costs as a percentage of GDP, would be consistent with the 2 °C target? (Chapter 4) How robust are these results? (Chapter 6)
• What are the expected carbon leakage and economic effects if the EU decides to implement the 40% target unilaterally? And what are the effects if all other countries are less ambitious than the EU? How can these effects be mitigated? (Chapter 5)
• What are the co-benefits of a 40% reduction in greenhouse gas emissions by 2030 for the EU? (Chapter 5)
Note
1 In June 2012, the EU Council had not yet reached full agreement, due to opposition from Poland. Other EU Member States supported the EU Council Presidency conclusions on a Roadmap for Moving to a Competitive Low-Carbon Economy in 2050, reading: ‘The Danish Presidency of the Council (…) recognises its finding that the EU‘s gradual, cost-effective transition to a low-carbon economy in 2050 passes through indicative milestones for EU domestic greenhouse gas emission reductions of 40% by 2030, 60% by 2040 and 80% by 2050 compared to 1990 as the basis for further work on the action needed to make the transition in a gradual, cost-effective way.’
TWO
Trends in greenhouse gas
emissions without climate
policies
The expected trends in greenhouse gas emission levels are based on two sources. CO2 emissions from land use,
for instance, as a result of deforestation, are based on the IIASA forestry model G4M (Kindermann et al., 2008; Kindermann et al., 2006). All other Kyoto greenhouse gas emission levels are based on the baseline developed by PBL and used in the OECD Environmental Outlook to 2050 (OECD, 2012). For this study, the baseline data were harmonised to 1990–2005 emissions from several data sources (Annex A.1 provides more detailed information on the methodology and datasets used in the
harmonisation procedure).
Both sources project emissions without future climate policies, which means that the pledges made in the Cancún Agreements are not taken into account. The main advantage of a baseline without climate policies is that all efforts to reduce greenhouse gas emissions are visible and that the costs of reducing greenhouse gas emissions include the costs of reaching the emission reduction targets of the 2020 pledges.
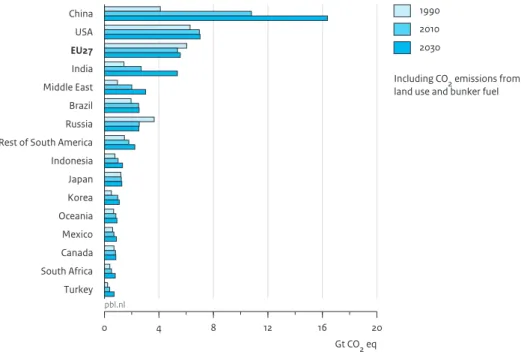
Based on the above two sources, Figure 2.1 shows the expected greenhouse gas emission levels by 2030, including CO2 emissions from land use, for the 16 largest
world regions in our model framework. The largest absolute increase in greenhouse gas emissions is expected for China and India, whereas emissions in most developed countries are projected to stabilise at 2010 levels. The projected global greenhouse gas emission level, including CO2 from land use, is 62 Gt CO2 eq for
2030, compared with 48 Gt CO2 eq in 2010. Of the total
2030 emissions, 25% is expected to originate in China. China, the United States, the EU, India, the Middle East, Russia and Brazil, together, are expected to account for two thirds of global emissions by 2030 – which is the same share as in 2010. This share does not increase, as one might expect due to the strongly increasing emissions in China and India, because emissions in the United States, the EU and Russia are projected to remain more or less constant, while emissions in most other parts of the world are projected to increase strongly. The following sections of the report present results for the EU and for the countries with the highest baseline emissions in 2030.
The emission intensity (greenhouse gas emissions as share of GDP) of a country is an indication of the extent to which GDP depends on greenhouse gas emitting
activities. A price on greenhouse gas emissions generally would more strongly affect countries with higher emission intensities. Figure 2.2 shows baseline emission intensities over time, relative to the global level. Emission intensities are expected to differ strongly by 2030 in the baseline, although the differences are smaller than is currently the case. In general, developed countries have lower emission intensities than developing countries. This is because high-income countries generally have larger low-carbon sectors, such as the service sector, and make use of relatively efficient technologies. Poorer countries have relatively large carbon-intensive sectors, such as heavy manufacturing. The emission intensities
17 Trends in greenhouse gas emissions without climate policies |
TWO TWO
shown are based on GDP figures measured in market exchange rates (MER); if GDP measured in Purchasing Power Parity were to be used, the differences between developing and industrialised countries would be smaller by almost a factor of two.
The emission intensity of the EU is expected to decrease by about 33% between 2010 and 2030 in the baseline – compared with a global reduction of 35%. The lowest emission intensity by 2030 is expected in Japan, followed by the EU. The projected emission intensity of the United States is about 40% higher than that of the EU. For Canada, it is 80% higher and for Oceania, the emission intensity by 2030 is projected at more than 2.5 times the level of the EU. The highest emission intensities are found in Russia, Indonesia, Brazil, India and China – all of which have projected emission intensities of more than four times the level of the EU by 2030 (with GDP measured in MER).
Another important indicator for comparing relative greenhouse gas emission levels between countries is per-capita emissions. Figure 2.3 shows that the highest levels for this indicator are expected in Oceania, Canada, the United States and Russia. For these countries, projections of per-capita emission levels range from 17 to 25 t CO2 eq
in 2030, compared with expected levels of 10 t CO2 eq for
the EU and less than 5 t CO2 eq for India and Indonesia.
Figure 2.1 China USA EU27 India Middle East Brazil Russia Rest of South America Indonesia Japan Korea Oceania Mexico Canada South Africa Turkey 0 4 8 12 16 20 Gt CO2 eq pbl.nl 1990 2010 2030
Including CO2 emissions from
land use and bunker fuel
Greenhouse gas emissions in the baseline
Source: Based on the OECD (2012) baseline but harmonised to 1990–2005 historical data (see Annex A.1) and including data on CO2 emissions
TWO
Figure 2.2 Russia Indonesia Brazil India China Oceania Canada Mexico USA EU27 Japan World 0 100 200 300 400Index (global greenhouse gas emissions per unit of GDP = 100)
pbl.nl
1990 2010 2030
Including CO2 emissions from
land use and bunker fuel
Emission intensities in the baseline
Source: Based on the OECD (2012) baseline but harmonised to 1990–2005 historical data (see Annex A.1) and including data on CO2 from land
19 Trends in greenhouse gas emissions without climate policies |
TWO TWO
Figure 2.3 Oceania Canada USA Russia Brazil China Japan EU27 Mexico Indonesia India World 0 5 10 15 20 25 30tonnes CO2 eq per capita
pbl.nl
1990 2010 2030
Including CO2 emissions from
land use and bunker fuel
Per-capita greenhouse gas emissions in the baseline
Source: Based on the OECD (2012) baseline but harmonised to 1990–2005 historical data (see Annex A.1) and including data on CO2 from land
THREE
Which global emission level
by 2030 would be
consistent with achieving
the 2 °C target?
A good indicator of the likelihood of limiting global temperature change to 2 °C above pre-industrial levels is the total in cumulative emissions over the 21st century (Allen et al., 2009; Meinshausen et al., 2009). Many studies have analysed emission pathways that would restrict cumulative emissions to such levels to have a medium or likely chance of limiting global warming to 2 °C. These studies have been summarised in the UNEP emission gap reports (UNEP, 2010, 2011) and Rogelj et al. (2011) and came up with a 2030 emission level ranging from 32 to 44 Gt CO2 eq for a medium likelihood (50% to
66%) of achieving the 2 °C climate goal. The range became 25 to 42 Gt CO2 eq in 2030 for a likely (more than
66%) chance of achieving the 2 °C climate goal. However, these studies did not restrict 2020 emission levels and technology availability, and they assumed the full participation of all countries in emission reduction from 2010 onwards. In reality, the global emission level in 2030 consistent with 2 °C pathways depends, among other things, on assumptions regarding the availability and implementation of future emission reduction
technologies and on the extent to which emissions are reduced in the short term.
3.1 Technology assumptions
There are several options that could result in a net removal of CO2 from the atmosphere. These include
reforestation and the use of bio-energy combined with carbon capture and storage (BECCS). The question of
whether such technologies (BECCS in particular) could be used on a large scale in the long term plays an important role in determining shorter term emission reduction targets. If such technologies were to be applied in the long term, this would allow for higher emission levels early in the century. The use of BECCS not only depends on the physical potential for applying carbon capture and storage and biofuels (each with its own uncertainties), but also on the societal acceptance of these technologies (Johnsson et al., 2010).
In this study, we have assumed that BECCS will become available and will be widely applied later in the century. Without BECCS, it would become very difficult in our model to maintain a reasonable chance of limiting global warming to 2 °C, especially when taking into account the greenhouse gas emission reductions pledged for 2020 (Van Vliet et al., 2012).
3.2 Assumptions on short-term
emission reductions
With regard to short-term emission reductions, the greenhouse gas emission reductions pledged for 2020 as put forward by countries in the Cancún Agreements are important. The starting point of the analysis in this study was the implementation of a low pledge scenario by 2020. For most countries, these are unconditional pledges. However, for countries that have made a
21 Which global emission level by 2030 would be consistent with achieving the 2 °C target? |
THREE THREE
conditional pledge only, such as Canada, Japan and the United States, we have assumed that this pledge holds, which is similar to what is assumed by the UNFCCC (2011b). The calculated emission levels resulting from the submitted pledges and mitigation action plans for the developed and developing countries were calculated based on Den Elzen et al. (2012; also see Annex B). Studies that optimise emission pathways for 2 °C from 2010 to 2100 find lower emission levels by 2020 than those analysing pathways based on the pledges (OECD, 2012; Van Vliet et al., 2012). The OECD Environmental Outlook to 2050 (OECD, 2012) analyses different emission pathways that stabilise greenhouse gas concentrations at 450 ppm CO2 eq, which would give a chance of 40% to
60% of limiting global temperature change to 2 °C (Meinshausen et al., 2006; Meinshausen et al., 2009). These pathways were created by the same model framework as used in this analysis. One of these
pathways, 450 Delayed Action, assumes an emission level for 2020 of 50.3 Gt CO2 eq, as a result of the pledges.
Another pathway, 450 Core, optimises the timing of emission reductions from 2010 onwards, which would lead to an emission level of 48.1 Gt CO2 eq by 2020. In the
third pathway, 450 Accelerated Action, early action is taken, leading to a global emission level of 46.2 Gt CO2 eq
by 2020. To arrive at the same greenhouse gas
concentration goal, emissions in the 450 Delayed Action pathway would have to be reduced faster after 2020 compared with under the pathways 450 Core and 450 Accelerated Action. However, this can only be realised later in the century, due to inertia in the energy system.
For instance, delayed action would lead to more coal-fired power plants being built up to 2020, which creates a lock-in effect (the OECD Environmental Outlook assumes – as this study does for calculating costs – that newly built power plants are not immediately replaced with low-carbon alternatives, but will continue to be used for another 40 years). Therefore, higher emission levels by 2020 also imply higher levels by 2030. Not until 2040 will emission levels in the 450 Delayed Action pathway drop below those of the 450 Core pathway (Figure 3.1). The OECD Environmental Outlook to 2050 is one of the very few studies to include an emission pathway consistent with the 2 °C target which starts in 2020 at an emission level resulting from the pledges. This pathway leads to a global emission level of 45.1 Gt CO2 eq in the
OECD 450 Delayed Action scenario, compared with 41 Gt CO2 eq in the 450 Core scenario and 38.1 Gt CO2 eq in the
450 Accelerated Action scenario. As this study used the same model framework as was used to create these emission pathways, the assumption has been made that the emission level consistent with 2 °C lies between 38.1 and 45.1 Gt CO2 eq by 2030. It should be kept in mind,
however, that the high end of this range implies higher costs throughout the century and a higher dependence on future technological developments, compared with a scenario with lower 2020 emission levels.
Figuur 3.1 2000 2010 2020 2030 2040 2050 0 10 20 30 40 50 60 Gt CO2 eq pb l.n l 450 Delayed action 450 Core (optimal action)
Including CO2 emissions from
land use and bunker fuel
Greenhouse gas emission pathways for 450 ppm CO2 eq
FOUR
Effort-sharing and
reduction targets
This chapter explores the types of emission reduction targets the major economies would face under different effort-sharing regimes. The analysis takes a slightly different approach to common effort-sharing analyses (Figure 4.1). Usually, effort-sharing approaches start from a global emission target or emission reduction target, after which emissions (or emission reductions) are allocated according to a certain principle. In this analysis, the starting point is the 40% emission reduction target to be achieved within the EU by 2030. Based on this EU target, emissions or emission reductions were allocated to other regions according to several effort-sharing regimes. This implies that the global emission level is an outcome, not the starting point, of the analysis. Therefore, this chapter also deals with the question whether the global emission level in 2030 resulting from the effort-sharing regimes is consistent with an emission pathway that limits global warming to 2 °C.
4.1 Assumptions for emission
reductions by 2020
The effort-sharing regimes start in 2020 from the level of a low-pledge scenario. In this scenario, the EU reduces its greenhouse gas emissions by 20% and all other regions implement their least ambitious pledge (if countries only have one conditional pledge, they implement that pledge – see Annex B). As the reductions resulting from the pledges influence the targets for 2030 that would be
required to keep the 2 °C target within reach, Figure 4.2 shows by how much emissions would need to be reduced relative to our baseline emission levels. The pledges lead to relatively large reductions in emissions relative to the baseline for Japan, Oceania, Canada and Mexico. For Russia, India and Indonesia, the pledges are not expected to lead to emission reductions, relative to our baseline.
4.2 Description of effort-sharing
regimes
Given the proposed EU 40% emission reduction target for 2030, emission reductions or limitations for the other world regions were calculated based on three regimes, all differentiated according to economic development: 1. convergence in per-capita emissions by 2050 or 2055; 2. equal carbon tax by 2030;
3. equal mitigation costs as percentage of GDP by 2030.
Convergence in per-capita emissions
Under this regime, based on the work by Höhne et al. (2006), per-capita emission allowances of countries converge over time. In this study, we assumed
convergence between 2020 and 2050 for all but the least developed countries. In the least developed countries (sub-Saharan Africa (excluding South Africa), South Asia and Southeast Asia (including India and Indonesia)), we assumed convergence between 2025 and 2055. Until 2025, the least developed countries can follow baseline
23 Effort-sharing and reduction targets |
FOUR FOUR
Figure 4.1
Effort-sharing approach used in this study
Common effort-sharing approach
Starting point Analysis End result
Effort-sharing approach in this study
Global target EU target Effort-sharing regime Regional targets Effort-sharing regime Regional targets Global target pbl.nl Source: PBL Figure 4.2 Japan Oceania Canada Mexico Brazil EU27 USA China Russia India Indonesia 0 10 20 30 40 Compared to PBL baseline (%) pbl.nl
Including CO2 emissions from
land use and bunker fuel
Greenhouse gas emission reductions resulting from pledges, 2020
Source: Based on Den Elzen et al. (2012) and PBL FAIR/IMAGE/TIMER model calculations. The pledges by Russia, India and China are projected not to lead to reductions relative to our baseline. For Japan, a 25% reduction relative to 1990 levels is assumed, although there are
indications that Japan will set a new, less ambitious target (Masaki, 2012).
The integrated modelling framework FAIR was used for the analysis. This model uses information on the potential and costs of reducing greenhouse gas emissions from the energy model TIMER, the land-use model IMAGE and the forestry model G4M. To analyse the uncertainty in results, we included an analysis with abatement cost curves from the POLES energy model (see Chapter 6).
FOUR
emissions. The level of per-capita emissions to which all countries are assumed to converge by 2050 or 2055 is 2.3 tonnes CO2 eq, while the starting levels in 2020 were
determined from the pledges. The convergence level was calculated by assuming a linear decreasing trend in EU per-capita emissions towards 2050, consistent with a 20% target in 2020 and a 40% target by 2030. For 2050, such a regime would lead to a reduction in the EU of about 80% in 2050. All regions were required to reach their 2030 emission reduction targets through domestic emission reduction (no purchasing of emission credits was allowed). Only Canada, the Middle East, Japan and Oceania were allowed to achieve a maximum of 5% of their reduction relative to the baseline by buying emission credits – otherwise these regions would not be able to achieve their 2030 targets according to the reduction potential assumed in our model.
Equal carbon tax
Under this regime, marginal costs converge from their 2020 pledge levels to a common level in 2030 in all countries except for those that are least developed. Based on Figure 10 of the EU roadmap (European Commission, 2011), we assumed that the least developed regions converge to a marginal cost level of 30% of the common level. This common level was determined using the expected marginal costs for reaching the EU target of 40% domestic greenhouse gas emission reduction. In our model, these costs amount to USD 80/t CO2 eq. For a
comparable emission reduction level, the EU roadmap (European Commission, 2011) found marginal costs of USD 60/t CO2 eq. One reason for the higher costs found in
this study could be that we assumed lower emission reductions by 2020 (20% below 1990 levels) than the EU Roadmap (25% below 1990 levels). As higher short-term emission reductions decrease future costs by avoiding lock-in effects and learning-by-doing, the difference in emission reductions by 2020 could partly explain the difference in marginal costs by 2030 found between the EU Roadmap and this study. In fact, starting from the EU 30% high pledge in 2020 would decrease the marginal costs in 2030 for achieving the 40% target to USD 60/t CO2 eq. Another reason is that greenhouse gas emissions
decline more strongly in the EU roadmap baseline than in our baseline, which makes it cheaper to reach a certain target in the EU Roadmap study.
Equal relative costs
This regime is similar to the equal carbon tax regime, but instead of marginal costs, costs as share of GDP converge from their 2020 pledge levels to a common level in 2030. The common level was again determined using the expected direct cost of achieving the EU 40% domestic greenhouse gas emission reduction target, which would be 0.25% of GDP by 2030 according to our model. The
least developed regions were also assumed to converge to a cost level of 30% of the level of other regions in this regime.
4.3 Equity principles
The above regimes are each based on different fairness principles (Text Box 1). The idea behind convergence in per-capita emissions is that each person has the right to an equal amount of emissions. It also takes into account current emission levels by allocating emission rights to nations based on their emissions per-capita levels in the starting year of the regime. In the convergence year, emission allowances are allocated in such a way that each country has the same per-capita emission allowances. Therefore, this approach is a combination of the egalitarian, sovereignty and acquired-rights principles. A carbon tax is based on the responsibility principle: the impact of a carbon tax is high for countries with high emission levels or with a large potential to reduce emissions (Hof et al., 2009). A carbon tax has the advantage that, in a perfect world, emissions are reduced wherever it is cheapest to do so. However, as the burden of a carbon tax tends to fall on those regions with high emission intensities or with a large potential to reduce emissions, less developed countries are in general affected more than developed countries. Moreover, a carbon tax only takes into account current responsibility; if historical responsibility were to be taken into account less developed countries would in general be allocated more emission rights. To reduce the burden on the least developed regions, the carbon tax on these regions was set at 30% of the other regions (based on European Commission, 2011).
The allocation of emissions according to equal relative costs is based on the capability principle. Compared with
convergence in per-capita emissions, it better takes into
account the fact that some regions have less potential for reducing emissions and therefore should have less stringent targets.
4.4 Emission reduction targets
Table 4.1 (and Annex C in more detail) shows the emission reduction targets resulting from the three regimes. All the targets include the option to reduce CO2 emissions by
land-use measures such as reducing deforestation (see Text Box 2). An interesting observation is that all countries have the lowest reduction target in the equal
relative costs regime. This is the result of the relatively low
25 Effort-sharing and reduction targets |
FOUR FOUR
Text Box 1. Equity principles
A typology of four key equity principles was developed by Den Elzen et al. (2003) to characterise the various differentiation approaches of post-2012 commitments proposed in the literature and international climate negotiations:
(1) Egalitarian: all human beings have equal rights in the ‘use’ of the atmosphere.
(2) Sovereignty and acquired rights: all countries have a right to use the atmosphere and current emissions constitute a ‘status quo right’.
(3) Responsibility/polluter pays: the greater the contribution to the problem, the greater the share of the user in the mitigation/economic burden.
(4) Capability: the greater the capacity to act or ability to pay, the greater the share in the mitigation/economic burden. Capability, here, refers to countries’ ability to pay as well as to their mitigation opportunities. Mitigation opportunities are not identical to mitigation capabilities: while a country may possess many opportunities for taking relatively cost-effective abatement measures, its actual capability to take these measures may be severely limited due to technological, institutional and/or financial constraints
Text Box 2. Reducing CO
2emissions from land use
Activities to reduce CO2 emissions from land use – afforestation, reforestation, forest management and reducing
deforestation – can be used to help achieve the emission reduction targets. For 2030, we assumed that the potential for reducing CO2 emissions from land-use activities will be fully used, both for developed and
developing regions. As this potential is often less expensive than reducing emissions in other sectors, the relative reductions outside land-use activities are generally smaller than the targets given in Table 4.1. Figure 4.3 compares the total targets of the convergence in per-capita emissions regime with the reductions achieved outside the land-use sector. For all regions, but especially for Brazil, Indonesia, Oceania and Russia, CO2 emissions from
land use are reduced more than the average reductions in all sectors.
Figure 4.3 EU27 USA Canada Oceania Japan Russia China India Indonesia Mexico Brazil World 0 10 20 30 40 50 Compared to baseline (%) pbl.nl
Excluding land use Including land use
Greenhouse gas emission reductions under the 'convergence in per-capita emissions' regime, 2030
FOUR
(0.25% of GDP). As all countries converge to the EU cost level, their associated reduction targets are relatively low. The main reason that a convergence in per-capita emissions regime leads to higher global reductions than an equal relative costs regime is that per-capita emissions of the EU are low compared with countries such as the United States, Canada, Russia and Oceania. As every country converges to the same per-capita emissions level, countries with high per-capita emissions need to reduce more to achieve their target, leading to higher total reductions.
An important reason why an equal carbon tax regime leads to higher reductions than an equal relative costs regime is that the EU is projected to have the second lowest emission intensity in 2030 (after Japan) in the baseline (Figure 2.2). Countries with high emission intensities, such as China, India, Indonesia and Brazil, show relatively high reductions under a carbon tax.
Figure 4.4 compares the expected 2030 global emission level in the baseline and the regimes with the range consistent with limiting temperature change to 2 °C according to the OECD Environmental Outlook (see Chapter 3). In the baseline, emissions are projected to be 18–24 Gt CO2 eq above the emission range consistent with
2 °C. In the convergence in per-capita emissions and equal
carbon tax regimes, the global emission levels are just
within this range. As reductions in the equal relative costs regime are less than in the other regimes, the global emission level in this regime is higher and is still 4–10 Gt CO2 eq above the range consistent with 2 °C. We therefore
also added a scenario that leads to a global emission level in 2030 that is just within the range consistent with 2 °C with equal relative costs by 2030 (equal relative costs,
2 °C).
Table 4.2 shows the range of emission reduction targets resulting from the three default regimes (in which the EU has a reduction target of 40%), together with the equal
relative costs, 2 °C regime. The reductions are given relative
As the targets for 2030 include CO2 emissions from land use, credits or debits for reducing these emissions are
not relevant after 2020. For achieving the pledges for 2020, we assumed that developed countries are granted the minimum number of land-use credits or debits according to Grassi et al. (2012), except for Canada, the United States and Oceania (see Annex A.2 for details). Finally, we assumed that the EU does not use land-use credits to achieve the 20% reduction pledge for 2020.
Table 4.1
Emission reduction targets for 2030 for different effort-sharing regimes and a 40% greenhouse gas emission reduction target below 1990 levels for the EU
Convergence in per-capita emissions (%)
Equal carbon tax (%) Equal relative costs (%)
Relative to: baseline 1990 2010 baseline 1990 2010 baseline 1990 2010
EU -35 -40 -32 -35 -40 -32 -35 -40 -32 USA -35 -27 -34 -38 -31 -37 -33 -25 -32 Canada -41 -30 -39 -31 -17 -29 -26 -12 -24 Oceania -43 -22 -27 -33 -8 -14 -28 -1 -8 Japan -48 -45 -41 -40 -36 -31 -38 -34 -29 Russia -27 -49 -28 -22 -46 -23 -14 -41 -15 China -34 +163 0 -27 +191 +11 -19 +225 +24 India -16 +215 +68 -17 +210 +65 -13 +223 +72 Indonesia -12 +51 +16 -21 +35 +4 -12 +52 +17 Mexico -37 -9 -21 -35 -6 -18 -30 +2 -12 Brazil -35 -15 -34 -49 -34 -48 -32 -11 -30 World -29 +13 -8 -28 +14 -6 -22 +24 +1
27 Effort-sharing and reduction targets |
FOUR FOUR
Figure 4.4
Baseline Convergence in per-capita emissions Equal carbon tax Equal relative costs Equal relative costs, 2 °C 0 20 40 60 80 Gt CO2 eq pbl.nl Emissions 2 °C range
Including CO2 emissions from
land use and bunker fuel
Global greenhouse gas emissions, 2030
Source: PBL FAIR/IMAGE/TIMER model calculations and OECD (2012)
Table 4.2
Range of emission reduction targets, based on three regimes and a 40% greenhouse gas emission reduction target below 1990 levels for the EU, compared with an equal relative costs, 2 °C regime and announced targets
Range based on regimes (%) Equal relative costs, 2 °C (%) Announced targets1 (%) Below 1990 levels: EU 40 47 41–45* USA 25–31 37 33 Canada 12–30 22 14–18 Oceania 1–22 10 1* Japan 34–45 45 36–43 Russia 41–49 44 33
Below baseline levels2:
China 19–34 25 India 13–17 19 Indonesia 12–21 19 Mexico 30–37 39 38* Brazil 32–49 46 World 22–29 28
Source: PBL FAIR/IMAGE/TIMER model calculations and based on individual country assessments by http://climateactiontracker.org/. 1 Announced targets are either announced or adopted targets: adopted targets are denoted by a *. The United States is the only country that has announced
a target for 2030. Other countries have announced long-term targets for 2050; for these countries the implied reductions for 2030 are shown here, assuming that the targets for 2050 are reached linearly between 2020 and 2050, based on UNFCCC data (submission 2010) taken from http://unfccc.int/ ghg_data/ghg_data_unfccc/items/4146.php. The targets are excluding CO2 emissions from land use. See Annex B for more detail on announced long-term targets.
2 Emission reduction targets are expressed relative to 1990 emission levels for developed countries because the EU 40% target is expressed relative to 1990
levels as well. Emissions in developing countries generally show a strongly increasing trend (see Figure 1); therefore emission reductions are shown relative to projected baseline levels.
FOUR
to 1990 for developed countries and against baseline levels for developing countries. It should be noted that the low range of the targets – which are the targets resulting from the equal relative costs regime – lead to a global emission level by 2030 above the range consistent with 2 °C. The emission reduction targets of the United States, India and Mexico are relatively insensitive to the effort-sharing regime. For Canada, Oceania, China and Brazil, the range in emission reduction targets is relatively large. This is due to the much higher target for Canada, Oceania and China under the convergence in per-capita
emissions regime and for Brazil under the equal carbon tax
regime.
The table also shows that in the equal relative costs, 2 °C regime the 2030 target of the EU would be 47% instead of 40% below 1990 levels. The target of such a regime would lie outside the range of the three default regimes for the United States and India (and just outside the range for Mexico).
Some countries have announced long-term greenhouse gas emission reduction targets for the year 2030 or 2050 (Annex B). For these countries, the implied or adopted reduction targets for 2030 are also presented in Table 4.2. Interestingly, most implied or adopted emission
reduction targets are within the range resulting from the combination of a 40% EU target with the effort-sharing regimes included in this study. The only exception is Russia, which announced a target of 50% below 1990 levels by 2050 (note that the 2010 emission level of Russia is about 30% lower than its 1990 emission level).
29 Effort-sharing and reduction targets |
FIVE
Mitigation costs and
welfare effects
This chapter provides the projected direct mitigation costs and welfare effects resulting from achieving the mitigation targets found in Chapter 4 (see Text Box 3 for the difference between direct mitigation costs and welfare effects and Annex A for a description of the methodology used to calculate mitigation costs and welfare effects). We also present welfare effects and carbon leakage resulting from simulations in which Europe unilaterally reduces emissions or other world regions reduce emissions to a lesser degree than the ranges found in the previous chapter.
5.1 Mitigation costs
Table 5.1 shows the direct mitigation costs in 2030 resulting from the regimes. The projected cost of achieving the EU 40% target is about 0.25% of GDP in 2030. The costs in 2030 depend on how much emissions are reduced by in 2020. If the EU conditional high pledge of 30% reduction by 2020 were to be implemented, this would reduce the cost – due to learning-by-doing and avoiding lock-in effects – to 0.2% of GDP in 2030. The differences in costs between regimes and countries mainly reflect the differences in the emission reduction targets as shown in Table 4.1. As the emission intensities (including CO2 emissions from land use) of Russia, China,
India, Indonesia and Brazil are projected to be at least a factor of four higher than that of the EU (see Figure 2.2), these regions show high mitigation costs for the equal
carbon tax regime compared with an equal relative costs
regime.
The convergence in per-capita emissions regime shows the largest differences in costs between regions. For Russia and China, direct mitigation costs as a share of GDP are even a factor of six to seven higher than those of the EU in this regime. This outcome is a result of a regime based on per-capita emissions, not taking into account
circumstances such as mitigation potential. This potential is limited for Russia due to the large overcapacity in historically-built coal-fired power plants, which prevents the building of new, low-carbon power plants. The potential for reducing emissions is also limited in China: China has expanded its energy sector considerably with coal power plants in the past decade, which makes replacement of or adjustments to these investments very expensive, so that it is more difficult for China to move to low-carbon technologies.
The global mitigation cost is higher in the convergence in
per-capita emissions regime (0.7% of GDP in 2030) than in
the equal carbon tax regime (0.4%), as in the latter regime emissions are reduced wherever it is cheapest to do so. The global mitigation cost is lower in the equal relative costs regime as global emission reductions are less (Figure 4.4). To reach similar reductions in the equal relative costs regime, mitigation costs would increase more than two-fold (allowing emission trading in such a scenario would somewhat reduce the costs, but would still lead to mitigation costs of close to 0.5% for the EU and for the
31 Mitigation costs and welfare effects |
FIVE FIVE
world as a whole). The strong increase in mitigation costs resulting from moving from a 40% to a 47% reduction in emissions indicates that, beyond 40%, emission reduction measures start to become increasingly expensive.
The reduction targets do not lead to higher costs for richer countries, for the reasons mentioned above. By definition, costs between countries are similar in an equal
relative costs regime, but large differences in costs are
found for the other regimes. As we have assumed that all targets are achieved through domestic emission reduction, we do not project that countries will profit from emissions trading. However, even if emissions trading were allowed, we project that the benefits of
emissions trading would outweigh the costs of reducing emissions in almost none of the regions (only the least developed countries may have a very small net benefit resulting from the regimes).
5.2 Welfare effects, global action
Direct mitigation costs are an indication of the investments required to reduce greenhouse gas emissions. Direct cost calculations, however, do not account for the indirect effects that may occur through various propagation mechanisms in the economy. Analysing the indirect effects of climate policies requires a model with an economy-wide perspective, taking into
Text Box 3. Direct mitigation costs versus welfare effects
Different types of models were used to estimate the costs of climate policy. Partial equilibrium models, such as the FAIR model used for the mitigation cost calculations, focus on the competition between different
technologies for meeting the demand for goods and services. Such models derive cost estimates from the detailed description of the energy and land-use systems. In contrast, general equilibrium models, such as the WorldScan model used for the welfare effect calculations, focus on the economy as a whole and the interactions between the various sectors. These models do not focus on direct costs, but on changes in economic production and consumption levels or welfare. Both types of models have their strengths and weaknesses. The direct mitigation costs calculated by partial equilibrium models can be determined relatively straightforwardly as a first order estimate of the investments required for mitigation, but neglect the fact that, by changing prices, indirect effects may occur in the economy. For instance, reducing emissions is likely to lead to a shift in consumption and production from carbon-intensive goods and services to those that are less carbon-intensive and reductions in fossil-fuel use will lead to losses in export revenues for fossil-fuel exporters.
Table 5.1
Projected direct mitigation costs as share of GDP, 2030
Convergence in per-capita emissions (%)
Equal carbon tax (%)
Equal relative costs (%)
Equal relative costs, 2°C (%) EU 0.24 0.24 0.25 0.57 USA 0.29 0.39 0.25 0.58 Canada 1.03 0.39 0.25 0.58 Oceania 1.07 0.48 0.25 0.57 Japan 0.51 0.28 0.25 0.58 Russia 1.57 0.75 0.25 0.57 China 1.58 0.74 0.25 0.57 India 0.13 0.14 0.07 0.17 Indonesia 0.09 0.25 0.07 0.17 Mexico 0.51 0.40 0.25 0.57 Brazil 0.27 0.82 0.25 0.57 World 0.66 0.43 0.23 0.53