Risk Assessment of Ochratoxin A in the
Netherlands
M. Bakker, M.N. Pieters
This investigation has been performed by order and for the account of the Inspectorate for Health Protection and Veterinary Public Health, within the framework of project 388802, Natural Toxins.
Abstract
Ochratoxin A is a mycotoxin present in several food products. The intake of ochractoxin A in the Dutch population has been estimated in a probabilistic exposure assessment, using data on concentrations of ochratoxin A in different food products combined with the consumption rate of these products. From the results summarized here, cereals were found to be the main contributors (55%) to the total ochratoxin A intake. Since the 99th percentile of the lifelong-averaged intake (28 ng/kg bw/week) is considerably lower than the provisional tolerable weekly intake (100 ng/kg bw/week), the current dietary intake of ochratoxin A in the Netherlands is concluded to pose no health risk.
Contents
Samenvatting 4
Summary 5
1 Toxicology of ochratoxin A 6
1.1 Introduction 6
1.2 Chemistry and effects of processing 6
1.3 Absorption, distribution, metabolism and excretion 7
1.4 Toxicological studies 7
1.5 Observations in humans 8
1.6 Derivation of a PTWI by JECFA 8
1.7 Regulatory concentration limits for ochratoxin A in food products 9
2 Dietary intake of ochratoxin A 10
2.1 Ochratoxin A concentrations in different food groups 10
2.2 Concentration in individual food products 11
2.3 Calculation of dietary intake 12
2.4 Uncertainty in the calculated intake 13
2.5 Comparison with other studies 14
2.6 Statistical analysis and modelling 15
3. Risk Assessment of ochratoxin A in the Netherlands 17
4. Conclusions 18
References 19
Appendix 1 Derivation of mean ochratoxin A concentrations in different food groups 21
Samenvatting
Ochratoxine A is een mycotoxine dat door verschillende fungi van de Aspergillus of
Penicillium families geproduceerd wordt en is aanwezig op een groot aantal
voedingsmiddelen. Ochratoxine A is met name nefrotoxisch en veroorzaakt niertumoren. Ochratoxine A wordt als niet-genotoxisch beschouwd. Aangezien het meest gevoelige effect van ochratoxine A niertoxiciteit is, is een voorlopige toelaatbare wekelijkse inname, gebaseerd op niertoxiciteit in varkens, recentelijk door het Joint FAO/WHO Expert Committee on Food Additives vastgesteld op 100 ng/kg lichaamsgewicht/week.
In dit rapport is de inname van ochratoxine A in de Nederlandse populatie op probabilistische wijze geschat door de voedselconsumptiegegevens te combineren met de ochratoxine A concentraties in voedingsmiddelen. In Nederland wordt ochratoxine A voornamelijk (55%) via granen ingenomen. De gemiddelde dagelijkse inname van ochratoxine A, berekend door de ochratoxine A concentraties in voedingsmiddelen te vermenigvuldigen met de gemiddelde consumptie van deze voedingsmiddelen, is 59 ng/dag (1,0 ng/kg lichaamsgewicht/dag). Aangezien het 99ste percentiel van de levenslang-gemiddelde inname (28 ng/kg lichaamsgewicht/week) beduidend lager is dan de voorlopige toelaatbare wekelijkse inname (100 ng/kg lichaamsgewicht/week), wordt geconcludeerd dat er geen gezondheidsrisico is met betrekking tot de huidige inname van ochratoxine A.
Summary
Ochratoxin A (OTA) is a mycotoxin produced by several fungi of the Aspergillus or
Penicillium families and present on a large variety of food products. OTA is particularly
nephrotoxic and causes kidney tumours. OTA was considered not genotoxic. As the most sensitive toxic effect of OTA is nephrotoxicity, a provisional tolerable weekly intake (PTWI), based on the renal malfunction in pigs, has recently been established at 100 ng/kg bw/week. In this report data the intake of OTA in the Dutch population was estimated in a probabilistic exposure assessment by combining food consumption data with data on OTA concentrations in food products. In the Netherlands the intake of OTA occurs mainly (55%) via the intake of cereals. The average daily intake of OTA, calculated by multiplying the OTA concentrations in food products with the average intake of these food products, is 59 ng/day (1.0 ng/kg bodyweight/day). Since the 99th percentile of the lifelong-averaged intake (28 ng/kg bw/week) is considerably lower than the PTWI (100 ng/kg bw/week), it is concluded that there is no health risk from the current dietary intake of OTA.
1 Toxicology of ochratoxin A
11.1 Introduction
Ochratoxin A (OTA) is a mycotoxin produced by several fungi fungi of the Aspergillus or
Penicillium families. In warm regions, peanuts and soy beans are the main substrates for Aspergillus ochraceus. This fungus is found sporadically in a wide range of stored food
commodities, including cereals, but is seldom the cause of substantial concentrations of OTA. It may also infect coffee beans during sun-drying and is a source of OTA in green coffee beans.
In temperate climates (below 30°C and down to 0.8 water activity) OTA is produced most notably by Penicillium verrucosum with maize, wheat and barley as the main substrates. Infection has been shown to occur pre-harvest and post-harvest, but post-harvest OTA formation is regarded as the predominant factor of OTA formation in food. As cereals are widely used in animal feeds in Europe, and OTA is relatively stable in vivo, this mycotoxin is also found in some animal products in that region, especially pig kidney and liver.
A. carbonarius grows at high temperatures and is associated with maturing fruits, especially
grapes. Because of its black spores, it is highly resistant to sunlight, and survives sun-drying. It is the source of OTA in fresh grapes, in dried vine fruits and wine; it is also one source of OTA in coffee.
1.2 Chemistry and effects of processing
OTA consists of a chlorinated dihydroisocoumarin moiety linked through a 7-carboxyl group by an amide bond to one molecule of L-ß-phenylalanine (Fig. 1).
Figure 1. Structure of ochratoxin A
OTA is relatively stable and is only partially degraded under normal cooking or processing conditions. Milling has been reported to substantially reduce the concentration of OTA in white flour, but it has little effect on levels in wholemeal flour. Milling is a physical process: the OTA removed from the grain in the production of white flour remains in bran and other fractions, some of which may be used in foods. OTA is relatively stable to heat: at 100°C, a 50% reduction in the concentration was achieved after 2.3 h in wet wheat and 12 h in dry
1
The text of this chapter is based on the report of the 56th meeting of the JECFA (2001). N H O COOH O OH Cl O H CH3 Ochratoxin A
wheat. The process involved in the manufacture of breakfast cereals and biscuits resulted in substantial reductions in ochratoxin content, but little or no reduction was found in the manufacture of egg noodles and pasta. Decaffeination of coffee reduces the ochratoxin concentration by about 90%. The reduction obtained by roasting coffee varies but may also be as much as 90%. OTA survives most food processing stages such as cooking, roasting, fermenting to an appreciable degree and OTA can be detected in manufactured food products.
1.3 Absorption, distribution, metabolism and excretion
OTA is slowly absorbed from the gastrointestinal tract. Distribution in a number of species is via blood, mainly to the kidneys, lower concentrations being found in liver, muscle and fat. Transfer to milk has been demonstrated in rats, rabbits and humans, but little is transferred to the milk of ruminants owing to metabolism of OTA by the rumen microflora. OTA is only partly metabolized, most OTA is excreted unchanged. The major metabolite of OTA in all species examined is ochratoxin alpha. This and minor metabolites that have been identified are all reported to be less toxic than OTA itself. OTA is excreted in urine and faeces and the relative contribution of each of these excretory routes in different species is influenced by the extent of the enterohepatic recirculation of OTA and its binding to serum macromolecules. These factors are also important in the determination of the serum half-life of OTA, which varies widely among species. OTA has a long half-life in non-ruminant mammals, e.g. 24-39 h in mice, 55-120 h in rats, 72-120 h in pigs, 510 h in one macaque and 840 h in a human volunteer.
1.4 Toxicological studies
OTA has been shown to be nephrotoxic in all mammalian species tested. The main target is the renal proximal tubule, where it exerts cytotoxic and carcinogenic effects. Significant sex and species differences in sensitivity to nephrotoxicity were evident, in the order pig>rat>mouse. The doses at which carcinogenicity was observed in rodents were higher than those that caused nephrotoxicity. The Joint FAO/WHO Expert Committee on Food Additives (JECFA) reconsidered the report of the study of carcinogenicity conducted by the National Toxicology Program (USA) in 1989 and noted the consistent presence and severity of karyomegaly in male and female rats and the agressive nature of the renal tumours in this study. However, the biological and mechanistic significance of these observations was unclear. Gene mutation was induced in bacteria and mammalian cells in a few studies, but not in most. OTA did, however, induce DNA damage, DNA repair and chromosomal aberrations in mammalian cells in vitro and DNA damage and chromosomal aberrations in mice treated in vivo. Putative DNA adducts were found consistently with a 32P-postlabelling method in the kidneys of mice and rats dosed with OTA, but none of these adducts has been demonstrated to contain a fragment of OTA. It was therefore uncertain whether OTA interacts directly with DNA or whether it acts by generating reactive oxygen species. There was no indication that a reactive metabolite of OTA is generated in vivo. OTA is thus genotoxic both in vitro and in vivo, but the mechanism of genotoxicity is unclear and there is no evidence that it is mediated by direct interaction with DNA. The doses used in the studies of genetic toxicity were in the same range as those at which the incidence of renal tumours was increased in mice. In rats, however, the incidences of nephrotoxicity and renal tumours were increased at much lower doses; therefore the contribution of the genotoxicity of OTA to neoplasia in rats is unknown.
OTA can cross the placenta and it is embryotoxic and teratogenic in rats and mice. It has been shown to have immunosuppressive effects in a number of species. Prenatal administration of OTA to rats caused immunosuppression, but perinatal administration stimulated certain aspects of the immune response in rats. OTA inhibited the proliferation of B- and T-lymphocytes and affected the late stages of T-lymphocyte activation in vitro. However, both the immunological and teratogenic effects have been observed only at doses much higher than those that cause nephrotoxicity.
1.5 Observations in humans
OTA has been found in human blood samples, most notably in a number of countries in the cool temperate climatic areas of the Northern Hemisphere; however, no cases of acute intoxication in humans have been reported. OTA was found more frequently and at high average concentrations in blood samples obtained from people living in regions where a fatal human kidney disease (known as Balkan Endemic Nephropathy) occurs and is associated with an increased incidence of tumours of the upper urinary tract. Nevertheless, similar average concentrations have been found in some other European countries where this disease is not observed. In the JECFA meeting (2001) it was concluded that the epidemiological and clinical data available do not provide a basis for calculating the likely carcinogenic potency in humans and that the aetiology of Balkan Endemic Nephropathy may involve other nephrotoxic agents.
1.6 Derivation of a PTWI by JECFA
OTA was reviewed by the JECFA at its thirty-seventh meeting, when it established a PTWI of 112 ng/kg of body weight using a safety factor of 500 based on the deterioration of renal function in pigs, for which the lowest-observed-effect level (LOEL) was 0.008 mg/kg of body weight per day. OTA was re-evaluated at the forty-fourth meeting to consider toxicological data that had become available since the previous evaluation, including studies on the epidemiology of nephropathy, genotoxicity and experimental nephrotoxicity. At that meeting, the Committee reconfirmed the PTWI, rounding it to 100 ng/kg of body weight. Recently, the JECFA evaluated the data on OTA again (fifty-sixth meeting, 2001). It was concluded that the new data raised further questions about the mechanisms by which OTA causes nephrotoxicity and renal carcinogenicity and the interdependence of these effects. The mechanisms by which OTA causes carcinogenicity is unknown, although both genotoxic and non-genotoxic modes of action have been proposed. The Committee retained the previously established PTWI of 100 ng/kg body weight per week, pending the results of ongoing studies on the mechanisms of nephrotoxicity and carcinogenicity, and recommended a further review of OTA in 2004. In reaching this conclusion, the Committee noted the large safety factor applied to the NOEL for nephrotoxicity in deriving the PTWI, which corresponds to a factor of 1500 applied to the NOEL for carcinogenicity in male rats, the most sensitive species and sex for this end-point. The hazard at the lowest effective dose in several mammalian species is nephrotoxicity, and this is likely also to be true in humans.
1.7 Regulatory concentration limits for ochratoxin A in food products
Several countries established concentration limits for OTA in different food products. These limits are presented in Table1.
Table 1. Concentration limits for OTA in food products.
Food product Concentration limit (µg/kg)
Country Reference
Cereals, non-processed 5 EU Byrne (2002)
Cereals, processed 3 EU Byrne (2002)
Cereals 20-50 Brasil,
Israel
FAO (1997)
Cereals 2 Switzerland FAO (1997)
Dried vine fruits 10 EU Byrne (2002)
Milk products 0.5 * Cyprus FAO (1997)
Raw coffee beans 20 Greece FAO (1997)
Pig kidneys 10 Denmark FAO (1997)
2 Dietary intake of ochratoxin A
Human dietary intake of chemicals is usually estimated by combining data on concentrations of chemicals in different food products and the consumption rate of these products. The methodology used for the derivation of the mean OTA concentrations in the different food products is described in the section below. The consumption rate of the products containing OTA is examined with the Dutch National Food Consumption Survey (DNFCS), which describes the consumption pattern of the Dutch population and includes information on the daily consumption over two consecutive days and a record of age, sex and body weight of 6250 individuals (Kistemaker et al., 1998).
2.1 Ochratoxin A concentrations in different food groups
OTA is predominantly found in cereals and cereal products, but also in raisins, grape juice, wine, coffee, cocoa and in some pulses and nuts. As OTA is very persistent, products such as meat and dairy have been found to contain OTA as well. The Dutch Inspectorate for Health Protection and Veterinary Public Health (IHP) monitored OTA concentrations in grain, coffee, wine, nuts, cocoa and spices from 1995 onwards. In all of these food groups there is a large fraction of samples in which OTA could not be detected (Table 1). Therefore, the mean concentrations of OTA in grain, coffee, red and white wine analysed by the IHP were calculated using a statistical method developed for these so-called “left censored” data (Appendix 1). For white wine, cocoa and nuts the percentage of samples with concentrations below the detection limit was 90-100%. Furthermore, the number of samples from these food groups was relatively low. Therefore, the concentration data of these groups were combined with concentrations in food products sampled in other countries, reported by the Food and Agriculture Organisation/World Health Organisation (JECFA, 2001), by the EU (SCOOP, 2001) and by the RIKILT-DLO, the State Institute for Quality Control of Agricultural Products in the Netherlands (Van Dooren et al., 1999). Details of these calculations are described in Appendix 1. Mean concentrations of OTA in food groups for which no samples were analysed in the Netherlands, such as rye, meat, milk and beer, were also calculated from the data from these reports (Appendix 1). In Table 2 the calculated mean OTA concentrations in the different food groups are shown. The contribution to the OTA intake by the consumption of spices was assumed negligible, since the consumption of spices (in grams) is very low.
Table 2. Number of samples (n), number of samples below limit of detection (n<lod) and mean OTA concentrations (taking all samples into account, see Appendix 1) in different food groups.
food group n n<lod mean µg/kg or µg/L
Reference
cerealsa 323 304 0.22 IHPb
rye 1001 847 0.73 SCOOPc/ JECFAd
coffee 135 82 0.012 IHP/ Sara Leee
red wine 150 89 0.25 IHP
white wine 454 231 0.06 IHP/ SCOOP/ JECFA
cocoa 141 11 0.59 IHP/ SCOOP
nuts 137 111 0.03 IHP/ JECFA
meat 925 576 0.04 SCOOP/ JECFA
milk 513 495 0.007 SCOOP/ RIKILT-DLOf
beer 598 142 0.024 SCOOP/ JECFA
raisins 506 93 1.87 JECFA
grape juice 184 21 0.49 SCOOP/JECFA
a
all cereals, except rye; b Dutch Inspectorate for Health Protection and Veterinary Public Health; c SCOOP 2001; d JECFA, 2001; e Van der Stegen, Sara Lee The Netherlands, personal commumication; f Van Dooren et al., 1999
Occasionally OTA concentrations exceed the concentration limits of food products. However, the average concentrations are low compared to the regulatory concentration limits.
2.2 Concentration in individual food products
Since only a limited number of all food products were sampled, there were no concentration data available for all consumed products as described in detail in the DNFCS database. Therefore, we distinguished several relevant food groups for the calculation of OTA intake. These food groups were: cereals (rye excluded), rye, coffee, red wine, white wine, cocoa, nuts, meat, milk, beer, raisins and grape juice. 555 of the 1210 food products present in the database were classified into the food groups. The other 655 products were classified as “not relevant” for OTA intake calculations. By multiplying the content of a specific food group in the consumed food product (e.g. wheat content of bread = 0.6) with the average OTA concentration of the food group, OTA concentrations of the various food products were calculated. The loss of OTA during food processing was not taken into account, since there is not enough information about the concentration reduction during cooking and baking, etc. Data on the cereal content of the products were derived from the Conversion model Primary Agricultural Products (CPAP, Van Dooren et al., 1995), or were based on cooking recipes or on the content of similar food products in the same food category. Contents of cocoa in chocolate products (35 products, varying from chocolate milk to candy bars), of nuts in nut products (13 products, different kinds of nuts and of peanut butter/sauce) and of rye in rye products (4 products) were estimated from recipes or product labels. The products in the food groups beer (5 products), wine (5 products), grape juice (1 product) and milk (114 products, being various sorts of milk, yoghurt and cheese) were assumed to consist of pure beer, wine, grape juice and milk, respectively.
2.3 Calculation of dietary intake
The contribution of each food group to the total intake of OTA was calculated by multiplying the average food intake of each group (calculated from the DNFCS database) by the
concentration in this food group (Table 3).
Table 3. Intake of OTA per food group and the relative contribution of the different food groups to the average total OTA intake.
food group average food intake (g or mL/day/person)
average OTA intake (ng/day/person)
contribution of food group to total OTA intake (%) cerealsa 232 33 55 rye 2 1 2 coffeeb 448 6 9 red wine 17 4 7 white wine 10 < 1 1 cocoa 31 3 5 nuts 8 < 1 < 1 meat 133 5 8 milk 383 3 5 beer 117 3 5 raisins 1 1 2 grape juice 1 < 1 1 total 1383 59 100 a
rye not included; ball coffee considered as caffeinated coffee
It appears that more than half of the intake of OTA occurs via the consumption of cereals (Table 3). Together with coffee, red wine and meat, 79 % of the total intake of OTA is covered, while milk, beer and cocoa add another 15 % (Table 2). The total average intake calculated in this manner is 59 ng/day/person (Table 2). The average intake expressed per kg bodyweight (kg bw) is 1.0 ng/kg bw/day and the 95th percentile is 2.0 ng/kg bw/day (see also Figure 2 and table 5).
Figure 2. Frequency distribution of OTA intake per kg body weight per day, consisting of daily average intakes at two consecutive days for 6250 individuals recorded in the Food Consumption Survey database.
2.4 Uncertainty in the calculated intake
As in every calculation, there is uncertainty in the calculated intake of OTA. This stems from the uncertainty in the calculated average concentrations in the food groups and from the uncertainty in the consumption rate. The latter is considered relatively low, since the food groups which give the highest contributions to the total OTA intake (cereals, coffee, wine, meat, milk and beer) are all foods that are frequently consumed by a high percentage of the Dutch people. Therefore, the consumption of these foods are reliably estimated by the DNFCS. However, the uncertainty in the calculation of the average concentrations in the food groups may be considerable. An important source of uncertainty is the high percentage of non-detects in important food groups, especially in cereals. To get an indication of the associated uncertainty, we calculated the worst case estimate of the concentration by assuming non-detects at the detection limit. For cereals, the worst-case estimate for the OTA concentration is 0.46 µg/kg, (instead of 0.22 µg/kg). This worst-case concentration would lead to an extra average daily intake of 34 ng/day (0.5 ng/kg bw /day), which is an increase of 58 %. The worst case concentration estimates of other food groups with considerable amounts of non-detects lead to much smaller increases in the OTA intake (e.g. 3 ng/day for milk, 1 ng/day for coffee and white wine).
It should be noted that the year-to-year variation of OTA may be considerable due to different weather conditions. Since food products were sampled during only one or two years (e.g. 2000 and 2001 for the Dutch samples), the range of concentrations measured may be wider. Furthermore, the number of collected samples is limited and the calculated mean concentrations may not be representative for the food products consumed by the Dutch population. Similarly, the concentration data from other countries may not be representative for the Dutch situation.
2.5 Comparison with other studies
We calculated a dietary intake of OTA of 59 ng/day (1.0 ng/kg bw/day). Comparing this intake to the intakes reported previously, it is concluded that the mean absolute intakes reported in different studies vary considerably (Table 4). However, the relative dietary intakes, i.e. the intake expressed per kg bw, agree well.
The mean OTA intake calculated by Van Dooren et al., (1999) is 45 ng/day and 0.8 ng/kg bw/day (Tables 4 and 5). These values were calculated using concentration data (measured concentrations by IHP and literature data, 1995-1997) and the DNFCS database. The differences with the calculated values of the present study are due to the fact that OTA concentrations in meat, wine and cocoa used by Van Dooren et al., were low compared to those in the present study (Appendix 1).
In a Swedish study, Thuvander et al., (2001) reported a mean intake of 1.2 ng/kg bw/day (Table 5). The difference of 0.2 ng/kg bw/day between the mean intake of Thuvander et al., and the mean intake of the present study is mainly caused by 3- to 4-fold higher concentrations for both cereals (samples from Sweden) and coffee (Dutch values from 1997). The studies mentioned above are all investigations in which the intake of OTA was calculated with average concentrations in food groups and consumption rates. In addition to these, two duplicate diet studies were performed, in which the participants collected duplicates of all the food they consumed during a predetermined time period. The amount of OTA in the duplicate diets is then determined. A 24-hour duplicate diet study was performed at the Laboratory for Residue Analysis at the National Institute of Public Health (Van Egmond, 2000 and 2001). The mean OTA intake determined from the 122 samples (collected in 1994) was 83 ng/day and 1.1 ng/kg bw/day (Tables 4 and 5). A similar result was obtained in a 1-month duplicate diet study which was performed in the UK (Gilbert, 2001): a mean OTA intake of 65 ng/day and 0.9 ng/ kg bw/day (Tables 4 and 5).
Considering the results of the various studies, summarized in Table 4 and 5, it can be concluded that although the mean absolute intakes of the different studies vary considerably, the mean relative intakes agree well. From the reported 95th percentiles (and/or the reported range) it is clear that the variation in intake between persons is large.
Table 4. Dietary intake of OTA per individual per day (mean, median, and 95th percentile) reported in various studies.
Study type of study mean
ng/day
Median ng/day
95th percentile ng/day
Present study Calculation 59 52 121
Van Dooren et al., 1999 Calculation 45 n.r.a n.r.
Van Egmond, 2000, 2001 24 h d.d.b 83 50 164
Gilbert et al., 2001 1 month d.d. 65 46 n.r.
Table 5. Dietary intake of OTA per kg body weight per day (mean, median, and 95th percentile) reported in various studies.
Study type of study mean
ng/kg bw/day Median ng/kg bw/day 95th percentile ng/kg bw/day
Present study Calculation 1.0 0.9 2.0
Van Dooren et al., 1999 Calculation 0.8 n.r.a n.r.
Thuvander et al., 2001 Calculation 1.2 n.r. 2.0
Van Egmond, 2000, 2001 24 h d.d.b 1.1 0.7 2.3
Gilbert et al., 2001 1 month d.d. 0.9 0.8 range: 0.3-3.5c
a
n.r. = not reported; b d.d. = duplicate diet; c 95th percentile was not reported
2.6 Statistical analysis and modelling
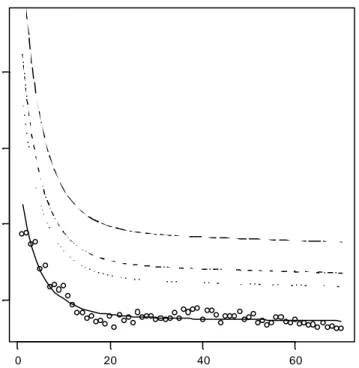
The frequency distribution shown in Figure 2 gives insight in the total variation in daily intakes. This variation has two components: a between-days and between-individuals variation. The high tailing value of the distribution (Figure 2) should therefore be carefully interpreted, as it contains a one-day event of an individual. Therefore, this distribution is not suitable for a comparison with the tolerable daily intake (TDI), because the latter is intended for long-term exposure. The long-term exposure distribution, representing inter-individual differences, was estimated by using the Statistical Exposure Model STEM (Slob, 1993). Analysing the data displayed in Figure 2 by STEM yields the results as presented in Figure 3, showing that the relative intake per age class is between 0.5 and 2 ng/kg bw/day and decreases with age. The percentiles depicted in the figure represent the variation between individuals after correcting for the between-days variation. The highest value is for the 1 year age class, of which the 99th percentile is 5.5 ng/kg bw/day, which is out of the scale of Figure 3.
Figure 3: Daily intake of OTA per kg bodyweight as a function of age. Each circle denotes the age class mean. The line represents the estimated geometric mean intake estimated by fitting a regression function. The dashed curves denote the 90th, 95th and 99th percentiles, indicating the long-term variation between individuals. The maximum value for the 99th percentile (age 1 year) is 5.5 ng/kg body weight/day.
age (y) intake ( ng/day /kg bw ) 0 20 40 60 1 2 3 4
3.
Risk Assessment of ochratoxin A in the Netherlands
To assess the risk of the OTA intake in the Netherlands, the estimated intake is compared to the PTWI of 100 ng/kg bw/week (14 ng/kg bw/day; JECFA, 2001).
The 99th percentile of the estimated daily intake for every age class was less than the PTWI. One-year olds showed the highest intake with a 99th percentile of 5.5 ng/day/kg body weight. However, since the PTWI is established for a lifelong intake, an exposure measure with a matching time-frame should be used for an adequate comparison. The lifelong-averaged intake is such a measure. For the median of the population, the age-dependent median intake from age 1 to 70 yrs (Fig. 2) is integrated and expressed on a daily basis. It is thus assumed that exposure concentrations in food remain unchanged throughout one’s life. This means that the potential effect of the current exposure conditions is evaluated as if it would be effective on a lifelong period. The lifelong-averaged median intake is 1.1 ng/kg bw/day, while the 99th percentile is 4.0 ng/kg bw/day. This is a factor 12.7 and 3.5 lower than the PTWI, respectively.
If the worst case concentration of OTA in cereals is considered, this would give rise to an 58% increase of OTA intake, resulting in an intake of 1.7 ng/kg bw/day (99th percentile 4.3 ng/kg bw/day). Also for this worst case scenario the calculated intake is far below the PTWI. It is therefore concluded that there are no health risks associated with the dietary intake of OTA in the Netherlands.
4.
Conclusions
The most sensitive toxic effect of OTA is nephrotoxicity. The PTWI, based on the renal malfunction in pigs, is established at 100 ng/kg bw/week. OTA also has carcinogenic effects. Whether OTA is a genotoxic carcinogen is presently not clear.
The intake of OTA occurs mainly (55%) via the intake of cereals. Coffee, red wine, meat, milk, beer and cocoa also contribute significantly to the total OTA intake.
The average daily intake of OTA, calculated by multiplying the OTA concentrations in food products with the average intake of these food products, is 59 ng/day (1.0 ng/kg bodyweight/day).
There is considerable uncertainty in the average OTA concentrations of the food groups. Nevertheless, the calculated relative intake agrees well with results from other studies.
Since the 99th percentile of the lifelong-averaged intake (28 ng/kg bw/week) is considerably lower than the PTWI (100 ng/kg bw/week), it is concluded that there is no health risk from the dietary intake of OTA.
References
Byrne D. (2002) Commission Regulation (EC) No 472/2002 of 12 March 2002 amending Regulation (EC) No 466/2001 setting maximum levels for certain contaminants in food-stuffs, Official Journal of the European Communities L75/18-20.
Food and Agriculture Organization (1997) World wide regulations for mycotoxins 1995, FAO Food and Nutrition Paper 64, Rome.
Gilbert, J., Brereton, P. and MacDonald, S. (2001) Assessment of dietary exposure to ochratoxin A in the UK using a duplicate diet approach and analysis of urine and plasma samples, Food Additives and Contaminants 18: 1088-1093.
JECFA, (2001). Safety evaluation of certain mycotoxins in food. Prepared by the 56th Meeting of the Joint FAO/WHO Expert Committee on Food Additives (JECFA). WHO Food Additives SeriesL:46. Ochratoxin A, pp. 281-415. World Health Organization, Geneva, 2001. International Programme on Food Safety.
Kistemaker, C., Bouman, M. and Hulshof, K.F.A.M. (1998) Consumption of separate products by Dutch population groups - Dutch National Food Consumption Survey 1997 – 1998 (in Dutch). Zeist, TNO-Nutrition and Food Research Institute, TNO-report V98.812. SCOOP (2001) Report of the EU, Scientific Co-operation on Questions relating to food, Task 3.2.7: Assessment of dietary intake of ochratoxin A by the population of EU member states, Final draft.
Slob, W. (1993) Modeling long-term exposure of the whole population to chemicals in food. Risk Analysis 13: 525-530.
Thuvander, A., Möller, T., Enghardt Barbieri, H., Jansson, A., Salomonsson, A.-C. and Olsen, M. (2001) Dietary intake of some important mycotoxins by the Swedish population. Food Additives and Contaminants 18: 696-706.
Van Dooren, M.M.H., Boeijen, I., Van Klaveren, J.D. and Van Donkersgoed, G. (1995). Conversion of consumer food to primairy agricultural products (in Dutch). Wageningen, State Institute for Quality Control of Agricultural Products (RIKILT), report 95.17.
Van Dooren-Flipsen, M.M.H., Noordam, M.Y., Van Klaveren, J.D. (1999) Dietary exposure to residues and contaminants. Cases: 1. butyl benzyl phtalaten (BBP) 2. ochratoxine A. RIKILT-DLO (Wageningen), report number 99.007
Van Egmond, H.P. (2000). Investigations of 24 hours duplicate diets. Letter to H.J. Jeuring, Dutch Ministry of Public Health, Welfare and Sports. November 27th 2000 (in Dutch). National Institute of Public Health and the Environment, Bilthoven. Letter report number 1296/2000 ARO vE/mk.
Van Egmond, H.P. (2001). Investigations of 24 hours duplicate diets II. Letter to H.J. Jeuring, Dutch Ministry of Public Health, Welfare and Sports. December 3th 2001 (in Dutch). National Institute of Public Health and the Environment, Bilthoven. Letter report number 1095/2001 ARO vE/mk.
Appendix 1 Derivation of mean ochratoxin A
concentrations in different food groups
Food groups analysed by the Dutch Inspectorate for Health Protection and Veterinary Public Health
The Dutch Inspectorate for Health Protection and Veterinary Public Health (IHP) sampled cereals, coffee, wine, nuts and cocoa and spices.
For the spices paprika powder and chili powder, concentrations of OTA up to 10-15 µg/kg were measured. However, as the consumption of spices (in grams) is very low, we assumed the contribution of the spices to the total intake of OTA negligible.
The rest of the data were analyzed with a statistical method for multiply censored data, assuming a lognormal distribution of the data. The computer programme S-Plus, equipped with the module Environmental Statistics was used to calculate the mean of the data, using the method “Imputation using quantile-quantile regression”. This method gives a reliable mean concentration of the data, but the coefficient of variation is underestimated, since the calculation is only performed once and not several (e.g. 5) times, which would lead to a better estimate of the variation. Nevertheless, in (lifetime) exposure assessment, the mean and not the variation is relevant and therefore this method is appropriate here.
The statistical method could not be used for the concentrations in cocoa and nuts reported by IHP, as for these food groups OTA could not be detected in any of the Dutch samples. For these groups, the detection limit divided by two is used as a mean concentration for the Dutch cocoa and nut samples (Table 1.1).
The cereal samples measured by IHP were all wheat samples (except one, which was buckweat). Data for whole wheat and white wheat were considered together, since there a difference between the concentrations of these two could not be observed. Since the concentrations for cereals other than rye (i.e. wheat, buckweat, barley, oat, corn, rice) reported by the EU (SCOOP, 2001) and the FAO/WHO (JECFA, 2001) are all similar, the data for wheat were considered representative for all cereals. Only for rye, which has higher concentrations according to the SCOOP and JECFA reports (Table 1.1), a separate food group is formed.
The concencration data for coffee in Table 1.1 represent the data for roasted coffee measured in 1999. Samples taken in earlier years contained higher concentrations, but since the coffee industry has taken measures to reduce the contamination with OTA, these were not considered here. In 1999, the mean concentrations in the samples of instant coffee were a factor of 20 higher than in roasted coffee. Nevertheless, these concentrations were not taken into account. There were three reasons to do this:
(1) we assumed that in the Netherlands the contribution of instant coffee to the total coffee consumption was low (lower than 5%).
(2) the amount of instant coffee needed to make (liquid) coffee is three times lower as for regular roasted coffee (Van der Stegen et al., 1997).
(3) the concentrations of the instant coffee samples (n = 10) could be higher by coincidence: in 1995, no difference was found between concentrations in instant and regular coffee. Since 6 g of coffee is needed to make one cup of percolator coffee (Van der Stegen, et al., 1997), the concentration in ground coffee beans was divided by 25 to obtain the concentration per liter coffee.
Food groups for wich the data from IHP were insufficient
Due to the low number of analyzed samples for white wine, cocoa and nuts, the data from IHP were considered insuffient to use as a basis for intake calculations. The concentrations measured by IHP were combined with data from other countries reported by the FAO/WHO (JECFA, 2001), the EU (SCOOP, 2001) and the RIKILT-DLO, the State Institute for Quality Control of Agricultural Products in the Netherlands (Van Dooren et al., 1999) by calculating the weighed mean (Table 1.1). Only the reported data for which a mean was given and which had a reasonable low limit of detection (compared to those of other countries) were taken into account. If the concentration data were presented in more than one report, they were only used once for the calculation of the weighed mean. Nevertheless, it was not always clear from the reports if there was an overlap between the data.
Table 1.1. OTA concentrations in different food groups reported by different institutions. Concentrations printed in bold are used in the exposure calculations.
food group
Year na n<lodb Lod mean 1c
µg/kg mean 2d µg/kg reference cerealse ‘95-‘01 323 304 0.25/1 0.22 0.33 IHPf rye ‘86-‘98 793 208 403 444 0.01-0.05 0.01-0.5 -0.81 0.60 0.73 JECFAg SCOOPh weighed mean coffee ‘99-‘01 135 82 0.3/0.1 0.31i 0.32 IHP/VanderStegenj
red wine ‘99 150 89 0.05/0.1 0.25 0.25 NL-SCOOPj
white wine ‘99 ‘96-‘99 n.r.m 20 185 249 18 108 135 0.01-0.05 0.003-0.05 0.001-0.01 0.14 -0.14 0.08 0.04 0.06 NL-SCOOP SCOOP JECFA weighed mean cocoa ‘96 n.r. 6 135 6 5 0.25 0.01-0.2 -0.13 0.61 0.59 IHP SCOOP weighed mean nuts ‘96 ‘95-‘98 12 125 12 99 0.25 0.01 -0.13 0.02n 0.03 IHP JECFA weighed mean meat ‘93-’94 ‘96-‘97 n.r. 251 105 569 109 67 400 0.02-0.2 0.004 0.01-1 -0.05 0.02 0.04 0.04 JECFA RIKILT-DLOo SCOOPp weighed mean milk ‘96 n.r. 115 270 115 252 0.01 0.005-0.03 -0.005 0.008 0.007 RIKILT-DLO SCOOP weighed mean beer 1993/97 n.r. 298 300 41 101 0.001-0.01 0.001-0.2 -0.019 0.029 0.024 JECFA SCOOP weighed mean raisins 1996 506 93 0.2 - 1.87 JECFA grape juice 1994-98 n.r. 28 156 4 17 0.005-0.02 0.001-0.01 -0.35 0.52 0.49 JECFA SCOOP weighed mean a
number of samples; b limit of detection; c calculated mean with statistical method as described above; d calculated mean, assuming concentration of 0.5 x lod for samples <lod.; e all cereals, except rye; ;f Dutch Inspectorate for Health Protection and
Veterinary Public Health; g JECFA 2001; h SCOOP 2001; i concentration per kg ground coffee beans j Van der Stegen, Sara
Lee The Netherlands, personal commumication; k Dutch data for SCOOP, measured by IHP; mnot reported; n 90th percentile,
For food groups which were not sampled in the Netherlands but considered possibly relevant (meat, milk, beer, raisins and grape juice), the weighed means of the reported concentrations from other countries were used as well (Table 1.1). The concentration data for meat in the JECFA and SCOOP reports were predominantly coming from samples of pork and poultry. In the calculation of the intake of OTA it is assumed that the OTA concentrations are the same in all kinds of meat. However, this may be untrue, since ruminants may be able to metabolise OTA (see also the very low concentrations in milk). Therefore the calculated OTA intake of beef and mutton may be an overestimation. However, whether concentrations in meat from ruminants are indeed negligible can only be determined when measured concentrations in beef and mutton are available.
Appendix 2 Mailing list
1 Ir. J.F. de Leeuw, Director General of Food and Non-Food Authority, The Netherlands 2 Prof. P. Peters (Inspectorate for Health Protection and Veterinary Public Health, The
Netherlands)
3 Ir.J.I.M. de Goeij, Director General Health, Ministry of Public Health, Welfare and Sport, The Netherlands
4 Dr. D.G. Groothuis (Inspectorate for Health Protection and Veterinary Public Health, The Netherlands)
5 Drs. H.J. Jeuring (Inspectorate for Health Protection and Veterinary Public Health, The Netherlands)
6 Prof.dr. J.A. Knottnerus, Chairman of Health Council of The Netherlands 7 Dr.ir. L.Tj. Pijls (Health Council of The Netherlands)
8 Dr. M. Spanjer (Inspectorate for Health Protection and Veterinary Public Health, The Netherlands)
9 Dr. F. Verstraete (EU-EC DG-SANCO)
10 Dr. J. de Stoppelaar (Dept. for Nutrition and Health Protection, Ministry of Public Health, Welfare and Sport)
11 Mrs. N. Scheidegger (Ministry of Agriculture, Nature Management and Fisheries) 12 Drs. M. Elema (Product Board of Grains, Seeds and Pulses)
13 Dr. K.F.A.M. Hulshof (TNO)
14 Deposit of Netherlands Publications and Netherlands Bibliography 15 Mr. H. Pont, Director-General of the RIVM
16 Prof.dr. D. Kromhout, Director of Nutrition and Consumer Safety Division 17 Dr. R.B. Beems (RIVM/LPI)
18 Dr. H. van Loveren, Head LPI, RIVM 19 Dr. J. van Benthem (RIVM/LEO) 20 Dr. A.B.T.J. Boink (RIVM/LEO) 21 Dr. F.X.R. van Leeuwen (RIVM/CRV) 22 Dr. J. Meulenbelt, Head NVIC, RIVM 23 Dr. G.J.A. Speyers (RIVM/CRV)
24 Prof.dr. R.W. Stephany, Head ARO, RIVM 25 Ir. H.P. van Egmond(RIVM/ARO)
26 Drs. A.G.A.C. Knaap (RIVM/CRV) 27-28 Authors 29 RIVM/SBC 30 Library 31 Library RIVM/CRV 32 Library RIVM/ARO 33 Report Registration/RIVM 34-44 Sales department RIVM 45-55 Stock RIVM/ARO