Discovering the next Eddy Merckx
Scouting top talent in cycling
Word count: 24,723Arthur Vande Weghe
Student number: 01405214
Supervisors: Prof. Dr. Dries Goossens, David Van Bulck
A dissertation submitted to Ghent University in partial fulfilment of the requirements for the degree of Master of Science in Business Engineering, main subject: Data Analytics
CONFIDENTIALITY AGREEMENT
PERMISSION
I declare that the content of this Master’s Dissertation may be consulted and/or reproduced, provided that the source is referenced.
Student’s name: Arthur Vande Weghe Signature:
ABSTRACT
Purpose – Sports and sports scouting increasingly depend on the application of statistical data
analysis. The purpose of this dissertation is to provide insight into the possibilities of the use of result-based data by professional road cycling organizations in the process of discovering talented riders.
Design/methodology/approach – This research creates and evaluates four types of supervised
machine learning models that learn from data on the U23 and professional careers of 2,308 riders from January 2007 to December 2018. The best performing models are then applied to a new group of 270 riders who just finished their U23 careers, to predict how they will perform in their first year as professional riders.
Findings – Our research reveals that UCI points, CQ points, and PCS points serve as suitable
cycling performance measures for scouting purposes. In addition, our results show that multiple supervised machine learning techniques can be used to build predictive models that assist scouts in their search for talented riders. Despite the fact that cycling results seem to be sensitive to coincidence, past results nevertheless appear to be important predictors of future cycling performance.
Originality/value – This research contributes to the existing literature on the application of data
analysis to professional road cycling as it sheds light on new possibilities of applying result-based data to discover talented riders. To our knowledge, this academic publication is the first one to introduce supervised machine learning techniques to assist scouts in cycling in their search for talented young riders.
PREFACE
This master’s dissertation is the last chapter in the book which tells the story of my period at Ghent University. I feel very fortunate to have been given the chance to study at a beautiful university where both quality and equality are of paramount importance.
First of all, I would like to thank my supervisor Prof Dr. Dries Goossens for his correct guidance and for offering this thesis subject, which allowed me to combine my love for cycling with my growing love for data analysis. I am also grateful to David Van Bulck, for explaining me how specific parts of my research needed improvement, and for always answering my questions quick and to the point.
Of course, I want to thank my friends and family for their love and friendship, my parents for their unconditional support, and Lize for being a truly inspirational girlfriend. I try to never take these precious relationships for granted.
COVID-19 IMPACT
The process of creating this master’s dissertation has only been hindered to a limited extent by the necessary COVID-19 measures taken by Ghent University. Although face-to-face meetings are preferable, the MS Teams meetings with Prof Dr. Dries Goossens and David Van Bulck were effective enough and did not prevent me from receiving valuable feedback. I was not hindered in collecting the necessary data for this research.
The COVID-19 pandemic forced the UCI to postpone or cancel most of its 2020 races, which was quite unfortunate for me because it did not allow me to validate how my predictions would have played out this year.
TABLE OF CONTENTS
ABSTRACT ... I PREFACE ... II COVID-19 IMPACT ... III TABLE OF CONTENTS ... IV LIST OF ABBREVIATIONS ... VI LIST OF FIGURES ... VIII LIST OF TABLES ... IX
PART I - INTRODUCTION ... 1
1 BACKGROUND IN CYCLING ... 2
2 RESEARCH QUESTIONS ... 4
PART II - LITERATURE REVIEW ... 5
3 PERFORMANCE MEASURES IN SPORTS ... 7
3.1A BRIEF HISTORY OF PERFORMANCE MEASURES IN SPORTS ... 7
3.2BASEBALL ... 8 3.3BASKETBALL ... 10 3.4AMERICAN FOOTBALL ... 11 3.5SOCCER ... 13 4 SCOUTING IN SPORTS ... 15 4.1TYPES OF SCOUTS ... 15
4.2QUALITATIVE VS QUANTITATIVE SCOUTING ... 16
4.3COMPUTER AIDED SCOUTING TOOLS ... 17
5 PROFESSIONAL ROAD CYCLING ... 19
5.1PHYSIOLOGICAL RESEARCH ... 20
5.2RESULT-BASED RESEARCH ... 21
5.3GAP IN LITERATURE ... 24
PART III - RESEARCH ... 25
6 BUSINESS UNDERSTANDING ... 28
7 DATA ... 29
7.1DATABASE ... 29
7.2DATA UNDERSTANDING ... 30
7.3.4 UCI, CQ, PCS points ... 41
7.3.5 More predictor variables ... 43
7.3.6 Temporary base table ... 46
7.4FINAL BASE TABLE ... 48
8 MODELING AND EVALUATION ... 51
8.1CONTINUOUS PREDICTION MODELS ... 53
8.1.1 Linear Regression ... 53
8.1.1.1 Definition ... 53
8.1.1.2 Evaluation ... 54
8.1.1.3 Example ... 56
8.1.2 Random Forest Regression ... 59
8.1.2.1 Definition ... 60
8.1.2.2 Evaluation ... 61
8.1.2.3 Example ... 63
8.2CLASSIFICATION PREDICTION MODELS ... 67
8.2.1 Random Forest Classification ... 68
8.2.1.1 Definition ... 68
8.2.1.2 Evaluation ... 68
8.2.1.3 Example ... 71
8.2.2 Neural Network Classification ... 75
8.2.2.1 Definition ... 75
8.2.2.2 Evaluation ... 77
8.2.2.3 Example ... 77
8.3OVERVIEW OF ALL MODELS ... 82
8.3.1 Continuous Prediction Models ... 82
8.3.2 Classification Prediction Models ... 85
PART IV - DISCOVERING THE NEXT EDDY MERCKX ... 88
9 PREDICTIONS ... 89
9.1REGRESSION PREDICTIONS ... 90
9.2CLASSIFICATION PREDICTIONS ... 92
9.3MOST TALENTED RIDERS ... 94
PART V - FINAL REFLECTION ... 96
10 CONCLUSION ... 97
11 LIMITATIONS AND RECOMMENDATIONS FOR FUTURE RESEARCH ... 100
REFERENCES ... 103
APPENDICES ... 109
A.OVERVIEW OF R-CODE AND R-DATA ... 109
B.ALL PREDICTIONS ... 111
C.CQ POINTS SYSTEM ... 115
LIST OF ABBREVIATIONS
AI Artificial Intelligence
AUC Area Under receiver operating Curve
AVG Average
CONT Continental (team)
CQ Cycling Quotient
CRISP DM Cross Industry Standard Process for Data Mining
DBO Database Owner
DT Decision Tree DF Degrees of Freedom F False FN False Negative FP False Positive GC General Classification INC Increase IT Information Technology KM Kilometer(s)
KPI Key Performance Indicator
LR Linear Regression
MAE Mean Absolute Error
MAPE Mean Absolute Percentage Error
MAX Maximum
MIN Minimum
ML Machine Learning
MLB Major League Baseball
MSE Mean Squared Error
NA Not Available or Not Applicable
NBA National Basketball Association
Neoprof A first-year professional rider
NFL National Football League
OOB Out of Bag
PCS Pro Cycling Stats
PER Player Efficiency Rating
PROF Professional (team)
PRT Pro Tour / World Tour (team)
R&D Research and Development
RA Rider’s Agent
RF Random Forest
RFC Random Forest Classification
RFR Random Forest Regression
RMSE Root Mean Squared Error
RNK Ranking
ROC Receiver Operating Characteristic or Curve
RQ Research Question
RSE Residual Standard Error
RSS Residual Sum of Squares
SD / STD Standard Deviation
T True
TDF Tour De France
TN True Negative
TP True Positive
TT (Individual) Time Trial
TTT Team Time Trial
U23 Under twenty-three (age/category)
UCI Union Cycliste Internationale
VAR Variance
VICT Victories (number of)
VIF Variance Inflating Factor
LIST OF FIGURES
FIGURE 1RESEARCH OUTLINE ACCORDING TO CRISPDM MODEL (WIRTH,2000) --- 26
FIGURE 2NUMBER OF RESULTS PER YEAR IN DATABASE --- 30
FIGURE 3NUMBER OF RIDERS IN DATABASE PER NATIONALITY --- 32
FIGURE 4FIFTEEN MOST REPRESENTED COUNTRIES IN DATABASE --- 32
FIGURE 5NUMBER OF RACES PER YEAR IN DATABASE --- 33
FIGURE 6NUMBER OF CATEGORIES PER YEAR IN DATABASE --- 34
FIGURE 7NUMBER OF AWARDED UCI POINTS PER YEAR --- 35
FIGURE 8NUMBER OF AWARDED CQ POINTS PER YEAR --- 36
FIGURE 9CLASSIFICATION OF CYCLING TEAMS --- 37
FIGURE 10NUMBER OF PCS POINTS PER YEAR --- 38
FIGURE 11TIME WINDOW --- 40
FIGURE 12RACE CLASSIFICATION --- 45
FIGURE 13NUMBER OF OCCURRENCES OF A SPECIFIC POSITION --- 46
FIGURE 14INFLUENCE OF THE NUMBER OF TREES ON THE OOB ERROR --- 62
FIGURE 15VARIABLE IMPORTANCE AS %INCMSE --- 65
FIGURE 16VARIABLE IMPORTANCE AS INCNODEPURITY --- 66
FIGURE 17EXAMPLE OF ROC --- 70
FIGURE 18ROC OF FIRST RF MODEL --- 73
FIGURE 19ROC OF SECOND RF MODEL --- 74
FIGURE 20GENERAL STRUCTURE OF A MULTILAYER NEURAL NETWORK (GURNEY,1997) --- 75
FIGURE 21THE ROLE OF ACTIVATION FUNCTIONS IN A NN(GURNEY,1997) --- 76
FIGURE 22VISUAL REPRESENTATION OF FIRST NN WITH 1 HIDDEN LAYER --- 79
FIGURE 23ROC OF FIRST NN MODEL --- 79
FIGURE 24VISUAL REPRESENTATION OF SECOND NN WITH 2 HIDDEN LAYERS --- 80
FIGURE 25ROC OF SECOND NN MODEL --- 81
FIGURE 26AUC AS A FUNCTION OF CUT-OFF VALUE --- 87
FIGURE 27TOP 20LINEAR REGRESSION PREDICTIONS --- 90
FIGURE 28TOP 20RANDOM FOREST REGRESSION PREDICTIONS --- 91
FIGURE 29TOP 20RANDOM FOREST CLASSIFICATION PREDICTIONS --- 92
FIGURE 30TOP 20NEURAL NETWORK CLASSIFICATION PREDICTIONS --- 93
FIGURE 31RATHER SUBJECTIVE COMBINATION OF ALL PREDICTIONS --- 94
FIGURE 32FINAL HIERARCHY --- 95
LIST OF TABLES
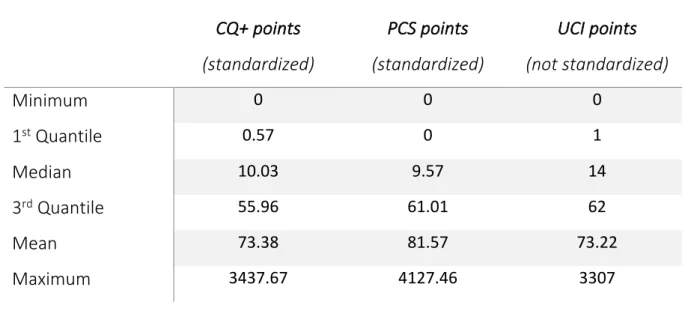
TABLE 1DESCRIPTIVE STATISTICS ON UCI AND CQ POINTS --- 41
TABLE 2DESCRIPTIVE STATISTICS ON THREE KEY PERFORMANCE MEASURES --- 43
TABLE 3RESULT-RELATED VARIABLES --- 44
TABLE 4TEMPORARY BASE TABLE --- 46
TABLE 5FINAL BASE TABLE --- 49
TABLE 6THEORETICAL REPRESENTATION OF A CONFUSION MATRIX --- 69
TABLE 7QUANTILES OF THE VARIABLE NEOPROFUCI --- 71
TABLE 8QUANTILES OF THE VARIABLE NEOPROFPOINTS (CQ+) --- 78
TABLE 9EVALUATION OF ALL LINEAR REGRESSION MODELS --- 83
TABLE 10EVALUATION OF ALL RANDOM FOREST REGRESSION MODELS --- 83
TABLE 11OPTIMIZED VS NAIVE MODELS --- 85
TABLE 12EVALUATION OF CLASSIFICATION MODELS BY MEANS OF THEIR AUC VALUE --- 86
TABLE 13CQPOINTS SYSTEM --- 115
PART I
INTRODUCTION
1 BACKGROUND IN CYCLING
The aim of this first chapter is to provide the reader of this dissertation, especially those that are not very familiar with cycling, a basic introduction into the history and business side of professional road cycling. This background is written based on my own knowledge, the book “The
Economics of Professional Road Cycling” (Van Reeth & Larson, 2015), and some web search.
After riding bicycles had become more and more common as a way of recreation and
transportation half way through the 19th century, some local newspapers in France and Belgium
came up with an idea to boost their sales. They introduced the first local bicycle road races at the
end of the 19th century in order to be able to write heroic stories about them. As newspapers
were the main source of information back then, people had to buy the newspaper in order to know how these races had unfolded. A clash between two French newspaper companies resulted in the organization of the first Tour De France in 1903, organized by Henri Desgrange in order to give his company the winning edge in this clash. This multiple-stage race would later become the biggest cycling event of the year.
The sport became more popular and teams started to build organizations around them. Early on, costs were mainly financed through sponsorships by bicycle manufacturers who used it to increase their visibility. In the 1920s, other types of companies such as insurance companies and banks started sponsoring cycling teams. To this day, sponsorship is one of the most important sources of income for a cycling team.
The UCI or Union Cycliste Internationale was founded at the beginning of the 20th century as a
world governing body for sports cycling that oversees international competitive cycling events. It organizes the yearly world championships, it issues racing licenses to riders and teams, it enforces disciplinary rules, and it manages the classification of races for professional road cycling and other cycling disciplines. Broadly speaking, road cycling events are classified as either a multi-stage race, a one-day race or a national/world championship. The multi-stages within a multi-multi-stage race are flat stages, mountain stages, individual time trials or team time trials.
All official UCI races are graded by means of the UCI ranking system. Not only the winner gets rewarded with a number of UCI points, but also the riders that came close to winning get some points depending on their ranking. The more important the race, the more points are awarded for performing well. This ranking system allows us to see how riders, teams and countries performed throughout the year, compared to their opponents. For teams it is important to score well in this ranking as it largely determines which teams are allowed to participate in the big events like the Tour De France. Not participating in big races will ultimately lead to losing sponsors, and therefore revenue.
Throughout the years, cycling has evolved a lot in terms of competitiveness. Riders used to be less specialized in certain types of races and tried to win everywhere. The superstars back then were able to win sprint stages, time trials, mountain stages, etc. Today it is much more difficult to win on different types of courses as riders have started to specialize more in certain races. One of the many reasons behind this phenomenon is that training programs have changed drastically. Not only do riders now carefully select specific types of races, they also realize they cannot perform at full power throughout the whole season. The riders who have performed well in the Tour de France in recent years often did not participate in classic races like De Ronde van Vlaanderen because they wanted to perform to their best abilities during summer.
In recent years, cycling has been on an equal footing with other major sports in terms of popularity. However, in contrast to other sports, they have not yet been able to turn this popularity into profit. This is because cycling teams hardly get any money through media rights, ticket sales, and merchandise. They are mainly dependent on their sponsors. Van Reeth and Larson (2015) go as far as stating that cycling is the last big professional sport that has not yet monetized its popularity.
It is clear that cycling, and cycling teams in particular, can still take many steps to become a well-oiled machine in terms of efficiency and organizational structure. Throughout its history, however, cycling has always tended to cling to old traditions. One of the emerging new
2 RESEARCH QUESTIONS
In general, there are two types of scouts (Schumaker et al., 2010). A first type of scout looks for young athletes with a set of skills and talents that are interesting for the scout’s organization. A second type of scout looks for weaknesses in opposing teams so that his own organization can take advantage of them. The way scouts work has been revolutionized by the book 'Moneyball' (Lewis, 2004) that tells the story of a low budget baseball team beating top teams by using statistical tools. Since its publication, the use of advanced data gathering tools and the use of statistical methods to find talented undervalued baseball players has become standard (Schumaker et al., 2010).
The goal of this dissertation is to investigate the possibilities of developing a computer-aided system to assist scouts in professional road cycling to find talented new riders that need further training/experience but who are judged worthy of that effort and expense for the potential future payoff. Developing such a system goes hand in hand with finding an answer to two crucial questions.
How to develop an accurate future payoff or success indicator of a rider? Is CQ a suitable measure, or do we need to improve it for scouting purposes?
How to predict future elite rider performance based on player characteristics/race results of junior riders?
These two critical questions are the main research questions of this dissertation. In order to be able to create a nuanced and innovative research into these questions, a thorough understanding of the current scientific debate must first be created. This is done by means of the literature review that contains a critical processing of relevant leading scientific and original publications.
PART II
The aim of this literature review is to briefly summarize and critically analyze the scientific research that is related to the main research questions of this master dissertation, which provide the foundation for the research part of this master dissertation. In brief, this master dissertation considers two research questions that should enable scouting top talent in professional road cycling.
The first research question is how to define the future success or payoff of a rider. As cycling has multiple ways to achieve success, there will also be multiple performance measures for different types of riders. Because there is only little academic research on this topic, it is necessary to take a closer look at other types of sports where performance measures are often used to define success. This is the main topic of Chapter 3 on performance measures in sports.
The second research question is how to predict future elite rider performance based on player characteristics of junior riders. To get a better understanding of predicting future performance in cycling, this literature review looks at how scouting and performance analysis are performed in other types of sports. It gives the two different types of scouts, explains the difference between quantitative and qualitative scouting, and briefly covers the main advantages of computer aided scouting. This is the main research topic in Chapter 4 on scouting in sports.
Since the literature on scouting in cycling is sparse, a third chapter of this literature review broadens the scope by reviewing how data analysis and performance measuring have already been applied for cycling. It shows the differences between cycling and other team sports and will try to explain which gap in cycling literature this master dissertation tries to fill. This research topic can be found in Chapter 5.
3 PERFORMANCE MEASURES IN SPORTS
“If we have data, let’s look at data. If all we have are opinions, let’s go with mine.”
Jim Barksdale
3.1 A brief history of performance measures in sports
Before the rise in popularity of data mining and knowledge management, decisions in sports organizations were based purely on experience and intuition (Schumaker et al., 2010). A strong feel for the game therefore distinguished good scouts, coaches and general managers from bad ones. The increasing economic importance of decisions made by organizations (Lewis, 2004), however, led to a shift in the way franchises handled their business (Schumaker et al., 2010).
From the beginning of the 20th century, large amounts of data were collected and teams started
creating in-house databases in order to get a better overview of this potential new source of information (Fullerton, 1912; Rickey, 1954). However, it was only in the 1970s that the number of scientific publications strongly increased, indicating the growing awareness concerning the topic of sports data (M. B. Wright, 2009).
In order to get an advantage over competitors, organizations introduced data mining and knowledge management, which seemed to suit this type of environment perfectly (Schumaker et al., 2010). Linoff and Berry (2011) define data mining as the tools and techniques that extract knowledge from large amounts of data. Schumaker, Solieman and Chen (2010) view statistical analysis, pattern discovery and outcome prediction as the three main data mining techniques that can be used in order to make sense of sports data. Knowledge management can be viewed as a multidisciplinary approach to achieving organizational objectives by optimally managing this organization’s knowledge base (Girard & Girard, 2015).
2004). These statistics were very general and did not provide a lot of insight, but they had to start somewhere. Think about number of hits and earned run averages as examples for the game of baseball. Other sports that quickly adopted data collection in order to get more insight in a player’s or team’s performance are basketball and American football. Key statistics for basketball are points, rebounds, assists, blocks, steals and turnovers. Combine these with the number of attempts and you get player or team efficiency scores. Football’s key statistics are touchdowns, receptions, interceptions and gained yards among others (Schumaker et al., 2010).
These traditional statistics, however, do not provide a lot of meaningful insight into player or team capabilities as they do not provide enough context (Solieman, 2006). More high-level statistical analysis is needed in order to come up with meaningful metrics that allow scouts, coaches and general managers to evaluate players in a more objective manner.
The impact of data analysis in sports in general is growing at a fast pace (Schumaker et al., 2010). Almost every sport is about ranking individual players or teams according to certain predefined metrics. Before assessing how data analytics can be used to measure the performance in cycling, it is necessary to take a look at a number of sports where data is already embedded into the core of every competitive team. In the remainder of this chapter, we consider baseball, basketball, American football and soccer.
3.2 Baseball
“The pleasure of rooting for Goliath is that you can expect to win. The pleasure of rooting for David is that, while you don’t know what to expect, you
stand at least a chance of being inspired.” Michael Lewis, Moneyball
When talking about the impact of data analysis on the game of baseball, it is impossible to not start with Moneyball (Lewis, 2004). After Michael Lewis published his book “Moneyball, the art
of winning an unfair game” in 2003, the game of baseball changed forever. One could argue that
the game itself did not change drastically as there were no rule changes, but the game of baseball team management was definitely reinvented as there were drastic changes in the way teams
started scouting undervalued players. Indeed, the main idea of this book is that the measures and statistics that were being used to evaluate player and team performances until then were outdated and needed some serious reconsideration. Billy Beane, general manager of the Oakland Athletics, a team with one of the smallest budgets, started evaluating and attracting players in a purely data-driven way instead of giving the edge to subjective scouts that only made use of their skills and gut feeling when it came to acquire new talent. This new way of analyzing baseball did not go unnoticed as the Oakland Athletics had an unbelievable 2002 season, winning 20 games in a row. Billy Beane subsequently was offered a contract by the Boston Red Sox, one of the league’s biggest teams, which he declined.
This was the start of a data-driven revolution within the Major League Baseball (MLB), where currently all contenders have an R&D team that has data analysis as their main priority (Solieman, 2006). This team of data analyst does not just have the responsibility of scouting and analyzing before or after games. They also play a big part in in-game decisions. Gartheeban and Guttag (2013) show with their research how much impact a simple machine learning model can already have in predicting and therefore controlling the performance of a pitcher.
According to Chang and Zenilman (2013), valuation methods performed on the MLB have evolved from observable player traits and counting statistics to a more advanced statistical foundation. Their results indicate that the Moneyball theory has had a lasting impact on both player valuation in the MLB and the evolution towards more advanced statistical tools in order to measure performance objectively.
The data revolution in baseball is often referred to as “Sabermetrics”, which is an acronym for the Society for American Baseball Research. The huge increase in the amount of performance measures creates the challenge of thoroughly analyzing which measure has a significant impact for a certain purpose, and which one is nothing more than an overcomplicated representation of an older conventional measure (Beneventano et al., 2012). Beneventano, Berger and Weinberg state that relatively simple multiple regression models are very strong in measuring the
measures. They conclude that the rise of different quantitative performance measures will have a significant impact on how the game of baseball will be played in the very near future. This conclusion can be very interesting with regard to modeling performances for cycling in this master dissertation. Do not start by applying difficult models but start by assessing more basic models.
3.3 Basketball
“Someone created the box score, and he should be shot.” Daryl Morey
The basketball equivalent to baseball’s SABER is APBR, the Association of Professional Basketball Research. The APBRmetrics movement believes that objective basketball metrics cannot be based on individual statistics (Solieman, 2006). They go even further, and their research has shown that individual players with impressive numbers in terms of points, rebounds and assists can actually have a negative impact on their team’s success.
In order to get a better understanding of how well a basketball player actually performs, a lot of more-advanced statistics for the game of basketball have been created throughout the years. Some of the most important and widely used ones (Schumaker et al., 2010) are listed below.
Player Efficiency Rating (Hollinger, 2002) is definitely one of basketball’s more advanced statistics
that is very often referred to by analysts and coaches in comparing different players. Broadly speaking, it is an indicator of a player’s efficiency per minute played. Hollinger (2002) created this measure by applying a formula which is quite complex. The main idea, however, is that it takes into account both positive and negative contributions from a player. He states that it is the best metric when trying to compare players that play on very different teams. Its beauty lies in the fact that it enables analysts to compare players from different eras by just one number.
Win-Shares (Oliver, 2004), is an estimate of the number of wins, contributed by a player.
attempted field goals, turnovers, etc. The number of wins by a team during a season, is thus the sum of all the win-shares of all players on this particular team. It can thus reflect on how much impact a player has for his team. This measure has recently gotten a lot of critique because of the growing awareness of a player’s usage rate. This metric is an estimate of the percentage of team plays used by a player when he was on the floor. Players that dominate the ball more, can more easily pad up stats (Oliver, 2004).
True Shooting Percentage (Piette et al., 2010) is a measure of a player’s shooting efficiency, taking
into account 2pt attempts, 3pt attempts and free throws. It gives analysts and coaches a better view on which players can consistently take good shots as it gives a single-number outcome. Piette, Anand and Zhang (2010) further propose to use clustering techniques to see how players compare to their cluster center as a baseline. In order to get even better accuracy on their performance measures, they developed new variations of shrinkage and smoothing.
These are only a few of the many advanced metrics that are being used frequently by basketball analysts and coaches to add to their eyeball test in order to get a better sense of which players perform better than others.
This huge increase in data-availability and the way coaches now statistically analyze, has revolutionized the game of basketball. One of the best examples to indicate this change is the increase in number of three-point shots taken. Through analyzing shot zones (Solieman, 2006), coaches noticed that certain zones were significantly superior compared to others. Outside shots from just beyond the three-point line seem to generate more points in the long run (Goldsberry, 2012). Goldsberry (2012) believes that visual and spatial analysis will be key when it comes to future NBA analysis, and that it can improve multiple aspects of the game, especially shooting.
3.4 American football
et al., 2010), and the small number of individual player statistics that are being gathered (Solieman, 2006).
However, there exists a Professional Football Researchers Association (PFRA), founded in 1979, that performs research on the opportunities of statistical analysis in football and publishes articles on methods of performance measurement. By regularly writing articles on the topic of statistical analysis in football and the National Football League (NFL) more specifically, they have played a big role in raising awareness around the data movement in football (Solieman, 2006). Every team in the American National Football League, nowadays has some statisticians on its payroll (Zhu & Mcdermott, 2013). Their main focus lies in creating and applying insightful advanced performance measures in order to objectively evaluate players and hand coaches the information that is required to optimally prepare for a game. The most widely accepted performance measures as listed by Schumaker et al. (2010) are listed below.
Defense-Adjusted Value Over Average or DVOA is a performance measure that enables analysts
to compare different plays as it considers each play to be a discrete event (Schatz, 2006). It takes into account the time remaining, the down, the distance to the next down, the field position, the current score and the opponent’s quality. The value of this metric is that it enables scouts, coaches and analysts to look at the value of a play without having to take into account which players contributed to it (Zhu & Mcdermott, 2013). It can thus also indicate that a failed play might not completely be the responsibility of a certain player or the other way around.
Defense-Adjusted points above replacement or DPAR is a player-oriented performance measure
that estimates the added point-value that a certain player adds to his team (Schatz, 2006). A DPAR of +3.1 means that this player’s team is expected to have 3.1 points more when he is in the line-up, compared to the situation where this player is left out of the line-up. This measure takes the whole season into account and enables scouts, coaches and analysts to compare players that compete for a certain spot in the line-up.
Adjusted Line Yards or ALY is a metric that estimates which part of a carry is a player’s merit and
which part is due to the help of his teammates (Schatz, 2006). This performance measure allows scouts, coaches and analysts to distinguish impactful from less impactful players.
The interested reader that wishes to read more on advanced performance measures for the game of American football and their underlying ideas, is advised to read “The hidden game of football: The next edition” (Carroll et al., 1998).
The National Football League has its own series of tests that are designed to assess the skills of young college players. This event is called the NFL Combine and it is held each spring in order for teams to get a better understanding of the capacities of certain prospects (Kuzmits & Adams, 2008). The fact that these tests are standardized and have not changed over the years, creates a lot of opportunities for applying data analysis. Kuzmits and Adams (2008), however, conclude that there is no consistent statistical relationship between NFL combine tests and professional football performance. They suggest to improve the combine by including more rigorous psychological tests and the examination of collegiate performance as a job sample test. Robbins (2010) concludes his research by advising the NFL to revise the combine test battery to reflect the physical characteristics it deems important.
3.5 Soccer
The book “Data Analytics in Professional Soccer” (Link, 2018) divides the different fields of data analytics in soccer depending on the user group. They consider tactical match analysis, psychology and economics among others.
Tactical match analysis can be either self-oriented or opponent-oriented. Finding weaknesses
based on previous games and training and trying to eliminate them, is essential in staying competitive (C. Wright et al., 2013). The right performance indicators can lead to finding evidence on strengths and weaknesses or can give clear indications on which strategy a team should
Another field where data analytics has been growing rapidly in the world of soccer is the
physiological field (Dvorak et al., 2000; Mujika & Padilla, 2003). Mujika and Padilla (2003) showed
the effectiveness of applying empirical measures in order to get a better sense of which training programs work and which do not. Dvorak et al. (2000) highlight the growing importance of getting feedback from medical departments to estimate the risk factor of getting potential injuries when performing specific types of training.
The use of data analytics on soccer’s economic market is essential as transfer sums are skyrocketing and the search for young, undiscovered talent becomes essential in trying to keep up with financially superior teams (Buraimo et al., 2015; Simmons, 2007). In order to do this, teams will need to practice effective contract management by objectively estimating the value of a player (Buraimo et al., 2015).
Other fields of importance are media coverage, bookmakers, fraud detection, betting and
development and validation of new approaches as scientific research (Coleman, 2012; Link, 2018).
Soccer, just like other sports where the importance of data analytics is growing, has its own performance measures that allow analysts to evaluate individuals in a team-oriented game. Similar to the one in basketball, Hvattum (2019) created a plus-minus score for soccer, which looks at how effective a team is with a certain player on the field. Research by M. Hughes et al. (2012) emphasizes the importance of having different key performance indicators (KPIs) for different types of soccer players. They considered seven groups, ranging from goalkeepers to strikers, and defined several KPIs for five specific category sets: physiological, tactical, technical-defending, technical-attacking, and psychological. Having too much performance measures can often lead to different perspectives while analyzing the same data. In an attempt to create a single metric that enables analysts to compare different players at all positions on the field, McHale et al. (2012) created the EA Sports Player Performance Index (PPI) which is the official rating system of the English Premier League. The algorithm behind this ranking system is not public, but it takes into account winning performance, player performance per match, appearances, goals scored, assists, and clean sheets.
4 SCOUTING IN SPORTS
“If you haven’t found it yet, keep looking. Don’t settle.” Steve Jobs
This chapter reviews the current literature on scouting in sports and tries to define the concept of scouting. First, there exist different types of scouts that each have a different purpose for the organization. A second important aspect of scouting is the difference between quantitative and qualitative scouting. Successful scouting often stems from doing both. This literature review on scouting ends by diving more deeply into computer aided scouting tools, which have been on the rise for some years now.
4.1 Types of Scouts
An informal definition of scouts in professional sports is defined by Wikipedia as “experienced talent evaluators who travel extensively for the purposes of watching athletes play their chosen sports and determining whether their set of skills and talents represent what is needed by the scout's organization” (“Scout (sport),” n.d.).
More formally, Schumaker et al. (2010) state that in general, there exist two main types of scouts. A first type of scout considers the process of finding a specific type of athlete as main objective. This athlete should possess a set of skills and talents that represents what is needed by the scout’s organization. A second type of scout analyzes opposing teams to gather information about player weaknesses and teams' strategies. The former will typically focus on individual junior prospects, whereas the latter will analyze the behavior of teams and their strategies as a whole (Boon & Sierksma, 2003).
4.2 Qualitative vs Quantitative Scouting
“The most dangerous phrase in the language is: We’ve always done it this way.”
Grace Hopper
As previously mentioned, scouts from the past relied mostly on qualitative (more intuitive) methods instead of diving deeper into the existing numbers. The current trend of data being available to a very large public through the internet, shifted the power of analyzing games to fans and next generation scouts (Schumaker et al., 2010). Despite this shift, there is still a lot to improve in terms of analyzing in a more objective manner (Boon & Sierksma, 2003; Solieman, 2006).
Solieman (2006) sees two main causes for this observation. The first one is sports organizations (and organizations in general) being resistant to change. Very often, they lack the required knowledge or skills that are needed to be able to change the way they work. The phrase “we have always done it this way” is very familiar to these organizations. The second cause is more in line with the competitive nature of sports in general. In order to become or stay competitive, teams that make use of certain techniques will not be eager to share their obtained knowledge with their competitors. The rise of open source information, as stated by Hedgebeth (2007), could however start to emerge in sports environments as well. Organizations in all kinds of environments have embraced the open source movement and believe that the benefits will outweigh the threats in the long run.
The main advantage of qualitative analysis, as stated by O’Donoghue (2009), is that the data should not be in a fixed form or bound to a preordained set of events. The benefit of quantitative data, on the other hand, is that it makes decision making more objective and therefore more robust. Nelson & Groom (2012) present a dialogue where multiple perspectives are taken into account when it comes to evaluating athletic performances. They conclude that the coexistence of qualitative and quantitative evaluations would present itself as the optimal way of analyzing athletic performance as they would both benefit from each other’s insights.
It should be noted that there is often an underestimation of the importance of qualitative research in any domain, not just in sports analysis. O’Donoghue (2009) believes that qualitative research adds a lot of value, is work-demanding and requires creative skill and a profound understanding of the topic. Qualitative knowledge can be viewed as expert knowledge that is crucial in interpreting quantitative results or validating quantitative models. The next section on computer aided scouting tools is a perfect example of how qualitative and quantitative knowledge can be combined in order to create value.
4.3 Computer Aided Scouting Tools
Because of the lack of knowledge concerning the topic of statistical performance analysis and more advanced technological trends, there have been opportunities for individuals to create niche tools that are easy to implement and that create a lot of added value for organizations seeking a competitive edge (Schumaker et al., 2010).
As it is hard to obtain information on in-house systems used by teams, it is more interesting to take a closer look at some third-party scouting tools that have been created and sold over the years. We will look at tools that are mentioned by Solieman (2006), O’Donoghue (2009) and Schumaker et al. (2010).
• Advanced Scout (IBM)
Advanced Scout (AS) is often referred to as the first scouting tool with a real impact in the NBA. In the 1990s, more than half of the NBA teams used the software to discover interesting patterns in game data. Although it should officially be classified as a tool for data mining and knowledge management (Schumaker et al., 2010), it is definitely a tool that has its value in the scouting process. The tool distinguished itself through the underlying technique of attribute focusing (Bhandari et al., 1997).
discover meaning in the massive amount of statistics generated during sporting events” (p. 1). Over the years, a lot of tools and applications have been created for sports data visualization by companies or individuals inspired by SportVis.
• Digital Scout
Digital Scout was founded in 1995 and is still a very active scouting tool that can be used by coaches, players and fans. It offers its many users the possibility to analyze opponents and trends at any time, both during and after the game. It was one of the first electronic tools to collect statistics of a variety of games (Schumaker et al., 2010).
• Current state-of-the-art
The increase in technological possibilities has led to the application of advanced techniques like notational analysis (O’Donoghue, 2009). Notational analysis inspects pattern movement and is especially useful for field sports. It has evolved from handling records efficiently to powerful match analysis generated from game footage. A state-of-the-art scouting tool that is currently being used by top NBA teams, media companies, and sports betting services is Stats Perform. Its success is based on its AI-powered player tracking system. Based on the data it generates, it can make quite accurate predictions and in-depth performance reports on individual players as well as teams (https://www.statsperform.com).
5 PROFESSIONAL ROAD CYCLING
Scouting in professional road cycling is often done by Riders’ Agents (RAs). A rider’s agent can be seen as someone who represents a rider, or an intermediate person that handles a rider’s business. They are often the ones that discover talented riders and try to match these young athletes with teams. There exists little to no literature on the impact of these agents, and Van Reeth and Larson (2015) believe that their scouting role in cycling is still not obvious in comparison to other worldwide sports. They state, however, that “the development of cycling in new regions such as South America or Africa should encourage the development of the need for agents’ ability to detect talent” (Van Reeth & Larson, 2015, p. 161).
This increase in scouting ability can be triggered in various ways. An important aspect of performance development is making use of emerging technologies. Research on the topic of emerging technologies in sports by Petrović et al. (2015) found that there are numerous information and communication technologies (ICTs) with a lot of potential in adding value to the field of sports events. The implementation of these digital technologies will help organizations with their decision-making processes, as these will become more objective, accurate and robust (Hilmkil et al., 2018).
The topic of data analysis in the field of professional road cycling can be divided into two large subgroups. Physiological research concerns applying data about biological characteristics of riders, whereas result-driven research tries to find patterns in event records. As this master dissertation is about analyzing results, we will only briefly touch upon the topic of physiological research in this literature review. Although it is clear that incorporating physiological aspects could generate better results, this research tries to explore the opportunities that lie in outcomes of races. Combining both groups is only something that should be considered once these individual aspects have been researched extensively.
5.1 Physiological Research
“Hoe sterk is de eenzame fietser die kromgebogen over zijn stuur tegen de wind, zichzelf een weg baant?”
Boudewijn de Groot
In comparison with the 20th century, a lot of physiological research has already been done in the
first two decades of the 21st century (Van Reeth & Larson, 2015). As cycling and famous cycling
events like the Tour De France require extremely high physiological performance from riders, it is obvious that a profound knowledge of the underlying biological processes gives a clear competitive advantage to any rider that wants to perform better that his opponents (Lucia et al., 2003).
The four characteristics that most accurately predict a rider’s cycling potential, as stated by Faria
et al. (2005a), are the following: Maximal Oxygen Uptake or VO2max, Peak Power Output as a
predictor for a rider’s endurance, Efficiency which expresses the increase in aerobic metabolism and muscle power output, and Breathing pattern. Knowing which characteristics make a difference, provides riders and their coaches with interesting information in order to evaluate and adapt training schedules. Science-based training programs have changed the landscape of professional road cycling drastically as riders nowadays tend to peak more to specific races during the season instead of trying to win every single race (Lucia et al., 2003). Without the required physiological research, this prescriptive analysis would definitely not have been as obvious as it is now.
These biological characteristics are definitely not the only factors that impact cycling performance. Faria et al. (2005b) also tackle Aerodynamics, Equipment configuration, Pedaling
cadence, Cycling economy, Cycling intensity, Muscle recruitment, and Altitude acclimatization
5.2 Result-based Research
“Not everything that counts can be counted, and not everything that can be counted counts.”
William Bruce Cameron
Cycling data can be classified into three different groups. The first group contains the final ranking or outcome of a race. The second group consists of cycling logs that contain within-race information like which riders are in the front of the race, which riders attack at what time during the race, etc. The third group contains video recordings. In general, a higher level of data implies more context. While other sports are shifting from level two towards level three by applying advanced machine learning techniques, cycling is still learning how to significantly implement the first two levels.
This is because measuring performance in cycling is not a straightforward task. Cabaud et al. (2016) list six causes that make cycling so uniquely different compared to other team sports.
1. Although cycling is officially listed as a team sport, the ranking and rewarding systems are mostly based on individual performances;
2. Different riders or teams might have different goals. Not all teams will try to maximize their number of UCI points. Other disciplines of team sports like soccer and basketball will typically have one big goal like winning ‘the championship’;
3. Different riders typically have different goals that change over the span of their careers; 4. It is hard to evaluate the performance of a domestique. Domestiques work for the team’s
leader in order to get him in the best possible position during the race;
5. Strategic interactions between opposing teams or riders play an important role but are hard to quantify;
6. Efficiency versus Efficacy. Efficiency compares outcome with the effort that has been put in by the rider, whereas efficacy compares outcome with the objective. This difference indicates the difficulty of modeling cycling performance.
Despite these difficulties, numerous efforts have been taken by multiple authors to define performance measures for cycling (Van Reeth & Larson, 2015). Olds et al. (1995) created a first model that tries to model performance in cycling. Although it was mostly based on physiological aspects of riders, it showed that applying mathematics can create various insights in determining which features are key for a rider’s potential. Olds (1998) later came up with a model that tries to predict the winning chances of a break away.
Cherchye and Vermeulen (2006) created an ordinal information approach that ranks riders from different eras. An ordinal ranking system has as output a list where the order matters, but not the difference between values. They conclude, in their robust approach, that Eddy Merckx, Bernard Hinault and Lance Armstrong are the best riders in the history of the Tour De France. They obtained this result by taking into account various variables like number of stage wins, number of yellow jerseys, number of green jerseys, etc. Tour De France data has also been used by Rogge et al. (2013) to get an idea of which teams are efficient and which are not. They conclude that teams that focus on the general classification are often more efficient than teams that focus on sprint stage wins or a mix of both wins and classification.
The methodology behind these outcomes is, as stated by the authors, based on an intuitive compensating principle. This more practical method applies an ordinal, more robust, approach instead of a cardinal approach where it is often not clear how the performance aggregation function should be specified. It should, however, be noted that cycling has evolved tremendously over the years and riders now focus more on specific types of races or stages because of the rising competitiveness. It is thus not easy to compare riders from different eras with each other. Another interesting aspect of their research is how they define team success during the Tour De France. Three variables are being used to measure this success: CQ points earned, prize money, and number of prizes won.
Intermezzo: CQ points
Cycling Quotient or CQ is a world ranking of professional road cyclists that reflects the performance of a rider in the last twelve months (see https://cqranking.com). The ranking was introduced by the organizers of the fantasy sports competition Gigabike (see https://gigabike.be), when the UCI abandoned their UCI-ranking while introducing the ProTour
in 2005. More important races, as categorized by the UCI, are being rewarded with more CQ points. Beliën et al. (2011) state that this CQ value reflects the past quality of a rider and they believe that it might be an accurate indication for his future performance.
Building on this notion of using CQ points as a measure of success in cycling, Rodriguez-Gutierrez (2013) broadened the scope of just looking at results from the Tour De France. He adjusted the number of CQ points obtained by a rider during the course of a season, by taking into account the number of kilometers or number of race days by that rider. This approach allows to compare different riders with each other, even if they did not participate in the same races.
Schumacher et al. (2006) performed both a prospective and a retrospective analysis of major junior and elite race results between 1980 and 2004. The purpose of their study was to discover how former junior riders would perform in the elite class later in their careers. The prospective part looks at all junior riders and gathers data about them as their careers progress. The retrospective part considers all elite riders and looks back at how these performed in their junior careers. This research found significant results and stresses the importance of long-term training programs in the development of peak performance in cycling. The authors started their methodology by creating the categories Winner, Podium, Top Ten, and Participation. Based on these categories, this research tries to find differences between two groups: riders that did participate in junior races and riders that did not. Age-related aspects of riders were analyzed as well, but without finding significant differences between the two groups. Besides making use of descriptive statistics, differences between the two groups were being examined by making use of chi-square tests and t-tests. Results were only recognized as being significant at a P-value below one percent. It should thus be noted here that this research did not create a predictive model but focused more on describing cycling data by making use of descriptive statistics.
5.3 Gap in Literature
In reviewing the current literature on cycling, it becomes clear that there is currently no consensus on how to define future payoff or success of a rider. This question is not so trivial since many types of riders exist that all have their own qualities. Sprinters will focus on winning flat stages while climbers will try to put their best efforts in the mountains. The first research question of this master dissertation evaluates the existing Cycling Quotient (CQ) and tries to improve it in order to be beneficial for scouting purposes.
Another current shortcoming in the existing literature on cycling is the unanswered question of how future elite rider performance can be predicted based on available characteristics of junior riders. This master dissertation tries to answer this question by applying machine learning techniques on race results from the past twenty years.
PART III
RESEARCH
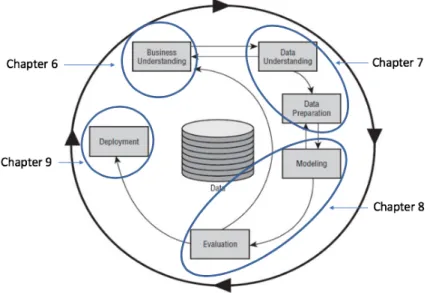
The remainder of this master dissertation is organized according to the CRISP DM model. The Cross Industry Standard Process for Data Mining is a structured model that can be applied to all kinds of data mining projects (Wirth, 2000). Figure 1 clearly expresses the fact that data mining is an iterative process which requires to go back and forth between different steps in order to construct the final model as fitting as possible. Therefore, some of the following chapters will overlap to a certain extent, as there are no definitive boundaries between them.
Figure 1 Research outline according to CRISP DM model (Wirth, 2000)
Chapter 6 deals with the phase of business understanding by emphasizing the economic relevance of this research, as it tries to give the reader of this dissertation a better understanding of cycling as a business.
Chapter 7 covers both the data understanding and the data preparation phase. It offers an extensive description of the data that is used throughout this research. Some interesting insights are highlighted by means of descriptive analytics. The importance of the data understanding step is often underestimated. It is, however, crucial to explore the available data in order to discover which methods of analysis are applicable. The data preparation section is rather limited as its main goal is to construct a final dataset that will be used in the modeling part. The reader who wants to review this part more in depth, is recommended to inspect the R-code that can be found in the online appendix (Data.R).
Chapter 8 covers modeling and evaluation. Various predictive models are trained to learn from a set of input variables to predict how a group of riders will perform in their first year as
professionals. The different predictive models are evaluated on the basis of predictive accuracy.
Chapter 9 is about the deployment of our results. The best models will be applied to predict how a certain group of riders will perform as first year professionals after having completed their U23 careers. So, this chapter makes a prediction about which riders are most promising by applying the best models from Chapter 8 on a set of unseen data which contains information on riders that finished their U23 career in 2018. This chapter will be covered in part V.
All models, figures, plots, datasets, etc. of this master dissertation were created using the R
software package in the open source RStudio environment. R provides objects, operators, and
functions that make the process of exploring, modeling, and visualizing data more natural. The R Core Team (2015) explains the main advantages of their statistical tool for data analysis as follows: It is open source; flexible as it has a wide variety of data structures; available on most operating systems; and functional because of its many available packages (more than 10,000 packages are currently available).
The reader who wants to review the R code that was created for this research, can find it in the online appendix. An overview of all uploaded R scripts and R data frames can be found in Appendix A.
6 BUSINESS UNDERSTANDING
After reviewing the existing literature on applying data analysis in sports environments, we can conclude that there is a strong case for developing a computer-aided system to assist scouts in professional road cycling to find talented new riders. Just like scouting systems in other sports, the computer should be able to generate a list of riders that have high potential, based on data gathered by the scout’s organization. These young riders would obviously still need further training and experience in order to get them over the hump, but the essence of this scouting tool is that it would make a scout’s job more efficient. It can be viewed as a first step in the process of selecting a handful of new riders to add to the team. One of the reasons behind the importance of discovering talented riders as soon as possible, is the fact that transfers in cycling are not as common as transfers in other sports (Van Reeth & Larson, 2015).
This new research is mainly driven by the findings of Schumacher et al. (2006) which show the importance of long-term training programs in the development of peak performance in cycling, and a data-driven trend in sports scouting in general (Schumaker et al., 2010). In order to stay competitive, cycling organizations will constantly have to reinvent themselves and look for opportunities that can be found in places like science and information technology.
The economic relevance of this research lies in the fact that cycling organizations have very limited income resources and therefore need to work as efficient and effective as possible when it comes to managing resources. Especially in times like these (i.e. COVID19 hiatus) when it is not a straightforward task as an organization with limited resources to keep one’s head above water.
7 DATA
“You can have data without information, but you cannot have information without data.”
Daniel Keys Morgan
We start by informing the reader on how we acquired our data. This chapter proceeds by covering the existing data structures and tables that are a part of our database. It allows us to take a closer look at how we can structure and manipulate the data in order to prepare it for analysis. Important data structures are described by means of descriptive statistics in RStudio. This chapter ends by covering the data manipulation or data preparation part where the main goal is to create a base table containing all variables, dependent (response) as well as independent (predictor) variables. The aim is to provide enough variables in order to accommodate as much information as possible in the modeling part (see Chapter 8).
7.1 Database
Two databases with a lot of overlapping information were available for conducting this research. The first one is a CQ (Cycling Quotient) database, whereas the second one is a PCS (Pro Cycling Stats) database. CQ (Appendix C) and PCS (Appendix D) points are both measures for the performance of a rider in a specific race year. Both measures are based on the official UCI points system of grading cycling performance. As one of the challenges of this dissertation includes defining a good performance measure for cycling, it is therefore interesting to incorporate all three measures into our base table. Although both databases contain similar information, the CQ database is more useful for our analysis as it contains more information on riders and races. We will therefore focus on the data that is available in the CQ database and add the PCS points from the PCS database to it. Note that the PCS database that we obtained does not contain all public information that is currently available at https://www.procyclingstats.com, which is why it is less useful than the CQ database.
7.2 Data Understanding
The CQ database contains 94 tables. A table in a database can be viewed as a collection of related data. It is constructed like a matrix with a specific number of columns (one for each variable) and one row per observation. A lot of these 94 tables in the CQ database contain information that can be found in other tables as well. Therefore, we will only mention those tables that are used in further stages of our data mining approach and that are required to understand this research. Note that every table’s name starts with ‘dbo’ which is an abbreviation for database owner.
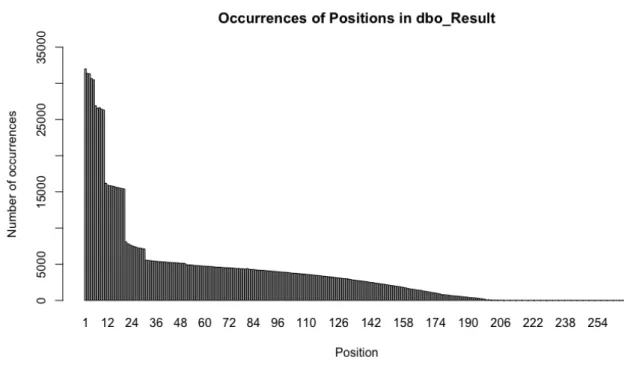
dbo_Result
The CQ database contains 1,069,257 race results from 1992 to 2019. Not all years contain the same number of results. This lack of data for certain years is one of the reasons that we will work with a time window (see further). Figure 2 represents the number of occurrences of a race year in the dbo_Result table. Note that this database was created mid 2019, which is why it does not contain a lot of results from 2019.
Figure 2 Number of results per year in database
Each row in this table indicates the position of a specific rider in a specific race. Moreover, it indicates how many UCI points the rider was awarded for obtaining this result. Other information
that can be found in this table is the rider’s team, the time difference with the rider that finished first in that specific race, and the rider’s nationality. There are 25,132 unique riders in these results. Interestingly, only 29% of all results were rewarded with UCI points. One disadvantage that should be noted is the fact that not all races are represented by their complete outcome. Most races have a top 20 ranking, but only a limited number of races contain all participants and their respective results. This lack of data thus keeps us from knowing in how many races a rider has participated, which will have to be taken into account in the data preparation section (see Section 7.3).
Based on this dbo_Result table, we will be able to compute variables such as number of wins, number of top 3 finishes, number of top 5 finishes, number of top 10 finishes, etc.
dbo_Rider
The dbo_Rider table contains all 28,538 riders that appear in the database. Every rider has a unique identification number called RiderID, his full name, an official UCI code that contains his nationality and his date of birth (e.g. ESP19800425 for Valverde Belmonte Alejandro), and some other details that were not useful for further analysis. As Figure 3 points out, there is a lot of variability in the number of riders between different countries. By zooming in on the fifteen most represented countries in our database (see Figure 4), we can see that Italy tops the list with 1,869 riders.
Based on this dbo_Rider table, we will be able to compute age and nationality related variables such as the age at which a rider started his U23 career, and a boolean variable that indicates whether a rider is born in Europe.
Figure 3 Number of riders in database per nationality
Figure 4 Fifteen most represented countries in database
dbo_Race
The dbo_Race table contains more information about a specific race. Every race has a unique id,
RaceID, which can be used as a foreign key to link the tables dbo_Race and dbo_Result. All of the
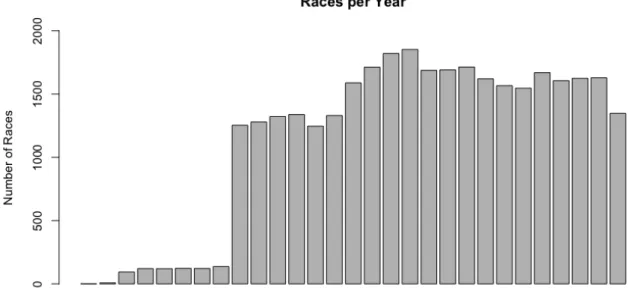
Vlaanderen will thus have a different id than the 2019 Ronde van Vlaanderen. Besides an id, every race has a distance, a date and some boolean variables, indicating whether or not the race was a sprint stage (16.52%), a time trial (13.23%), a world/national championship (11.66%), a general classification (9.94%), a mountain stage (9.24%), a team time trial (1.06%), a points classification (0.83%), or a king of the mountain classification (0.82%). Unfortunately, not all races are classified as one of these types. Almost 44% of the races are not specifically defined. Note that some races are classified into multiple groups. A ‘World Championship Individual Time Trial’, for example, is both a championship and a time trial. A last important variable that can be found in the dbo_Race table is CategoryID. This variable is a foreign key that allows us to link dbo_Race with dbo_Category. Figure 5 gives an overview of the number of races per year in our database. From 2006 onwards, the number of races per year does not vary that much anymore.
Figure 5 Number of races per year in database
Based on this dbo_Rider table, we will be able to create variables that contain information about types of races, such as the number of top 20 finishes in a sprint stage, the number of top 20 finishes in a time trial, etc.
dbo_Category
Every race from dbo_Race that occurs in dbo_Result is categorized. All categories have a certain importance, which makes it possible to distinguish between more and less important races. Another major advantage of analyzing categories is that the name of a category tells us whether it is a U23 (Under 23) race or not. This enables us to classify a rider as U23 or not in a specific year. An overview of the number of different categories per year can be found in Figure 6. Again, this figure indicates that not a lot of data is available for years prior to 2007.
Figure 6 Number of categories per year in database
dbo_AA_CQ_Ranking_Year
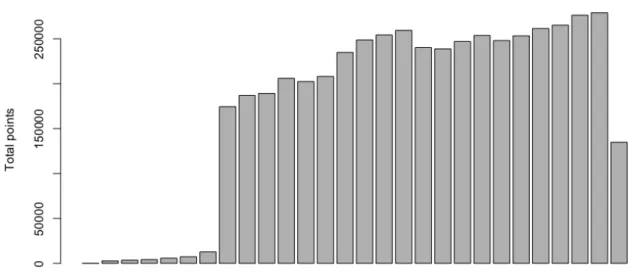
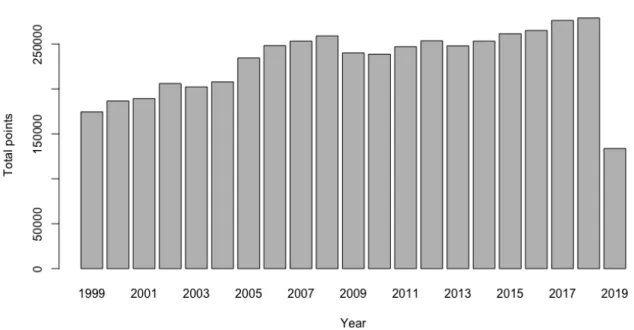
This table gives an overview of all final UCI rankings from 1999 up until 2019. The ranking is based on the sum of UCI points that a rider scored in a specific year. As Figure 7 shows, the total number of UCI points that is awarded in a specific year is not the same every year. This trend can also be found in the evolution of CQ points and PCS points (see further).
In order to compare riders who raced at different moments in time, we would thus need to standardize the obtained points, so every year has equal importance. Although the impact of applying this standardization will not be too drastic as we will be working with data from 2007 until 2018 (see further), it should be noted that winning the Tour De France in 2010 would thus
be awarded with more points than winning it in 2018. The assumption behind this reasoning is that riders would have had more opportunities to score points in 2018 compared to 2010. We are aware that this is a fairly drastic assumption, which can definitely have an impact on our final results. Therefore, we will only standardize CQ points and PCS points. The UCI points obtained by a rider in a certain year will stay untouched.
Figure 7 Number of awarded UCI points per year
dbo_RnkRiderCQ, dbo_RnkRiderKm, dbo_RnkRiderRaceDays, dbo_RnkRiderVict
These four tables each contain one important piece of information. They link most riders from our database to their CQ points, number of raced kilometers, number of raced days, and number of victories in a certain year. The kilometers and race days should, however, be analyzed critically as they do not appear to be complete. It should be noted that these tables have data records that only start in 1999. The trend of increasing points from Figure 7 can also be found in Figure 8, which compares different years with each other based on the number total CQ points that were awarded that year. As mentioned, CQ points will be standardized.