Report 500035003/2005
Caps and Fences in Climate Change Policies
Trade-offs in shaping post-Kyoto
JC Bollen*, AJG Manders*, PJJ Veenendaal**
This report contains an erratum d.d. 09/08/2005 on the last page
This investigation was performed with the support of the Dutch Ministry of Housing, Spatial Planning and the Environment as part of the National Climate Change Project M/500035.
Netherlands Environmental Assessment Agency (MNP associated with the RIVM), PO Box 303, 3720 AH Bilthoven, The Netherlands, Telephone : 31 - 30 - 274 27 45; website: www.mnp.nl
* Netherlands Environmental Assessment Agency (MNP associated with the RIVM), PO Box 303, 3720 AH Bilthoven, The Netherlands, email: jc.bollen@mnp.nl; Telephone : 31 - 30 - 274 3610; Fax: 31 - 30 - 2744464; website: www.mnp.nl
** Netherlands Bureau for Economic Policy Analysis (CPB), P.O. Box 80510, 2508 GM The Hague, The Netherlands.
Abstract
Caps and Fences in Climate Change Policies, Trade-offs in shaping post-Kyoto
The Kyoto Protocol represents an initial, small step towards mitigating global warming. Much larger greenhouse gas (GHG) emission reductions will be necessary in the post-Kyoto-era to stabilize atmospheric GHG-concentration levels at a ‘safe’ level. The more ambitious reduction targets that need to be set and the desirability of getting more countries involved makes the establishment of follow-up commitments beyond 2012 a challenging task. Our paper can be viewed as a sequel to a report (Bollen, Manders, Veenendaal, 2004)
documenting the assessment of impacts of a policy scenario in which industrialized countries in 2020 accept emission targets that are 30% below 1990 emission levels. Our aim in this paper is to provide an analysis of additional scenarios over and above this case. In this way, policy makers will be provided with a broader spectrum of alternative post-Kyoto policy scenarios and their implications.
The analyses of the macro-economic consequences of post-Kyoto policies in 2020 reveal the costs of climate policy to be largely determined by three factors: the reduction target, the economic development in the underlying scenario without new climate policies, and the design of policy. The studied policy options in the report are coalitions with (much) less than global coverage, restrictions on emissions trading, full versus limited use of the Clean
Development Mechanism (CDM) and, finally, less ambitious aims, achieved by raising caps or imposing fixed (relatively small) carbon taxes. Alternative tradeoffs between abatement costs and abatement efforts are established and discussed in this context. We show the abatement costs in the benchmark case of a global coalition and unrestricted trade to be relatively modest and conclude that these costs could rise considerably with smaller coalitions. A smaller coalition will induce migration of energy-intensive activities to non-participating countries. CDM may lower abatement costs in incomplete coalitions. Seizing CDM opportunities will reduce emissions only in part due to domestic leakage in the
developing countries. Though carbon tax systems may be as effective in reducing emissions as cap-and-trade systems the compliance costs for countries will be quite different.
Korte samenvatting
Doelstellingen van het klimaatbeleid en beperkingen aan emissiehandel, dilemma’s in de vormgeving van post-Kyoto beleid
Het Kyoto Protocol is een kleine eerste stap naar het stabiliseren van broeikasgassen in de atmosfeer. Na de eerste budgetperiode (2008-2012) van het Kyoto protocol zal de uitstoot van broeikasgassen in toenemende mate beperkt moeten worden om dit te bewerkstelligen. De keuze voor ambitieuzere doelstellingen vergt een toetreding van landen die nu nog geen doelstelling op zich hebben genomen. Dit rapport is een vervolg op van het rapport dat gepresenteerd is op de klimaatdag (30 juni 2004) over de gevolgen van een beperking van 30 procent van de uitworp van broeikasgassen in 2020 ten opzichte van het niveau in 1990. Het doel van dit rapport is een overzicht te geven van additionele analyses, ten einde
beleidsmakers te informeren over de gevolgen van alternatieve post-Kyoto varianten. Dit rapport analyseert the macro-economische gevolgen van post-Kyoto beleid voor het jaar 2020. De kosten van het beleid worden bepaald door drie factoren: het niveau van de
doelstelling, de economische ontwikkeling van het basispad zonder dat er klimaatbeleid wordt gevoerd, en de vormgeving van het beleid. De beleidsalternatieven die onderzocht zijn omvatten coalities die niet alle maar een beperkt aantal landen bevatten, of beperkingen stellen aan de handel in emissierechten, vrije of beperkte toepassing van het Clean
Development Mechanism (CDM), en tot slot varianten met minder ambitieuze doelstelling voor niet-mondiale coalities. De kosten van klimaatbeleid verminderen de economische groei. Deze notitie gaat in op de uitruil tussen economische groei en de beleidsinspanning. De kosten zijn beperkt in een mondiale coalitie met vrije emissiehandel. Maar deze kosten stijgen sterk met kleinere coalities en beperkingen op de emissiemarkt of van de toepassing van CDM. Ook treedt er bij niet-mondiale coalities verplaatsing op van energie-intensieve industrieën naar de landen die geen klimaatbeleid hoeven te voeren. CDM kan de kosten van het klimaatbeleid voor de geïndustrialiseerde wereld aanzienlijk verlagen, maar tegelijkertijd treden er onvoorziene weglekeffecten op van het beleid in de landen waar de CDM projecten worden uitgevoerd. Uniforme koolstofheffingen zijn even effectief als emissiehandel, maar de verdeling van de lasten zijn wel verschillend.
Preface
The Kyoto Protocol represents an initial, small step towards mitigating global warming. In the post-Kyoto era much larger greenhouse gas (GHG) emission reductions will be necessary to keep atmospheric GHG-concentration levels at a ‘safe’ level. Due to the more ambitious reduction targets that need to be set and the desirability of getting more countries involved, establishing a follow-up treaty to the Kyoto Protocol will be a challenging task.
This study can be viewed as a sequel to a previous study that assessed the impacts of a policy scenario, in which industrialized countries in 2020 accept emission targets that are 30% below 1990 emission levels. The aim of this study is to provide an analysis of additional scenarios over and above the previous one, thus providing policy makers with a wider spectrum of alternative post-Kyoto policy variants and their respective implications. This study was carried out jointly by the Netherlands Environmental Assessment Agency (MNP) and the Netherlands Bureau for Economic Policy Analysis (CPB) at the request of the Dutch Ministries of Housing, Spatial Planning and the Environment (Minvrom) and
Economic Affairs (Minez). The authors, Johannes Bollen, Ton Manders (both MNP) and Paul Veenendaal (CPB), gratefully acknowledge the useful suggestions and comments from colleagues and the members of the feedback group. Specifically, they wish to thank Erik Schmersal, Ronal Flipphi (Minvrom), and Klaas-Jan Koops (Minez).
N.D. van Egmond,
Director Netherlands Environmental Assessment Agency (MNP) F.J.H. Don,
Contents
Summary 6
1 Introduction 13
2 Post-Kyoto policy scenarios 15
3 A benchmark case: - 30% reduction for Annex I within a global coalition 19
4 Trade-offs: costs, coalitions and the environment 21
5 Macro-economic consequences for EU-25, the Netherlands, and non-Annex I 23
6 Impacts on energy use in the Netherlands 27
7 CDM and leakage in non-member countries 29
8 Conclusions 33
References 35
Summary
In the post-Kyoto era much larger greenhouse gas (GHG) emission reductions will be necessary to stabilize atmospheric GHG-concentration levels at a ‘safe’ level than the reductions that have been agreed on under the Kyoto Protocol. Due to the more ambitious reduction targets that need to be set and the desirability of getting more countries involved, establishing follow-up commitments will be a challenging task. In departing from the central scenario of a 30% emission reduction by the Annex I countries in 2020 compared to the 1990 levels (see Bollen, Manders and Veenendaal, 2004), this study modestly aims to provide an analysis of additional scenarios over and above this case. In this way policy makers will be provided with a wider spectrum of alternative post-Kyoto policy settings and their
implications. In particular, impacts will be assessed pertained to varying coalition size, restrictions on imports of emission permits, and utilization of the Clean Development
Mechanism (CDM) and of other, often more limited emission reduction targets, as implied by raising emission caps or imposing carbon taxes of limited height.
The assessments are made in terms of policy-induced deviations in 2020 from a baseline that does not contain any post-Kyoto climate change policy. This baseline is a global scenario characterized by relatively high growth rates, called GLOBAL ECONOMY which has been adapted for the Netherlands to reflect the most recent views of the so-called Reference Projection on Dutch developments within the context of this scenario. The consequences of choosing this baseline are twofold. On the one hand, the costs of complying with the policy targets will — because of its relatively high rates of economic growth — be relatively high. On the other hand, the adaptation of Dutch baseline assumptions to the projections contained in the Reference Projection has made the emissions profile for the Netherlands much more modest than the previous one. Hence, our assessment of Dutch compliance costs for the central case becomes more modest too. Whereas Bollen, Manders and Veenendaal (2004) assessed Dutch compliance costs for the central case (0.8% of real national income) to be relatively high within the EU context, this study points to macro-economic costs for the Netherlands that are more or less average (0.5% of real national income).
Unsurprisingly, the study shows that shrinking coalition size —while maintaining reduction targets for its members— raises abatement costs and may reduce environmental
effectiveness. In particular, if EU-25 travelled the post-Kyoto road alone, the
macro-economic costs to the Netherlands would amount to 2.3% of national income in 2020, while global emissions would rise 20% above those of the central case.
If imports of emission permits were to be restricted by requiring that half of the abatement should be achieved domestically, costs could rise in the regions where this restriction becomes binding and fall elsewhere due to depressed import demands. As the Netherlands
rely heavily on foreign abatement to meet their climate change target, Dutch compliance costs will rise (with 0.4% in addition to the 0.5% compliance costs of the central case). Opening CDM opportunities in non-member countries for an Annex I coalition reduces compliance costs on the one hand, but tends to raise global emissions on the other. This is caused by leakage in the host countries.
For example, if CDM is applied to power plants, local electricity prices are likely to decrease. As project funding is at marginal costs, electricity suppliers will make infra-marginal profits. Because of competition these will, in the end, be passed on to consumers in the form of lower prices. Hence, electricity demand will rise and emissions will increase again. Moreover, if the supply of primary energy carriers such as coal is inelastic, the price decrease due to the CDM projects will trigger additional demands in other sectors of the economy. Taking these
impacts jointly, local leakage may amount up to 40% of the direct reductions targeted via the CDM project. However, if CDM projects are also allowed to taker place in other sectors (such as the energy-intensive sectors) leakage may diminish considerably, with substantial cost savings to Annex I.
Less ambitious targets lead to lower costs and higher emissions. For example, compliance costs for a coalition of Annex I countries with a reduction target of 30% would amount to 2% of real national income. If this reduction target were to be halved, global emissions would rise by 6% in 2020 and compliance costs for Annex I would fall by 0.8% of real national income. If the Kyoto targets were to be extended to 2020, and the United States and Australia were to join with ceilings at their 2010 baseline emission level, compliance costs for the current Kyoto partners would actually fall due to new abatement opportunities within the United States. Global emissions in 2020 would rise substantially, however, by more than 25% compared to a 30% reduction for an Annex I coalition.
The impacts of substituting cap-and-trade schemes for uniform carbon taxation are dependent on the divergence between the level of the emission price and that of the carbon tax. Where coalitions are identical, a lower tax rate will reduce costs and increase emissions, while the opposite is true if the tax rate exceeds the price of tradable permits. Ignoring income effects, both schemes would be equally efficient in abating global warming if the time profiles of permit prices and carbon taxes coincided. The distributional impacts may be substantial though. If, e.g., a global cap-and-trade scheme with a permit allocation approximating equal rights per capita is replaced by a global carbon tax, compliance costs will diminish for Annex I countries but become substantial for developing countries. Though the revenues from carbon taxation may be partly used for international income transfers that would make the burden-sharing acceptable to negotiators, domestic pressure to recycle these revenues back into the own economy is likely to prevent such an agreement being concluded.
1.
Introduction
The Kyoto Protocol represents an initial, small step towards mitigating global warming. In the post-Kyoto era much larger greenhouse gas (GHG) emission reductions will be necessary to keep atmospheric GHG-concentration levels at a ‘safe’ level. The point of departure of our study is the aim to bring emissions of industrialized regions in 2020 down by 30% below 1990 emission levels. This aim can be shown to be compatible with the EU ambition to limit the rise of global mean temperature to 2° Celsius above pre-industrial levels.
Bollen, Manders and Veenendaal (2004) showed the macro-economic consequences of emission reductions in Annex I countries of 30% in 2020, compared to 1990 levels, against alternative background scenarios of economic growth. This report can be considered as a sequel to the Bollen, Manders and Veenendaal (2004), again taking a 30% emission reduction in Annex I countries in 2020 as a point of departure, and showing the consequences of
additional, alternative post-Kyoto policy variants1. In particular, we will show the impacts of varying coalition size, restrictions on imports of emission permits, and the utilization of the Clean Development Mechanism (CDM) and of other, often more limited emission reduction targets (less than 30%), either by raising emission caps or by installing a carbon tax of limited height. These findings will provide policy makers with a wider spectrum of alternative post-Kyoto policy options and their implications.
In the first section we will first explain the set-up of the scenarios in more detail and in the second, the approach followed. In section 3 we present the benchmark case of 30% emission reduction by Annex I countries in 2020. Detailed tables of simulation outcomes for each of the scenarios are to be found in the Appendix. Rather than commenting exhaustively on the impacts of each policy scenario in sequence, we will focus on certain impacts. In section 4 we will discuss the trade-offs pertaining to costs, coalition size and emissions, and in section 5 focus on the macro-economic consequences in terms of changes in real national income. The impacts on Dutch energy consumption and its’ composition from different sources will be discussed in section 6. Opportunities to earn credits through CDM will lower compliance costs for the Annex I countries. However, CDM may be rather ineffective from the environmental point of view because of local leakage in non-Annex I countries. Section 7 provides an analysis of the compliance costs and leakages occurring in these policy variants. The final section 8 concludes.
1 Post-Kyoto policy variants concern policies and targets beyond 2012 and are analyzed for the year 2020. This does not necessarily imply an
2.
Post-Kyoto policy scenarios
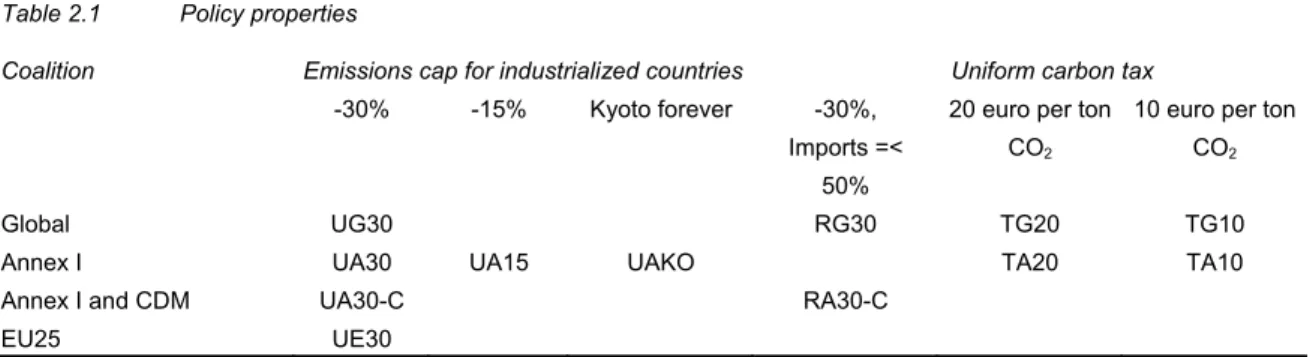
In this study we assess a large number of policy variants. Table 2.1 gives an overview of all simulations considered.
Table 2.1 Policy properties
Coalition Emissions cap for industrialized countries Uniform carbon tax
-30% -15% Kyoto forever -30%,
Imports =< 50%
20 euro per ton CO2
10 euro per ton CO2
Global UG30 RG30 TG20 TG10
Annex I UA30 UA15 UAKO TA20 TA10
Annex I and CDM UA30-C RA30-C
EU25 UE30
In a first group of policies we assume a cap-and trade system. All policies in this group are denoted with a U (UG30, UA30, UA30-C, UE30, UA15 and UAKO). The size of the abatement coalition ranges from a global coalition to the group of 25 EU-countries. The emissions reduction target for industrialized countries in 2020 ranges from 30% to the level of the Kyoto targets itself. It should be noted that the policies pertaining to a global coalition (UG30 and UA30) also appeared in Bollen, Manders and Veenendaal (2004). We also consider a CDM-case (UA30-C). The Clean Development Mechanism (CDM) allows industrialized countries in a non-global coalition to exploit the cheap abatement options in developing countries. For this reason, this case can be considered as a non-perfect global coalition.
The assumption of unrestricted international trade in emission permits is common for the policy scenarios in this group. However, in negotiations on burden-sharing the issue may be raised to require a minimum effort from the coalition members to reduce emissions
domestically rather than abroad. For the policies denoted with an R (RG30 AND RA30-C), two examples are considered: (1) a global coalition, in which free trade is restricted by the requirement that at least half the emissions should be reduced at home (RA30) and (2) an Annex I coalition, with access to CDM projects in the electricity sector where the restriction on permit trade is the same (RA30-C).
In contrast to the cases with a cap-and-trade system, we also consider some cases with a uniform carbon tax. These policies are denoted with a T (TG20, TA20, TG10 and TA10). Parties may not agree on installing a scheme of permit trade and instead negotiate a uniform carbon tax. Again, we will vary the coalition size and strictness of the abatement policy, showing the consequences of imposing taxes of 10 and 20 euro per tonne CO2 for global coalitions and for the Annex I coalition only.
The approach followed is very similar to the one in Bollen, Manders and Veenendaal (2004). First, the macroeconomic consequences of climate policy scenarios will be assessed using the applied general equilibrium model, WorldScan. This model has global coverage and, in particular, details regions within Europe (see Lejour, 2003: and Bollen, Manders and Mulder, 2004). The model, distinguishing various sectors, is sufficiently detailed to monitor the development of energy-related CO2 emissions2. The emission ceiling defined generates an endogenous shadow price known as ‘carbon tax’ or ‘emission price’. A global ceiling with free emissions trade would result in a single worldwide emission price.
Second, the impacts of post-Kyoto policy settings are assessed in a particular year, 2020, against the background of a long-term scenario without any climate policy. In this document we use the GLOBAL ECONOMY scenario as a baseline (see De Mooij and Tang, 2003, and Bollen, Manders and Mulder, 2004). This scenario is characterized by high economic growth. Accordingly, the policy effort and associated costs to meet a given emissions reduction target compared to 1990 levels are relatively high. In contrast to Bollen, Manders and Veenendaal (2004), Dutch developments in the baseline could now be fully adapted to the projections up to 2020 of the so-called Reference Projection (van Dril and Elzinga, 2005). As a consequence of this adaptation, Dutch emissions develop more favourably in the baseline than in Bollen, Manders and Veenendaal (2004)3. Hence, the assessed policy impacts for the Dutch economy deviate to some extent from those in Bollen, Manders and Veenendaal (2004) and Dutch compliance costs are assessed more favourably than before.
Third, the time profile for global GHG emissions thought to be compatible with the EU-temperature target is the same as in Bollen, Manders, and Veenendaal (2004).
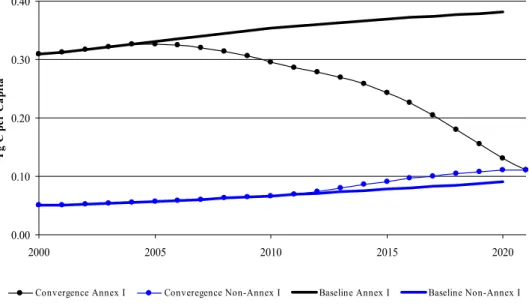
On burden sharing the following can be said. In the benchmark case, UG30, we apply a stylized burden-sharing rule consistent with this stabilization profile. Starting from baseline emissions in 2010 (and targets for the countries that ratified the Kyoto protocol), regional emission permits gradually converge to an equal-per-capita allocation; a so-called contraction and convergence scheme (Berk and den Elzen, 2001; Böhringer and Welsch, 2004). The year of convergence is chosen so that the allocation is compatible with a 30% reduction for
industrialized regions in 2020. Figure 2.1 shows the energy-related CO2 emissions in the baseline and the emission permits per capita for Annex I and non-Annex I in the benchmark UG30 case. This contraction and convergence scheme implies that industrialized countries grant developing countries emission permits above their baseline emissions (hot air). But the -30 percent reduction for Annex I, does not entail a -30 percent emission for all countries. The European Union by this scheme will receive in 2020 a target, which is 16 percent below
2 We do not explicitly address emission reductions of non-CO
2 greenhouse gases and the emission ceilings imposed pertain to CO2 only. Implicitly, non-CO2
emission reduction targets are assumed to be met as well.
3 In the provisional projections used in Bollen, Manders and Veenendaal (2004), we assumed a annual emissions growth of 2.4%. The final Reference
0.00 0.10 0.20 0.30 0.40 2000 2005 2010 2015 2020 T g C pe r Ca pi ta
Convergence Annex I Converegence Non-Annex I Baseline Annex I Baseline Non-Annex I
their 1990 emission level (for the USA it will be -41 percent). By coincidence, this scheme leads to a target for the Netherlands, equal to 30 percent below their 1990 emission level, exactly the same as the average for all Annex I countries.
Figure 2.1 Baseline emissions and emission permits for Annex I and non-Annex I, in Tg C per capita, 2000-2020
The other -30% cases assume the same targets for the countries in the abatement coalition as in the benchmark case. For example, the UA30 case assumes non-Annex I countries not implementing any climate policies at all and the Annex I countries getting the same targets as in the UG30 case. The UE30 case assumes the same targets for European countries as they have in the benchmark UG30 case, and no targets or climate policies for the other countries. The -15% case is one in which all targets of Annex I countries of the UG30 case are
multiplied by the same factor, as to get an overall target for the Annex I region equal to -15% of their 1990 emission level. The UAK0 case is one in which the targets are equal from 2010 onwards for the countries implementing the Kyoto Protocol. The USA and Australia keep their emissions constant from 2010 onwards.
Also it should be noted that in cases of policy where the reduction target is relaxed or the abatement coalition is smaller; for example, in UA15 and UE30, global emissions will be higher and the EU temperature target will probably not be met.4.
Finally, beware of the stylized character of our model-based assessments. Quite a few factors that could substantially increase or decrease macro-economic costs have not been taken into account. For example, the costs of restructuring the economy, local distributional impacts and
4 In the UA30 case global emissions will be somewhat lower than what is needed to reach the temperature target (for example, in UG30). In this
costs to set up climate policy, as well as the costs of monitoring, transactions and enforcement are not assessed. Neither are potential cost-reducing factors such as carbon capture and storage covered.
0 2 4 6 8 10 12
1990 2020, baseline 2020, permits 2020, emissions
Non-annex I Annex I
3.
A benchmark case: - 30% reduction for Annex I
within a global coalition (UG30)
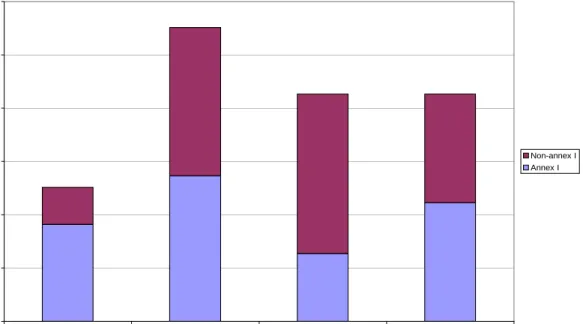
The policy variant, UG30, was discussed extensively in Bollen, Manders and Veenendaal (2004). We will briefly summarize this discussion here for later reference. Energy-related CO2 emissions and emission permits for industrialized (Annex I) and developing countries (non-Annex I) are shown in Figure 3.1. The figure shows that global emissions will increase up to 2020, regardless of whether or not there is a climate policy. However, without a climate policy, global emissions in 2020 will just exceed 11 Tg C. With the climate policy these will be reduced to 8.5 Tg C. Clearly, this is still far more than the global emissions of 5 Tg C in 1990. The climate policy implies that Annex I countries receive permits that are 30% below 1990 emission levels. The ‘contraction and convergence’ rule implies that non-Annex I countries receive permits that somewhat exceed their 2020 baseline emissions (see also Figure 2.1). Due to the free trading opportunities in emission permits, the Annex I countries will achieve their emission reduction targets amounting to 1.9 Tg C largely by importing permits.
Figure 3.1 CO2 emissions and emissions permits (Tg C) for Annex I and non-Annex I in 1990 and 2020
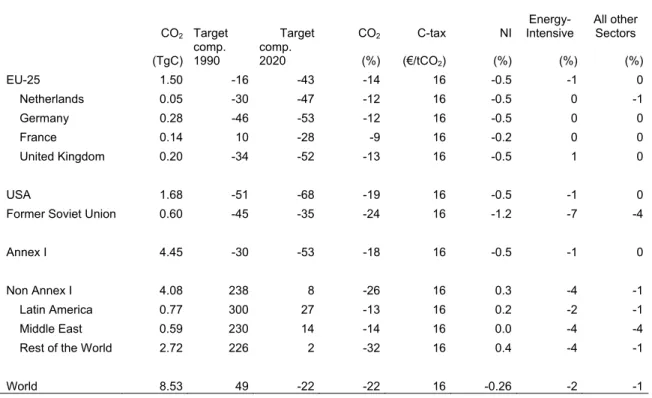
Due to free permit trading within a global coalition the costs of abating global warming will be relatively limited. The reason for this is that free permit trade enables us to make use of the cheapest abatement opportunities, mainly to be found in the non-Annex I countries. Hence, the 2020 permit price will be rather modest (16 € per tonne CO2). Because of the free permit trade this price will depend on the global emissions ceiling only and is independent of the allocation rule.
The reduction target for Annex I countries is 30% vis-à-vis 1990 levels. Compared to baseline emission levels in 2020 without a climate policy, this target implies a reduction of 53%. As Annex I imports emission permits to a large extent from countries in non-Annex I, the change (in %) in Annex I emissions in 2020 after emissions trading amounts to 18% of the baseline emissions. Hence, only a limited part of 34% (=18/53) of the reduction target for Annex I countries is achieved within the countries’ own borders.
The loss of income for industrialized countries stems mainly from payments to non-Annex I countries for permit imports. Real national income for Annex I countries in 2020 is assessed at 0.5% less, when compared to the baseline.
Due to the adapted baseline Dutch emissions, compliance costs develop more favourably than as reported in Bollen, Manders and Veenendaal (2004). In comparison to the Annex I group of countries, the Netherlands has an average reduction target of 30% compared to the 1990 levels. Relative to 2020 baseline emission levels, this means a reduction target of 47%. Only a relatively small percentage of this, 25% (=12/47), is achieved domestically, since the emission price on the global emission market remains rather modest. The macro-economic costs for the Netherlands amount to 0.5% of real national income in 2020, compared to the baseline without a climate policy.
4.
Trade-offs: costs, coalitions and the environment
The Annex I countries can still increase their emissions compared to 2000 and, through a global system with unrestricted permit trade, can effectively meet the requirements of a post-Kyoto policy that remains in line with the 2 ºCelsius EU objective. But the abatement costs will rise substantially when the coalition shrinks while targets are maintained. On the other hand, relaxing targets will yield higher emissions, and lower the costs of abatement. This section discusses the trade-off between macro-economic costs, emission reductions and the coalition size.
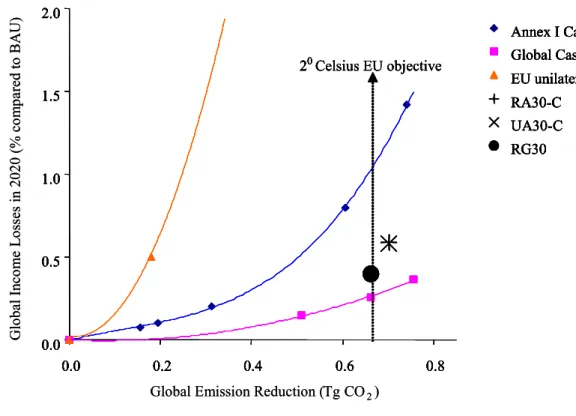
Figure 4.1 Global Income losses and emission reductions, 2020
Figure 4.1 plots the global income losses of different policy variants related to the global emission reduction effort5. The variants are grouped according to different coalition sizes: the global one (Annex I) and the restricted EU-25 coalition. Point estimates are also given for the other more hybrid cases (Annex I + CDM, and import restricted cases). Actually, the figure shows a number of global abatement curves. Given a coalition, the curve relates the global emission reduction to global income loss. Income effects rise progressively with increased reductions. It should be noted that global income effects hide regional differences. In non-global coalitions, income effects are pronounced in abating regions but stay under the surface of the global average.
5 Global income losses are measured as the difference (in %) between the income levels with and without the climate policy; the global emission
reduction effort is measured in terms of absolute differences in the CO2 emissions.
0.0 0.5 1.0 1.5 2.0 0.0 0.2 0.4 0.6 0.8
Global Emission Reduction (Tg CO2)
G lobal In co m e L os ses in 2020 (% co m pa red t o BA U ) Annex I Cases Global Cases EU unilateral Cases RA30-C UA30-C RG30 20 Celsius EU objective 0.0 0.5 1.0 1.5 2.0 0.0 0.2 0.4 0.6 0.8 Annex I Cases Global Cases EU unilateral Cases RA30-C UA30-C RG30 20 Celsius EU objective 0.0 0.5 1.0 1.5 2.0 0.0 0.2 0.4 0.6 0.8 Annex I Cases Global Cases EU unilateral Cases RA30-C UA30-C RG30 20 0.0 0.5 1.0 1.5 2.0 0.0 0.2 0.4 0.6 0.8
Global Emission Reduction (Tg CO2)
G lobal In co m e L os ses in 2020 (% co m pa red t o BA U ) Annex I Cases Global Cases EU unilateral Cases RA30-C UA30-C RG30 20 Celsius EU objective 0.0 0.5 1.0 1.5 2.0 0.0 0.2 0.4 0.6 0.8 Annex I Cases Global Cases EU unilateral Cases RA30-C UA30-C RG30 20 Celsius EU objective 0.0 0.5 1.0 1.5 2.0 0.0 0.2 0.4 0.6 0.8 Annex I Cases Global Cases EU unilateral Cases RA30-C UA30-C RG30 20
The most important conclusions drawn from Figure 4.1
1. More willingness by coalitions to incur costs of abatement will increase the global emission reduction. Not that abatement curves are upward sloped.
2. Reducing the coalition size will lower the options to meet the requirements of the
2º Celsius EU objective, and hence will increase the costs of abatement, which lowers the efficiency of the climate policy. Abatement curves shift inward with smaller coalitions.
a. Switching from a global coalition to a smaller Annex I coalition will more than double the costs of the EU objective.
b. Switching from an Annex I coalition to an EU-25 coalition again increases the costs of abatement by a factor of 5, and is thus a less efficient climate policy strategy. Furthermore, by no means can EU-25 go for a unilateral strategy and remain within the EU target.
Impacts from CDM and restrictions on the imports of permits
If CDM projects in the electricity sectors of non-members are introduced (UA30-C), the carbon price of the Annex-I coalition and thus also the global income losses will more than halve (compare the last marked point on the Annex I line). Annex I countries may fund emission reductions in power plants in non-Annex I areas, acquiring credits for the reductions thus achieved that they may add to the emission permits already in their possession. This implies that the increased carbon price will also be felt in the electricity sectors of non-Annex I. CDM projects will be offered until marginal abatement costs in power plants are equal the permit price. Hence, the permit price will drop, and thus substantially lower the income losses.
But CDM also generates carbon leakage, therefore partly offsetting the initial emission reductions by Annex I, and thus lowering the effectiveness of the instrument. As CDM is funded at marginal costs, power plants will earn infra-marginal profits, and through competition these will be passed on to the consumers of electricity. Hence, the electricity price will fall and demand will rise. CDM will also depress demand for carbon-intensive fuels, such as coal, and lower the prices of these fuels, raising demands in other sectors of the economy. Taken collectively, these responses to CDM in the local economy may yield a local carbon leakage of up to 40% of the credits earned by CDM-funding parties (see section 7 for a discussion in more detail).
If import restrictions on either international permit trade and/or CDM are imposed (the RG30, and RA30-C cases), the permit or carbon price will rise in countries where the import
restriction becomes binding and fall elsewhere. Exporters of permits will get a lower price from a decline in demand. And importers will face a higher domestic price and a lower trade price. From a global perspective, restrictions on trading will reduce the number of emission reduction options and thus increase the income losses of the climate policy.
5.
Macro-economic consequences for EU-25, the
Netherlands, and non-Annex I
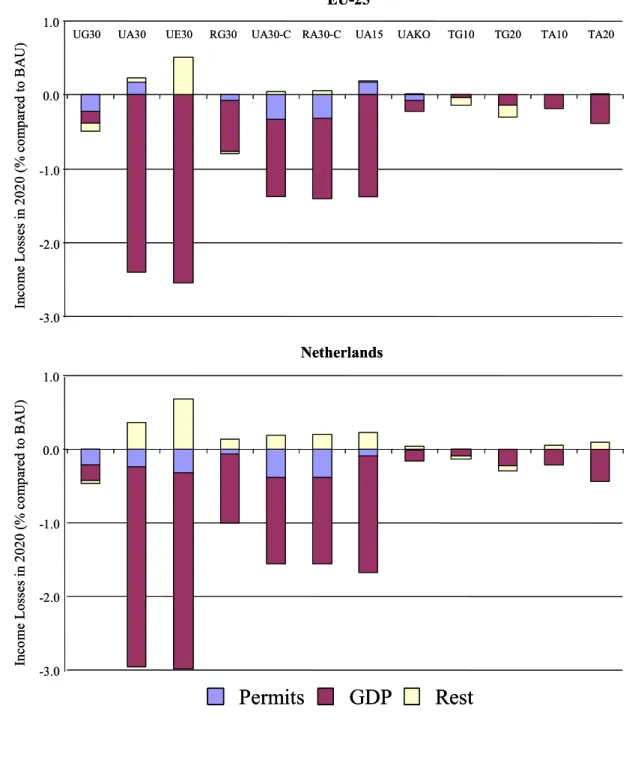
Generally, one would expect the macro-economic costs for coalition members to increase in terms of real national income with rising marginal abatement costs, as indicated by the level of the permit price. This indeed becomes apparent from Figure 5.1 for both EU-25 and the Netherlands. In this figure the effects on national income are divided into three components: the change in GDP, the costs of permit trade and a remainder (consisting mainly of terms of trade effects). The macro-economic costs for EU-25 range from 0.1% of real national income (TG10) to 2.2% (UA30); the costs are linked to the boundaries of the permit prices (125 to 10 € per tonne CO2, see Appendix). The costs for the Netherlands are very similar, ranging from 0.1% (TG10) to 2.3% (UE30). Figure 5.1 shows that rising macro-economic costs for EU-25 and especially for the Netherlands are somewhat mitigated by increasing terms of trade effects.
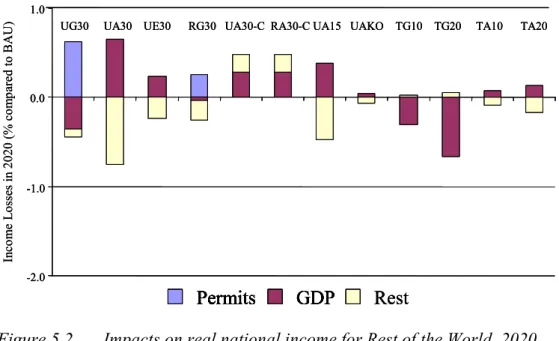
The macro-economic impacts for non-Annex I countries are shown in Figure 5.2. The effects on national income are generally positive under cap-and-trade systems irrespective of
whether these countries are members of the coalition or not. If they belong to the coalition, they benefit from the sale of emission permits. If they do not, there will still be benefits from a rise of activity in energy-intensive sectors. Moreover, these countries do not have to incur any cost increases from climate policies as opposed to Annex I countries; their import price increases (higher prices of Annex I’s energy-intensive goods are passed on to the non-abating countries) and non-Annex I’s energy export price drops. Hence this will yield adverse terms of trade effects evaporating the positive GDP gains. If non-Annex I countries are coalition members, they will often profit from the sale of emission permits. Introduction of global carbon taxation is most harmful for these countries, leading to reductions in national income exceeding those of the Annex I countries.
The impacts of substituting cap-and-trade schemes for uniform carbon taxation depend upon the divergence between the level of the emission price and the level of the carbon tax. For identical coalitions a lower tax rate will reduce costs and increase emissions, while the opposite is true if the tax rate exceeds the price of tradable permits. Ignoring income effects, both schemes would be equally efficient in abating global warming if the time profiles of permit prices and carbon taxes coincided. The distributional impacts can be substantial though. If, for example, a global cap-and-trade scheme with a permit allocation
approximating equal rights per capita is replaced by a universal carbon tax, compliance costs will diminish for EU-25 (see Figure 5.1). This also holds for Annex I (see Appendix).
However, the compliance costs will become substantial for developing countries (Figure 5.2). Though the revenues from carbon taxation may be partly used for international income transfers (which would make the burden-sharing acceptable to negotiators), domestic
pressure to recycle these revenues back into one’s own economy is likely to prevent the conclusion of such an agreement.
Figure 5.1 Impacts on real national income for the EU-25 and the Netherlands, 2020
GDP
Rest
EU-25 -3.0 -2.0 -1.0 0.0 1.0 Netherlands -3.0 -2.0 -1.0 0.0 1.0Permits
UG30 UA30 UE30 RG30 UA30-C RA30-C UA15 UAKO TG10 TG20 TA10 TA20
In co me L oss es in 2 02 0 (% co m par ed to B A U ) In co me Lo ss es in 2 02 0 ( % co mp ar ed to B A U)
GDP
Rest
EU-25 -3.0 -2.0 -1.0 0.0 1.0 Netherlands -3.0 -2.0 -1.0 0.0 1.0Permits
UG30 UA30 UE30 RG30 UA30-C RA30-C UA15 UAKO TG10 TG20 TA10 TA20
In co me L oss es in 2 02 0 (% co m par ed to B A U ) In co me Lo ss es in 2 02 0 ( % co mp ar ed to B A U)
Figure 5.2 Impacts on real national income for Rest of the World, 2020
Figure 5.3 shows the impacts of the scenarios on employment in the energy-intensive and transport sectors in EU-25 and the Netherlands. As total employment is exogenous in the model, these figures indicate a shift of employment from these sectors to elsewhere in the economy. Obviously, shifts in employment will be largest when coalition sizes diminish under cap-and-trade due to migration of energy-intensive production to non-members. In general, percentage deviations from the background scenario without climate change policies are smaller for the Netherlands than for EU-25. When permit trade is restricted however (as in RG30), the Dutch may suffer more than other EU member states because they tend to rely to a larger extent on permit imports.
Figure 5.3 Employment losses as percentage of total employment in energy-intensive and transport sectors, EU-25 and the Netherlands, 2020
0.0 2.5 5.0 7.5 E25 NLD
UG30 UA30 UE30 RG30 UA30-C RA30-C UA15 UAKO TG10 TG20 TA10 TA20
E m pl oy ment L oss es in e ner gy -i nte ns ive se ct or s i n 20 20 (% co m par ed to B A U) 0.0 2.5 5.0 7.5 E25 NLD
UG30 UA30 UE30 RG30 UA30-C RA30-C UA15 UAKO TG10 TG20 TA10 TA20
E m pl oy ment L oss es in e ner gy -i nte ns ive se ct or s i n 20 20 (% co m par ed to B A U) Permits GDP Rest Permits GDP -2.0 -1.0 0.0 1.0
UG30 UA30 UE30 RG30 UA30-C RA30-C UA15 UAKO TG10 TG20 TA10 TA20
In co m e L oss es in 2 02 0 (% co m pared to BA U) Permits GDP Rest Permits GDP -2.0 -1.0 0.0 1.0
UG30 UA30 UE30 RG30 UA30-C RA30-C UA15 UAKO TG10 TG20 TA10 TA20
Permits GDP Rest Permits GDP -2.0 -1.0 0.0 1.0
UG30 UA30 UE30 RG30 UA30-C RA30-C UA15 UAKO TG10 TG20 TA10 TA20
In co m e L oss es in 2 02 0 (% co m pared to BA U)
6.
Impacts on energy use in the Netherlands
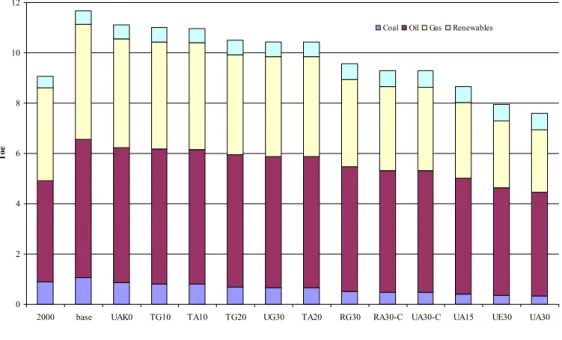
Reductions of GHG emissions may be accomplished by lowering the energy intensity, the carbon intensity, and reducing overall economic activity. In our scenarios substitution across sectors drives the reductions of the energy intensity. This implies that emission reductions are predominantly achieved by substitution to less intensive products and to less energy-intensive goods and services in final consumption. Hence, emission abatement is to a major extent (in the order of 80%) achieved by structural changes resulting in reduced energy demand per unit of GDP. In the 2010-2020 period, the energy growth rate in the UG30 case will be 1.4 % per year. The UA30 case depresses the energy growth rate between 2010 and 2020 to -2.1% per year (including effects from changes in volume, structure, and savings). In terms of carbon emissions, reductions are achieved only to a minor extent (about 20%) by switching to less carbon-intensive energy carriers (yielding reduced emissions per unit of energy). The large bulk of emission reductions stem from reductions in overall energy-intensity reductions (energy per unit of GDP).
Figure 6.1 Energy consumption by carrier in Toe for the Netherlands, 2000 and 2020
The scenarios studied show considerable variations in total energy consumption. For
example, Dutch energy consumption (see Figure 6.1) is almost 35% below the baseline in the scenario with a 30% emission reduction for Annex I only (UA30), but the shortfall from the baseline is much less in the scenarios, ‘Kyoto forever’ (UAKO), and for the carbon taxation of 10 euro (TG10 and TA10).
Where major reductions in energy use occur, coal use shows the most reduction in relative terms (fuel-switching), while the reduction in gas use tends to dominate in absolute terms.
0 2 4 6 8 10 12
2000 base UAK0 TG10 TA10 TG20 UG30 TA20 RG30 RA30-C UA30-C UA15 UE30 UA30
To
e
Hence, the figure indicates the limited possibilities to substitute gas for oil in transportation. The role of renewables remains fairly limited. Although its use increases somewhat over time, in absolute terms its role is small.
7.
CDM and leakage in non-member countries
In our emissions trading simulations, CDM is modelled as a special case. We focus on projects in the electricity sector. Annex I countries may acquire Emission Reduction Units (ERUs) by investing in more efficient power generation in non-Annex I. Please note that there is no overall emission target for non-Annex I and the amount of ERUs should be assessed against an ex ante baseline (see box).
CDM and leakage
CDM may lose much of its efficiency due to serious carbon leakage. The reasons for this leakage are threefold:
1. CDM may lead to lower electricity prices, and this will induce additional demand for electricity;
2. primary energy supply may be inelastic and the resulting drop in energy prices may mitigate ex ante reductions in energy demand;
3. the economy may become more competitive, boosting production, and thus increasing emissions.
Lower electricity prices
The price of emission reduction units is determined in the margin. As the amount of emissions that the electricity sector is willing to reduce goes up, the price increases progressively (due to the convexity of the abatement curve). In a competitive market for CDM, host sectors will have a suppliers’ surplus. Actual abatement costs are lower than the revenues from CDM. This suppliers’ surplus is assumed to lead to lower electricity prices ex post. These lower prices will induce higher electricity demand and this may counterbalance the ex ante emission reduction.
The leakage that results depends crucially on the assumption that CDM leads to lower electricity prices. In a setting where the government acts as a broker for CDM projects, it is conceivable that the electricity sector is only compensated for its actual abatement costs and that the government will recycle the surplus into the overall economy. In this case, electricity prices will hardly be affected and leakage will be less.
Inelastic energy supply
Primary energy prices may react to a drop in energy demand in the electricity sector. Cheaper energy will boost energy demand in other sectors and carbon leakage will result. The energy prices in non-Annex I will be affected more if trade in fossil fuels is difficult and energy markets are more or less regionally confined.
CDM in WorldScan
The Clean Development Mechanism (CDM) belongs to the ‘flexibility mechanisms’ of the Kyoto Protocol. These mechanisms were devised to assist Annex I countries in fulfilling their commitments in a flexible and co-operative manner. At the same time they provided an opportunity for developing countries not bound to reducing their emissions under the Protocol to participate in the process of global GHG mitigation. CDM performs a threefold function as it assists non-Annex I countries in achieving sustainable development, contributes to the ultimate goal of stabilizing GHG concentrations in the atmosphere and assists Annex I countries in meeting their emission reduction ceilings.
CDM has been designed to be innovative, and market-based, encouraging developed countries to invest in projects in developing countries. Emissions from the project should be lower than emissions that would have occurred had the prevalent technology been used. Emission reductions should be real, measurable and long term.
Establishment of emission reduction additionality (additional reduction in emissions) is a prerequisite under CDM. However, in order to establish additionality of projects, a baseline must be defined against which the additionality can be assessed and carbon credits for the project determined. Baselines can be assessed at project or company/firm level but may also pertain to the sectoral level.
CDM in all or a limited number of sectors
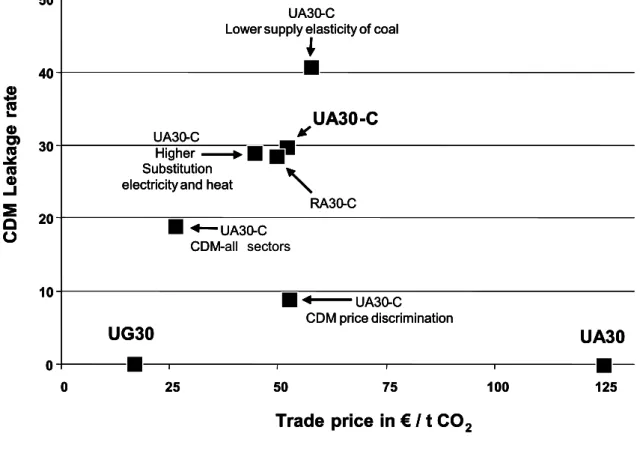
Figure 6.1 shows the consequences of extending the 30% emission reduction scenario for Annex I countries with CDM opportunities in electricity generation in non-Annex I countries. Seizing these opportunities will lower the carbon price from 125 euro per tonne CO2 (UA30) to 27 euro per tonne (UA30-C, all sectors). The global income losses decline by more than 50% through CDM. Still, local leakage in non-Annex I countries will amount to 20% of the emissions reduced by operating CDM projects there. Thus, global emission reductions will drop (see Figure 4.1). Hence, the credits earned in this way are less effective in abating global emissions than a global permit system with unrestricted trade (UG30)6. Alternative
assumptions have been assessed to further investigate the importance of CDM leakages. Still, it is uncertain whether all small point sources can be included in a CDM scheme. This
warrants an analysis in which CDM is restricted to the large point sources of emissions and kept out of the CDM scheme, i.e. non-electricity sectors. These sectors include the
6 Additional simulations show that the leakage through CDM cannot be mitigated by extra limits on the targets of Annex I countries. In this sense
the leakages are severe. On the other hand, the Annex I reduction in the UA30 case will be lowered by only 6% in the UA30-C case, and still, the global emission reduction will be more than for the UG30 case.
intensive steel, petrochemical and ferrous-metals industries. As this policy case is left with fewer emission reduction opportunities, the permit price will rise to 51 euro per tonne CO2 (UA30-C). The global income losses increase up to 0.6% of the national income. Moreover, the permit price increases, which will lead to larger differences in competitiveness between the industrialized and developing countries and higher leakages. And local leakage in non-Annex I countries will be more severe, amounting to 30% of the emissions reduced by operating CDM projects there.
Figure 7.1 Carbon tax in euro per tonne CO2 and CDM-leakage as a percentage of CDM-emissions reduction in non-Annex I countries, 2020
Sensitivity analysis on CDM restricted to the electricity sector (UA30-C)
Leakage is crucially dependent on the institutional design of CDM. This leads us to carry out a sensitivity analysis under alternative assumptions. If CDM and permit trade is put under a 50% permit import ceiling, both the permit and CDM price will drop slightly and local
leakage will be marginally smaller. If the local supply elasticity of coal is reduced (from 20 to 1) and the consequent sensitivity of the local coal price for shifts in coal demand raised, the carbon price will increase to 60 euro per tonne CO2. Because of the higher carbon price, the leakage may rise to 40%. If it becomes easier to substitute electricity for heat, the carbon price will fall slightly, and leakage is hardly affected. Further, if electricity suppliers in the
Trade price in € / t CO2 0 10 20 30 40 50 0 25 50 75 100 125 UG30 UA30 UA30-C RA30-C UA30-C
Lower supply elasticity of coal
UA30-C Higher Substitution electricity and heat
UA30-C CDM-all sectors UA30-C CDM price discrimination CDM Le ak a g e rat e Trade price in € / t CO2 0 10 20 30 40 50 0 25 50 75 100 125 UG30 UA30 UA30-C RA30-C UA30-C
Lower supply elasticity of coal
UA30-C Higher Substitution electricity and heat
UA30-C CDM-UA30-C CDM price discrimination CDM Le ak a g e rat e Trade price in € / t CO2 0 10 20 30 40 50 0 25 50 75 100 125 UG30 UA30 UA30-C RA30-C UA30-C
Lower supply elasticity of coal
UA30-C Higher Substitution electricity and heat
UA30-C CDM-all sectors UA30-C CDM price discrimination CDM Le ak a g e rat e Trade price in € / t CO2 0 10 20 30 40 50 0 25 50 75 100 125 UG30 UA30 UA30-C RA30-C UA30-C
Lower supply elasticity of coal
UA30-C Higher Substitution electricity and heat
UA30-C CDM-UA30-C CDM price discrimination CDM Le ak a g e rat e
host countries cannot negotiate a permit price at the marginal cost level, but only get compensated for the average costs of emission reduction, local leakage will decline
dramatically. In this case the permit price remains the same while financial transfers to host countries will decline. This can only be done with additional efforts to monitor the actual costs of CDM projects, which are not included in the WorldScan model7.
7 The importance of these costs to compliance is beyond the scope of this paper. Still, the idea of introducing flexibility mechanisms in the Kyoto
Protocol was one of the aims for lowering the monitoring costs. The permit market will identify the most efficient options to reduce emissions, instead of the government having to search for the cheap options. By widespread application of CDM in the post-Kyoto era, governments can reduce CDM leakages by setting up monitoring systems, although these may lead to rising monitoring costs.
8.
Conclusions
It goes without saying that – of the scenarios considered in this document − a global coalition is the preferred post-Kyoto policy variant for achieving global climate change objectives from an economic efficiency point of view. Within this setting unrestricted permit trade or a universal carbon tax will ensure that abatement takes place at the lowest possible costs. However, in reality many factors play a role in the design of targets and timetables and in the process of getting more countries involved in reducing GHG emissions. This report sketches the trade-offs of different negotiation outcomes.
In 2020, the loss to the Netherlands participating in a global permit trading system with a reduction target of 30% below the emissions level of 1990 is assessed at 0.5 percent of National Income. This policy setting is compatible with the EU- 20 Celsius objective. If cap and unrestricted trade are maintained and the abatement coalition is restricted to EU-25, then the costs to EU-25 will rise, as will global emissions. For example, compliance costs in 2020 for the Netherlands would rise to 2 percent of National Income. However, opening CDM opportunities in non-member countries will alleviate compliance costs. For example, the Netherlands can almost halve their compliance costs compared to the case in which emissions trading is restricted to Annex I countries. But this cost reduction goes at the expense of
somewhat higher emissions due to local leakage. Hence, in general CDM-credits are less effective in abating global warming than regular permits. Local leakage and compliance costs may be reduced, however, if CDM opportunities are supplied both worldwide and in all sectors of the economy.
Requiring that permit imports should not exceed 50% of reduction targets will lower the price of permit trade and affect the burden-sharing among countries. In particular, compliance costs will rise in countries for which this requirement is binding and decrease elsewhere.
Relaxing caps will reduce compliance costs at the expense of increased emissions. Ignoring income effects, the imposition of a uniform carbon tax for coalition members will be just as effective in abating global warming as a cap-and-trade scheme, provided the time profiles of carbon taxes coincide. The distributional consequences can be quite different though. If, for example, a global cap-and-trade scheme with permit allocation according to ‘Contraction and Convergence’ is replaced by a universal carbon tax, compliance costs will diminish for Annex I countries but become substantial for developing countries. Revenues of carbon taxation are a versatile source for income transfers that could equalize the cost of compliance, and make it more equitable. However, domestic pressure to recycle these revenues back into the own economy is likely to prevent these transfers from happening. The grandfathering schemes under cap-and-trade seem to provide a more equitable basis for allocating emission rights. Hence, this may be a more promising option to create consensus amongst negotiating parties.
References
Berk, M.M., and Den Elzen, M.G.J. (2001), Options for Differentiation of Future
Commitments in Climate Policy: How to Realise Timely Participation to Meet Stringent Climate Goals, Climate Policy, 1(4), 465-48.
Böhringer, C. and H. Welsch (2004), C&C - Contraction and Convergence of Carbon Emissions: The Implications of Permit Trading, Journal of Policy Modeling 26 (1), 21-39.
Bollen, J.C., A.M. Gielen, and H. Timmer (1999), Clubs, Ceilings and CDM,
Macroeconomics of compliance with the Kyoto Protocol, Special Issue of the Energy Journal on the Kyoto Protocol.
Bollen, J., M. Mulder and T. Manders (2004), Four Futures for Energy Markets and Climate Change, Special Publication 52, CPB, The Hague.
Bollen, J., Manders, T., and Veenendaal, P (2004), How much does a 30% emission reduction cost? Macroeconomic effects of post-Kyoto climate policy in 2020, CPB document 64, CPB, The Hague.
van Dril, A.W.N. and Elzenga, H.E., (eds.) (2005), Reference projections energy and emissions 2005-2020 (in Dutch), ECN/MNP, Petten/Bilthoven
Lejour, A.M. (2003), Quantifying four scenarios for Europe, CPB document 38, CPB, The Hague
Mooij, R.A. de, and P.J.G. Tang (2003), Four futures of Europe, CPB special publication 49, CPB, The Hague
Appendix Tables
Table A.1 Baseyear data (2000)
Population National Income Primary Energy Emissions Intensity Energy intensityCarbon (millions) (billions $) (toe) (Gt C) (USA=100) (USA=100)
EU-25 543 9124 167 1.21 77 96 Netherlands 16 381 10 0.05 106 72 Germany 82 2175 33 0.25 63 100 France 60 1478 18 0.11 52 79 United Kingdom 59 1418 23 0.16 68 95 USA 283 9091 215 1.63 100 100
Former Soviet Union 292 601 85 0.58 595 90
Annex I 1310 24807 552 4.05 94 97
Non Annex I 4746 6959 300 2.40 182 106
Latin America 514 2086 52 0.36 106 90
Middle East 315 805 48 0.35 253 95
Rest of the World 3917 4066 199 1.70 207 112
World 6056 31765 852 6.45 113 100
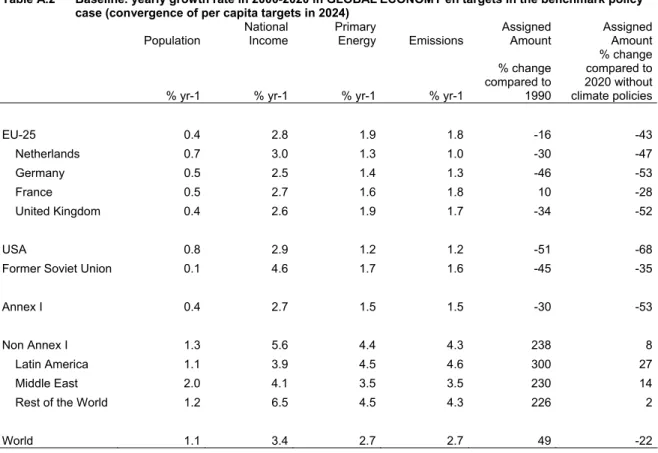
Table A.2 Baseline. yearly growth rate in 2000-2020 in GLOBALECONOMY en targets in the benchmark policy
case (convergence of per capita targets in 2024)
Population National Income Primary Energy Emissions Assigned Amount Assigned Amount
% yr-1 % yr-1 % yr-1 % yr-1
% change compared to 1990 % change compared to 2020 without climate policies EU-25 0.4 2.8 1.9 1.8 -16 -43 Netherlands 0.7 3.0 1.3 1.0 -30 -47 Germany 0.5 2.5 1.4 1.3 -46 -53 France 0.5 2.7 1.6 1.8 10 -28 United Kingdom 0.4 2.6 1.9 1.7 -34 -52 USA 0.8 2.9 1.2 1.2 -51 -68
Former Soviet Union 0.1 4.6 1.7 1.6 -45 -35
Annex I 0.4 2.7 1.5 1.5 -30 -53
Non Annex I 1.3 5.6 4.4 4.3 238 8
Latin America 1.1 3.9 4.5 4.6 300 27
Middle East 2.0 4.1 3.5 3.5 230 14
Rest of the World 1.2 6.5 4.5 4.3 226 2
Table A.3 Global coalition. 30% cap and unrestricted trade (UG30). 2020
CO2 Target Target CO2 C-tax NI
Energy-Intensive All other Sectors (TgC) comp. 1990 comp. 2020 (%) (€/tCO2) (%) (%) (%) EU-25 1.50 -16 -43 -14 16 -0.5 -1 0 Netherlands 0.05 -30 -47 -12 16 -0.5 0 -1 Germany 0.28 -46 -53 -12 16 -0.5 0 0 France 0.14 10 -28 -9 16 -0.2 0 0 United Kingdom 0.20 -34 -52 -13 16 -0.5 1 0 USA 1.68 -51 -68 -19 16 -0.5 -1 0
Former Soviet Union 0.60 -45 -35 -24 16 -1.2 -7 -4
Annex I 4.45 -30 -53 -18 16 -0.5 -1 0
Non Annex I 4.08 238 8 -26 16 0.3 -4 -1
Latin America 0.77 300 27 -13 16 0.2 -2 -1
Middle East 0.59 230 14 -14 16 0.0 -4 -4
Rest of the World 2.72 226 2 -32 16 0.4 -4 -1
World 8.53 49 -22 -22 16 -0.26 -2 -1
Table A.4 Annex I coalition. 30% cap and unrestricted trade (UA30). 2020
CO2 Target Target CO2 C-tax NI
Energy-Intensive All other Sectors (TgC) comp. 1990 comp. 2020 (%) (€/tCO2) (%) (%) (%) EU-25 0.95 -16 -43 -46 125 -2.2 -10 -2 Netherlands 0.03 -30 -47 -42 125 -2.6 -10 -3 Germany 0.19 -46 -53 -42 125 -2.7 -10 1 France 0.10 10 -28 -34 125 -1.2 -5 -1 United Kingdom 0.13 -34 -52 -44 125 -2.3 -4 -2 USA 0.91 -51 -68 -56 125 -2.2 -12 -3
Former Soviet Union 0.28 -45 -35 -65 125 0.8 -41 -14
Annex I 2.56 -30 -53 -53 125 -2.0 -11 -3
Non Annex I 5.68 2 0.0 5 0
Latin America 0.91 3 -0.1 5 0
Middle East 0.70 2 -0.9 9 -4
Rest of the World 4.07 2 0.1 5 1
Table A.5 EU25 coalition. 30% cap and unrestricted trade (UE30). 2020
CO2 Target Target CO2 C-tax NI
Energy-Intensive All other Sectors (TgC) comp. 1990 comp. 2020 (%) (€/tCO2) (%) (%) (%) EU-25 1.00 -16 -43 -43 100 -2.0 -11 -2 Netherlands 0.04 -30 -47 -39 100 -2.3 -11 -2 Germany 0.19 -46 -53 -40 100 -2.4 -11 0 France 0.11 10 -28 -32 100 -1.3 -7 -1 United Kingdom 0.14 -34 -52 -41 100 -2.1 -6 -2 USA 2.09 1 0.0 1 0
Former Soviet Union 0.81 2 -0.2 5 -1
Annex I 4.70 -13 -0.7 -4 -1
Non Annex I 5.58 1 0.0 1 0
Latin America 0.89 1 0.0 1 0
Middle East 0.69 1 -0.3 3 -1
Rest of the World 4.00 1 0.1 1 0
World 10.28 -6 -0.5 -2 0
Table A.6 Annex I coalition. 30% cap and unrestricted trade. with CDM (UA30-C). 2020
CO2 Target Target CO2 C-tax NI
Energy-Intensive All other Sectors (TgC) comp. 1990 comp. 2020 (%) (€/tCO2) (%) (%) (%) EU-25 1.23 -16 -43 -30 51 -1.3 -4 -1 Netherlands 0.04 -30 -47 -26 51 -1.4 -4 -1 Germany 0.24 -46 -53 -26 51 -1.5 -4 1 France 0.12 10 -28 -20 51 -0.7 -2 0 United Kingdom 0.17 -34 -52 -28 51 -1.3 -1 -1 USA 1.27 -51 -68 -39 51 -1.3 -5 -1
Former Soviet Union 0.43 -45 -35 -46 51 -1.7 -22 -8
Annex I 3.46 -30 -53 -36 51 -1.3 -5 -1
Non Annex I 4.92 -11 51 1.1 2 2
Latin America 0.85 -4 51 0.5 2 1
Middle East 0.66 -4 51 0.8 3 1
Rest of the World 3.42 -14 51 1.2 2 2
Table A.7 Global coalition. 30% cap. permit imports =<50%. (RG30). 2020
CO2 Target Target CO2 C-tax NI
Energy-Intensive All other Sectors (TgC) comp. 1990 comp. 2020 (%) (€/tCO2) (%) (%) (%) EU-25 1.36 -16 -43 -22 76 -0.8 -3 -1 Netherlands 0.05 -30 -47 -24 41 -0.9 -4 -2 Germany 0.24 -46 -53 -27 49 -1.0 -5 0 France 0.13 10 -28 -14 29 -0.3 0 0 United Kingdom 0.17 -34 -52 -26 44 -0.7 -2 -2 USA 1.38 -51 -68 -34 39 -0.5 -5 -2
Former Soviet Union 0.65 -45 -35 -17 11 -0.9 -4 -4
Annex I 3.97 -30 -53 -27 76 -0.6 -3 -1
Non Annex I 4.56 238 8 -18 8 0.1 -1 -1
Latin America 0.83 300 27 -6 8 0.0 0 -1
Middle East 0.64 230 14 -7 8 -0.4 0 -4
Rest of the World 3.10 226 2 -22 8 0.2 -1 -1
World 8.53 49 -22 -22 76 -0.4 -2 -1
Table A.8 Annex I coalition. 30% cap. permit imports =<50%. with CDM (RA30-C). 2020
CO2 Target Target CO2 C-tax NI
Energy-Intensive All other Sectors (TgC) comp. 1990 comp. 2020 (%) (€/tCO2) (%) (%) (%) EU-25 1.22 -16 -43 -30 77 -1.3 -5 -1 Netherlands 0.04 -30 -47 -26 50 -1.4 -4 -1 Germany 0.24 -46 -53 -27 51 -1.5 -4 1 France 0.12 10 -28 -20 50 -0.7 -2 0 United Kingdom 0.17 -34 -52 -28 50 -1.3 -1 -1 USA 1.27 -51 -68 -39 50 -1.3 -5 -1
Former Soviet Union 0.43 -45 -35 -46 50 -1.8 -22 -8
Annex I 3.46 -30 -53 -36 77 -1.3 -5 -1
Non Annex I 4.92 -11 50 1.1 2 2
Latin America 0.85 -4 50 0.5 2 1
Middle East 0.66 -4 50 0.8 3 1
Rest of the World 3.42 -14 50 1.2 2 2
Table A.9 Annex I coalition. 15% cap and unrestricted trade (UA15). 2020
CO2 Target Target CO2 C-tax NI
Energy-Intensive All other Sectors (TgC) comp. 1990 comp. 2020 (%) (€/tCO2) (%) (%) (%) EU-25 1.12 2 -30 -36 73 -1.2 -6 -1 Netherlands 0.04 -15 -36 -32 73 -1.4 -6 -2 Germany 0.22 -35 -43 -32 73 -1.6 -6 0 France 0.12 34 -13 -25 73 -0.5 -3 -1 United Kingdom 0.15 -20 -42 -34 73 -1.3 -2 -2 USA 1.13 -41 -61 -46 73 -1.4 -8 -2
Former Soviet Union 0.37 -34 -21 -54 73 0.8 -30 -11
Annex I 3.11 -15 -42 -42 73 -1.2 -8 -2
Non Annex I 5.63 2 0.0 3 0
Latin America 0.90 2 -0.1 3 0
Middle East 0.69 1 -0.7 6 -3
Rest of the World 4.03 2 0.1 3 0
World 8.74 -20 -0.8 -3 -1
Table A.10 Annex I coalition. Kyoto cap and unrestricted trade (UAKO). 2020
CO2 Target Target CO2 C-tax NI
Energy-Intensive All other Sectors (TgC) comp. 1990 comp. 2020 (%) (€/tCO2) (%) (%) (%) EU-25 1.60 -29 -8 7 -0.2 -1 0 Netherlands 0.06 20 -10 -7 7 -0.1 -1 0 Germany 0.30 -21 -31 -7 7 -0.2 -1 0 France 0.15 2 -34 -5 7 -0.1 0 0 United Kingdom 0.22 -13 -37 -7 7 -0.2 0 0 USA 1.84 -8 -11 7 0.0 -1 -1
Former Soviet Union 0.68 3 23 -14 7 0.3 -5 -2
Annex I 4.84 -10 7 -0.1 -1 0
Non Annex I 5.55 0 0.0 0 0
Latin America 0.88 0 0.0 0 0
Middle East 0.69 0 -0.1 1 -1
Rest of the World 3.98 0 0.0 0 0
Table A.11 Global coalition. carbon tax of 20 euro/tCO2 (TG20). 2020
CO2 Target Target CO2 C-tax NI
Energy-Intensive All other Sectors (TgC) comp. 1990 comp. 2020 (%) (€/tCO2) (%) (%) (%) EU-25 1.46 -16 20 -0.3 -1 -1 Netherlands 0.05 -14 20 -0.3 0 -1 Germany 0.28 -14 20 -0.3 -1 0 France 0.14 -10 20 -0.1 0 0 United Kingdom 0.20 -15 20 -0.2 1 -1 USA 1.61 -22 20 -0.2 -2 -1
Former Soviet Union 0.57 -28 20 -1.1 -9 -6
Annex I 4.29 -21 20 -0.3 -1 -1
Non Annex I 3.89 -30 20 -0.6 -4 -2
Latin America 0.74 -16 20 -0.6 -3 -1
Middle East 0.57 -17 20 -1.1 -5 -6
Rest of the World 2.58 -35 20 -0.6 -4 -2
World 8.19 -25 20 -0.4 -2 -1
Table A.12 Global coalition. carbon tax of 10 euro/tCO2 (TG10). 2020
CO2 Target Target CO2 C-tax NI
Energy-Intensive All other Sectors (TgC) comp. 1990 comp. 2020 (%) (€/tCO2) (%) (%) (%) EU-25 1.57 -10 10 -0.1 0 0 Netherlands 0.06 -8 10 -0.1 0 -1 Germany 0.29 -8 10 -0.1 0 0 France 0.15 -6 10 0.0 0 0 United Kingdom 0.21 -9 10 -0.1 0 0 USA 1.79 -14 10 -0.1 -1 -1
Former Soviet Union 0.66 -17 10 -0.5 -5 -3
Annex I 4.72 -13 10 -0.1 -1 -1
Non Annex I 4.37 -21 10 -0.2 -2 -1
Latin America 0.80 -9 10 -0.3 -1 -1
Middle East 0.62 -9 10 -0.5 -3 -3
Rest of the World 2.95 -26 10 -0.2 -2 -1
Table A.13 Annex I coalition. carbon tax of 20 euro/tCO2 (TA20). 2020
CO2 Target Target CO2 C-tax NI
Energy-Intensive All other Sectors (TgC) comp. 1990 comp. 2020 (%) (€/tCO2) (%) (%) (%) EU-25 1.45 -17 20 -0.4 -2 -1 Netherlands 0.05 -15 20 -0.3 -2 -1 Germany 0.27 -15 20 -0.3 -2 0 France 0.14 -11 20 -0.2 -1 0 United Kingdom 0.20 -15 20 -0.3 -1 -1 USA 1.60 -23 20 -0.2 -3 -1
Former Soviet Union 0.57 -28 20 -1.0 -11 -5
Annex I 4.26 -21 20 -0.3 -3 -1
Non Annex I 5.57 1 0 0.0 1 0
Latin America 0.89 1 0 0.0 1 0
Middle East 0.69 0 0 -0.2 2 -2
Rest of the World 3.99 1 0 0.1 1 0
World 9.82 -10 20 -0.2 -1 -1
Table A.14 Annex I coalition. carbon tax of 10 euro/tCO2 (TA10). 2020
CO2 Target Target CO2 C-tax NI
Energy-Intensive All other Sectors (TgC) comp. 1990 comp. 2020 (%) (€/tCO2) (%) (%) (%) EU-25 1.56 -10 10 -0.2 -1 0 Netherlands 0.06 -9 10 -0.2 -1 -1 Germany 0.29 -9 10 -0.2 -1 0 France 0.14 -7 10 -0.1 0 0 United Kingdom 0.21 -9 10 -0.1 0 -1 USA 1.78 -14 10 -0.1 -2 -1
Former Soviet Union 0.65 -18 10 -0.4 -6 -3
Annex I 4.69 -13 10 -0.1 -1 -1
Non Annex I 5.56 0 0 0.0 1 0
Latin America 0.89 0 0 0.0 1 0
Middle East 0.69 0 0 -0.1 1 -1
Rest of the World 3.98 0 0 0.0 1 0
Some small technical errors have been made in compiling the Report “Caps and Fences in Climate Change Policies, Trade-offs in shaping post-Kyoto”. They concern the following: [1] Replace Tg C by Pg C throughout the report,
[2] Figure 2.1 should be replaced by the Figure below,
0.00 0.10 0.20 0.30 0.40 2000 2005 2010 2015 2020 in 1 0 T on ne C p er C ap it a
Convergence Annex I Convergence Non-Annex I Baseline Annex I Baseline Non-Annex I
Figure 2.1 Baseline emissions and emission permits for Annex I and non-Annex I, in Pg C per capita, 2000-2020
[3] Figure 4.1 should be replaced by the Figure below.
Figure 4.1 Global Income losses and emission reductions, 2020
0.0 0.5 1.0 1.5 2.0
Global Emission Reduction ( Pg C
G loba l In co m e L os se s in 202 0 (% c om pared to BA U ) Annex I Cases Global Cases EU unilateral Cases RA30-C UA30-C RG30 20 Celsius EU objective 0.0 0.5 1.0 1.5 2.0 Annex I Cases Global Cases EU unilateral Cases RA30-C UA30-C RG30 20 Celsius EU objective 0.0 0.5 1.0 1.5 2.0 Annex I Cases Global Cases EU unilateral Cases RA30-C UA30-C RG30 20 0.0 0.5 1.0 1.5 2.0
Global Emission Reduction ( )
G loba l In co m e L os se s in 202 0 (% c om pared to BA U ) Annex I Cases Global Cases EU unilateral Cases RA30-C UA30-C RG30 20 Celsius EU objective 0.0 0.5 1.0 1.5 2.0 Annex I Cases Global Cases EU unilateral Cases RA30-C UA30-C RG30 20 Celsius EU objective 0.0 0.5 1.0 1.5 2.0 Annex I Cases Global Cases EU unilateral Cases RA30-C UA30-C RG30 20 0.5 1.0 1.5 2.0 2.5 3.0 0.0 0.5 1.0 1.5 2.0
Global Emission Reduction ( Pg C
G loba l In co m e L os se s in 202 0 (% c om pared to BA U ) Annex I Cases Global Cases EU unilateral Cases RA30-C UA30-C RG30 20 Celsius EU objective 0.0 0.5 1.0 1.5 2.0 Annex I Cases Global Cases EU unilateral Cases RA30-C UA30-C RG30 20 Celsius EU objective 0.0 0.5 1.0 1.5 2.0 Annex I Cases Global Cases EU unilateral Cases RA30-C UA30-C RG30 20 0.0 0.5 1.0 1.5 2.0
Global Emission Reduction ( )
G loba l In co m e L os se s in 202 0 (% c om pared to BA U ) Annex I Cases Global Cases EU unilateral Cases RA30-C UA30-C RG30 20 Celsius EU objective 0.0 0.5 1.0 1.5 2.0 Annex I Cases Global Cases EU unilateral Cases RA30-C UA30-C RG30 20 Celsius EU objective 0.0 0.5 1.0 1.5 2.0 Annex I Cases Global Cases EU unilateral Cases RA30-C UA30-C RG30 20 0.5 1.0 1.5 2.0 2.5 3.0