RIVM report 711701037/2004
Relevancy of human exposure via house dust to the contaminants lead and asbestos
A.G. Oomen, J.P.A. Lijzen
This investigation has been performed by order and for the account of the Ministry of Housing, Spatial Planning and the Environment (VROM), Directorate-General for Environmental Protection, Directorate of Soil, Water and Rural Area (BWL), within the framework of project 711701, ‘Risks in relation to soil quality’.
Abstract
The present report addresses the issues whether house dust is likely to contribute substantially to the exposure of humans, in particular for the contaminants lead and asbestos. House dust consists for 30-70% of soil material, indicating that contaminated soil can lead to contaminated house dust. It is concluded that exposure to lead via house dust should be included in risk assessment. The studies in which the amount of soil ingested by children are estimated use tracers in soil that are obviously both present in soil outdoors and in soil in house dust. Therefore, using this amount of soil ingested by children to cover both exposure of lead via soil outdoors and soil in house dust is
reasonable. However, a correction factor of 2 is recommended to account for enrichment of lead in house dust in comparison with outdoor soil. This factor also accounts for lead in house dust from other lead sources than soil contamination. Significant contribution of asbestos to house dust from asbestos contaminated soil may occur at soil concentrations over 100 mg/kg. It is recommended to determine asbestos levels in house dust in houses adjacent to sites that are contaminated with asbestos above 1000 mg/kg for nonfriable asbestos, and above 100 mg/kg for friable asbestos. These recommendations are in agreement with a draft assessment protocol on site specific assessment of human risks to soil contamination with asbestos. For further recommendations concerning the risk assessment of asbestos in house dust, we refer to this protocol.
Key words: house dust; lead; asbestos; CSOIL; risk assessment; children
Rapport in het kort
In het rapport wordt bestudeerd of huisstof substantieel kan bijdragen aan de blootstelling van de mens aan contaminanten, met name voor de contaminanten lood en asbest.
Huisstof bestaat voor 30-70% uit bodemmateriaal, wat betekent dat verontreinigde bodem kan leiden tot verontreinigd huisstof. Er is geconcludeerd dat blootstelling aan lood via huisstof zou moeten worden meegenomen in risicobeoordeling van
bodemverontreiniging. De studies waarin de inname van bodem door kinderen worden geschat gebruiken merkstoffen in bodem die zowel in bodem buiten als in bodem in huisstof zitten. Het is daarom redelijk om deze hoeveelheid bodem te gebruiken om zowel blootstelling aan lood via bodem buiten en huisstof te omvatten. Echter, een correctiefactor van 2 wordt aanbevolen om voor verrijking van lood in huisstof te verdisconteren. Deze factor verdisconteert tevens voor andere loodbronnen dan lood afkomstig van gecontamineerde bodem. Een significante bijdrage van asbest in bodem aan asbest in huisstof kan gebeuren bij concentraties hoger dan 100 mg/kg. Daarom wordt aanbevolen de asbestconcentraties in huisstof te bepalen in huizen waarbij de bodem is verontreinigd met asbest boven de 1000 mg/kg voor hechtgebonden asbest, en boven de 100 mg/kg voor niet-hechtgebonden asbest. Deze aanbevelingen zijn in overeenstemming met een concept beoordelingsprotocol voor locatie-specifieke risicobeoordeling van asbest in bodem. Enkele aanmerkingen op dit protocol zijn beschreven. Voor verdere aanbevelingen met betrekking tot asbest in huisstof wordt verwezen naar dit protocol.
Contents
Samenvatting 5
Summary 7
1. General introduction 9
2. General characteristics house dust 11
2.1 What is the origin of house dust 11
2.2 Amounts of house dust 11
2.2.1 Sampling 11
2.2.2 Dust loading 11
2.2.3 Resuspension 12
2.2.4 Comparison to reference value 12
2.3 Contribution of soil to house dust 14
2.4 Dust in air 14
2.4.1 Overview several recent studies on dust in air 14
2.4.2 Comparison to reference values 15
2.5 Conclusions 18
3. Lead 19
3.1 Origin of Pb in house dust 19
3.2 Pb levels in house dust 19
3.2.1 Pb concentration 22
3.2.2 Pb loading 22
3.3 Is there a relationship between the concentration of Pb in house dust and Pb in exterior soil? 23
3.4 Pb in air 25
3.5 Exposure to Pb via house dust in risk assessment in Canada and USA 27
3.5.1 Canada 27
3.5.2 USA 27
3.6 Contribution of Pb in house dust, outdoor soil, and air to Pb exposure in children 28
3.6.1 Qualitative 28
3.6.2 Quantitative assessment 30
3.7 Recommendations for handling the contribution of house dust in risk assessment in the
Netherlands 32
3.8 Conclusions 34
4. Asbestos 37
4.1 Origin and types of asbestos 37
4.2 Concentration of asbestos in house dust 38
4.3 Is there a relationship between the concentration of asbestos in house dust and asbestos in
4.4 Asbestos in air 40 4.5 Contribution of asbestos in house dust and air to asbestos exposure 42
4.5.1 Qualitative 42
4.5.2 Quantitative assessment 42
4.6 Recommendations for the contribution of house dust in risk assessment of asbestos in the
Netherlands 44
4.7 Conclusions 45
5. Overall conclusions and recommendations 47
Acknowledgement 49
References 51
Samenvatting
Blootstelling aan bodemverontreiniging voor de humane risicobeoordeling wordt momenteel meestal gebaseerd op orale inname van bodem en voedsel, inhalatie van lucht, en blootstelling via de huid. Blootstelling aan contaminanten via huisstof wordt in Nederland tot op heden niet expliciet meegenomen. In het huidige rapport wordt, op basis van literatuur, onderzocht of huisstof substantieel kan bijdragen aan humane blootstelling aan contaminanten, in het bijzonder voor de contaminanten lood en asbest. Om in te kunnen schatten of verontreiniging in huisstof is veroorzaakt door verontreinigde grond is tevens de bijdrage van bodem aan huisstof bestudeerd, en is bekeken of er een relatie bestaat tussen de lood- en asbestconcentratie in bodem buiten en in huisstof.
Huisstof algemeen. In het rapport is eerst algemene informatie over huisstof verzameld. In de meeste studies beschreven in de literatuur is minder dan 1 g stof/m2 gevonden voor harde oppervlakken, wat in overeenstemming is met de huidige aanname in het
blootstellingsmodel CSOIL van 0,56 g/m2.
Verscheidene experimentele studies suggereren dat huisstof voor 30-70% bestaat uit bodemmateriaal. Deze range is lager dan de 80% die momenteel wordt gebruikt in het CSOIL model. Een verlaging van dit percentage wordt daarom geadviseerd. De
concentratie zwevend stof in de lucht in huizen is over het algemeen 50 mg/m3 of minder. Stofconcentraties in de lucht waren hoger vlakbij iemand (persoonlijke meting) of op lage hoogte (representatief voor kinderen). Persoonlijke metingen zijn waarschijnlijk representatiever voor humane blootstelling. Daarom worden persoonlijke metingen van 60 mg/m3 voor matig drukke locaties en van 100 mg/m3 voor drukke locaties zoals klaslokalen aangeraden voor toekomstig gebruik in CSOIL.
Lood. Vervolgens is de bijdrage van huisstof aan de blootstelling van lood bestudeerd. Op basis van de literatuur is geconcludeerd dat de gemiddelde loodconcentratie in huisstof meestal ligt in de range 300-700 mg/kg. De loodconcentratie in huisstof is over het algemeen, gemiddeld een factor 3, hoger dan in bodem buiten.
In sommige studies is een directe relatie gevonden tussen de loodconcentratie in huisstof en in bodem, terwijl andere studies niet een dergelijke relatie aantoonden. Desalniettemin suggereren veel experimentele en epidemiologische studies dat huisstof een belangrijke bron van blootstelling aan lood kan zijn. Hoewel weinig informatie over de hoeveelheid huisstof die ingeslikt wordt bekend is, geven berekeningen aan dat de blootstelling van kinderen aan lood via ingestie van bodem en huisstof waarschijnlijk van dezelfde
ordegrootte is, terwijl blootstelling aan lood via inhalatie verwaarloosbaar is. Daarom zou blootstelling aan lood via huisstof expliciet moeten worden gemaakt in de
risicobeoordeling. De studies waarin de hoeveelheid bodem wordt geschat die kinderen inslikken gebruiken merkstoffen die aanwezig zijn in zowel bodem buiten als in bodem in huisstof. Het is daarom redelijk om deze hoeveelheid bodem die kinderen inslikken te gebruiken voor bodemingestie zowel afkomstig van bodem buiten en bodem in huisstof (in totaal 100 mg/dag). Echter, een correctiefactor van 2 wordt aanbevolen om de verrijking van lood in huisstof ten opzichte van lood in bodem te verdisconteren. Deze factor verdisconteert ook de bijdrage van andere loodbronnen dan verontreinigde bodem. Op dit moment is het niet mogelijk de bijdrage van verrijking van lood in huisstof en de bijdrage van lood uit andere bronnen dan bodem te scheiden. Verder onderzoek naar de hoeveelheden huisstof en bodem die worden ingeslikt, en naar de hoeveelheid lood in bodemmateriaal in huisstof wordt aanbevolen.
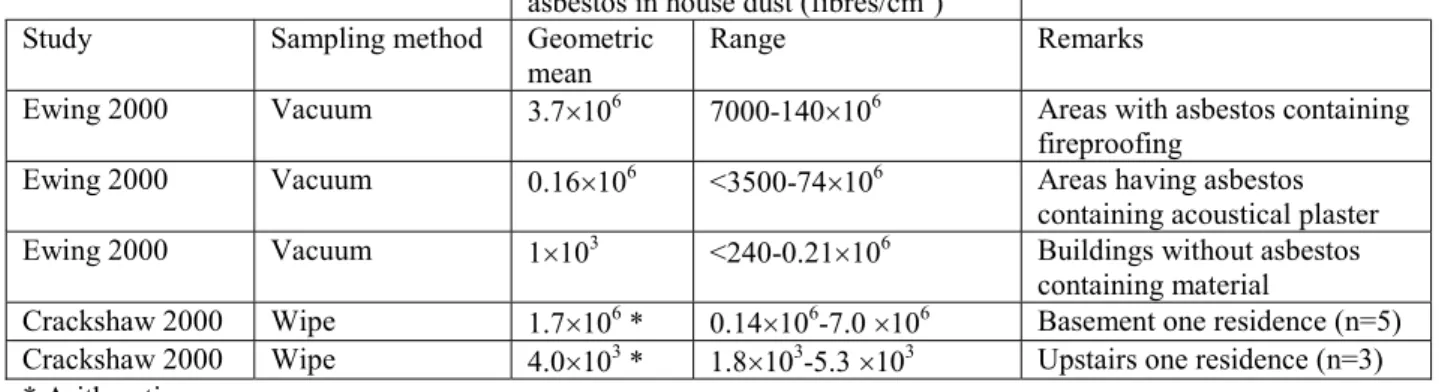
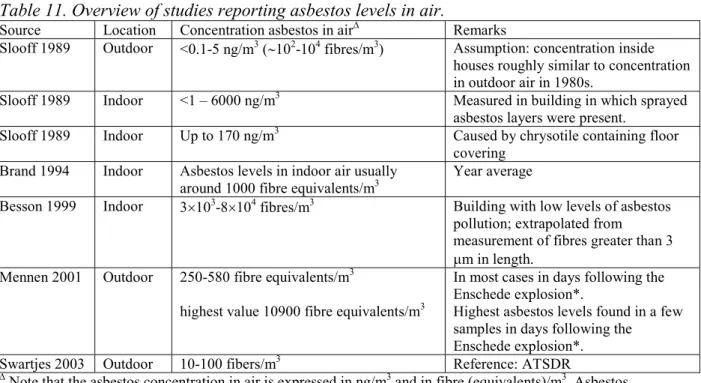
Asbest. Tot slot is de bijdrage van huisstof aan de blootstelling van asbest bestudeerd. De achtergrondconcentratie van asbest in huisstof is ongeveer 1´103 vezels/cm2. Deze waarde kan toenemen met een factor 1´104 in gecontamineerde huizen. Er is mogelijk een relatie tussen asbest in huisstof en asbest in de lucht. De achtergrondconcentratie van asbest in de binnenshuislucht is ongeveer 1´103 vezels/m3.
Asbest gecontamineerde bodem draagt waarschijnlijk slechts in een enkel geval bij aan asbestverontreiniging binnenshuis. In deze gevallen is de bodem gecontamineerd met hoge asbestconcentraties en ligt de gecontamineerde bodem in de directe omgeving van het huis. Gebaseerd op een hypothetische berekening kan een significante bijdrage van bodem aan huisstof worden verwacht bij bodemconcentraties hoger dan 100 mg/kg. Daarom wordt aanbevolen om de asbestconcentratie in huisstof te meten als de asbestconcentratie in bodem hoger is dan 1000 mg/kg voor hechtgebonden asbest, en hoger dan 100 mg/kg voor niet-hechtgebonden asbest. Deze aanbevelingen zijn in overeenstemming met een concept beoordelingsprotocol voor locatie-specifieke humane risico’s van bodemverontreiniging met asbest. In dit protocol, opgesteld door TNO-MEP, wordt een gedetailleerde procedure omschreven welke de beoordeling van asbest in huisstof omvat. Voor verdere aanbevelingen voor risicobeoordeling van asbest in huisstof wordt verwezen naar dit protocol. Enkele aanmerkingen op dit protocol zijn beschreven. Beleidsrelevantie
Blootstelling aan contaminanten via huisstof zou, tenminste voor lood en andere immobiele contaminanten, bij de beoordeling van risico’s van bodemverontreiniging moeten worden betrokken en op termijn moeten worden geïmplementeerd in het blootstellingsmodel CSOIL. Deze aanpassing van CSOIL vormt een onderdeel van een verbeterde methode voor de bepaling van locatiespecifieke humane risico’s, waaraan op het RIVM momenteel onderzoek wordt verricht. Deze verbeterde methode kan onderdeel uit gaan maken van de uitwerking van het nieuwe bodembeleid, zoals geformuleerd in de Beleidsbrief bodem van December 2003. De verbeterde methode voor de bepaling van (locatiespecifieke) humane risico’s zou onderdeel uit kunnen maken van het
Saneringscriterium en/of van een procedure welke kan worden gebruikt om regionaal te bepalen Ambitieniveaus af te leiden. Afhankelijk van de formele positionering van de methode zal de rol van blootstelling aan contaminanten in huisstof in overleg met ‘het beleid’ in een volgende fase in een op het doel afgestemde vorm worden gegoten
(bijvoorbeeld als onderdeel van een richtlijn voor beoordeling van humane risico’s waar ook het blootstellingsmodel CSOIL binnen kan passen).
Summary
In current human risk assessment, exposure to contaminants is generally estimated on the basis of oral intake of soil, food and liquids, inhalation of air, and exposure via the skin. Exposure to contaminants via house dust has, up till now, not been considered in the Netherlands. The present report addresses the issues whether house dust is likely to contribute substantially to exposure of contaminants to humans, in particular, for the contaminants lead and asbestos. In addition, to investigate whether contamination of house dust is caused by soil material in dust, the contribution of exterior soil to house dust is investigated, and whether a relationship exists between lead or asbestos concentration in exterior soil and house dust.
General information house dust. First, general information on house dust was collected. Most studies were seen to have found less than 1 g dust/m2 for hard surfaces, which is in agreement with the current assumption in the exposure model CSOIL of 0.56 g/m2. Several experimental studies indicate that house dust consists for 30-70% of soil
material. This range is lower than the 80% that currently assumed by the CSOIL model. A reduction is therefore advised.
The concentration of particulate matter in air inside homes was found, in general, to be 50 mg/m3 or less. Particulate matter concentrations were higher when measured near the subject (personal samples) or at lower heights (representative for children), than in bulk indoor air. Personal samples are probably more representatives for human exposure. Therefore, personal samples of 60 mg/m3 for moderately crowded places, and 100 mg/m3 for crowded places such as classrooms are recommended in CSOIL for future use. Lead. Subsequently, contribution of house dust to lead exposure was assessed. Based on studies described in literature, we found a mean concentration of lead in house dust generally occurred in the range 300-700 mg/kg. The lead concentration in house dust is generally averaged at a factor 3 higher than in exterior soil.
Some studies found a direct relationship between lead concentration in house dust and in soil, whereas other studies did not. Yet, many experimental and epidemiological studies suggest that house dust can be a major source of exposure to lead. Although very little information is available on amounts of dust ingestion, calculations suggest that exposure of children to lead via ingestion of soil and house dust is probably in the same order of magnitude, whereas exposure to lead via inhalation is negligible. Therefore, exposure to lead via house dust should be included in risk assessment.
The studies in which the amount of soil ingested by children are estimated, used tracers in soil that are obviously both present in soil outdoors and soil in house dust. Therefore, it is reasonable to use this amount of soil ingested by children to cover both soil outdoors and soil in house dust (100 mg/day). However, an extra correction factor of 2 is
recommended to account for enrichment of lead in house dust in comparison with outdoor soil. This factor also accounts for sources of lead contamination in house dust other than contamination via soil. At present, it is not possible to separate the
contribution of enrichment of lead in house dust and the contribution of lead from other sources than soil to the exposure of humans to lead. Further research about the amounts of dust and soil ingestion, and the contribution of house dust and soil to lead exposure is recommended.
Asbestos. Finally, the contribution of house dust to the exposure of asbestos was studied. Background levels of asbestos in house dust are about 1´103 fibres per cm2. This value can increase up to a factor 1´104 for contaminated houses. There is possibly a
relationship between asbestos in house dust and asbestos in indoor air. For background houses, asbestos levels in air are approximately 1´103 fibres per m3.
Asbestos-contaminated soil contributes probably only in a few cases to asbestos levels inside houses. In these cases, the soil would have to be contaminated with high levels of asbestos and the contaminated site would have to be found in the vicinity of the house. On the basis of a hypothetical calculation, asbestos-contaminated soil may contribute significantly to house dust at soil concentrations greater than 100 mg/kg. Therefore, it is recommended to determine asbestos levels in house dust in houses adjacent to sites that are contaminated with asbestos above 1000 mg/kg for nonfriable asbestos, and above 100 mg/kg for friable asbestos. These recommendations are in agreement with a draft assessment protocol by TNO-MEP on site specific assessment of human risks to soil contamination with asbestos. Detailed procedures including assessment of asbestos in house dust, are described in the protocol. Therefore, for further recommendations for risk assessment of asbestos in house dust, we refer to this protocol. Several comments on the protocol are included in the report.
Usefulness for policy making
Exposure to contaminants via house dust should, at least for lead and other immobile contaminants, be included in the risk assessment of soil contamination and, in due time, be implemented in the exposure model CSOIL. This adaptation of CSOIL is part of an improved method for the assessment of human risks, which RIVM is currently working on. The improved method can be part of the development of the new soil policy, as formulated in the ‘policy letter on soil’ of December 2003. The improved method for the assessment of location specific human risks could be part of a remediation criterion and/or of the procedure that can be used to determine soil quality criteria for regional use. Depending on the status of the method, the role of contaminant exposure via house dust will, in consultation with policy makers, in the next phase be put in a for the purpose appropriate form (for example as part of the guideline on the assessment of human risks).
1. General
introduction
In present human risk assessment, exposure to contaminants is estimated based on oral intake of soil, food and liquids, inhalation of air, and exposure via the skin. Exposure to contaminants via house dust has, up till now, not been explicitly considered in exposure assessment in the Netherlands (Lijzen et al., 2001). Because most individuals spent relatively little time outdoors and much time indoors, exposure to house dust may be an important exposure route. House dust is often resuspended due to the dry atmosphere and activity in the house, and contaminants may remain in the house for a long time. In addition, house dust consists of fine particles, which adhere well to skin and clothing (Duggan et al., 1985) and are easily ingested or respired. Contaminants in house dust can originate from many sources, such as interior sources, from soil that is brought inside, or via (particulates in) air.
The present report addresses the issues whether house dust is likely to contribute substantially to the exposure of contaminants, in particular for lead (Pb) and asbestos, and to what extent exterior soil contributes to house dust. We mainly focus on exposure to children because children ingest more soil and house dust than adults. Also from a toxicological point of view children are the group at risk. Pb already affects children at low doses. Children are also of main concern for asbestos exposure, since they have a long life expectancy and exposure to asbestos can cause (lung) cancer several decades after exposure. The reason for choosing to investigate Pb is that Pb is a contaminant of primary concern in the Netherlands, due to its occurrence and its effects on human health. The contribution of asbestos in house dust to human exposure was investigated as Swartjes et al. noticed that information about this issue was missing and recommended further research (Swartjes et al., 2003).
With the information gathered in this report, exposure of children to Pb and asbestos via ingestion of inhalation of house dust is calculated according to the exposure model CSOIL. If possible, values for characteristics of house dust obtained from studies described in the literature are compared to values of the same characteristics that were estimated by Hawley (Hawley, 1985). Estimates of Hawley are currently used as input for the exposure model CSOIL (Otte et al., 2001).
The present report is composed in the following manner. Chapter 2 is dedicated to some general characteristics of house dust. The origin of house dust, amounts of house dust on surfaces in the house, the fraction of soil in house dust, and amounts of house dust in air are addressed.
Chapter 3 deals with Pb. The levels of Pb in house dust, the relationship between the concentration of Pb in house dust and in exterior soil, and the concentration of Pb in air are addressed. Subsequently, exposure of Pb via house dust in exposure assessment in Canada and the USA is discussed, and the contribution of Pb in house dust, outdoor soil, and air to Pb exposure in children is addressed qualitatively and quantitatively when possible. Finally, recommendations for risk assessment are given. Main conclusions for Pb are summarised at the end of Chapter 3.
In Chapter 4 the same topics as for Pb are dealt with for asbestos. When available, concentrations of asbestos in house dust are summarised, information about the relationship between the asbestos in house dust and exterior soil, the concentration of asbestos in air, and the contribution of house dust to asbestos exposure is given.
Subsequently, recommendations for risk assessment on asbestos exposure via house dust are given.
Overall conclusions are summarised in Chapter 5.
It should be noted that an extensive literature search is performed on the issues addressed in this report. However, for some issues it was not feasible to study all related literature. Yet, the authors are convinced that the present report gives a representative picture of the different aspects on the contribution of house dust to Pb and asbestos exposure.
2.
General characteristics house dust
The purpose of this chapter is to get notion of some general characteristics of house dust. First, the origin of house dust is addressed (§ 2.1). Subsequently, an overview is given of studies in which amounts of house dust are determined, to get a picture of the amounts of house dust that can be present on surfaces in the house under normal conditions (§ 2.2). The next section deals with the contribution of exterior soil in house dust (§ 2.3). Finally, the amounts of dust in air are addressed (§ 2.4), and conclusions are summarised (§ 2.5).
2.1
What is the origin of house dust
House dust is a heterogeneous mixture. A number of sources contribute to this mix, including tracked-in or resuspended soil particles, clothing, atmospheric deposition of particulates, hair, fibres (artificial and natural), molds, pollen, allergens, bacteria, viruses, arthropods, ash, soot, animal fur and dander, smoke, skin particles, cooking and heating residues, and building components among others ((Paustenbach et al., 1997), and references in Paustenbach).
2.2
Amounts of house dust
2.2.1 Sampling
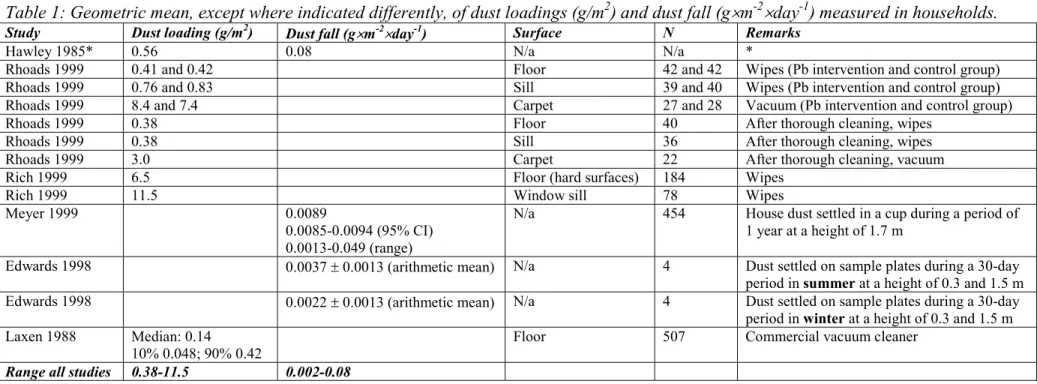
Table 1 presents a list of the amounts of house dust that were determined in several studies. Various methods exist for sampling of house dust. The methodapplied can highly affect the outcome. In a study by Sterling et al. (Sterling et al., 1998), three vacuums and one wipe method were evaluated for the collection of house dust. The Pb loading, i.e. the amount of Pb per surface area, was determined with these methods; the amounts of house dust were not reported. The results showed that the Pb loading could differ to factors sometimes higher than 100 between sampling methods. Probably the dust loading determined by different sampling methods can vary to a similar extent. The two most reliable methods were the wipe and one vacuum method, showing differences up to a factor 28, with the wipe method giving lower collection efficiencies. The vacuum method was highly efficient in removing deeply embedded dust, whereas the wipe method
collected surface dust, especially on carpets. Another vacuum method gave even lower efficiencies than the wipe method (Sterling et al., 1998), indicating that vacuum methods can show very large differences in sampling efficiencies.
2.2.2 Dust loading
As can be seen in Table 1, the geometric mean of the range of dust settled in cup or on plates based on experimental studies varies between 0.0022 and 0.0089 g´m-2´day-1, which is considerably lower than the geometric mean of the range of dust loading
determined by wipes and vacuum, which ranges between 0.1 and 11.5 g/m2. Amounts of house dust determined by wipes and vacuum are the results of several days. In addition, cleaning does not remove all dust, as can be seen in Table 1 from the study by Rhoads et al. (Rhoads et al., 1999). This study showed a reduction of a factor 1-2.8 in dust loading
after cleaning. Similarly, Rich et al. found a reduction of a factor 1.1-3.6 in dust loading after cleaning (Rich et al., 1999). Most vacuum cleaners do not trap small (<20 mm) particles and will simply re-enter them into the air (references in (Paustenbach et al., 1997)).
The amounts of dust determined on floors and window sills show large differences, with geometric mean dust loadings between 0.41 and 6.5 g/m2 for floors, and between 0.76 and 11.5 g/m2 for window sills. The amount of dust determined from carpets with vacuuming ranged from 7.4 to 8.4 g/m2. The lower variation is probably because only one study is considered using the same sampling method.
2.2.3 Resuspension
Meyer et al. (Meyer et al., 1999) determined that the number of persons living in a residence was significantly associated with elevated amounts of dust sedimented per day, probably due to increased indoor activities such as vacuuming, sweeping, cleaning, and children playing. Thatcher and Layton have shown that the resuspension rate is particle size dependent (Thatcher et al., 1995). Particles with diameters of 5-25 mm are most readily resuspended and even light activity such as walking into and out of the room can have a significant impact on the concentration of airborne particles greater than 5 mm, whereas particles of 0.3 - 1 mm are not affected by either cleaning or walking (Thatcher et al., 1995).
2.2.4 Comparison to reference value
Estimates of Hawley have been used as input for the exposure model CSOIL. Hawley assumes an average dust covering of surfaces of 0.56 g/m2 (Hawley, 1985). Most studies estimate a similar or lower value for dust covering of hard surfaces (Table 1), except for Rich et al. (Rich et al., 1999). For unknown reasons, they found dust loadings of a factor 12-21 higher.
Hawley assumes an average dust fall inside the house of 0.08 g´m-2´day-1 (Hawley, 1985). Dust fall determined in studies by Meyer et al. (Meyer et al., 1999) and Edwards et al. (Edwards et al., 1998) was a factor 9-36 lower than the value assumed by Hawley. The estimate by Hawley was based on available data at that time and no reference or further information was given about the derivation of this figure. Therefore, the values of Meyer et al. and Edwards et al. are recommended, thus assuming that dust fall is
Table 1: Geometric mean, except where indicated differently, of dust loadings (g/m2) and dust fall (g´m-2´day-1) measured in households.
Study Dust loading (g/m2) Dust fall (g´m-2´day-1) Surface N Remarks
Hawley 1985* 0.56 0.08 N/a N/a *
Rhoads 1999 0.41 and 0.42 Floor 42 and 42 Wipes (Pb intervention and control group)
Rhoads 1999 0.76 and 0.83 Sill 39 and 40 Wipes (Pb intervention and control group)
Rhoads 1999 8.4 and 7.4 Carpet 27 and 28 Vacuum (Pb intervention and control group)
Rhoads 1999 0.38 Floor 40 After thorough cleaning, wipes
Rhoads 1999 0.38 Sill 36 After thorough cleaning, wipes
Rhoads 1999 3.0 Carpet 22 After thorough cleaning, vacuum
Rich 1999 6.5 Floor (hard surfaces) 184 Wipes
Rich 1999 11.5 Window sill 78 Wipes
Meyer 1999 0.0089
0.0085-0.0094 (95% CI) 0.0013-0.049 (range)
N/a 454 House dust settled in a cup during a period of 1 year at a height of 1.7 m
Edwards 1998 0.0037 ± 0.0013 (arithmetic mean) N/a 4 Dust settled on sample plates during a 30-day period in summer at a height of 0.3 and 1.5 m Edwards 1998 0.0022 ± 0.0013 (arithmetic mean) N/a 4 Dust settled on sample plates during a 30-day
period in winter at a height of 0.3 and 1.5 m Laxen 1988 Median: 0.14
10% 0.048; 90% 0.42 Floor 507 Commercial vacuum cleaner
Range all studies 0.38-11.5 0.002-0.08
N/a: not available.
* Estimate for risk assessment based on available data at that time; no reference of further information was given about the derivation of this figure. The estimates of Hawley have been used as input for the exposure model CSOIL.
2.3
Contribution of soil to house dust
Various researches have examined the contribution of exterior soil to interior dusts, see Table 2.
Table 2: Estimates of the relative contribution of exterior soil to house dust. Estimates were based on research described in articles, except where indicated differently.
Study % soil in house dust
Hawley (1985) * >80
Thornton et al. (1985)** 20 Camann and Harding (1989) ** 50 Fergusson and Kim (1991) 32-50 Calabrese and Stanek (1992) 31
Sterling (1998) 37 (based on particle volume weighting) 8 (based on particle concentration weighting)
EPA (1998) 70
* Estimate for risk assessment based on available data at that time; no reference or further information was given about the derivation of this figure.
** Value and reference adopted from Paustenbach et al. (Paustenbach et al., 1997).
Estimates of the contribution of soil to house dust range from 8 to >80%, depending on a wide variety of site-specific factors and methodological approaches. The value of 80% was
mentioned by Hawley without any reference or further information given about the derivation of this figure (Hawley, 1985). Most studies suggest that approximately 30-50% of house dust originated from exterior soil. However, the US-EPA uses a default value of 70%, i.e.
0.70 g soil/g dust, in the IEUBK model (US-EPA, 1998). The IEUBK model stands for Integrated Exposure Uptake BioKinetic model, and is used to predict the risk of elevated blood lead levels in children that are exposed to environmental Pb from many sources. According to their own account, the default value of 70% in the IEUBK model reflects an analysis of empirical relationships between soil and dust lead concentrations measured in a variety of residential communities (US-EPA, 1998). Therefore, 30-70% of soil in house dust seems a good estimate for the exposure assessment of house dust.
2.4
Dust in air
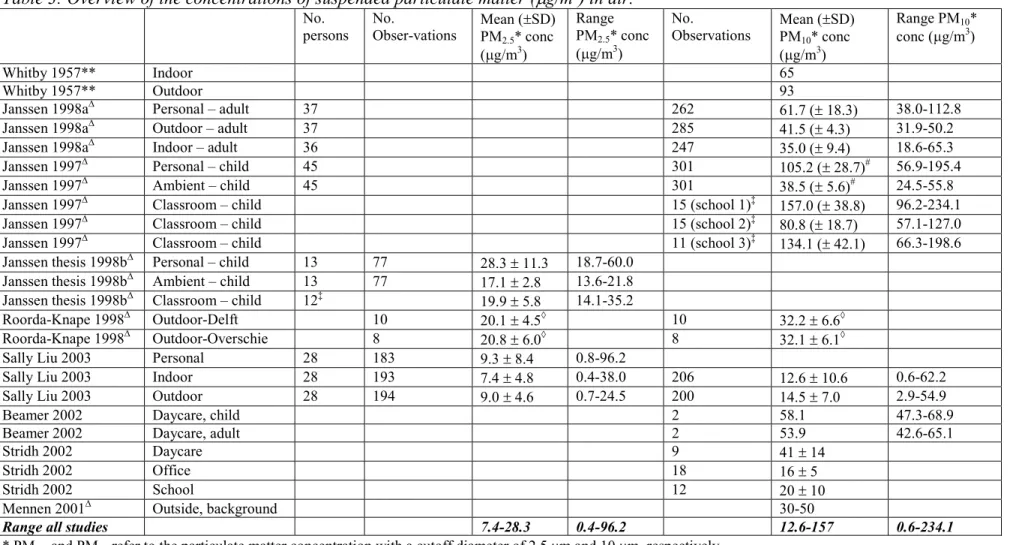
An overview of the concentrations of suspended particulate matter in air, i.e. suspended dust, is presented in Table 3. The value for particulate matter in indoor air that is used in the exposure model CSOIL is 52.5 mg/m3 (outdoor air 70 mg/m3; Otte et al., 2001). This was based on Hawley, who assumes that the concentration of suspended dust in the air inside homes is 75% of that in the outside air (Hawley, 1985). By Whitby et al., a study cited by Hawley, the concentration of airborne particulate matter was determined to be 65 mg/m3 indoors and 93 mg/m3 outdoors (Hawley, 1985). It should be noted that this study was conducted in the 1950s.
2.4.1 Overview several recent studies on dust in air
More recently, Janssen et al. measured personal, indoor, and outdoor particulate matter levels among adults and children (10-12 years of age) in the Netherlands (Janssen et al., 1998a;
Janssen et al., 1997; Janssen, 1998b), see Table 3. PM10 refers to the Particulate Matter concentration with a cut off diameter of 10 mm. Similarly, PM2.5 refers to the Particulate Matter concentration with a cut off diameter of 2.5 mm. Personal samples were measured by a device worn by the subject. In the adult study, outdoor concentrations (mean PM10
41.5 mg/m3) exceeded indoor concentrations (mean PM10 35.0 mg/m3), but underestimated personal adult exposure (mean PM10 61.7 mg/m3) (Janssen et al., 1998a). In contrast, for children, mean indoor PM10 levels in classrooms (81-157 mg/m3) exceeded outdoor levels (39 mg/m3), and were in the same range as personal samples (105 mg/m3) (Janssen et al., 1997; Janssen, 1998b). It should be noted that the high PM10 values of Janssen et al. measured in classrooms (81-157 mg/m3) were 7-8 hour average values for hours during school time, whereas 24 hour average PM10 concentrations were a factor two to five lower (46-74 mg/m3). The large number of persons in the classrooms probably caused high resuspendation resulting in the high PM10 levels.
Janssen et al. found that personal PM10 concentrations of both adults and children were reasonably well correlated over time with outdoor PM10 concentrations, with an intercept of 11.5 (mg/m3), a slope of 0.47, and a Pearson’s correlation coefficient of 0.75 for the adult study (Janssen et al., 1998a; Janssen et al., 1997; Janssen, 1998b). Personal fine particles (PM2.5) exposures were highly correlated with outdoor PM2.5 concentrations, probably due to the smaller impact of (re)suspendation of coarse particles on PM2.5 than on PM10. After taking the influence of exposure to external tobacco smoke, physical activity and the high PM10 concentrations in classrooms into account, the major part of the difference between personal and outdoor PM10 concentrations in children was explained.
In another study, Sally Liu et al. determined that personal, indoor, and outdoor concentrations were similar (see Table 3). Hence, the conclusion of Hawley that the concentration of
suspended dust in the air inside homes is 75% of that in the outside air was not confirmed by the thorough studies of Janssen et al. and Sally Liu et al. (Janssen et al., 1998a; Sally Liu et al., 2003; Janssen et al., 1997; Janssen, 1998b).
The studies also indicate that children are exposed to higher amounts of PM10 than the adults in the same room, due to the higher levels of particulate matter at lower height (Beamer et al., 2002). In addition, PM10 concentrations were related to the number of people and activity occurring in the room, which is likely to be higher in the presence of children.
2.4.2 Comparison to reference values
The values for particulate matter in indoor air for the more recent studies were between 13 and 35 mg/m3 inside homes, between 41 and 58 mg/m3 for daycare facilities (Beamer et al., 2002), and between 13 and 157 mg/m3 including all buildings. The value used by CSOIL of 52.5 mg/m3 and the value mentioned by Hawley of 65 mg/m3 (Hawley, 1985) do not comprise the highest PM10 levels found in the recent studies. However, the high PM10 values of Janssen et al. (81-157 mg/m3 in classrooms) were 7-8 hour average values for hours during school time, whereas 24 hour average PM10 concentrations were a factor two to five lower (46-74 mg/m3). This indicates that the value assumed by Hawley is representative for the 24 hour average concentration including all types of building, i.e. including schools with a high resuspension of particulates for several hours per day. The value used by CSOIL
(52.5 mg/m3) and the value assumed by Hawley (65 mg/m3) are probably also representative or somewhat high for the average PM10 concentrations in houses and other moderately crowded places, but these values do not represent PM10 concentrations in crowded locations such as full classrooms.
Several studies (Janssen et al., 1998a; Janssen et al., 1997; Janssen, 1998b) indicate that personal PM10 levels are generally higher than indoor and outdoor PM10 levels. As personal samples are probably better representatives for human exposure, these values should be used in risk assessment. In this light, the values assumed by Hawley (65 mg/m3) and used in CSOIL (52.5 mg/m3) are slightly underestimating the actual exposure situation. A value of 60 mg/m3 is probably representative for moderately crowded places such as residents, whereas a value of 100 mg/m3 should be used as personal exposure for crowded places such as classrooms.
Table 3: Overview of the concentrations of suspended particulate matter (mg/m3) in air. No.
persons No.
Obser-vations Mean (±SD)PM2.5* conc
(mg/m3)
Range PM2.5* conc
(mg/m3)
No.
Observations Mean (±SD)PM10* conc
(mg/m3)
Range PM10*
conc (mg/m3)
Whitby 1957** Indoor 65
Whitby 1957** Outdoor 93
Janssen 1998a∆ Personal – adult 37 262 61.7 (
± 18.3) 38.0-112.8
Janssen 1998a∆ Outdoor – adult 37 285 41.5 (
± 4.3) 31.9-50.2
Janssen 1998a∆ Indoor – adult 36 247
35.0 (± 9.4) 18.6-65.3
Janssen 1997∆ Personal – child 45 301 105.2 (± 28.7)# 56.9-195.4
Janssen 1997∆ Ambient – child 45 301 38.5 (± 5.6)# 24.5-55.8
Janssen 1997∆ Classroom – child 15 (school 1)‡ 157.0 (± 38.8) 96.2-234.1
Janssen 1997∆ Classroom – child 15 (school 2)‡ 80.8 (± 18.7) 57.1-127.0
Janssen 1997∆ Classroom – child 11 (school 3)‡ 134.1 (± 42.1) 66.3-198.6
Janssen thesis 1998b∆ Personal – child 13 77 28.3
± 11.3 18.7-60.0 Janssen thesis 1998b∆ Ambient – child 13 77 17.1
± 2.8 13.6-21.8 Janssen thesis 1998b∆ Classroom – child 12‡
19.9 ± 5.8 14.1-35.2
Roorda-Knape 1998∆ Outdoor-Delft 10 20.1 ± 4.5◊ 10 32.2 ± 6.6◊
Roorda-Knape 1998∆ Outdoor-Overschie 8 20.8 ± 6.0◊ 8 32.1 ± 6.1◊
Sally Liu 2003 Personal 28 183 9.3 ± 8.4 0.8-96.2
Sally Liu 2003 Indoor 28 193 7.4 ± 4.8 0.4-38.0 206 12.6 ± 10.6 0.6-62.2
Sally Liu 2003 Outdoor 28 194 9.0 ± 4.6 0.7-24.5 200 14.5 ± 7.0 2.9-54.9
Beamer 2002 Daycare, child 2 58.1 47.3-68.9
Beamer 2002 Daycare, adult 2 53.9 42.6-65.1
Stridh 2002 Daycare 9 41 ± 14
Stridh 2002 Office 18 16 ± 5
Stridh 2002 School 12 20 ± 10
Mennen 2001∆ Outside, background 30-50
Range all studies 7.4-28.3 0.4-96.2 12.6-157 0.6-234.1
* PM2.5 and PM10 refer to the particulate matter concentration with a cutoff diameter of 2.5 mm and 10 mm, respectively.
** Values and references adopted from Hawley et al. (Hawley, 1985). Hawley assumes that the concentration of suspended dust inside homes is 75% of that in the outside air (Hawley, 1985).
# Average of 4 schools
‡ 7-8 hour average, the 24 hour average was a factor two to five lower than the 7-8 hour average. ∆ Dutch situation in 1990s.
2.5
Conclusions
In conclusion:
The amount of dust that settles per day is probably relatively constant, with values of 0.002 to 0.009 g´m-2´day-1 (= 2-9 mg´m-2´day-1). The amount of dust that is present on different surfaces in a household is highly variable and depends, among others, on the extent of cleaning. In addition, different sampling methods may lead to highly variable results. The highest dust loadings were 6.5 g/m2 for floors (hard surfaces), 11.5 g/m2 for window sills, and 8.4 g/m2 for carpets. However, most other studies found lower values for dust loadings of < 1 g/m2 for hard surfaces, which is in agreement with the value for dust covering of surfaces assumed by Hawley of 0.56 g/m2 (Hawley, 1985).
Based on several studies it was concluded that soil contributes to 30-70% to house dust. The concentration of particulate matter in indoor air of 52.5 mg/m3 that is used in the exposure model CSOIL is a reasonable value for inside houses and other moderately crowded places. However, data collected with personal samples, i.e. samples taken by a device worn by the subject, are probably more representative for human exposure. Particulate matter
concentrations were higher when measured near the subject or on lower heights (children), than in bulk indoor air. Mean PM10 levels for personal samples are slightly higher (60 mg/m3) for moderately crowded places, or considerably higher (100 mg/m3) for very crowded places such as classrooms. These latter values are recommended in CSOIL for future use and for location specific risk assessment.
3. Lead
The purpose of this chapter is to study the contribution of house dust to Pb exposure in children. To that end, first an overview of the origin of Pb in house dust is given (§ 3.1), and of the Pb levels in house dust (§ 3.2). In § 3.3 the issue is addressed whether a relationship exists between Pb concentration in house dust and exterior soil. Levels of Pb in particulate matter in indoor air are presented in § 3.4. The approach on the exposure of Pb via house dust in risk assessment in Canada and the USA is addressed in § 3.5. In § 3.6 the contribution of Pb in house dust, outdoor soil, and air to Pb exposure in children is addressed qualitatively and quantitatively as well as possible. Recommendations for the contribution of house dust in risk assessment of Pb for the Netherlands are given in § 3.7. Finally, conclusions are
summarised in § 3.8.
3.1
Origin of Pb in house dust
A number of sources contribute to Pb in house dust. Analysis of house dust by Hunt et al. suggests that paint, road dust, and garden soil may all be important Pb sources (Hunt et al., 1992). Pb may also originate from employees carrying home dust in their clothes. Enrichment factors ranging from 3 to 26 have been reported in the Pb concentration in the house dust of workers’ homes compared with controls (Fergusson et al., 1991). In addition, the rates of dust metal loadings were significantly higher among the dwellings where someone smoked in the room compared to those dwellings where nobody smoked (Meyer et al., 1999), indicating that tobacco products can also be a Pb source. Fergusson and Kim mention in their review on sources and speciation of Pb in dust that factors affecting Pb concentrations in house dust are: the area of exposed soil, type of work, house decoration, distance from commercial garages, distance from roads, distance from smelters/mining, dustfall inside, dustiness, existence of a fireplace, house age, house material, old paint, road type, soil and street dust (Fergusson et al., 1991).
3.2
Pb levels in house dust
Two different methods of expressing the concentration of Pb in house dust are in use. Pb in house dust can be expressed as:
1) amount of Pb per amount of dust, i.e. Pb concentration, or
2) amount of Pb per surface area on which dust was collected, i.e. Pb loading.
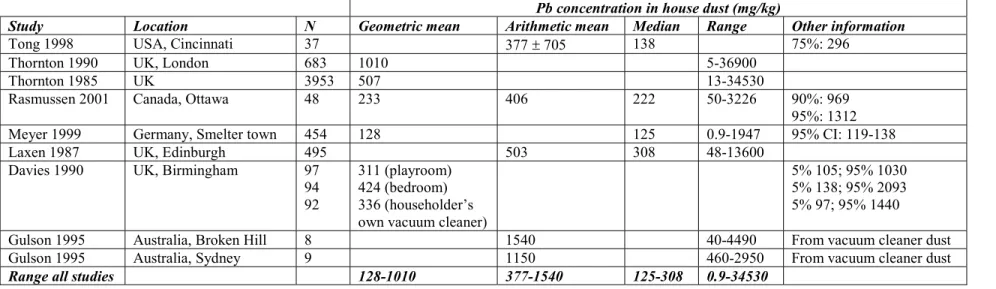
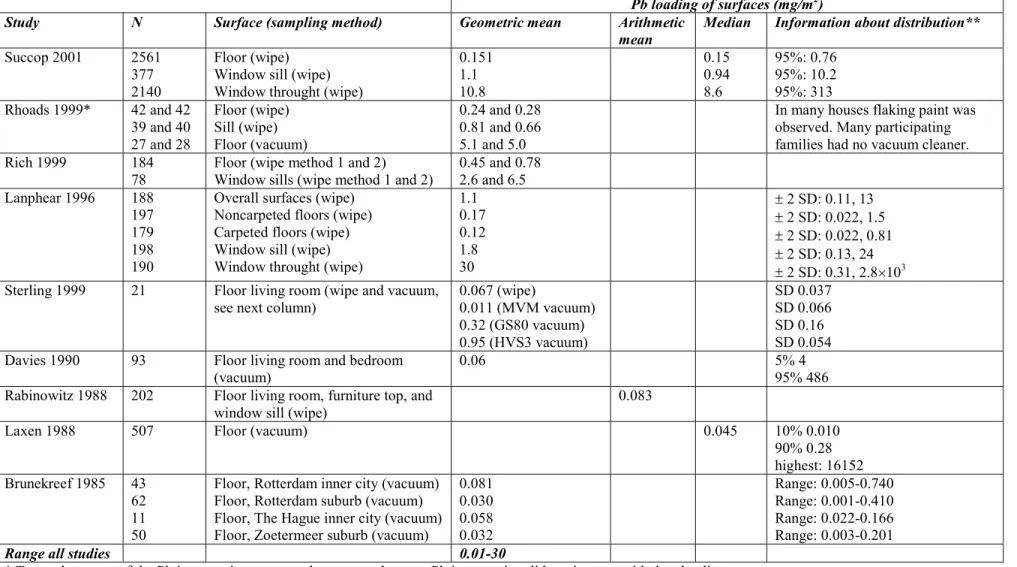
An overview of studies in which the Pb concentration in house dust (mg/kg) was determined is presented in Table 4. Table 5 presents an overview of reported Pb loadings (mg/m2). These tables do not give a complete overview of all studies that have been performed on Pb levels in house dust, but are intended to give a representative picture of the Pb concentration and Pb loading in house dust.
Most studies were conducted when the concentration of Pb in motor vehicle emissions was higher. It is therefore likely that current dust Pb levels are lower than those observed in many of the studies presented in Table 4 and 5.
Table 4: Overview of the Pb concentration (mg/kg) in house dust determined in various studies.
Pb concentration in house dust (mg/kg)
Study Location N Geometric mean Arithmetic mean Median Range Other information
Tong 1998 USA, Cincinnati 37 377 ± 705 138 75%: 296
Thornton 1990 UK, London 683 1010 5-36900
Thornton 1985 UK 3953 507 13-34530
Rasmussen 2001 Canada, Ottawa 48 233 406 222 50-3226 90%: 969
95%: 1312
Meyer 1999 Germany, Smelter town 454 128 125 0.9-1947 95% CI: 119-138
Laxen 1987 UK, Edinburgh 495 503 308 48-13600
Davies 1990 UK, Birmingham 97 94 92
311 (playroom) 424 (bedroom) 336 (householder’s own vacuum cleaner)
5% 105; 95% 1030 5% 138; 95% 2093 5% 97; 95% 1440
Gulson 1995 Australia, Broken Hill 8 1540 40-4490 From vacuum cleaner dust
Gulson 1995 Australia, Sydney 9 1150 460-2950 From vacuum cleaner dust
Table 5: Overview of Pb loading (mg/m2) of surfaces determined in various studies.
Pb loading of surfaces (mg/m2)
Study N Surface (sampling method) Geometric mean Arithmetic
mean Median Information about distribution**
Succop 2001 2561 377 2140
Floor (wipe) Window sill (wipe) Window throught (wipe)
0.151 1.1 10.8 0.15 0.94 8.6 95%: 0.76 95%: 10.2 95%: 313 Rhoads 1999* 42 and 42 39 and 40 27 and 28 Floor (wipe) Sill (wipe) Floor (vacuum) 0.24 and 0.28 0.81 and 0.66 5.1 and 5.0
In many houses flaking paint was observed. Many participating families had no vacuum cleaner. Rich 1999 184
78
Floor (wipe method 1 and 2) Window sills (wipe method 1 and 2)
0.45 and 0.78 2.6 and 6.5 Lanphear 1996 188 197 179 198 190
Overall surfaces (wipe) Noncarpeted floors (wipe) Carpeted floors (wipe) Window sill (wipe) Window throught (wipe)
1.1 0.17 0.12 1.8 30 ± 2 SD: 0.11, 13 ± 2 SD: 0.022, 1.5 ± 2 SD: 0.022, 0.81 ± 2 SD: 0.13, 24 ± 2 SD: 0.31, 2.8´103
Sterling 1999 21 Floor living room (wipe and vacuum,
see next column) 0.067 (wipe)0.011 (MVM vacuum) 0.32 (GS80 vacuum) 0.95 (HVS3 vacuum) SD 0.037 SD 0.066 SD 0.16 SD 0.054 Davies 1990 93 Floor living room and bedroom
(vacuum) 0.06 5% 495% 486
Rabinowitz 1988 202 Floor living room, furniture top, and
window sill (wipe) 0.083
Laxen 1988 507 Floor (vacuum) 0.045 10% 0.010
90% 0.28 highest: 16152 Brunekreef 1985 43 62 11 50
Floor, Rotterdam inner city (vacuum) Floor, Rotterdam suburb (vacuum) Floor, The Hague inner city (vacuum) Floor, Zoetermeer suburb (vacuum)
0.081 0.030 0.058 0.032 Range: 0.005-0.740 Range: 0.001-0.410 Range: 0.022-0.166 Range: 0.003-0.201
Range all studies 0.01-30
* Two values: one of the Pb intervention group and one control group. Pb intervention did not interact with dust loading. ** SD refers to standard deviation
3.2.1 Pb concentration
As can be seen from Table 4, the geometric mean of the Pb concentration in dust varies between 128 and 1010 mg/kg. The variation is considerable, but can easily be explained by factors such as the large variation in Pb sources, the Pb emission from the different Pb sources, the location of Pb sources, cleaning habits etc. This is also apparent from the variation in Pb levels between houses observed in the same study. For example, Laxen et al. measured in a particular house 13.7 g Pb per kg dust, whereas the median Pb concentration was 327 mg/kg (Laxen et al., 1988). Most extreme cases of Pb in house dust can be ascribed to Pb from Pb paint after redecoration of painted surfaces of the house (Laxen et al., 1988; Gulson et al., 1995). The effect of redecoration is short lived, levels returning to normal within 2 months of redecoration ending (Laxen et al., 1988).
A review by Fergusson lists Pb concentrations in house dust in the 1980s (Fergusson et al., 1991). In agreement with the values in Table 4, the Pb concentration in house dust showed a wide range of individual concentrations, but a reasonably constant mean or median
concentration was between 300-700 mg/kg.
3.2.2 Pb loading
Table 5 shows that the Pb loading using a wipe method on the floor varies between 0.067 and 0.78 mg/m2. The variation is similar to the variation determined in the Pb concentration in house dust (Table 4), approximately a factor 10.
Meyer et al. estimated that the geometric mean of the surface loading rate was
1.1 mg Pb´m-2´day-1 (range 0.01-22.6 mg´m-2´day-1) (Meyer et al., 1999). The mean Pb loading rate in urban Sydney (Australia) houses in a background area was 2.7 mg´m-2´day-1 (range 0.4-5.9 mg´m-2´day-1) in background houses, and 3.3 mg´m-2´day-1 (range
1.3-7.7 mg´m-2´day-1) for contaminated houses, i.e. houses of children that were identified with elevated blood Pb (Gulson et al., 1995). Brunekreef found similar values for the surface loading rate of Pb in inner cities and suburbs in the Netherlands, with a geometric mean of 0.99-4.32 mg´m-2´day-1, see Table 6. The surface loading rate is a factor 16-788 lower than the geometric mean Pb loadings determined on floors, which can be explained by incomplete removal of dust and Pb during cleaning activities (Rhoads et al., 1999), and the accumulation of Pb in dust over several days. The effect of cleaning is demonstrated by Rhoads et al., who found a reduction of a factor 1.5-3.1 in Pb loading after cleaning (Rhoads et al., 1999). According to Table 5, the Pb loading of window sills is considerably higher than the Pb loading of floors, varying between 0.66 and 6.5 mg/m2 in the studies reported in Table 5, whereas the Pb loading of window throughts is even higher, between 10.8 and 30 mg/m2. More dust accumulates on window sills and in window throught than on floors (see Table 1), leading to higher Pb loadings.
Using a vacuum cleaner on floors, Pb loadings between 0.011 and 5.1 mg/m2 were
determined. The large variation can be ascribed to the dust collection efficiencies of different vacuum cleaners (Sterling et al., 1999).
Because of the larger variation in Pb loading than in Pb concentration, probably caused by the large variation in dust collection efficiencies, Pb concentration will be used for risk
Table 6. Indoor lead surface loading rate (mg´m-2´day-1)
Study Area Geometric mean
(mg´m-2´day-1) range N Brunekreef 1985Ñ Rotterdam the Netherlands, inner city
Rotterdam the Netherlands, suburb The Hague the Netherlands, inner city Zoetermeer the Netherlands, suburb
2.86 0.99 4.32 1.51 0.10-20.86 0.10-8.40 1.95-27.05 0.48-4.40 48 67 13 49
Meyer 1999* Hattstedt, Germany 1.1 0.01-22.6 454
Gulson 1995 Sydney, Australia, backround area
Broken Hill, Australia, contaminated area 2.73.3 0.4-5.91.3-7.7 89 Ñ A major source of Pb in the study by Brunekreef was probably traffic. At present, the release of Pb from traffic is considerable less than in 1985.
* Mining and smelting area.
3.3
Is there a relationship between the concentration of Pb
in house dust and Pb in exterior soil?
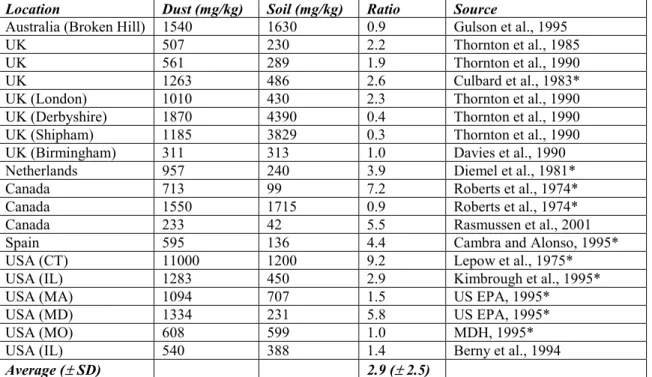
Table 7 shows the concentration of Pb in house dust and in soil determined at the same site. In general, the concentration of Pb appears to be higher in house dust relative to exterior soil. The dust/soil ratio for Pb ranges from 0.3 to 9.2 in studies conducted both in Europe and North America, see Table 7. Mining and smelting areas were more likely to have elevated concentrations of contaminants in soil compared with the concentration in dusts (Paustenbach et al., 1997). However, in mining and smelting areas, the concentrations of Pb found in house dust were usually much higher than the levels found in homes from non-source dominated areas.
Table 7: Survey of published values that present the ratio of the concentrations of Pb in house dust compared to the concentration in exterior soil.
Location Dust (mg/kg) Soil (mg/kg) Ratio Source
Australia (Broken Hill) 1540 1630 0.9 Gulson et al., 1995
UK 507 230 2.2 Thornton et al., 1985
UK 561 289 1.9 Thornton et al., 1990
UK 1263 486 2.6 Culbard et al., 1983*
UK (London) 1010 430 2.3 Thornton et al., 1990
UK (Derbyshire) 1870 4390 0.4 Thornton et al., 1990
UK (Shipham) 1185 3829 0.3 Thornton et al., 1990
UK (Birmingham) 311 313 1.0 Davies et al., 1990
Netherlands 957 240 3.9 Diemel et al., 1981*
Canada 713 99 7.2 Roberts et al., 1974*
Canada 1550 1715 0.9 Roberts et al., 1974*
Canada 233 42 5.5 Rasmussen et al., 2001
Spain 595 136 4.4 Cambra and Alonso, 1995*
USA (CT) 11000 1200 9.2 Lepow et al., 1975*
USA (IL) 1283 450 2.9 Kimbrough et al., 1995*
USA (MA) 1094 707 1.5 US EPA, 1995*
USA (MD) 1334 231 5.8 US EPA, 1995*
USA (MO) 608 599 1.0 MDH, 1995*
USA (IL) 540 388 1.4 Berny et al., 1994
Average (± SD) 2.9 (± 2.5)
Figure 1 graphically shows the Pb concentration in soil against the Pb concentration in house dust for studies listed in Table 7. Most data points are above the y=x line, indicating that in most cases the Pb concentration is higher in house dust than in soil.
Figure 1. Pb concentration in soil versus Pb concentration in house dust. More data points are above the y=x line than below, indicating that in most cases the Pb concentration is higher in house dust than in soil.
Concentrations of Pb which are higher in house dust compared with the concentration in outside sources suggests that there is an internal source, but selective enrichment of finer particles may also occur (Fergusson et al., 1991). Up to 30% of particles in house dust can be < 5 mm, and most vacuums do not trap such dust, resulting in recontamination of the house (Gulson et al., 1995).
Several studies have explicitly examined whether there is a relationship between Pb
concentration indoors and outdoors. In a study by Tong no relationship was found between the house dust Pb concentrations indoors and outdoor dust samples collected from paved hard surfaces on or around the doorsteps, porch, or patio (Tong, 1998). It should be noticed that in this study outdoor dust samples were collected, which does not necessarily give the same relationship as Pb in soil.
Rasmussen et al. compared Pb in house dust, garden soil and street dust on the 100-250-mm particle size fraction in Ottawa, Canada (Rasmussen et al., 2001). They found higher levels of Pb in house dust (geometric mean 233 mg/kg) than in garden soil (42 mg/kg) and street dust (33 mg/kg). Indoor dust concentrations could not be extrapolated based on exterior soil data. It was concluded that dust generated from sources within the house itself contributed
significantly to exposure to certain elements including Pb (Rasmussen et al., 2001). This can be explained by the fact that Ottawa is a city with a low concentration of heavy industries, resulting in a relatively low contribution of Pb from soil to house dust compared to other possible sources.
Pb conc in dust and soil (mg/kg)
0 2000 4000 6000 8000 10000 12000 0 1000 2000 3000 4000 5000 Pb in soil (mg/kg) Pb i n du st ( m g/ kg ) y=x
Pb conc in dust and soil (mg/kg)
0 500 1000 1500 2000 0 200 400 600 800 1000 Pb in soil (mg/kg) P b in du st ( m g/ kg ) y=x y=3x
In contrast to the studies by Tong and Rasmussen et al. (Rasmussen et al., 2001; Tong, 1998), Berny et al. found that soil and dust Pb concentrations were significantly related to one another, with a r2-value of 0.52 and n=77 (Berny et al., 1994). Pb ranged from 100 to 25,000 mg/kg in dust, with a median value of 388 mg/kg. Pb in soil ranged from <100 to 4400 mg/kg, with a median value of 540 mg/kg. A secondary Pb smelter had been in operation in this town for almost 80 years and was shut down in 1982, about ten years before the research by Berny et al. (Berny et al., 1994). Hence, Pb in soil was a source that was relatively high compared to other sources, resulting in a positive relationship between soil and dust Pb concentration.
The studies mentioned above suggest that a relationship between soil and dust Pb
concentration can exist. Such a relationship can be expected when considering that 30-70% of the house dust originates from soil. Obviously, a relationship between soil and dust Pb can only be found if Pb in soil dominates over the contribution of Pb from other sources. If other sources of Pb are dominant, the relationship between soil and dust Pb is obscured.
The arguments discussed above are in agreement with a study by Gulson et al. (Gulson et al., 1995). They characterised Pb in house dust in Broken Hill, Australia, which is the site of the world’s largest lead-zinc-silver mine, and in Sydney, where Pb is mainly derived from gasoline and other point sources such as battery factories and secondary Pb industry. Sources of Pb were discriminated by isotope ratios (206Pb/204Pb). The major source of Pb in vacuum and surface dust in Broken Hill was from the orebody (in most cases considerable more than 70%). However, there were a few houses in which the Pb came from other sources, such as gasoline or leaded-paint. As a consequence, a strong correlation (r=0.95) was obtained between the isotopic composition of Pb in blood and dust-fall accumulation.
In contrast to the majority of houses in Broken Hill, the Pb isotope ratios for different
fractions from inner Sydney vacuum dust exhibited considerable variations, meaning that the Pb in the dusts came from different sources.
3.4
Pb in air
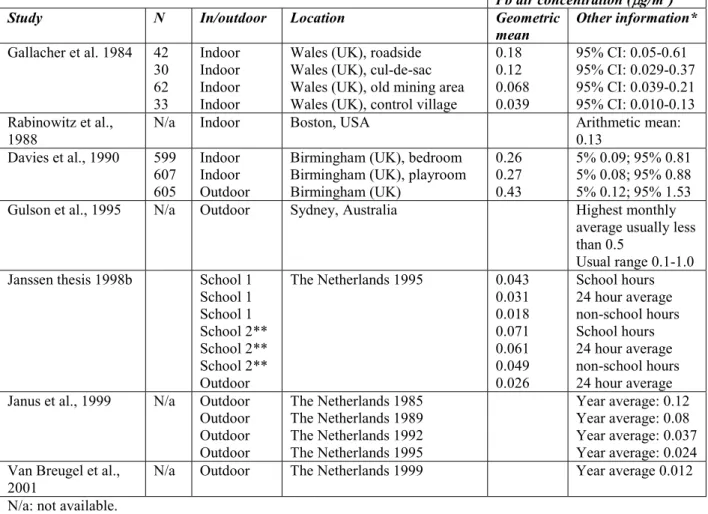
Levels of Pb in particulate matter in indoor and outdoor air are gathered and listed in Table 8. Gallacher et al. conducted Pb air measurements in four areas in Wales with different degrees of environmental Pb (Gallacher et al., 1984). In two areas the source of the Pb was traffic and in one it was spoil from Pb mining in the past. The fourth area, which served as a control, was a village remote from heavy traffic, industry, and Pb mining. The geometric mean of the indoor air concentration in roadside dwellings was 0.18 mg/m3, in cul-de-sac dwellings (NL: doodlopende straat) was 0.12 mg/m3, and in dwellings in an old mining area 0.068 mg/m3. In dwellings in the control village the geometric mean Pb air concentration was 0.039 mg/m3. The highest indoor Pb air concentrations were found in the area with the most traffic. Davies et al. conducted an extensive study on the various pathways of Pb intake (Davies et al., 1990). To that end, the indoor air concentration was measured. The geometric mean air Pb concentration in a child’s bedroom was 0.26 mg/m3, see Table 8. This value was very similar to that in the playroom of 0.27 mg/m3. The mean external air Pb concentration was 0.43 mg/m3, and was significantly higher than those found indoors (p<0.001). Results for the daily air Pb concentration in individual houses showed that the internal concentrations closely followed the external, but were usually lower, with a mean external:internal air Pb ratio of 1.6 (Davies et al., 1990).
Rabinowitz measured an indoor Pb air concentration of 0.13 mg/m (Rabinowitz et al., 1980). Further details were not reported. Janssen found values ranging between 0.018 and 0.071 for indoor air in schools, including both measurements during school hours only and 24 hour average values (Janssen, 1998b). The 24 hour average value for outdoor air was 0.026 (Janssen, 1998b), indicating that the external:internal Pb air ratio of 1.6 of Davies et al. (Davies et al., 1990) did not apply to these data. It should be noted that indoor air levels of Pb in schools may be higher than in residents due to the high resuspension rate, see section 2.4.
Table 8. Overview of Pb air concentrations.
Pb air concentration (mg/m3)
Study N In/outdoor Location Geometric
mean Other information* Gallacher et al. 1984 42 30 62 33 Indoor Indoor Indoor Indoor
Wales (UK), roadside Wales (UK), cul-de-sac Wales (UK), old mining area Wales (UK), control village
0.18 0.12 0.068 0.039 95% CI: 0.05-0.61 95% CI: 0.029-0.37 95% CI: 0.039-0.21 95% CI: 0.010-0.13 Rabinowitz et al.,
1988 N/a Indoor Boston, USA Arithmetic mean:0.13
Davies et al., 1990 599 607 605 Indoor Indoor Outdoor
Birmingham (UK), bedroom Birmingham (UK), playroom Birmingham (UK) 0.26 0.27 0.43 5% 0.09; 95% 0.81 5% 0.08; 95% 0.88 5% 0.12; 95% 1.53 Gulson et al., 1995 N/a Outdoor Sydney, Australia Highest monthly
average usually less than 0.5
Usual range 0.1-1.0 Janssen thesis 1998b School 1
School 1 School 1 School 2** School 2** School 2** Outdoor The Netherlands 1995 0.043 0.031 0.018 0.071 0.061 0.049 0.026 School hours 24 hour average non-school hours School hours 24 hour average non-school hours 24 hour average Janus et al., 1999 N/a Outdoor
Outdoor Outdoor Outdoor The Netherlands 1985 The Netherlands 1989 The Netherlands 1992 The Netherlands 1995 Year average: 0.12 Year average: 0.08 Year average: 0.037 Year average: 0.024 Van Breugel et al.,
2001 N/a Outdoor The Netherlands 1999 Year average 0.012
N/a: not available.
* CI refers to Confidence interval.
** School 2 had just been repainted. High lead levels were possibly caused by removal of old lead-based paint.
It should be noted that the study by Gallacher et al., Davies et al., and Rabinowitz et al. were performed in the 1980-ies (Gallacher et al., 1984; Davies et al., 1990; Rabinowitz et al., 1980). Present levels of Pb in air will be lower due to a decrease of Pb in emission by traffic. The decrease of Pb in air due to decreasing Pb emission by traffic is demonstrated by Janus et al. (Janus et al., 1999) and van Breugel et al. (Van Breugel et al., 2001), who provided an overview of the measured average Pb concentration in outdoor air in the Netherlands for several years. The Pb concentration decreased from 0.12 in 1985 to 0.024 mg/m3 in 1995, and to 0.012 mg/m3 in 1999, see Table 8 (Janus et al., 1999; Van Breugel et al., 2001). In absence of specific sources of Pb indoors, Janus et al. assume the Pb concentration in indoor air is a factor 2.5-3 lower than in outdoor air (Janus et al., 1999). Davies et al. also found a lower Pb
air level indoors than outdoors, but the external:internal air Pb ratio was lower (1.6) than the factor by Janus et al. (2.5-3) (Davies et al., 1990; Janus et al., 1999).
According to Gulson et al., the monthly Pb contents in Sydney total suspended particulates in outdoor air varied from 0.1 to 1.0 mg/m3, which is not markedly higher than the average of between 0.1 and 0.3 mg Pb/m3 in most US cities without Pb point sources (references in (Gulson et al., 1995)).
Although only few references were found on Pb in indoor air, it can be concluded that Pb concentration in indoor air at present in the Netherlands, in absence of high external Pb sources, is probably less than 0.1 mg/m3. In most cases, outdoor Pb air levels exceeded indoor levels.
A comparison can be made between the values found for the Pb concentration in air (0.1 mg/m3, and values in Table 8) versus a hypothetical calculation of the concentration of Pb in air, assuming that Pb in soil is the only Pb source to Pb in particulate matter in air. The calculation can be performed using assumptions for 1) the concentration of dust in air, 2) the contribution of soil to suspended dust, and 3) the Pb concentration in soil. In agreement with the recommendations of §2.4, a concentration of dust in air of 60 mg dust/m3 is assumed. Assuming that 30-70% of the suspended dust in air originates from soil (this value is assumed for the contribution of soil in settled dust, see § 2.3), and that Pb in air originates from soil only, a value of 18-42 mg soil/m3 in air can be calculated. Using a contamination level of Pb in soil of 85 mg/kg (Target Value), the concentration of Pb in air amounts 1.5-3.6 ng/m3. This hypothetically calculated value is about a factor 28-67 smaller than the upper values
measured in the field (100 ng Pb/m3), but close to the year average of Pb in outdoor air in 1999 (12 ng/m3), see Table 8. Hence, it can be concluded that the hypothetically calculated concentration of Pb in air is in the same order of magnitude as experimentally found levels. This agreement supports the assumptions that 1) 30-70% of suspended dust in air originates from soil, 2) the concentration of dust in air is approximately 60 mg/m3.
3.5
Exposure to Pb via house dust in risk assessment in
Canada and USA
3.5.1 Canada
Health and Welfare Canada (HWC, 1992) assumes an ingestion rate of 80 mg dust/day for a 2-year-old child (Rasmussen et al., 2001), and 30% absorption of Pb. According to Mielke and Reagan, hand-to-mouth behaviour results rarely in the ingestion of quantities of dust that exceeds 200 mg per day (Mielke et al., 1998). No references or argumentation was given for this value. Further information about the amounts of dust ingested by children was not found.
3.5.2 USA
In the USA, the Integrated Exposure Uptake Biokinetic (IEUBK) Model for lead in children is used to predict the risk of elevated blood lead (PbB) levels in children (under the age of seven) that are exposed to environmental Pb from many sources (US-EPA, 2002). Media that can act as sources of Pb for a child include air (both indoor and outdoor), which enters the body through the lungs, and water, soil, dust (indoor), diet, and other sources (e.g. lead paint),
which enter the body through the gastrointestinal tract. The default media intake rates used in the IEUBK model are presented in Table 9.
Table 9. Media intake rates of the US-IEUBK model for children between 0 and 7 years of age. The IEUBK model stands for Integrated Exposure Uptake Biokinetic model, and is used to predict the risk of elevated blood lead levels in children that are exposed to environmental Pb from many sources.
Age Soil/dust (g/d) Air (m3/d) Drinking water (L/d) Diet (mg Pb/d)
0-1 yr 0.085 2 0.2 5.53 1-2 yrs 0.135 3 0.5 5.78 2-3 yrs 0.135 5 0.52 6.49 3-4 yrs 0.135 5 0.53 6.24 4-5 yrs 0.100 5 0.55 6.01 5-6 yrs 0.090 7 0.58 6.34 6-7 yrs 0.085 7 0.59 7.00
The US-EPA recommends default values for intake rates in the IEUBK model, unless adequate, site-specific monitoring data exist to define values that are higher or lower in magnitude (US-EPA, 2002). The default intake value for total soil and dust ingestion is a ratio of soil ingestion (45%) to dust ingestion (55%).
The soil/dust intake values are considered representative of average daily intake rates. The model assumes that 50% of the Pb intake from drinking water and food is absorbed in the bloodstream and that 30% of the Pb intake from soil and dust is absorbed.
3.6
Contribution of Pb in house dust, outdoor soil, and air to
Pb exposure in children
3.6.1 Qualitative
Numerous studies have shown that dust Pb is an important source of exposure for young children (Sayre 1974, Bornscheid 1985, Davies 1985, Laxen 1987, Davies 1990, Thornton 1990, Al-Radady 1994, Lanphear 1996, 1998b). Several studies that support this statement are described below:
Studies
Rhoads et al. showed that after a year of thorough household cleaning house dust Pb levels decreased significantly and blood Pb by 17% for children between the ages of 6 and 36 months (Rhoads et al., 1999). Pb mainly originated from Pb paint. The blood Pb
concentration was 12.4 mg/dl at start of study (n=46), versus 10.3 mg/dl after follow up. The blood Pb concentration in the control group stayed the same, 11.6 mg/dl at start and end of the experiment (n=53) (Rhoads et al., 1999).
Lanphear et al. pooled 12 epidemiological studies in multiple communities
(1300 observations) for children between 6 and 36 months of age (Lanphear et al., 1998b). Analysis confirms that Pb-contaminated house dust is the major source of Pb exposure to children. There is a strong relationship between interior dust Pb loading and children’s blood Pb levels. In addition, the analyses demonstrate that a child’s age, race, mouthing behaviours,
and study-site specific factors influence the predicted blood Pb level at a given level of exposure. The r2-value for this model was 0.53. The contribution of Pb-contaminated floor dust to children’s blood Pb level was greater than the contribution from Pb-contaminated soil (Lanphear et al., 1998b).
In another study by Lanphear et al, an analysis was undertaken to estimate the relationship of environmental Pb exposures to Pb intake of urban children (Lanphear et al., 1998a).
Environmental sources of Pb, including house dust, soil Pb, and water Pb, were
independently associated with children’s blood Pb levels. In contrast, paint Pb levels did not have a significant effect on blood Pb levels after adjusting for other environmental exposures. An increase in water Pb concentration from background levels to 0.015 mg/l, the EPA water Pb standard, was associated with an increase of 13.7% in the percentage of children estimated to have a blood Pb concentration exceeding 10 mg/dl; increasing soil Pb concentration from background to 400 mg/g was estimated to produce an increase of 11.6% in the percentage of children exceeding 10 mg/dl; and increasing dust Pb loading from background to 2.2 mg/m2 is estimated to produce an increase of 23.3% in the percentage of children estimated to have a blood Pb level exceeding 10 mg/dl (Lanphear et al., 1998a). Pb blood levels exceeding 10 mg/dl have a negative impact on the mental development of children (Janus et al., 1999). Laxen et al. showed a significant relationship between Pb in dust vacuumed from the floors of the children’s homes and their blood Pb levels in a study of 495 children in Edinburgh, Scotland (Laxen et al., 1987). A multiple regression analysis incorporating drinking water and house dust estimates that a 1000 mg/kg increase in dust Pb concentration would increase blood Pb by 1.9 mg/dl, for a child with the median population blood Pb of 10.1 mg/dl (Laxen et al., 1987).
Gallicchio et al. studied 205 children of approximately 1 year of age and living in old, urban houses (Gallicchio et al., 2002). They found a statistically significant positive association between blood Pb and window sill dust Pb levels (p<0.0001) (Gallicchio et al., 2002). Rabinowitz studied the exposure pathways of Pb to 202 children (Rabinowitz et al., 1988). Surface wipes (living room floor, furniture top, and window sill), indoor aerosol samples, paint, soil samples, and drinking water were collected. The mean level of dust Pb on surfaces was 83 mg/m2, in tap water 5.0 mg/l, and 0.13 mg/m3 in air. There were strong correlations between blood Pb levels and soil Pb and dust Pb levels, but not between blood Pb and air or water Pb levels. Soil and floor dust Pb levels were strongly correlated (r=0.43, p<0.0001). Those children judged to mouth the most had 2 to 3 times the Pb blood level of those who mouth the least, at given soil Pb level (Rabinowitz et al., 1988).
Gulson et al. found a strong correlation (r=0.95) between the isotopic composition of Pb in blood and dust-fall accumulation in Broken Hill (Gulson et al., 1995). This suggests that almost all Pb in blood originated from Pb in house dust.
In contrast, in a study by Berny et al. no significant relationship between soil or dust Pb and blood Pb concentration in humans was observed (Berny et al., 1994). However, the
relationship was significant in pets. Blood Pb levels in humans varied between 0 and 13 mg/dl, whereas Pb levels in blood of pets ranged between 0 and 28 mg/dl (Berny et al., 1994).