Exposure to chemicals via house dust
Report 609021064/2008
RIVM Report 609021064/2008
Exposure to chemicals via house dust
A. G. Oomen P. J.C.M. Janssen A. Dusseldorp C. W. Noorlander
Contact: A. G. Oomen
Centre for Substances and Integrated Risk Assessment E-mail: Agnes.Oomen@rivm.nl
This investigation has been performed by order and for the account of Inspectorate of the Ministry of Housing, Spatial Planning and the Environment of the Netherlands, within the framework of project M/609021.
© RIVM 2008
Parts of this publication may be reproduced, provided acknowledgement is given to the 'National Institute for Public Health and the Environment', along with the title and year of publication.
Abstract
Exposure to chemicals via house dust
Humans are exposed to substances present in house dust, but the majority of these substances do not pose a risk to human health. Those substances that do exceed a critical level, however, have the potential to be a health risk. The most common of these are lead and di(2-ethylhexyl)phthalate, followed by arsenic, cadmium, polycyclic aromatic hydrocarbons and PBDEs (flame retardants). These substances come into house dust through the wear and tear of consumer products, the release of products when cooking and burning wood in the fireplace. In addition, some pollutants can fall off the soles of shoes that have come into contact with polluted soil.
By order of the Inspectorate of the Ministry of Housing, Spatial Planning and the Environment of the Netherlands, the Dutch National Institute for Public Health and the Environment (RIVM) has carried out a screening of the potential risks posed by various chemical substances in house dust. The substances investigated include metals, organotin compounds, phthalates, brominated flame retardants, pesticides and polycyclic aromatic hydrocarbons. Substances in house dust are mostly ingested through the contact of the hand or an object with the mouth. This is particularly true for young children. A minor part of house dust enters the body by inhalation.
The mean ingestion rates for adults and children were estimated. Exposure to substances via house dust is calculated based on the mean ingestion rates and typical concentrations of substances present in house dust. Whenever possible, this study has focussed on the situation in the Netherlands. The exposure of adults and children to substances via house dust was compared to the tolerable daily intake, which was used as a criterium for a potential health risk, and to the background exposure (via food and water consumption). The findings of this investigation provide an overview of the substances in house dust which can exceed the accepted norm and for which the contribution of house dust to the total exposure is substantial. Based on these findings, the RIVM recommends that the substances identified herein be subjected to measurements in research on the indoor environment.
Key words:
Rapport in het kort
Blootstelling aan chemische stoffen via huisstof
Mensen worden via huisstof aan chemische stoffen blootgesteld. De meeste stoffen vormen op deze manier geen risico voor de gezondheid. Voor enkele stoffen wordt wel de gezondheidskundige norm overschreden waardoor er mogelijk sprake kan zijn van een risico voor de gezondheid. Dit geldt met name voor lood en di(2-ethylhexyl)ftalaat en in minder mate voor arseen, cadmium, polycyclische aromatische koolwaterstoffen en PBDE’s (vlamvertragers). Deze stoffen komen op allerlei manieren terecht in huisstof, bijvoorbeeld door slijtage van producten, inloop van verontreinigde bodem, door stoffen die bij het koken vrijkomen of via de open haard.
In opdracht van VROM-Inspectie heeft het RIVM een screening uitgevoerd van de risico’s van verschillende chemische stoffen in huisstof (metalen, organotinverbindingen, ftalaten, gebromeerde vlamvertragers, bestrijdingsmiddelen, en polycyclische aromatische
koolwaterstoffen). Huisstof wordt vooral ingenomen door contact van de hand of een voorwerp met de mond, wat vooral bij jonge kinderen veel voor komt. Daarnaast wordt een beperkte hoeveelheid huisstof ingeademd.
De inname van huisstof is geschat voor kinderen en volwassenen. De blootstelling aan chemische stoffen via huisstof is berekend op basis van de hoeveelheid huisstof die
mensen binnenkrijgen en concentraties van chemische stoffen daarin. Waar mogelijk is dat op de situatie in Nederland toegespitst. De blootstelling via huisstof is vergeleken met de norm voor wat dagelijks is toegestaan, en met de achtergrondblootstelling via voeding en water.
De huidige bevindingen geven een overzicht van de stoffen in huisstof die de
gezondheidskundige norm kunnen overschrijden, en waarvan de bijdrage van huisstof aan de totale blootstelling aanzienlijk is. Aanbevolen wordt de hier geïdentificeerde stoffen te meten bij onderzoek naar het binnenmilieu.
Trefwoorden:
Contents
Summary 7
1 Introduction 9
1.1 Approach 9
1.2 Assumptions 10
2 General information on house dust 11
2.1 Origin of house dust 11
2.2 Sampling 11
2.3 Resuspension 11
3 Exposure to house dust 13
3.1 Ingestion of house dust 13
3.2 Inhalation of house dust 14
3.3 Defaults used for house dust ingestion and inhalation 15
4 Intake of substances via house dust 17
4.1 Chemicals 17
4.1.1 Metals 17
4.1.2 Pesticides 17
4.1.3 Organotins 17
4.1.4 Phthalates 18
4.1.5 Brominated flame retardants 18 4.1.6 Polycyclic aromatic hydrocarbons 18 4.2 Levels of substances in house dust 18 5 Substances in house dust with and without potential human health risk 25 5.1 Comparison exposure via house dust, TDI, and background exposure 25 5.2 Levels of substances in particulate matter in air 30 5.3 Substances without potential human health risk 31 5.4 Substances with potential human health risk 31
6 Discussion substances with potential human health risk 35
6.1 Aluminium 35 6.2 Arsenic 36 6.3 Cadmium 37 6.4 Chromium 39 6.5 Copper 39 6.6 Lead 40 6.7 Manganese 42 6.8 Nickel 42 6.9 Zinc 43 6.10 Di(2-ethylhexyl)phthalate (DEHP) 44 6.11 Sum PAHs 45
6.12 Brominated flame retardants 47 6.12.1 Toxicological reference values 47 6.12.2 Ban on several brominated flame retardants 47
6.12.3 Possibility of a potential health risk for BDE99 47 6.12.4 Comparison intake via house dust and food 48 6.12.5 Comparison of exposure BDE209 via house dust to other congeners 49 6.12.6 Other brominated flame retardants 49 6.12.7 Non-brominated flame retardants 50 6.13 Measures that can decrease the exposure to substances in house dust 50
7 Conclusions 53
Acknowledgement 59
References 61
Appendix 1. References on substances in house dust 71
Summary
Up till now, various projects on the indoor environment remain inconclusive with regard to the human health risk of substances in house dust. From experience it is known that some substances such as lead in house dust may pose a human health risk, but it is
unknown whether and to which extent this is also the case for other substances. In order to better design future projects on the indoor environment, the present investigation examines whether exposure to a great number of substances present in house dust may lead to
potential human health risks.
House dust mainly enters the body by ingestion, especially for young children. Mean ingestion rates of house dust of 50 and 100 mg were estimated for adults and children, respectively. Typical concentrations of substances in house dust were extracted from literature. The exposure of a substance via house dust by adults and children was
compared to the tolerable daily intake (TDI) as a criterium above which health risks may occur. The present research was restricted to several main chemical groups: metals, organotin compounds, pesticides, phthalates, brominated flame retardants and polycyclic aromatic hydrocarbons (PAHs). Based on calculation of the so-called Risk Index, which is the estimated exposure for any substance divided by its TDI, a list of substances is
provided for which there may be a health risk.
We found the majority of substances present in house dust to be without potential human health risk. However, some substances in house dust exceed the TDI criterium, indicating that they may cause a potential risk. Substances which exceed this criterium most
frequently are lead and di(2-ethylhexyl)phthalate, followed by arsenic, cadmium, sum PAHs, and BDE99. The finding that several metals (lead, arsenic, cadmium) may cause a potential human health risk via house dust was expected, but for the other substances this is not generally known. We recommend including these substances in the measurements when projects on the indoor environment are designed.
1
Introduction
House dust can be a major exposure route for some substances, leading to potential health risks. Especially young children ingest considerable amounts of house dust via hand-to-mouth and object-to-hand-to-mouth behaviour. The ingestion of house dust by children is particularly high relative to their lower body weight. In addition, humans inhale dust particles with air, which may also contribute to the exposure.
The human health risks of chemical substances in house dust have only occasionally been investigated in the Netherlands. The present investigation examines whether exposure to a great number of substances present in house dust may potentially lead to human health risks. The research was restricted to several main chemical groups: metals, pesticides, including organotin compounds, phthalates, brominated flame retardants and polycyclic aromatic hydrocarbons. The aim of this research is to provide a list of substances that may cause human health risks due to exposure to house dust. Also substances are identified for which it is highly unlikely that they cause a human health risk via house dust. In assessing the possibility of health risks due to substances in soil, conditions that are representative for the Netherlands are pursued.
It should be noted that the present report does not assess the health risks associated with particulate matter (in Dutch ‘fijn stof’) in the air. Potential health risks associated with different chemicals in house dust and particulate matter are investigated.
Finally, some measures that can decrease the exposure to substances in house dust are discussed.
1.1
Approach
To investigate the potential health risk of substances in house dust, we used the following approach:
o The rate of ingested and inhaled house dust by children and adults is estimated. o Typical concentrations of the substances in house dust are obtained from the
literature wherever the research was performed.
o The toxicological reference levels (expressed as Tolerable Daily Intake) of the substances are identified as a criterium above which there may be a potential health risk. The TDI is expressed in mg per kg body weight per day. As contained within the definition of the TDI, lifelong exposure to the substance at levels below the TDI will in principle not lead to health effects. Exceptions and other approaches are indicated.
o The background exposures, usually due to food and water consumption, of the substances are also listed.
o The substances are identified for which it is highly unlikely that exposure via house dust can result in a possible health risk. This is accomplished by making a
conservative estimate of the human exposure (both adult and child) to the substance by using the highest encountered house dust concentration found in literature. Background exposure is added to the exposure via house dust and compared to the TDI, so that exposure via other routes (e.g. food) is included. When the added exposure via house dust and background is less than the TDI, a potential health risk is considered to be highly unlikely.
o The substances for which the added exposure via house dust (based on highest reported concentration) and background is higher than the TDI, are investigated in more detail to identify whether exposure via house dust indeed poses a potential health risk. This research includes:
estimation of the exposure with a 95th-percentile and a geometric
mean concentration value in house dust
evaluation of the house dust data used in the calculations (can the data be considered to be representative for the Netherlands, are there enough data)
comparison of the exposure via house dust relative to other exposure routes (e.g. background exposure)
evaluation of the application of the TDI. In principle it is
scientifically justified to integrate childhood and adult exposure. However, there are exceptions depending on the toxicological basis for the TDI.
In this manner the substances are identified for which exposure via house dust may lead to a potential health risk.
1.2
Assumptions
In order to assess the potential human health risk of substances in house dust, several assumptions have been made. These assumptions are:
o Using the TDI as a toxic measure for comparison to the exposure to a substance, implies the assumption that humans are chronically exposed to that substance. It is realistic to assume that any person is daily exposed to a substance in house dust. However, changes in the concentration of the substance in house dust can occur in time. These changes are unknown and can therefore not be included in the
calculation of the exposure.
o The aim of the present investigation is to provide a screening whether exposure to house dust may lead to potential human health effects. With this aim in mind the estimation of the exposure to substances in house dust should be conservative. o Where the present screening indicates a human health risk is unlikely, this does not
mean that this cannot occur under any circumstances. Obviously, specific situations may still result in excessive concentrations in house dust of a certain substance leading to a health risk.
2
General information on house dust
2.1
Origin of house dust
House dust is a heterogeneous mixture of substances from numerous sources, including tracked-in or resuspended soil particles, clothing, atmospheric deposition of particulates, hair, fibres (artificial and natural), molds, pollen, allergens, bacteria, viruses, arthropods, ash, soot, animal fur and dander, smoke, skin particles, cooking and heating residues, and building components among others ((Paustenbach et al., 1997), and references herein).
2.2
Sampling
Reproducible sampling of house dust is difficult and highly depending on the method. Methods that are regularly used for dust collection are vacuum cleaners and wipes. Some studies suggest that the sampling efficiency can differ to a factor sometimes higher than 100 between methods (Sterling et al., 1999). Wiping as sampling method is probably more reproducible, especially when wiping is only applied on hard surfaces. The effect of the sampling method on the concentration of the substance in house dust is unknown and probably depending on various factors.
2.3
Resuspension
Meyer et al. (1999) determined that the number of persons living in a residence was significantly associated with elevated amounts of dust sedimented per day, probably due to increased indoor activities such as vacuuming, sweeping, cleaning, and children playing. Thatcher and Layton have shown that the resuspension rate is particle size dependent (Thatcher and Layton, 1995). Particles with diameters of 5-25 μm are most readily resuspended and even light activity such as walking into and out of the room can have a significant impact on the concentration of airborne particles greater than 5 μm. Particles of 0.3 - 1 μm, however, are not affected by either cleaning or walking (Thatcher and Layton, 1995).
3
Exposure to house dust
3.1
Ingestion of house dust
Several institutes have estimated the amount of house dust that children and adults ingest. These dust ingestion rates are uncertain as only indirect methods exist to estimate daily dust ingestion. Table 1 provides an overview of the estimated amounts and some information on the derivation of these estimations.
Table 1. House dust ingestion rates for adults and children derived and used in references. Ingestion house dust (mg/day)
Study
Adult Children Remarks
Gevao et al., 2006 10 100 Based on Chuang et al., 1999
Chuang et al., 1999 60 100 Based on Lewis et al., 1994;
Stanek and Calabrese, 1995
Williams, 2002 50 50-100 Exposure parameters,
no derivation mentioned
Calabrese et al., 1989 10-100 20-200 Based on soil ingestion
Lewis et al., 2001 2-10 20-100 Estimation based on inhalation
and hand-mouth behaviour
Butte et al., 2002 2-10 20-100 Estimation based on other studies
USEPA, 1997 50 100 Based on soil ingestion
Jones-Otazo et al., 2005
20 50 From Health Canada 1994
Maertens et al., 2004 0.56 50-100 Based on Hawley, 1985
Yamamoto 2006 100 200 Based on Ministry of
Environment, Japan 2001
Wilford et al., 2005 4.16 55 Based on USEPA, 1997
Stapleton et al., 2005 20-200 Based on Roberts and Dickey,
1995; USEPA, 2002
Mushak, 1998 100-200 Intake based on other studies
Oomen et al., 2007 39 27 Based on a comparison with soil
ingestion rates and hand loading*
Range of studies 0.56-100 20-200
In the present study a conservative but realistic estimate of dust ingestion rate will be used for the calculation of human exposure to substances in dust. This will allow identification of those substances for which it is unlikely that exposure via house dust will cause a human health risk.
As a conservative but realistic estimate of dust ingestion 100 mg/day for children and 50 mg/day for adults will be employed. This expert judgement is based on two
arguments. Firstly, it is assumed in the Netherlands that children ingest on average 100 mg soil per day via hand-to-mouth behaviour (Lijzen et al., 2001; Otte et al., 2001). When playing outside a child’s hand is much more loaded with soil than a loading with house dust during indoor playing. The ingestion of soil per time unit will thus be much greater outdoors than indoors. On the other hand, children spend more time indoors than outdoors. Yet, it is very unlikely that average daily dust ingestion will be greater than average daily soil ingestion.
Secondly, Table 1 shows that in some cases the dust ingestion of children is estimated at 200 mg/day, whereas in most cases 100 mg/day is used as upper level. For adults, in most cases about 50 mg/day was derived as an upper estimate.
3.2
Inhalation of house dust
The amount of inhaled house dust can be estimated from the level of particles in the air (mg/m3) and the volume of air inhaled by a child or adult. It is generally assumed that a child inhales 7.6 m3 of air daily and an adult 19.9 m3 (Otte et al., 2001; Lewis et al., 1999). As default values for body weight 15 kg and 70 kg respectively are used (Otte et
al., 2001).
In general, particles with an aerodynamic diameter of 10 μm or smaller can be inhaled by humans and can deposit deep in the lungs (Carrizales et al., 2005). Larger particles mainly deposit in the upper bronchial tubes and in most cases are transferred upwards by
mucotransilliarly and subsequently ingested. Therefore, it is assumed that all substances associated with particles of 10 μm in size or smaller contribute to the exposure in the lungs. This may be an overestimation as only part of the particles will be deposited in the lungs.
Concentrations of suspended particles in air, i.e. suspended dust, that are typically observed range between 13 and 35 μg/m3 inside homes, between 41 and 58 μg/m3 for
daycare facilities (Beamer et al., 2002). Higher concentrations are usually found directly around persons (personal cloud) than in other places in a room. A value of 60 μg/m3 is
probably representative for moderately crowded places such as residents, whereas a value of 100 μg/m3 should be used as personal exposure for crowded places such as classrooms
When assuming a constant concentration of suspended particles in air of 100 μg/m3, and a
volume of inhaled air of 7.6 m3 for a child and 19.9 m3 for an adult, the amount of inhaled suspended particles are respectively 0.8 and 2.0 mg per day. This is in line with the inhaled amounts of dust reported by Maertens et al. (2004). Hence, the amount of inhaled suspended dust particles is low compared to the amount of ingested dust (50 and 100 mg/day for a child and adult, respectively). When considering the total exposure to a substance in house dust exposure via inhalation is negligible. Obviously, this exposure route should still be considered when a substance may have local effects on the lungs. For example for several metals this may be the case. In order to assess whether concentrations of metals in the indoor air may lead to potential health risks, concentrations in airborne particulate matter were retrieved from literature and compared to Tolerable Concentration in Air (TCA) levels (ng/m3), see section 5.2. It should be stressed that the literature
research on indoor air concentrations for metals was limited. At concentrations of airborne particulate matter below the TCA no health risk is anticipated even after life-long
exposure.
Furthermore, it should be noted that substances that enter the blood circulation after deposition in the lungs bypass the first pass effect, i.e. these substances directly enter the systemic blood circulation without possible metabolism in the liver as is the case after oral exposure. This difference may have consequences for the toxicity.
Obviously, volatile substances are not necessarily adhered to dust particles so that information on the concentration of the substance in airborne particulate matter is not useful.
3.3
Defaults used for house dust ingestion and inhalation
Based on section 3.1 and 3.2 the default dust ingestion and inhalation values described in Table 2 are used in the calculation of the human exposure to substances in house dust. Due to the large uncertainties in these default values, and the small contribution of inhalation to the total house dust intake, a total daily intake of house dust of 50 and 100 mg is used for adults and children, respectively.
Table 2. Default values for house dust ingestion and inhalation Ingestion of house dust
(mg/day)
Inhalation of house dust (mg/day)
Total intake of house dust (mg/day)
Adult 50 0.8 50
4
Intake of substances via house dust
4.1
Chemicals
Many chemicals are present in house dust as a consequence of their widespread use in everyday consumer products present in homes. The present research is restricted to the analysis of five main compound groups covering the chemicals: metals, organotins, pesticides (including organotins), phthalates, brominated flame retardants and polycyclic aromatic hydrocarbons.
4.1.1 Metals
Metals present at trace levels in natural water, air, dusts, soils and sediments, play an important role in human life (Juvanovic et al., 1995; Lapitajs et al., 1995). Sources of trace elements in house dust are atmospheric fall out of petrol, tyre wear, corrosion of metallic parts of automobiles, rooftiles, paint and release from carpets, smoking (Fergusson and Schroeder, 1985; Fergusson and Kim, 1991).
4.1.2 Pesticides
Pesticides may be a chemical substance, biological agent, antimicrobial, disinfectant or device used against any pest. There are several types of pesticides, such as bactericides, fungicides, insecticides and herbicides.
4.1.3 Organotins
Organotins are chemical compounds based on tin with hydrocarbon substituents. Organotins are primarily used in five major commercial applications: PVC heat stabilizers, biocides, catalysts, agrichemicals and glass coatings. Triorganotins have a high toxicity and can be powerful fungicides and bactericides, depending on the organic group present. Tributyltins are industrial biocides used in antifouling paints and in wood treatment and preservation. Tributyltins are also used as disinfectants, molluscicides, antifungal action in textiles and industrial water systems such as cooling tower and refrigeration water systems, wood pulp and paper mill systems, and breweries. Many of these applications have been phased out because of the high aquatic toxicity of tributyltins. Triphenyltins are used as fungicides, miticides and acaricides.
4.1.4 Phthalates
Phthalates, or phthalate esters, are a group of chemicals that are mainly used as softeners in flexible PVC products. Phthalates can be found in a broad range of consumer products like packaging materials, wallpapers, furnishings, clothing and toys, as well as ingredients in cosmetics and perfumes.
4.1.5 Brominated flame retardants
Brominated flame retardants (BFRs) are a group of brominated organic substances that have an inhibitory effect on the ignition of combustible organic materials. The most widely used BFRs are tetrabromobisphenol-A (TBBP-A), hexabromocyclododecane (HBCDD), and polybrominated diphenylethers (PBDEs) (De Winter-Sorkina et al., 2006). BFRs are applied to textiles, wiring, furniture, industrial paints and incorporated into plastics and foams, and they are commonly used in electronic products to reduce the flammability of the product.
Use of pentabromodiphenylether (penta-BDE) technical product was voluntarily phased out by industry within the European Union over the last 10 years. This has led to increased use of HBCDD and TBBP-A. The use of penta-BDE and octa-BDE technical products in all applications for the European Union market has officially been banned since August 2004. The use of penta-BDE, octa-BDE and PBBs in new electrical and electronical equipment is banned from July 2006 (De Winter-Sorkina et al., 2006).
4.1.6 Polycyclic aromatic hydrocarbons
Polycyclic aromatic hydrocarbons (PAHs) are a group of chemicals composed of two or more fused aromatic rings made up of carbon and hydrogen. Polycyclic aromatic hydrocarbons are formed by the incomplete combustion of coal, oil, petrol, wood, tobacco, charbroiled meats, garbage, or other organic materials. A few are used in medicines, and to make dyes, plastics, and pesticides. Naphthalene, is used in making dyes, explosives, plastics, lubricants, and moth repellent. Anthracene is used in dyes, insecticides and wood preservatives. PAHs are present in tobacco smoke, smoke from home heating (burning wood or oil), char-grilled food and creosote treated wood products. High concentrations of polycyclic aromatic hydrocarbons have been found in coal-tar production plants, coking plants, bitumen and asphalt production plants, smoke houses, aluminium production plants, and trash incinerators. PAHs are also present in the soil where coal, wood, petrol or other products have been burned. Food produced from these soils may also contain PAHs. Most of the PAHs are considered genotoxic carcinogens.
4.2
Levels of substances in house dust
An overview of concentrations of chemicals in house dust as obtained from literature is presented in Table 3. The highest concentration found in literature is presented. In
addition, for most substances several geometric mean values are found in literature (from different studies). In the present report the highest geometric means (mg/kg) of the concentrations of chemicals in house dust under normal conditions are used. Using these concentration values, ingestion of chemicals (µg/kg body weight/day) was calculated for both adults and children. For this calculation mean body weights of 70 kg and 15 kg were used for adults and children respectively (Otte et al., 2001) and dust ingestion rates of 50 mg/day for adults and 100 mg/day for children were used.
Table 3. Calculated ingestion rates of substances via house dust for an adult (70 kg) and child (15 kg) based on the highest geometric mean and the maximum concentration of the compound in house dust described in literature (see Appendix 1 for additional information and references).
Geometric
mean
Mean ingestion rate Maximum Maximum ingestion rate
Compound Adult Child Adult Child
(mg/kg) (μg/kg/d) (μg/kg/d) (mg/kg) (μg/kg/d) (μg/kg/d) Metals Aluminium 24281 17 162 51100 36 341 Antimony 26 0.018 0.17 66 0.05 0.44 Arsenic 70 0.050 0.47 192 0.14 1.3 Barium 454 0.32 3.0 1480 1.1 9.9 Beryllium 0.53 0.0004 0.0035 1 0.001 0.01 Bismuth 1.0 0.0007 0.0068 8.6 0.01 0.06 Cadmium 13 0.009 0.087 220 0.16 1.5 Chromium1 159 0.11 1.1 5440 3.9 36 Cobalt 17 0.012 0.11 23 0.02 0.15 Copper 261 0.19 1.7 12540 8.9 84 Lead 1200 0.85 8.0 37000 26 247 Lithium 6.1 0.0043 0.041 16 0.01 0.10 Magnesium 9442 6.7 63 52000 37 347 Manganese 260 0.18 1.7 9410 6.7 63 Mercury 1.7 0.0012 0.012 37 0.03 0.25 Molybdenum 2.8 0.0020 0.019 29 0.02 0.19 Nickel 47 0.033 0.31 243 0.17 1.6 Rubidium 25 0.017 0.16 40 0.03 0.27 Selenium 1.0 0.0007 0.007 6.8 0.005 0.05 Silver 1.5 0.0011 0.010 9.3 0.01 0.06 Strontium 242 0.17 1.6 1170 0.83 7.8 Tellurium 0.07 0.00005 0.0005 0.28 0.0002 0.002 Thallium 0.14 0.0001 0.0009 0.24 0.0002 0.002 Tin 22 0.016 0.15 595 0.42 4.0
Geometric
mean
Mean ingestion rate Maximum Maximum ingestion rate
Compound Adult Child Adult Child
(mg/kg) (μg/kg/d) (μg/kg/d) (mg/kg) (μg/kg/d) (μg/kg/d) Metals Titanium 2854 2.0 19 4983 3.5 33 Tungsten 3.7 0.003 0.025 5.6 0.004 0.04 Uranium 0.55 0.0004 0.004 1.3 0.001 0.01 Vanadium 112 0.080 0.75 193 0.14 1.3 Zinc2 628 0.45 4.2 30600 22 204 Organotin compounds Dibutyltin (DBT) 0.51 0.0004 0.0034 5.6 0.004 0.04 Dioctyltin (DOT) 0.02 0.00001 0.0001 0.36 0.0003 0.002 Monobutyltin (MBT) 0.16 0.0001 0.0011 1.5 0.001 0.01 Monooctyltin (MOT) 0.01 0.00001 0.0001 0.04 0.00003 0.0003 Tributyltin (TBT) 0.02 0.00001 0.0001 0.08 0.0001 0.001 Sum organotins3 0.7 0.0005 0.005 7.2 0.005 0.05 Pesticides 2,4-Dichlorophenoxy acetic acid 1.24 0.0009 0.0083 7.3 0.005 0.05 Alachlor4 1.5 0.001 0.01 Aldrin 0.006 0.000004 0.00004 0.051 0.00004 0.0003 alpha-Chlordane5 0.055 0.00004 0.0004 0.26 0.0002 0.002 alpha-HCH 0.0007 0.000000 5 0.000005 0.0087 0.00001 0.0001 Atrazine 0.002 0.000002 0.00002 Azinphos methyl 6.0 0.0043 0.040 16 0.01 0.11 beta-HCH 0.0022 0.000002 0.00001 0.057 0.00004 0.0004 Carbaryl4 1.0 0.0007 0.007 Chloroprofam4 0.17 0.0001 0.001 Chlorpyrifos 1.0 0.0007 0.0069 6.5 0.005 0.04 DDD 0.0047 0.000003 0.00003 0.048 0.00003 0.0003 DDE 0.007 0.000005 0.00005 0.05 0.00004 0.0003 DDT 0.12 0.0001 0.0008 0.78 0.0006 0.005 delta-HCH 0.0055 0.000004 0.00004 0.17 0.0001 0.001 Diazinon 0.31 0.0002 0.0021 2.0 0.001 0.01 Dicamba4 2.5 0.002 0.02
Geometric
mean
Mean ingestion rate Maximum Maximum ingestion rate
Compound Adult Child Adult Child
(mg/kg) (μg/kg/d) (μg/kg/d) (mg/kg) (μg/kg/d) (μg/kg/d) Pesticides Dieldrin 0.018 0.00001 0.0001 0.050 0.00004 0.0003 Dimethyl organiphosphate 0.37 0.0003 0.0025 1.3 0.0009 0.009 Ethyl parathion 0.56 0.0004 0.0037 0.43 0.0003 0.003 gamma-Chlordane6 0.098 0.0001 0.0007 0.47 0.0003 0.003 Glyphosate 0.14 0.0001 0.0009 0.14 0.0001 0.001 Heptachlor 0.12 0.0001 0.0008 0.34 0.0002 0.002 Lindane7 0.33 0.0002 0.0022 0.074 0.0001 0.0005 Malathion 0.38 0.0003 0.0025 2.0 0.001 0.013 Mecoprop4 0.40 0.0003 0.003 Methamidophos4 0.40 0.0003 0.003 Methyl parathion 0.38 0.0003 0.0025 1.9 0.0013 0.013 Metolachlor 0.0057 0.000004 0.00004 0.80 0.0006 0.005 Pendimethalin4 3.0 0.002 0.020 Permethrin 0.14 0.0001 0.0009 659 0.47 4.4 Phosmet 5.2 0.0037 0.035 22 0.016 0.15 Picloram4 1.2 0.0009 0.008 Resmethrin4 0.80 0.0006 0.005 Tetramethrin4 0.40 0.0003 0.003 Trichloro-2-pyridinol8 0.54 0.0004 0.0036 0.95 0.0007 0.006 Trifluralin4 1.8 0.0013 0.012 Phthalates Butylbenzyl phthalate (BBP) 319 0.23 2.1 45549 32 304 Di(2-ethylhexyl) phthalate (DEHP) 3214 2.3 21 40459 29 270 Diethyl phthalate (DEP) 45 0.032 0.30 632 0.45 4.2 Diisobutyl phthalate (DiBP) 84 0.060 0.56 84 0.06 0.56 Diisodecyl phthalate (DIDP) 73 0.052 0.49 73 0.05 0.49 Diisononyl phthalate (DINP) 176 0.12 1.2 176 0.12 1.2 Dimethyl phthalate (DMP) 11 0.0077 0.072 158 0.11 1.1
Geometric
mean
Mean ingestion rate Maximum Maximum ingestion rate
Compound Adult Child Adult Child
(mg/kg) (μg/kg/d) (μg/kg/d) (mg/kg) (μg/kg/d) (μg/kg/d) Phthalates Dimethylpropyl phthalate (DMPP) 55 0.039 0.36 161 0.11 1.1 Di-n-butyl phthalate (DBP) 226 0.16 1.5 5446 3.9 36
Brominated flame retardants (BFRs)/Brominated diphenylethers (BDEs)
BDE 100 490 0.35 3.3 21000 15 140 BDE 138 37 0.03 0.25 2000 1.4 13 BDE 153 181 0.13 1.2 1510 1.1 10 BDE 154 380 0.27 2.5 18000 13 120 BDE 17 8.9 0.01 0.06 150 0.1 1.0 BDE 183 44 0.03 0.29 650 0.5 4.3 BDE 190 4.5 0.003 0.03 48 0.0 0.3 BDE 196 15 0.01 0.10 39 0.0 0.3 BDE 197 17 0.01 0.12 77 0.1 0.5 BDE 206 51 0.04 0.34 239 0.2 1.6 BDE 207 30 0.02 0.20 109 0.1 0.7 BDE 208 35 0.02 0.23 108 0.1 0.7 BDE 209 10 0.01 0.07 19100 14 127 BDE 28 20 0.01 0.14 550 0.4 3.7 BDE 33/28 21 0.01 0.14 77 0.1 0.5 BDE 47 1621 1.2 11 33 0.0 0.2 BDE 66 37 0.03 0.25 1800 1.3 12 BDE 85 190 0.13 1.3 9700 7 65 BDE 99 2295 1.6 15 2850 2 19 BDE153 470 0.33 3.1 25000 18 167
Polycyclic aromatic hydrocarbons (PAHs)
Acenaphthene 0.05 0.00004 0.0003 1.9 0.001 0.013 Acenaphthylene 0.08 0.0001 0.0005 0.52 0.0004 0.003 Anthracene 0.12 0.0001 0.0008 5.8 0.004 0.039 Benz[a]anthracene 0.24 0.0002 0.0016 40 0.028 0.27 Benzo[a]pyrene 0.29 0.0002 0.0019 54 0.038 0.36 Benzo[b,k]fluoranth ene 0.57 0.0004 0.0038 108 0.077 0.72 Benzo[e]pyrene 0.29 0.0002 0.0019 41 0.029 0.27 Benzo[g,h,i]perylene 0.25 0.0002 0.0017 35 0.025 0.23
Geometric
mean
Mean ingestion rate Maximum Maximum ingestion rate
Compound Adult Child Adult Child
(mg/kg) (μg/kg/d) (μg/kg/d) (mg/kg) (μg/kg/d) (μg/kg/d)
Polycyclic aromatic hydrocarbons (PAHs)
Biphenyl 0.002 0.000001 0.00001 0.005 0.000004 0.00003 Chrysene 0.39 0.0003 0.0026 43 0.031 0.29 Coronene 0.13 0.0001 0.0009 7.2 0.005 0.048 Cyclopenta[c,d]pyrene 0.08 0.0001 0.0005 0.62 0.0004 0.004 Dibenzo[a,h]anthra-cene 0.10 0.0001 0.0007 9.0 0.006 0.060 Fluoranthene 0.59 0.0004 0.0039 90 0.064 0.60 Fluorene 0.12 0.0001 0.0008 3.0 0.002 0.020 Indeno[1,2,3-c,d]pyrene 0.26 0.0002 0.0017 41 0.029 0.27 Naphthalene 0.33 0.0002 0.0022 42 0.030 0.28 Phenanthrene 0.44 0.0003 0.0029 43 0.031 0.29 Pyrene 0.49 0.0003 0.0033 69 0.049 0.46 Sum PAHs9 4.8 0.0034 0.032 634 0.45 4.2 Table 3 – Remarks
1. From a toxicological point of view chromium should be differentiated into hexavalent chromium, soluble trivalent chromium and unsoluble chromium. No differentiation, however, was made in the papers, which have measured chromium (only total chromium levels measured).
2. Non industrial setting.
3. Sum of organotins: dibutyltin (DBT), monobutyltin (MBT), monooctyltin (MOT), tributyltin (TBT).
4. Of the compounds alachlor, carbaryl, chloroprofam, dicamba, mecoprop, methamidos, pendimethalin, picloram, resmethrin, tetramethrin and trifluralin only maximum values were found in literature.
5. Alpha-Chlordane = cis-Chlordane. 6. Gamma-Chlordane = trans-Chlordane. 7. Lindane is technical gamma-HCH.
8. Trichloro-2-pyridinol is a metabolite of chlorpyrifos.
9. Sum of PAHs: acenaphthene, acenaphthylene, anthracene, benzo[a]anthracene,
benzo[a]pyrene, benzo[b,k]fluoranthene, benzo[e]pyrene, benzo[g,h,i]perylene, biphenyl, chrysene, coronene, cyclopenta[c,d]pyrene, dibenzo[a,h]anthracene, fluoranthene, fluorine, indeno[1,2,3-c,d]pyrene, naphthalene, phenanthrene, pyrene.
5
Substances in house dust with and without potential
human health risk
5.1
Comparison exposure via house dust, TDI, and background
exposure
In order to select the compounds for which it is highly unlikely that exposure via house dust results in a human health risk, the exposure via house dust was estimated in a conservative manner: by using the highest and the highest geometric mean concentration encountered in literature. As a toxicologically-based reference value the Tolerable Daily Intake (TDI) is used since this represents the estimated amount of the chemical that humans can ingest daily during their lifetime without resultant adverse effects. It is thus implicitly assumed that humans are exposed to house dust daily, and that the concentration of the compound in house dust does not change over time.
The TDI represents the upper limit of allowable exposure to a single compound. Exposure to this compound can occur via different exposure routes. Since ingestion of house dust occurs in addition to other exposure routes the background exposure, e.g. exposure via normal food and water consumption, has to be taken into account.
For convenience, a Risk Index (RI) is used to identify the possible health risk. The risk index (RI) is calculated by:
estimated exposure to substance via house dust + background exposure RI=
TDI
This means that background exposure is incorporated in the calculation of the potential health risk. For the RI, the mean and maximum ingestion rates were used for both adults and children (see Table 4). When RI < 1, no risk is expected for human health. However, when RI >1 this indicates a potential risk for human health. Although it is unlikely that a substance can cause a health risk at RI < 1, an additional safety precaution was taken at this point to further investigate substances for which an RI > 0.8 was obtained. Hence, all
compounds with a risk index greater than 0.8 are addressed in more detail in
section 5.3. The main purpose of Table 4 is to identify those compounds for which it is highly unlikely that they can cause a potential health risk via exposure through house dust, even if a conservative approach is used (highest available concentration in house dust is used in the calculation of the human exposure, additional research for compounds with a RI > 0.8, accounting for background exposure).
The TDIs and background exposure used are listed in Appendix 2, including the references to their derivation.
Table 4. Tolerable daily intake and risk index for compounds present in house dust based on highest geometric mean and maximum levels in house dust described in literature (see also Table 3). Risk Indices (RI) greater than 0.8 were taken to indicate a potential health risk (bold values). The potential health risk for these compounds is discussed in more detail in section 5.3. Mean and maximum concentrations of substances in house dust used for the calculation can be found in Table 3.
Compound TDI Background Risk index
(μg/kg/d) (μg/kg/d) mean adult mean child max adult max child
Adult Child Metals Aluminium1 750 1802 300 0.26 0.62 0.29 0.85 Antimony1 6.0 0.483 0.5 0.08 0.12 0.09 0.16 Arsenic1 1.0 0.3 0.74 0.35 1.2 0.44 2.0 Barium 600 9.0 0.02 0.02 0.02 0.03 Beryllium 0.5 0.3 0.60 0.61 0.60 0.61
Bismuth5 n.a.5 unknown
Cadmium 0.5 0.45 0.92 1.1 1.2 3.8
Chromium III soluble6 5.0 1.0 0.22 0.41 0.97 7.5
Chromium III insoluble6 5000 1.0 0.00 0.00 0.00 0.01
Chromium VI7 5.0 0.0 0.00 0.00 0.00 0.00
Cobalt 1.4 0.6 0.44 0.51 0.44 0.54
Copper 83 60 0.73 0.74 0.83 1.7
Lead1 3.6 1.1 1.8 0.54 2.7 7.7 69
Lithium5 n.a. 5 unknown
Magnesium 6700 4600 0.69 0.70 0.69 0.74
Manganese 160 130 0.81 0.82 0.85 1.2
Mercury 2.0 0.1 0.05 0.06 0.06 0.17
Molybdenum 10 4.0 0.40 0.40 0.40 0.42
Nickel1 10 4.0 8.0 0.40 0.83 0.42 0.96
Rubidium5 n.a. 5 unknown
Selenium 5.0 2.0 0.40 0.40 0.40 0.41 Silver 5.0 1.3 0.26 0.26 0.26 0.27 Strontium 600 18 0.03 0.03 0.03 0.04 Tellurium 2.0 1.414 0.70 0.70 0.70 0.70 Thallium 0.2 0.0314 0.15 0.15 0.15 0.16 Tin 2000 290 0.15 0.15 0.15 0.15 Titanium 12000 7.0 0.001 0.002 0.001 0.003
Compound TDI Background Risk index (μg/kg/d) (μg/kg/d) mean adult mean child max adult max child
Adult Child
Metals
Tungsten5 n.a. 5 unknown
Uranium 2.0 0.06 0.03 0.03 0.03 0.03 Vanadium 2.0 0.314 0.19 0.52 0.22 0.79 Zinc8 500 350 0.70 0.71 0.74 1.1 Organotin compounds Dibutyltin (DBT) Dioctyltin (DOT) Monobutyltin (MBT) Monooctyltin (MOT) Tributyltin (TBT) Sum organotins9 0.25 0.083 0.33 0.35 0.35 0.53 Pesticides 2,4-Dichlorophenoxy acetic acid 10 unknown <0.0001 0.0008 0.0005 0.0049 Alachlor 10 unknown 0.0005 0.0049 Aldrin 0.115 < 0.04 <0.0001 0.0004 0.0004 0.0034 alpha-Chlordane10 0.5 unknown 0.0001 0.0007 0.0004 0.0034 alpha-HCH 1.0 < 0.03 <0.0001 <0.0001 <0.0001 0.0001 Atrazine 35 unknown <0.0001 <0.0001
Azinphos methyl 5 unknown 0.0009 0.0080 0.0023 0.0213
beta-HCH 0.02 < 0.01 0.0001 0.0007 0.0020 0.0190 Carbaryl 8 unknown 0.0001 0.0008 Chloroprofam 50 unknown <0.0001 0.0000 Chlorpyrifos 10 unknown 0.0001 0.0007 0.0005 0.0043 DDD 0.516 unknown <0.0001 0.0001 0.0001 0.0006 DDE 0.516 unknown <0.0001 0.0001 0.0001 0.0007 DDT 0.516 unknown 0.0002 0.0016 0.0011 0.0104
delta-HCH5 n.a. 5 unknown
Diazinon 5 unknown <0.0001 0.0004 0.0003 0.0027
Dicamba 125 unknown <0.0001 0.0001
Dieldrin 0.115 unknown 0.0001 0.0012 0.0004 0.0033
Ethyl parathion 4 unknown 0.0001 0.0009 0.0001 0.0007
gamma-Chlordane11 0.5 unknown 0.0001 0.0013 0.0007 0.0063
Compound TDI Background Risk index (μg/kg/d) (μg/kg/d) mean adult mean child max adult max child
Adult Child Pesticides Heptachlor 0.1 0.001 0.0108 0.0179 0.0124 0.0323 Lindane12 0.04 0.0059 0.0550 0.0013 0.0123 Malathion 300 unknown <0.0001 <0.0001 <0.0001 <0.0001 Mecoprop 3.3 unknown 0.0001 0.0008 Methamidophos 4 unknown 0.0001 0.0007
Methyl parathion 3 unknown 0.0001 0.0008 0.0004 0.0042
Metolachlor 3.5 unknown <0.0001 <0.0001 0.0002 0.0015 Pendimethalin 125 unknown <0.0001 0.0002 Permethrin 50 unknown <0.0001 <0.0001 0.0094 0.0879 Phosmet 3 unknown 0.0012 0.0116 0.0052 0.0489 Picloram 200 unknown <0.0001 0.0000 Resmethrin 30 unknown <0.0001 0.0002 Tetramethrin 20 unknown <0.0001 0.0001
Trichloro-2-pyridinol5 n.a. 5 unknown
Trifluralin 15 unknown 0.0001 0.0008 Phthalates Butylbenzyl phthalate (BBP) 500 9.00 0.02 0.02 0.08 0.63 Di(2-ethylhexyl) phthalate (DEHP) 50 1622 2623 0.37 0.95 0.90 5.9
Diethyl phthalate (DEP) 20014 unknown 0.0002 0.002 0.003 0.03
Diisobutyl phthalate
(DiBP) 5 n.a.
18 unknown see DBP see DBP see DBP see DBP
Diisodecyl phthalate (DIDP) 150 unknown 0.0003 0.03 0.0003 0.00 Diisononyl phthalate (DINP) 150 unknown 0.001 0.01 0.001 0.01 Dimethyl phthalate (DMP) 5
n.a.17 unknown see DEP see DEP see DEP see DEP
Dimethylpropyl
phthalate (DMPP) 5 n.a.
18 unknown see DBP see DBP see DBP see DBP
Di-n-butyl phthalate (DBP)
52 unknown 0.00 0.05 0.08 0.73
Brominated flame retardants (BFRs)/Brominated diphenylethers (BDEs)
BDE 475 n.a.5 A: 0.0003020 C: 0.001420 19 19 19 19 BDE 99 - EU 0.00026 A: 0.0001020 C: 0.0002320 0.45 1.5 22 204
Compound TDI Background Risk index (μg/kg/d) (μg/kg/d) mean adult mean child max adult max child
Adult Child
Brominated flame retardants (BFRs)/Brominated diphenylethers (BDEs)
BDE 99 - VS 0.00026 A: 0.0001020 C: 0.0002320 6.8 61 39 362 BDE 1005 n.a. 5 A: 0.0000720 C: 0.0001820 19 19 19 19 BDE 1835 n.a. 5 A: 0.0003420 C: 0.0008720 19 19 19 19 BDE 2095 n.a. 5 20
Polycyclic aromatic hydrocarbons (PAHs)
Acenaphthene5 n.a. 5 Acenaphthylene5 n.a. 5 Anthracene 40 Benz[a]anthracene5 n.a. 5 Benzo[a]pyrene5 n.a. 5 Benzo[b,k]fluoranthene5 n.a. 5 Benzo[e]pyrene5 n.a. 5 Benzo[g,h,i]perylene 30 Biphenyl 50 Chrysene5 n.a. 5 Coronene5 n.a. 5 Cyclopenta[c,d]pyrene5 n.a. 5 Dibenzo[a,h]anthracene5 n.a. 5 Fluoranthene5 n.a. 5 Fluorene 40 Indeno[1,2,3-c,d]pyrene5 n.a. 5 Naphthalene 40 Phenanthrene 40 Pyrene5 n.a. 5
Sum PAHs13 0.05 (as
BaP)
0.0006 (as BaP)
0.08 0.65 9.0 84.6
Table 4 – Remarks
1. For aluminium, antimony, arsenic, lead and nickel, background values for adults and children are discriminated.
2. Background value of aluminium for adults is between 80 and 180 μg/kg/day. 3. Background value of antimony for adults is between 0.018 and 0.48 μg/kg/day. 4. Background value of arsenic for children is between 0.4 and 0.7 μg/kg/day. 5. TDI is not available (= n.a.).
6. Chromium III must be differentiated into soluble (TDI=5 μg/kg/day) and insoluble (TDI=5000 μg/kg/day).
7. Background chromium VI between 5.7×10⁻⁶ - 4.3×10⁻⁴ μg/kg/day.
8. Non industrial setting.
9. Sum of organotins: dibutyltin (DBT), monobutyltin (MBT), monooctyltin (MOT), tributyltin (TBT).
10. Alpha-Chlordane = cis-Chlordane. 11. Gamma-Chlordane = trans-Chlordane. 12. Lindane is technical gamma-HCH.
13. Sum of PAHs: acenaphthene, acenaphthylene, anthracene, benzo[a]anthracene,
benzo[a]pyrene, benzo[b,k]fluoranthene, benzo[e]pyrene, benzo[g,h,i]perylene, biphenyl, chrysene, coronene, cyclopenta[c,d]pyrene, dibenzo[a,h]anthracene, fluoranthene, fluorine, indeno[1,2,3-c,d]pyrene, naphthalene, phenanthrene, pyrene.
14. Provisional value due to limited toxicological data base. 15. Sum of aldrin and dieldrin.
16. Sum of DDD, DDE and DDT.
17. TDI of dimethyl phthalate (DMP) is unknown, as the compound is chemically comparable to diethyl phthalate (DEP), the concentrations of DMP are added to the concentrations of DEP and compared to the TDI of DEP.
18. TDI of diisobutyl (DiBP) and dimethylpropyl phthalate (DMPP) are unknown, as these compounds are chemically comparable to di-n-butyl phthalate (DBP), the concentrations of DiBP and DMPP are added to the concentrations of DBP and compared to the TDI of DBP.
19. For BDE 47, 100, and 183 no toxicological reference dose (e.g. TDI) is available to compare the exposure with. Therefore, the exposure via intake of house dust is compared to the exposure due to food intake in section 6.12.
20. Background exposure to PBDE congeners is based on dietary intake for an adult (A) and a 2-year old child (C) (De Winter-Sorkina et al., 2006).
21. No information is available about the intake of BDE209 via food intake, neither is a toxicological reference dose available. Therefore, the exposure via dust of BDE209 can only be compared to the exposure via dust of other PBDE congeners.
22. Background value of DEHP for adults is between 3 and 16 μg/kg/day. 23. Background value of DEHP for children is between 12 and 26 μg/kg/day.
5.2
Levels of substances in particulate matter in air
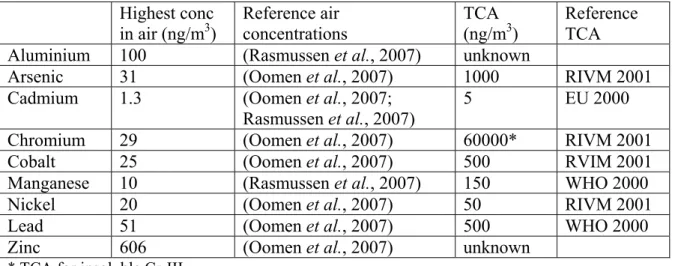
The amount of inhaled house dust particles is low (< 2%) in comparison to ingested house dust. However, in some cases such as for toxic metals local effects in the lungs may occur. In order to evaluate the possibility of a potential health risk of several metals in air, the highest concentrations in particulate matter in air as reported in selected literature sources were compared to the corresponding TCA-values (chronic limit values for air as mg/m3), see Table 5. Below the TCA no health effects are anticipated even after lifelong exposure. None of the highest concentration in airborne particles exceeds the TCA. For arsenic however the guideline value for air of 6 ng/m3, which will be effective within the EU in
2013, is exceeded, indicating that concentrations of this metal may be undesirably high even though they remain well below the current TCA as used by RIVM.
Table 5. Maximum concentrations of various metals in particulate matter (PM10 or PM2.5) in indoor air.
Highest conc
in air (ng/m3) Reference air concentrations TCA (ng/m3) Reference TCA
Aluminium 100 (Rasmussen et al., 2007) unknown
Arsenic 31 (Oomen et al., 2007) 1000 RIVM 2001
Cadmium 1.3 (Oomen et al., 2007;
Rasmussen et al., 2007) 5 EU 2000
Chromium 29 (Oomen et al., 2007) 60000* RIVM 2001
Cobalt 25 (Oomen et al., 2007) 500 RVIM 2001
Manganese 10 (Rasmussen et al., 2007) 150 WHO 2000
Nickel 20 (Oomen et al., 2007) 50 RIVM 2001
Lead 51 (Oomen et al., 2007) 500 WHO 2000
Zinc 606 (Oomen et al., 2007) unknown
* TCA for insoluble Cr-III
5.3
Substances without potential human health risk
The majority of the substances present in house dust is without potential human health risk. Compounds without human health risk are: antimony, barium, beryllium, cobalt, magnesium, mercury, molybdenum, selenium, silver, strontium, tellurium, thallium, tin, titanium, uranium, vanadium, organotin compounds, 2,4-dichlorophenoxyacetic acid, alachlor, aldrin, alpha-chlordane, alpha-HCH, atrazine, azinphos methyl, beta-HCH, carbaryl, chloroprofam, chlorpyrifos, DDD, DDE, DDT, diazinon, dicamba, dieldrin, ethyl parathion, gamma-chlordane, glyphosate, heptachlor, lindane, malathion, mecoprop, methamidophos, methyl parathion, metolachlor, pendimethalin, permethrin, phosmet, picloram, resmethrin, tetramethrin, trifluralin, BBP, DEP, DiBP, DIDP, DINP, DMP, DMPP, DBP.
5.4
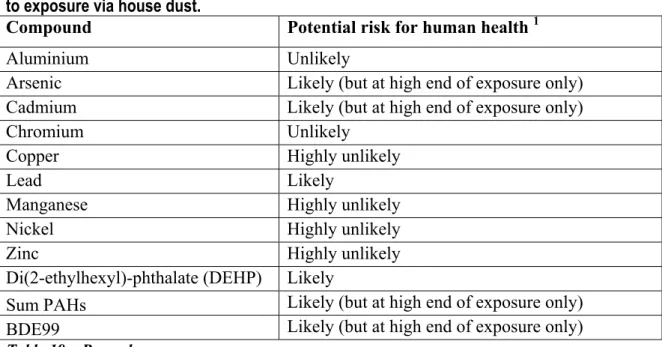
Substances with potential human health risk
Based on the calculated mean and maximum ingestion rates, exposure to the following substances in house dust may lead to potential human health effects. Potential human risk is subdivided into risk for adults and risk for children.
Substances in house dust with potential risk for adults: cadmium, chromium, copper, lead, manganese, BFRs, and sum PAHs.
Substances in house dust with potential risk for children: aluminium, arsenic, cadmium, chromium, copper, lead, manganese, nickel, zinc, DEHP, BFRs, and sum PAHs.
Table 6 shows the substances in house dust with a potential risk for adults and children, based on mean and maximum values. Since the maximum concentration in house dust is not always a realistic value, the P95 is added in the calculations. The highest mean, maximum and P95 of the concentration in house dust are presented. The P95 value was used for the calculation of the risk index and for the contribution of house dust to the TDI as a percentage. Both the P95 risk index and the percentage of TDI were calculated for adults and children separately.
Table 6. Compounds with potential risk for human health
Concentration in house dust
Highest mean Highest P95 Maximum Risk index based on highest P95 conc in house dust Exposure via house dust based
on highest P95 conc compared
to TDI 1
(mg/kg) (mg/kg) (mg/kg) (-) (-) (-) (-)
Adult Child Adult Child
Compound Aluminium 24281 44225 51100 0.28 0.79 0.042 0.39 Arsenic 70 1142 192 0.382 1.462 0.0812 0.762 Cadmium 13 17.32 220 0.92 1.13 0.025 0.23 Chromium III soluble 159 191.8 5440 0.12 0.35 0.027 0.26 Chromium III insoluble 159 191.8 5440 0.00 0.00 0.00 0.00 Copper 261 489 12540 0.73 0.76 0.004 0.039 Lead 1200 1312 37000 0.57 2.99 0.26 2.4 Manganese 260 407 9410 0.81 0.83 0.002 0.017 Nickel 47 116 243 0.41 0.88 0.008 0.078 Zinc3 628 1570 30600 0.70 0.72 0.002 0.021 Di(2-ethylhexyl)-phthalate (DEHP) 3214 7063 40459 0.42 1.46 0.10 0.94 Sum PAHs4 0.29 13 54 0.20 1.8 0.18 1.7 BDE99 – EU5 0.0225 0.156 7.8 0.8 5.0 0.41 3.8
Table 6 – Remarks
1. Exposure via house dust compared to TDI calculated as a factor: exposure via house dust (P95) (μg/kg bw/day)
TDI (μg/kg bw/day)
2. P90 value, calculation of risk index and % of TDI based on P90 value. 3. Non industrial setting
4. Surrogate approach (also referred to the ‘indicator approach’).
5. For BDE99 no TDI is available. Instead a maximal allowable intake level derived by De Winter-Sorkina et al. (IPCS (International Programme on Chemical Safety), 2001) is employed.
6. Geometric mean, and 95th percentile of pooled data of (Ibarra et al., 2006; Knoth, 2003; Pless-Mulloli et al., 2006; De Boer, 2007; Santillo et al., 2003)
6
Discussion substances with potential human health
risk
In the present chapter those substances are discussed in more detail for which a potential health risk due to house dust was identified using the highest house dust concentration encountered in literature (chapter 5). In addition, some measures to decrease the exposure to substances via house dust are discussed.
6.1
Aluminium
Table 7. Overview of risk indices for aluminium based on geometric mean, P95 and maximum concentration data encountered in house dust (background exposure is accounted for). The contribution of the exposure via house dust to the total exposure is listed in the second columns for an adult and child respectively by comparison to the TDI.
Adult Child Risk Index Exposure house
dust compared to TDI1
Risk Index Exposure house dust compared to TDI1 Mean conc. 0.26 0.023 0.62 0.22 P95 conc. 0.28 0.042 0.79 0.39 Max. conc. 0.29 0.050 0.85 0.45 Table 7 – Remarks
1. Exposure via house dust compared to TDI calculated as a factor. When the factor is greater than 1, the exposure route via house dust on its own exceeds the TDI.
exposure via house dust (μg/kg bw/day) Exposure house dust compared to TDI=
TDI (μg/kg bw/day)
Only one study was found that provides information on the levels of aluminium in house dust. When the P95-concentration or the maximum concentration of aluminium in house dust was used in the calculation of the risk index, the risk index was high but not larger than 1 (0.85 for a child with the maximum concentration in house dust, 0.79 for a child with the 95th-percentile data, see Table 7). This indicates only a limited potential health risk. Nevertheless, the contribution of exposure via house dust is not negligible for children (39% of the TDI is filled up by exposure via house dust based on the 95th -percentile data). Background exposure to aluminium via food and water intake accounts for about 40% of the TDI for children and 11-24% for adults. Thus, the only study giving information on aluminium exposure through house dust indicates a substantial
one study performed in Ottawa, Canada, for the Dutch situation is unknown. In
conclusion, the available information indicates house dust may substantially contribute to total aluminium exposure. It is however not likely that this exposure would lead to human health risks.
6.2
Arsenic
Table 8 provides an overview of the risk indices for arsenic. The risk index obtained using the highest concentration in house dust encountered in literature was 2.0 for a child and 0.44 for an adult, whereas the risk indices associated with the highest geometric mean concentration of arsenic in house dust were 1.2 and 0.35, respectively. The background exposure to arsenic for a child already fills up 40-70% of the TDI due to intake by food and water.
Arsenic is a naturally occurring element in the environment that may be released from industrial processes, such as mining activities, metal smelting and burning of fossil fuels. High values of arsenic in house dust are often found near smelters. Yet, also in non-industrial settings the arsenic concentration in house dust is occasionally high. In the Netherlands, high arsenic concentrations may be anticipated in the area of zinc smelters (e.g. Budel-Dorplein). Recent research in 15 houses in Budel-Dorplein determined a arsenic concentration of at maximum 60 mg/kg in house dust, whereas in the control area (Liempde, non-industrial setting) in one house an arsenic concentration in house dust of 74 mg/kg was found (Oomen et al., 2007). This house dust concentration of 74 mg/kg combined with highest background exposure for children (0.7 μg/kg bw/day is used as background exposure of the range 0.4-0.7 μg/kg bw/day) and 0.3 μg/kg bw/day for adults, results in a risk index of 0.35 and 1.2 for an adult and child, respectively. In this
calculation the exposure via house dust represents 5 and 49% of the TDI, respectively. Note that in the earlier research by Oomen et al. (2007) a lower dust intake was used in the calculation and exposure was integrated over a lifetime. The conclusion there was that arsenic in house dust from Budel-Dorplein did not cause a potential risk for human health (Oomen et al., 2007).
In conclusion, the present analysis based on literature data indicates substantial exposure to arsenic through house dust. The calculated risk index indicates a potential human health risk for children. For adults background estimated exposure is lower than for children (0.3 versus 0.7 μg/kg/day). Thus the exceedance of the TDI will in most cases be limited to the childhood years. Given its derivation, the TDI for arsenic should be treated as a long-term average, which implies that in principle any temporary exceedance early in life could be compensated by a proportionally lower exposure later in life, as seems to be the case for arsenic in house dust. Nevertheless, given the general picture for arsenic health risks of only a limited margin between actual intakes and levels known to produce toxic
effects when humans are exposed to them chronically, arsenic exposure in general should preferably be as low as possible.
Table 8. Overview of risk indices for arsenic based on the highest encountered geometric mean, P95 and maximum concentration data encountered in house dust (background exposure is accounted for). The contribution of the exposure via house dust to the total exposure is described in the second column for an adult and child by comparison to the TDI.
Adult Child Risk Index Exposure house
dust compared to TDI1
Risk Index Exposure house dust compared to TDI1 Mean conc. 0.35 0.05 1.2 0.47 P95 conc. 0.38 0.08 1.5 0.76 Max. conc. 0.44 0.14 2.0 1.3 Highest conc. Netherlands 2 0.35 0.05 1.2 0.49 Table 8 – Remarks
1. Exposure via house dust compared to TDI calculated as a factor. When the factor is greater than 1, the exposure route via house dust on its own exceeds the TDI.
exposure via house dust (μg/kg bw/day) Exposure house dust compared to TDI=
TDI (μg/kg bw/day)
2. Highest concentration encountered in a study in the Dutch Kempen area (Oomen et al., 2007).
6.3
Cadmium
Important for cadmium is that background exposure due to food and water intake already accounts for 90% of the TDI. This limits the allowable additional exposure via other routes. Thus relatively low levels of cadmium in house dust may already lead to risk indices higher than 1.0, indicating a potential health risk. Occasionally cadmium levels in house dust are so high that they may pose a potential health risk even without taking into account background exposure, see Table 9. In most cases, however, the contribution of house dust to total cadmium exposure is limited. Thus for cadmium, exposure through house dust may give rise to a potential health risk when taking the background into account, but its contribution to total exposure mostly is limited only.
The highest cadmium concentration recently encountered in house dust in the Netherlands was 22.8 mg/kg in Budel-Dorplein, an area known to be historically contaminated with cadmium (Oomen et al., 2007). The cadmium concentration in all other houses (n=45) was considerably lower (< 7 mg/kg). This highest concentration in the Netherlands is, according to the present method, associated with a risk index of 0.93 and 1.2 for an adult
and child, respectively (accounting for 3.2% and 30 % of the TDI, respectively), see Table 9. This confirms the picture obtained form literature.
Cadmium is an extremely potent nephrotoxicant. This toxicity develops over a time period of decades of continuing low exposure, with the kidney cortex as the target tissue. Thus a risk index for a child greater than 1 does not necessarily mean an actual health risk during this period of life. Exposure to cadmium should be evaluated integrally over the childhood and adult years. When modelling exposure to the highest cadmium concentration in house dust in Budel-Dorplein (22.8 mg/kg) during 7 childhood years, 11 transition years and 62 adult years, the critical cadmium levels in the kidney cortex were calculated not to be reached, and therefore no health risk was anticipated (Oomen et al., 2007). Despite this absence of an actual health risk, elevated exposure to cadmium is undesirable in principle and a policy of reducing its exposure via food and other routes is followed by health authorities. Thus levels in house dust should also be as low as possible.
Table 9. Overview of risk indices for cadmium based on the highest encountered geometric mean, P95 and maximum concentration data encountered in house dust (background exposure is
accounted for). The contribution of the exposure via house dust to the total exposure is described in the second column for an adult and child by comparison to the TDI.
Adult Child
Risk Index Exposure house
dust compared to TDI1
Risk Index Exposure house dust compared to TDI1 Mean conc. 0.92 0.02 1.1 0.17 P95 conc. 0.92 0.03 1.1 0.23 Max. conc. 1.2 0.31 3.8 2.9 Highest conc. Netherlands 2 0.93 0.03 1.2 0.30 Table 9 – Remarks
1. Exposure via house dust compared to TDI calculated as a factor. When the factor is greater than 1, the exposure route via house dust on its own exceeds the TDI.
exposure via house dust (μg/kg bw/day) Exposure house dust compared to TDI=
TDI (μg/kg bw/day)
2. Highest concentration encountered in a study in the Dutch Kempen area (Oomen et al., 2007).
A further issue with cadmium is its inhalatory carcinogenicity as evident from in studies in industrial workers with high exposures. For cadmium a toxicological reference value for air of 5 ng/m3 has been derived as protective against both its nephrotoxicity and its carcinogenicity (Oomen et al., 2007). The highest cadmium concentration in air samples in Budel-Dorplein, Maarheeze and Liempde in the Netherlands was 1.4 ng/m3 (n=45) (Oomen et al., 2007). It can be calculated that theoretical exposure to this highest cadmium concentration in air during an entire life, would lead to an extra cancer risk of 3.2-5.8 × 10⁻⁶ (32 to 58 additional cases of cancer per 10 million lifelong exposed). Based
on the available evidence it is concluded that cadmium exposure via dust particles in the air does not exceed the toxicological reference value of 5 ng/m3.
6.4
Chromium
From a toxicological point of view trivalent and hexavalent chromium should be
differentiated. Hexavalent chromium is much more toxic than trivalent chromium, having a much higher toxic potential for different toxicological endpoints and most importantly, unlike the trivalent form, presenting a genotoxic and carcinogenic risk. Soluble trivalent chromium in turn is more toxic than insoluble trivalent chromium, which is reflected by their respective TDIs of 5 and 5000 μg/kg/day.
Available data on chromium concentrations in house dust represent total chromium, i.e. without specification of valence and solubility. No general information is available on the contribution of hexavalent chromium in house dust. A priori it is plausible that chromium in house dust is trivalent chromium due to the chemical instability of hexavalent
chromium. However, as indicated, this assumption cannot be founded by actual data. Trivalent chromium is expected to be present predominantly as insoluble compound (in parallel to soil in which the insoluble forms as carbonate and oxide dominate, chromium dissolves only when complexation is possible).
Assuming chromium to be present in house dust predominantly as insoluble trivalent ion, all risk indices are close to zero, indicating absence of a potential risk.
6.5
Copper
Copper is an essential trace nutrient to humans. Nevertheless high concentrations of copper can be toxic. Based on the maximum value in house dust, copper can cause a potential risk for children (risk index 0.83 and 1.7 for an adult and child, respectively, see Table 10). When calculations were performed using the P95 or the highest geometric mean, no potential risk was found. The highest copper concentration in house dust encountered in literature (12540 mg/kg) was much higher than the 95th-percentile concentration (489 mg/kg) and the geometric mean (261 mg/kg). This indicates that the highest value may be an extreme situation. It is therefore unlikely that background exposure and exposure via house dust to copper would actually result in a potential risk for human health.
Crucially, in general copper exposure via house dust accounts for only a small percentage of the TDI (about 0.4% for a child at the P95-exposure level). About 72% of the TDI is filled up by background exposure via food and water intake. Hence, house dust is in most cases only a minor exposure route for copper.