Estimation of the dietary intake of
mycotoxins by means of measurements
in human urine
The application of toxicokinetic models for the estimation of renal mycotoxin excretion
RIVM Letter report 2015-0213
Page 2 of 39
Colophon
© RIVM 2015
Parts of this publication may be reproduced, provided acknowledgement is given to: National Institute for Public Health and the Environment, along with the title and year of publication.
M.J.B. Mengelers (author), RIVM J.C.H. van Eijkeren (author), RIVM Contact:
Marcel Mengelers
Department of Food Safety marcel.mengelers@rivm.nl
This investigation has been performed by order and for the account of Netherlands Food and Product Safety Authority, within the framework of project 9.4.35
This is a publication of:
National Institute for Public Health and the Environment
P.O. Box 1 | 3720 BA Bilthoven The Netherlands
Publiekssamenvatting
De inname van mycotoxinen in voedsel geschat via metingen in urine
Schimmels die bijvoorbeeld op granen, noten en vruchten groeien, kun-nen giftige stoffen maken die ons voedsel verontreinigen (mycotoxikun-nen). Door de lage concentraties vormen ze doorgaans geen gevaar voor de gezondheid, maar het is wel van belang om te volgen in welke mate mensen deze mycotoxinen via voedsel consumeren. Een tijdrovende manier om dat te doen is door alle voedingsmiddelen door te meten, maar het kan ook in urine en bloed worden gemeten.
RIVM-onderzoek maakt nu duidelijk onder welke voorwaarden via urine kan worden berekend hoeveel mycotoxinen mensen via voedsel binnen-krijgen. De snelheid waarmee mycotoxinen via de urine worden uitge-scheiden verschilt namelijk per mycotoxine en is daardoor van invloed op de manier waarop en wanneer de urine moet worden opgevangen. In dit onderzoek is ingezoomd op twee mycotoxinen die sterk verschillen in de snelheid waarmee ze via de urine worden uitgescheiden. Het ene mycotoxine (afgekort DON) wordt snel, binnen 24 uur, uitgescheiden. Hiervoor moet de urine worden verzameld gedurende 24 uur nadat het verontreinigde voedsel is gegeten. Het maakt daarbij niet uit of de con-sument DON gedurende lange of korte tijd voorafgaand aan de urinecol-lectie heeft geconsumeerd.
Het andere mycotoxine (afgekort OTA) wordt gedurende enkele maan-den uitgescheimaan-den. Daardoor heeft het geen zin om de concentratie in urine te meten als de consument maar kort aan OTA is blootgesteld, bijvoorbeeld enkele dagen of weken. Meten in urine is alleen zinvol als een consument gedurende enkele maanden dagelijks OTA binnenkrijgt. In dat geval is de manier waarop urine wordt verzameld minder belang-rijk dan bij DON: het kan door 24 uursurine of ochtendurine te verzame-len.
Kernwoorden: mycotoxinen, voedsel, inname, biomonitoring, urine, uit-scheiding, toxicokinetiek.
Synopsis
Estimation of the dietary intake of mycotoxins by means of measurements in human urine
Moulds that grow on for example grains, nuts and fruits may produce toxic substances that contaminate our food. These toxic substances are called mycotoxins. Because of the low concentrations in food, there is generally no risk for human health but it remains important to monitor to what extent people are exposed to mycotoxins via food intake. A time-consuming way to know how much mycotoxins are ingested is to measure all relevant food products but it can also be measured in urine. RIVM research points out the conditions that must be met to be able to estimate the dietary intake of mycotoxins by means of measurements in human urine. The rate of renal excretion between the various mycotox-ins differs and this rate determines the method and frequency of urine collection.
This research focussed on two mycotoxins that differ greatly in the renal excretion rate. One mycotoxin (abbreviated as DON) is rapidly excreted via urine: within 24 hours. Therefore, it is necessary to collect urine dur-ing 24 hours after dur-ingestion of DON. It doesn’t matter how long the con-sumer has been exposed to DON prior to urine collection.
The other mycotoxin (abbreviated as OTA) is excreted slowly via urine: within a few months. Therefore, it is not useful to measure its concen-tration in urine if the consumer has ingested OTA for a short period (e.g. for a few days or weeks). If the consumer has ingested OTA daily for several months, it is useful to measure its concentration in urine. In this case the method of collecting urine is less important than for DON. Urine may be collected during 24 hours or in the morning.
Keywords: mycotoxins, food, intake, biomonitoring, urine, excretion, toxicokinetics.
Contents
Summary — 9 1 Introduction — 11
2 DON: a model for a fast eliminating mycotoxin — 13 2.1 Introduction — 13
2.1.1 Toxicokinetics of DON — 13
2.2 Toxicokinetic models applied for DON — 13 2.2.1 Introduction — 13
2.2.2 Excel calculator for DON — 14
3 OTA: a model for a slow eliminating mycotoxin — 19 3.1 Introduction — 19
3.1.1 Toxicokinetics of OTA — 19
3.2 Toxicokinetic models applied for OTA — 20 3.2.1 Introduction — 20
3.2.2 Excel calculator for OTA with a fixed dose — 20 4 Conclusions and discussion — 25
4.1 DON — 25 4.2 OTA — 26
4.3 Summary and recommendation — 27 5 References — 29
6 Acknowledgements — 31
7 Technical explanations of the toxicokinetic models — 33 7.1 Excel calculator and toxicokinetic model for DON — 33
7.1.1 Excel calculator for DON — 33 7.1.2 DON model implementation — 35
7.2 Excel calculator and toxicokinetic model for OTA — 36 7.2.1 Excel calculator or OTA — 36
Summary
Mycotoxins are substances produced by micro-fungi growing on plants and plant products during production and storage. Examples of fungi producing mycotoxins are Aspergillus, Penicillium and Fusarium. The production of mycotoxins depends on the plant, the fungal species and climate conditions (temperature and humidity).
Mycotoxins can have detrimental health effects in animals and humans, with toxicity depending on the type of mycotoxin, the ingested dose, the exposure duration and characteristics of the exposed individual. There-fore, assessment of the health risks caused by exposure to mycotoxin is necessary.
Previous mycotoxin exposure assessments in the Netherlands were based on concentration data obtained from monitoring and survey pro-grammes combined with food consumption data, from duplicate diet studies or from a mycotoxin dedicated total diet study.
Another approach, not explored before in the Netherlands for mycotox-ins, is human biomonitoring. Human biomonitoring (HBM) measures the levels of substances in body fluids and tissues. HBM can be used to es-timate the internal and external exposure of humans to substances. One of the advantages of HBM is that it is not necessary to determine myco-toxin concentrations in food and food consumption data for the estima-tion of the dietary mycotoxin intake. However, several condiestima-tions must be met to be able to estimate the dietary intake by means of measuring renal mycotoxin excretion.
The goal of this research is to determine the feasibility of estimating the dietary mycotoxin intake by determining mycotoxin excretion, including their (major) metabolites, in urine. In other words, to test the applicabil-ity of (urinary) biomarkers of (mycotoxin) exposure. Secondly, to devel-op a calculator in Excel that can be used by pedevel-ople who are not familiar with toxicokinetic models but who are interested to see (visually) how dietary mycotoxin intake is related to mycotoxin levels in urine. The ap-plicability of several methods of urine collection are discussed: morning urine, spot urine and 24-hour urine. The applicability is based on toxico-kinetic models that predict urinary levels in humans after consumption of a certain amount of mycotoxin. Different theoretical models have been applied: a model for a rapidly eliminated mycotoxin, namely deox-ynivalenol (DON) and a model for a slowly eliminated mycotoxin, name-ly ochratoxin A (OTA). These different elimination profiles have been chosen to show the consequences for the method of urine collection and its applicability to estimate the dietary mycotoxin intake.
For DON it is necessary to collect urine during 24 hours after ingestion of DON. It doesn’t matter how long the consumer has been exposed to DON. For OTA it is not useful to measure its concentration in urine if the consumer has ingested OTA for a short period (e.g. for a few days or weeks). If the consumer has ingested OTA daily for several months it is useful to measure its concentration in urine. In this case the method of collecting urine is less important. Urine may be collected during 24 hours or in the morning.
1
Introduction
Mycotoxins are substances produced by micro-fungi growing on plants and plant products during production and storage. Examples of fungi producing mycotoxins are Aspergillus, Penicillium and Fusarium. The production of mycotoxins depends on the plant, the fungal species and climate conditions (temperature and humidity). The latter conditions are responsible for the frequently observed seasonal differences in mycotox-in concentrations (Marroquín-Cardona et al., 2014).
Mycotoxins can have detrimental health effects in animals and humans, with toxicity depending on the type of mycotoxin, the ingested dose, the exposure duration and characteristics of the exposed individual. There-fore, assessment of the health risks caused by exposure to mycotoxin is necessary. Risk assessment is carried out by comparing the mycotoxin exposure with the health-based guidance value derived for that myco-toxin.
Previous mycotoxin exposure assessments in the Netherlands were based on concentration data obtained from monitoring and survey pro-grammes combined with food consumption data (Boon et al., 2009), from duplicate diet studies (Bakker et al., 2009; Jekel and van Egmond, 2014) or from a mycotoxin dedicated total diet study (Sprong et al., 2015).
Another approach, not explored before in the Netherlands for mycotox-ins, is human biomonitoring. Human biomonitoring (HBM) measures the levels of substances in body fluids and tissues (EFSA, 2015a). HBM can be used to estimate the external and internal exposure of humans to substances. One of the advantages of HBM is that it is not necessary to determine mycotoxin concentrations in food and food consumption data for the estimation of the dietary mycotoxin intake. However, several conditions must be met to be able to estimate the dietary intake by means of measuring renal mycotoxin excretion (e.g. toxicokinetic pa-rameter estimation, method of urine collection, etc.).
The goal of this research is to determine the feasibility of estimating the dietary mycotoxin intake by determining mycotoxin excretion, including their (major) metabolites, in urine. In other words, to test the applicabil-ity of (urinary) biomarkers of (mycotoxin) exposure. Secondly, to devel-op a calculator in Excel that can be used by pedevel-ople who are not familiar with toxicokinetic models but who are interested to see (visually) how dietary mycotoxin intake is related to mycotoxin levels in urine. The ap-plicability of several methods of urine collection are discussed: morning urine, spot urine and 24-hour urine. The applicability is based on toxico-kinetic models that predict urinary levels in humans after consumption of a certain amount of mycotoxin. Different theoretical models have been applied: a model for a rapidly eliminated mycotoxin, namely deox-ynivalenol (DON) and a model for a slowly eliminated mycotoxin, name-ly ochratoxin A (OTA). These different elimination profiles have been chosen to show the consequences for the method of urine collection and it’s applicability to estimate the dietary mycotoxin intake.
Page 12 of 39
The models are made in Excel files that enable the user to edit some input parameters and view the corresponding output: a graph of the simulated urinary mycotoxin levels over time. The user may vary model parameters like dietary mycotoxin intake, body weight, mycotoxin frac-tion absorbed, absorpfrac-tion and eliminafrac-tion half-life, renal excrefrac-tion, urine production, etc. The resulting output is depicted in three types of
graphs: plasma mycotoxin levels, urinary mycotoxin levels and the cu-mulative amount excreted in urine over time. The latter is a direct
measure for the internal dose (this equals mycotoxin uptake) and can be used to estimate the dietary intake (as long as bioavailability is known or can be estimated).
Usually these kinetic models are based on a fixed dose over time e.g. a daily dose of x mg or y mg/kg body weight or a fixed dose several times a day (z mg every 8 hours, i.e. three times z mg per day). However, in real life a person consumes different doses of mycotoxins during the day. For example: DON in breakfast cereals and/or a different dose of DON in bread consumed at lunch and/or another dose of DON in pasta used for the evening meal. Therefore, we also developed a different type of model where the dose can be altered manually per dosing interval or where the dose is varied at random (within a certain range) per dosing interval by the Excel program. Again, the effect of this fluctuating dos-age regimen is visually depicted in the above-mentioned types of graphs.
These models enable us to determine the preferred method of urine col-lection and test its (theoretical) applicability to estimate the internal mycotoxin dose that is relevant for toxicity and to estimate the dietary mycotoxin intake.
2
DON: a model for a fast eliminating mycotoxin
2.1 Introduction
The mycotoxin deoxynivalenol (DON), also known as vomitoxin, is a trichothecene produced by fungi belonging to the Fusarium species. These fungi grow on plants and can cause Fusarium head blight on living crops. DON is commonly found in cereals and mixed feeds. A survey within the European Union revealed that 44% of food samples tested was contaminated with DON, demonstrating the frequent contamination (EFSA, 2013).
When ingested, DON may cause adverse effects on the gastro-intestinal tract, the nervous system, and the immune system (Maresca, 2013). Based on the most critical effect (decreased weight gain), a tolerable daily intake (TDI) of 1 μg/kg body weight (bw) per day was set based on a 2-year feeding study in mice (JECFA, 2010; SCF, 2002). In 2010, the Joint FAO/WHO Expert Committee on Food Additives (JECFA) ex-tended this TDI to a group provisional maximum tolerable daily intake (PMTDI) including the derivatives 3-actyldeoxynivalenol (3-ADON) and 15-acetyldeoxynivalenol (15-ADON). In addition, a group acute refer-ence dose (ARfD) of 8 μg/kg bw/day for DON, 3-ADON and 15-ADON was established (JECFA, 2010).
2.1.1 Toxicokinetics of DON
The toxicokinetics of DON were studied in several animal species (EFSA, 2015b). In most animals, including farm animals like pigs, DON is well and rapidly absorbed. After absorption, DON can be metabolized albeit to a limited extent, depending on the species, to
deepoxy-deoxynivalenol (DOM-1). In most species, DON and DOM-1 are exten-sively and rapidly glucuronidated (phase 2 biotransformation) and sub-sequently excreted via the urine.
Unfortunately, well-performed kinetic studies with DON in humans have not been published. Excretion of DON in human urine after consumption of contaminated food has been studied (Turner et al., 2010; Warth et al., 2013) but controlled studies with measured intake and (urinary) excretion over time are lacking. Nevertheless, from biomonitoring stud-ies in humans it is clear that also in humans, DON is extensively glucu-ronidated and these glucuronides are rapidly excreted (more than 80% of the ingested dose within 24 hours). In our models the default value for the elimination half-life of DON is 3 hours to make sure that 24 hours after ingestion of DON approximately 99% of the dose is renally excret-ed.
The excretion of DOM-1 was not modelled because it is considered a minor metabolite in humans (EFSA, 2015b).
2.2 Toxicokinetic models applied for DON
2.2.1 Introduction
Based on the limited available information on the toxicokinetics of DON a simple one-compartment model is developed.
A fraction of dietary DON intake is absorbed across the gut wall with a finite absorption half-life, so no instantaneous absorption is assumed. Distribution of DON is assumed to be fast with respect to absorption,
Page 14 of 39
metabolism and excretion kinetics and consequently the human body is considered as one compartment. In this model it is assumed that DON is only metabolised through glucuronidation. Furthermore it is assumed that (a fraction of) non-metabolised DON and DON-glucuronide are only excreted renally. More technical details on this model are found in sec-tion 7.1.
2.2.2 Excel calculator for DON
A calculator is made in Excel and it is intended for a few exercises to show differences in cumulative excretion of DON and DON-glucuronide when varying some model parameters like body weight, DON absorption and elimination half-life, percentage of non-metabolised DON excretion, DON distribution volume, dietary DON intake, fraction of DON absorbed across the gut wall and urine production. DON is administered once, twice or three times a day (at breakfast, lunch and dinner).
In the Excel file a standard and an actual model are presented. The standard model is a reference model and contains default values that cannot be changed. For the actual model the above-mentioned parame-ters values can be edited be the user.
The output of the standard and the actual model are compared in one figure. These outputs are: 1) concentration-time curves of DON in plas-ma, 2) urinary concentrations of DON after every three hours of sam-pling and 3) respectively 4) cumulative 24-hours excretion of DON and its glucuronides over time as percentage of DON dose.
The graphical presentations are given in figures 1-4.
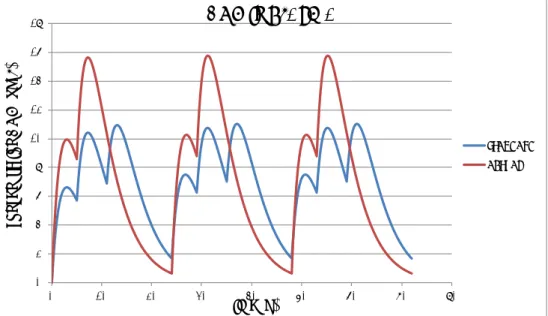
Figure 1. Concentration-time curve of DON in plasma after administration of a fixed dose of DON three times a day (standard scenario; blue line) or two times a day (actual scenario; red line) during three consecutive days.
0 2 4 6 8 10 12 14 16 18 0 10 20 30 40 50 60 70 80 co nc en tr at io n D O N (u g/ L) time (h)
DON in PLASMA
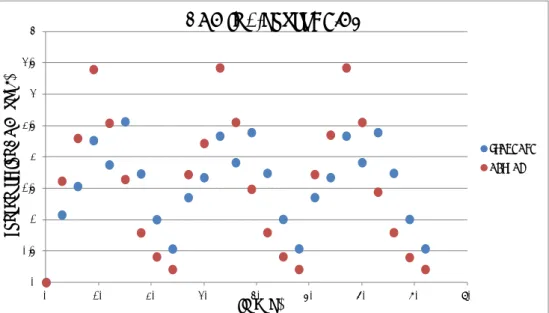
STANDARD ACTUALFigure 2. Urinary concentrations of DON per sampling interval (every 3 hours) after administration of a fixed dose of DON three times a day (standard scenar-io; blue dots) or two times a day (actual scenarscenar-io; red dots) during three con-secutive days.
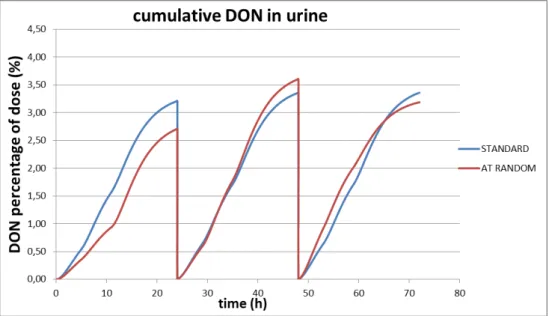
Figure 3. Cumulative excretion of DON in urine after administration of a fixed dose of DON three times a day (standard scenario; blue line) or two times a day (actual scenario; red line) during three consecutive days.
0 0.5 1 1.5 2 2.5 3 3.5 4 0 10 20 30 40 50 60 70 80 co nc en tr at io n D O N (u g/ L) time (h)
DON in 3-hours URINE
STANDARD ACTUAL 0.00 0.50 1.00 1.50 2.00 2.50 3.00 3.50 4.00 0 10 20 30 40 50 60 70 80
DO
N
pe
rc
ent
ag
e
of
do
se
(%
)
time (h)cumulative DON in URINE
STANDARD ACTUAL
Page 16 of 39
Figure 4. Cumulative excretion of DON-glucuronide in urine after administration of a fixed dose of DON three times a day (standard scenario; blue line) or two times a day (actual scenario; red line) during three consecutive days.
The Excel file contains two sheets, both with standard and actual sce-narios. The second sheet “DON-expert” leaves as much freedom as pos-sible to the user with respect to the daily intake scenario, but requires some Excel skills. The first sheet “DON-easy” restricts the freedom, but is easier for the less experienced Excel user. In the “DON-easy” sheet the user can choose for daily intake to be at an actual constant level that is consumed 1, 2 or 3 times a day, or to let it vary randomly be-tween 50% and 150% around an actual mean level. The daily meal scheme is fixed throughout.
The graphical presentations are given in figures 5-8. 0 10 20 30 40 50 60 70 80 0 10 20 30 40 50 60 70 80
DO
N
-g
luc
ur
oni
de
pe
rc
ent
ag
e o
f
do
se
(%
)
time (h)cumulative DON-glucuronide in URINE
STANDARD ACTUAL
Figure 5. Concentration-time curve of DON in plasma after administration of a fixed dose of DON three times a day (standard scenario; blue line) or with a random dose two times a day (actual scenario; red line) during three consecu-tive days. Mean level of the random dose equals the fixed dose of the standard scenario.
Figure 6. Urinary concentrations of DON per sampling interval (every 3 hours) after administration of a fixed dose of DON three times a day (standard scenar-io; blue dots) or a random dose two times a day (actual scenarscenar-io; red dots) dur-ing three consecutive days.
0 2 4 6 8 10 12 14 16 18 0 10 20 30 40 50 60 70 80 co nc en tr at io n D O N (u g/ L) time (h)
DON in plasma
STANDARD ACTUAL 0 0.5 1 1.5 2 2.5 3 3.5 4 0 10 20 30 40 50 60 70 80 co nc en tr at io n D O N (u g/ L) time (h)DON in urine
STANDARD ACTUALPage 18 of 39
Figure 7. Cumulative excretion of DON in urine after administration of a fixed dose of DON three times a day (standard scenario; blue line) or a random dose two times a day (actual scenario; red line) during three consecutive days.
Figure 8. Cumulative excretion of DON-glucuronide in urine after administration of a fixed dose of DON three times a day (standard scenario; blue line) or a ran-dom dose two times a day (actual scenario; red line) during three consecutive days. 0 10 20 30 40 50 60 70 80 0 10 20 30 40 50 60 70 80
DO
N
-g
luc
ur
oni
de
pe
rc
ent
ag
e o
f
do
se
(%
)
time (h)cumulative DON-glucuronide in urine
STANDARD ACTUAL
3
OTA: a model for a slow eliminating mycotoxin
3.1 Introduction
The mycotoxin ochratoxin A (OTA) is a pentaketide produced by fungi belonging to the Aspergillus and Penicillium species. The production of OTA during storage is the most important factor of OTA contamination in food. It has been found in cereals, coffee beans and other plant prod-ucts.
Various studies in pigs and humans have associated OTA with endemic porcine nephropathy and Balkan endemic nephropathy
(Pfohl-Leszkowicz and Manderville, 2007). OTA accumulates in the body, in particular in the kidneys. OTA is teratogenic and the International Agen-cy on Cancer classified OTA in group 2b as possible carcinogen for hu-mans (IARC, 1993).
Based on renal effects observed in a 90-day feeding study in female pigs a tolerable weekly intake (TWI) of 0.12 μg/kg body weight (bw) was derived by EFSA (EFSA, 2006). EFSA applied a composite uncertainty factor of 450 to a LOAEL of 8,000 ng OTA/kg bw per day which would result in a tolerable daily intake (TDI) of 17.8 ng OTA/kg bw per day. Given the relatively long half-life of OTA in humans, EFSA concluded that a tolerable weekly intake would be more appropriate. Therefore, a TWI of 120 ng/kg bw was established. In turn, we used as default value, a tolerable daily dose in our toxicokinetic model of 17.8 ng/kg bw/day.
3.1.1 Toxicokinetics of OTA
Following oral ingestion, OTA is rapidly absorbed and reaches the sys-temic circulation, where it is extensively bound to plasma proteins. In animal studies the extent of absorption varies between 40% in chickens and 66% in pigs (Galtier et al., 1981). In most animal species, the ki-netic behaviour of OTA has been described as a two-compartment open model (Dietrich et al., 2005).
The toxicokinetic profile of OTA was studied in one human volunteer following ingestion of 395 ng 3H-labelled OTA (3.8 μCi) (Studer-Rohr et al., 2000). A two-compartment open model was found to describe the in vivo data. This two-compartment model consisted of a fast elimination and distribution phase (t1/2 about 20 hours) followed by a slow
elimina-tion phase (renal clearance about 0.11 mL/min) and a calculated plasma half-life of 36 days. The major analyte in blood serum is the parent compound, and only small concentrations of OTA metabolites and/or conjugates could be measured (Studer-Rohr et al., 2000). In contrast, analysis of urine samples indicated that only about 50% of the radioac-tivity in the urine was parent OTA, suggesting the presence of OTA me-tabolites (particularly ochratoxin α) and/or OTA glucuronic acid conju-gates. However, in a recent biomonitoring study carried out in Belgium with 394 volunteers no significant amounts of metabolites of OTA were detected in urine (Heyndrickx et al., 2015).
Page 20 of 39
3.2 Toxicokinetic models applied for OTA
3.2.1 Introduction
Based on the publication of Studer-Rohr on the toxicokinetics of OTA in a human volunteer a two-compartment model is developed (Studer-Rohr et al., 2000).
A fraction of dietary OTA intake is absorbed across the gut wall with a finite absorption half-life, so no instantaneous absorption is assumed. OTA is distributed over a central and a peripheral compartment. In this model it is assumed that the metabolism of OTA is negligible and that OTA is only excreted renally. More technical details on this model are found in section 7.2.
3.2.2 Excel calculator for OTA with a fixed dose
A calculator is made in Excel and it is intended for a few exercises to show differences in cumulative excretion of OTA when varying some model parameters like body weight, OTA distribution and elimination half-life, percentage of non-metabolised OTA excretion, distribution vol-ume, dietary OTA intake and urine production. OTA is administered once a day (at breakfast).
In the Excel file a standard and an actual model are presented. The standard model is a reference model and contains default values that cannot be changed. The actual model contains the above-mentioned parameters and their values can be edited be the user.
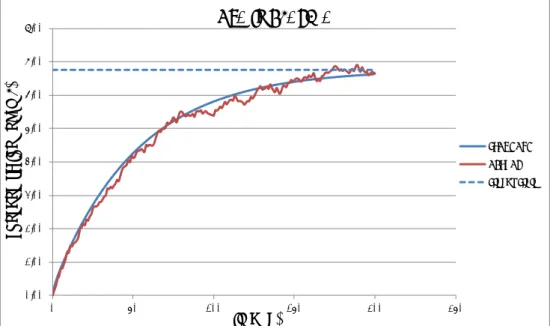
The output of each model is presented in separate graphs. These out-puts are: 1) concentration-time curves of OTA in plasma, 2) urinary concentrations of OTA and 3) cumulative excretion of OTA over time. Some graphical presentations are given in figures 9-12. In the actual curves the daily dose is given as a bolus at the start of the day and in the standard curves the daily dose is spread over 24 hours. In figure 9 the accumulation during the first seven days is depicted because these details are not clearly visible on a time-scale of 200 days (figure 10).
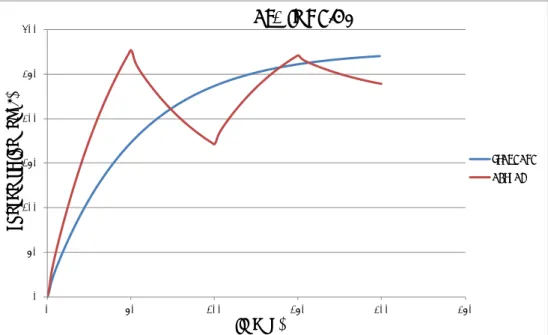
Figure 9. Concentration-time curve of OTA in serum after daily administration of a fixed dose of OTA during seven days. The standard scenario assumes gradual uptake during the whole day and the actual scenario assumes another extreme: instantaneous intake of a bolus dose uptake. The latter clearly shows the daily OTA kinetics.
Figure 10. Concentration-time curve of OTA in plasma after daily administration of a fixed (standard) dose of OTA and a fixed, repetitive dose (changing every 50 days) varying from 50% to 150% of the TDI of OTA during 200 days using the standard default values.
0.00 0.05 0.10 0.15 0.20 0.25 0.30 0.35 0.40 0.45 0.50 0 1 2 3 4 5 6 7 8 co nc enc tr at io n ( ng /m L) time (d)
PLASMA
STANDARD ACTUAL 0.00 1.00 2.00 3.00 4.00 5.00 6.00 7.00 8.00 0 50 100 150 200 250 co nc enc tr at io n ( ng /m L) time (d)OTA in PLASMA
STANDARD ACTUAL Steady StatePage 22 of 39
Figure 11. Urinary concentrations of OTA after daily administration of a fixed dose of OTA and a fixed, repetitive dose (changing every 50 days) varying from 50% to 150% of the TDI of OTA during 200 days using the standard default values.
Figure 12. Cumulative excretion of OTA in urine after daily administration of a fixed (standard) dose of OTA and a fixed, repetitive dose (changing every 50 days) varying from 50% to 150% of the TDI of OTA during 200 days using the standard default values.
The Excel file contains two sheets, both with standard and actual sce-narios. The second sheet “OTA-manual” leaves as much freedom as pos-sible to the user with respect to the daily intake scenario, but requires some Excel skills. The first sheet “OTA-easy” restricts the freedom, but is more easy for the less experienced Excel user: the user can choose
0 50 100 150 200 250 300 0 50 100 150 200 250 co nc ent ra tio n ( ng /L ) time (d)
OTA in URINE
STANDARD ACTUAL 0.0 20.0 40.0 60.0 80.0 100.0 120.0 0 50 100 150 200 250am
ount
(%
do
se
)
time (d)
OTA in CUMULATIVE URINE
STANDARD ACTUAL
for a daily intake to be at an actual fixed level or to let it vary between 50 and 150% around an actual fixed mean level.
The graphical presentations are given in figures 13-15.
Figure 13. Concentration-time curve of OTA after daily administration of a ran-domly selected dose of OTA during 200 days using the standard default values.
Figure 14. Urinary concentrations of OTA after daily administration of a random-ly selected dose of OTA during 200 days using the standard default values.
0.00 1.00 2.00 3.00 4.00 5.00 6.00 7.00 8.00 0 50 100 150 200 250 co nc enc tr at io n ( ng /m L) time (d)
OTA in PLASMA
STANDARD ACTUAL Steady State 0 50 100 150 200 250 300 0 50 100 150 200 250co
nc
ent
ra
tio
n (
ng
/L
)
time (d)
OTA in URINE
STANDARD ACTUALPage 24 of 39
Figure 15. Cumulative excretion of OTA in urine after daily administration of a randomly selected dose of OTA during 200 days using the standard default val-ues. 0.0 10.0 20.0 30.0 40.0 50.0 60.0 70.0 80.0 90.0 0 50 100 150 200 250
am
ount
(%
do
se
)
time (d)
OTA in CUMULATIVE URINE
STANDARD ACTUAL
4
Conclusions and discussion
Based on the toxicokinetic models presented in this report, the following items will be discussed:
1. the feasibility of estimating the dietary mycotoxin uptake of DON and OTA by determining renal mycotoxin excretion
2. the various methods for urine collection with respect to their ap-plicability to estimate the dietary intake of DON and OTA. 3. The practical use of the applied models in the Excel calculator. 4.1 DON
The fast elimination of DON (elimination half-life of 3 hours, default val-ue) results in an almost complete excretion of the dose in 24 hours when applying a fixed dose (see figure 1). During the first day of con-sumption there is a small difference in the percentage of dose excreted between two or three times a day ingestion of DON (see figure 3). After three days of consumption this small difference hasn’t changed between the different dosage regimens. The same is true for the excretion of DON-glucuronide (see figure 4). Therefore, a quantitative collection of urine during 24 hours should give a good estimate of the DON intake during that particular dosing day. Due to the fast elimination of DON and its glucuronide(s) no conclusions can be drawn regarding the dietary daily DON intake over a longer period (it’s a snapshot and in a way this is comparable to the dietary intake determined with a duplicate diet study).
Collection of spot urine (a sample of urine taken at any time of the day) will give a large variation in urinary concentrations of DON and its glucu-ronide(s), depending of the time of collection in relation to time of in-take and individual variation (see figure 2). The obtained urinary bi-omarker concentrations can be normalized in function of the creatinine content to correct for variable dilutions (Turner et al., 2010; EFSA, 2015b). However, as Heyndrickx pointed out, the use of creatinine-adjusted biomarker concentrations in order to accurately compare expo-sures among volunteers remains a subject of research (Heyndrickx, 2015). Alternatively, estimating the daily excretion of DON and its glu-curonides by correcting for daily urine production may over- or underes-timate the dietary DON intake. A sample of morning urine most likely will result in lower urinary levels (depending on time and size of the last dose) when compared to spot urine. In the event of lower but detectable urinary levels it may result in a smaller variation in the urinary
bi-omarker concentrations when compared to spot urine. As is the case for spot urine, biomarker concentrations in morning urine need to be cor-rected (somehow) for variable dilutions.
Obviously, a random dose shows a greater fluctuation in the excretion of DON and its glucuronide when compared to a fixed dose. Nevertheless, after three days of consumption, a quantitative collection of urine during 24 hours is still the best option for a reasonable estimate of the dietary DON intake for that day. This option has also been recommended by a group of researchers who conducted an experimental study for the ac-count of EFSA (EFSA, 2015b). The random dose gives an insight in the
Page 26 of 39
extent of the (theoretical) uncertainty of the estimate of the dietary DON uptake.
4.2 OTA
The slow elimination of OTA (elimination half-life of 36 days, default val-ue) results in accumulation of OTA in the human body when ingested daily (see figures 9 and 10). This accumulation continuous for several months and after approximately 180 days a plateau is reached (see fig-ure 10, standard dose). This plateau is characteristic of a so-called ‘steady state’ situation which means that the overall intake of a sub-stance is (fairly) in dynamic equilibrium with its elimination. In practice, it is generally considered that steady state is reached after 4 to 5 times the elimination half-life for a substance after regular dosing is started. This also means that the total amount of OTA excreted during 24 hours is constant whenever this plateau is reached (see figure 11, standard dose). Obviously, after dosing there still will be some fluctuation in uri-nary biomarker concentrations. This can be seen in figure 10, where the dose was varied manually from 50% to 150% of the TDI of OTA. There-fore, at steady state and assuming a fixed dose, quantitative collection of urine during 24 hours should give a good estimate of the OTA intake. However, whenever the dose is randomly varied from 0.5 to 1.5 times the TDI of OTA, the estimated percentage of the dose may vary from 2 (inverse of 0.5) to 0.67 (inverse of 1.5) times the average percentage of the dose excreted (see figure 15). The practical value of a (fairly) con-stant daily intake during months is rather limited. An example for such a situation would be e.g. the daily consumption of contaminated coffee which (in many cases) could lead to a fairly constant intake.
Collection of spot urine at steady state will give a smaller variation in urinary concentrations of OTA when compared to DON. It will also be less influenced by the time of collection but individual variations will still occur. As applies for DON, the obtained urinary biomarker concentra-tions can be normalized in function of the creatinine content to correct for variable dilutions. Again, estimating the daily excretion of OTA by correcting for daily urine production may over- or underestimate the dietary OTA intake. A sample of morning urine at steady state may re-sult in lower urinary levels (depending on time and size of the last dose) when compared to spot urine but in practice this difference may be very small. As is the case for spot urine, biomarker concentrations in morning urine need to be corrected (somehow) for variable dilutions. The further a consumer is away from this steady state, i.e. exposed during a short period, the more the calculation of the dietary intake, based on renal excretion, will lead to an underestimation.
Obviously, a variable dose shows a greater fluctuation in the renal ex-cretion of OTA when compared to the fixed dose. At steady state, this fluctuation in urinary OTA concentration is not largely affected when a single day of OTA ingestion is close to zero (see figure 14). In general, at steady state, a quantitative collection of urine during 24 hours is still the best option for a reasonable estimate of the dietary OTA intake. However, the difference between 24-hour urine, spot or morning urine could in practice be small. In that case, because of time, budgetary and compliance reasons spot or morning urine may be preferred.
Again, a randomly chosen dose gives an insight in the extent of the (theoretical) uncertainty of the estimate of the dietary OTA uptake.
4.3 Summary and recommendation
The developed models help to interpret how dietary mycotoxin intake is related to mycotoxin levels in urine. The calculator is a tool that can be used by people who are not familiar with toxicokinetic models and it is useful to visualise the above-mentioned relationship.
In case of DON, a quantitative collection of urine during 24 hours is the best option for a good estimate of the dietary DON intake. The frequen-cy and duration of the DON intake is not very important.
In case of OTA, any kind or urine collection can be used whenever the duration of exposure is long enough (several months) and the daily dose is fairly constant. The frequency of OTA intake is not really important as long as intake is not discontinued for several days. Because of time, budgetary and compliance reasons, spot or morning urine may be pre-ferred.
Whereas for OTA there is toxicokinetic evidence from a human study to support the presented model, this is not the case for DON. Therefore, it is recommended to study the renal excretion of DON in human volun-teers to validate the assumed model for DON. This can simply be done by administering a single dose of DON to volunteers and collect urine quantitatively at different time intervals during 24 hours after admin-istration.
5
References
Bakker, G.J.I., Schothorst, R.C., Jekel, A.A., Sizoo, E.A., Pereboom, D. and van Egmond, H.P. 2009. Determination of mean daily intakes of aflatoxin B1, aflatoxin M1, ochratoxin A, fumonisins and trichothe-cenes in 24-hour diets of children in the Netherlands. World Mycotox-in Journal 2:451-459.
Boon, P.E., Bakker, M.I., Klaveren, J.D.v. and Rossum, C.T.M.v., 2009. Risk assessment of the dietary exposure to contaminants and pesti-cide residues in young children in the Netherlands, National Institute for Public Health and the Environment (RIVM). RIVM Report
350070002/2009. Available at www.rivm.nl.
Dietrich, D.R., Heussner, A.H. and O’Brien, E. 2005. Ochratoxin A: Com-parative pharmacokinetics and toxicological implications (experi-mental and domestic animals and humans). Food Add Contam 22(1): 45-52.
EFSA, 2006. Opinion of the scientific panel on contaminants in the food chain on a request from the Commission related to Ochratoxin A in food. The EFSA Journal (2006) 365, 1 – 56.
EFSA, 2013. Deoxynivalenol in food and feed: occurrence and exposure. EFSA journal 11 (10):3379, 1-56.
EFSA, 2015a. External scientific report. Review of the state of the art of human biomonitoring for chemical substances and its application to human exposure assessment for food safety. EFSA supporting publi-cation 2015:EN-724, 321 pp.
EFSA, 2015b. External scientific report. Experimental study of deoxyni-valenol biomarkers in urine. EFSA supporting publication 2015:EN-818, 136 pp.
Galtier, P., Alvinerie, M. and Charpenteau, J.L. 1981. The pharmacoki-netic profiles of ochratoxin A in pigs, rabbits and chickens. Food Cos-met Toxicol 19(6): 735-8.
Heyndrickx, E., 2015. Thesis: Human biomonitoring of mycotoxin expo-sure through biomarker analysis, 212 pp. Faculty of Pharmaceutical Sciences. Gent, Belgium.
Heyndrickx, E., Sioen, I., Huybrechts, B., Callebaut, A., De Henauw, S. and De Saeger, S. 2015. Human biomonitoring of multiple mycotox-ins in the Belgian population: Results of the BIOMYCO study. Env Int 84: 82-89.
IARC, 1993. Ochratoxin A (Group 2B). IARC Monographs 56:489-490
Page 30 of 39
Jekel, A.A. and van Egmond, H.P., 2014. Determination of T-2/HT-2 tox-ins in duplicate diet studies in the Netherlands by GC-MS/MS: method development and estimation of human exposure. World Mycotoxin Journal 7: 267-276.
Joint FAO/WHO Expert Committee on Food Additives (JECFA), 2010. Evaluation of certain contaminants in food: seventy-second report of the Joint FAO/WHO Expert Committee on Food Additives. WHO Tech-nical Report Series no. 959. WHO, Geneva, Switzerland.
Maresca, M., 2013. From the gut to the brain: journey and pathophysio-logical effects of the food-associated trichothecene mycotoxin deox-ynivalenol. Toxins 5: 784-820.
Marroquín-Cardona, A.G., Johnson, N.M., Phillips, T.D. and Hayes, A.W. 2014. Mycotoxins in a changing global environment – a review. Food and Chemical Toxicology 69: 220-230.
Pfohl-Leszkowicz, A. and Manderville, R.A., 2007. Ochratoxin A: An overview on toxicity and carcinogenicity in animals and humans. Mo-lecular Nutrition & Food Research 51, 61-99.
Scientific Committee on Food (SCF), 2002. Opinion of the Scientific Committee on Food on Fusarium toxins. Part 6: Group evaluation of T-2 toxin, HT-2 toxin, nivalenol and deoxynivalenol. Available at:
http://tinyurl.com/naoahrv.
Sprong, R.C., de Wit-Bos, L., te Biesebeek, J.D., Alewijn, M., Lopez, P. and Mengelers, M.J.B. 2015 (in press). A mycotoxin-dedicated total diet study in The Netherlands in 2013: Part III – exposure and risk assessment. pp 1-20. Published online 31 augustus 2015. DOI:
http://dx.doi.org/10.3920/WMJ2015.1905.
Studer-Rohr, I., Schlatter, J. and Dietrich, D.R. 2002. Kinetic parame-ters and intraindividual fluctuations of ochratoxin A plasma levels in humans. Archives of Toxicology 74: 499-510.
Turner, P.C., White, K.L.M., Burley, V.J., Hopton, R.P., Rajendram, A., Fisher, J., Cade, J.E. and Wild, C.P. 2010. A comparison of deoxyni-valenol intake and urinary deoxynideoxyni-valenol in UK adults. Biomarkers 15, 553-562.
Warth, B., Sulyok, M., Berthiller, F., Schuhmacher, R. and Krska, R. 2013. New insights into the human metabolism of the Fusarium my-cotoxins deoxynivalenol and zearalenone. Toxicology Letters 220, 88-94.
6
Acknowledgements
The authors would like to thank B. Tiesjema and M.J. Zeilmaker for criti-cally reviewing this report.
7
Technical explanations of the toxicokinetic models
The technical details of the applied Excel calculator and the toxicokinetic models for DON and OTA are given in section 7.1 (DON) and 7.2 (OTA). 7.1 Excel calculator and toxicokinetic model for DON
7.1.1 Excel calculator for DON
The Excel sheet for DON is called: DON in Human Urine Calculator (DONHumUriCal).
PROBLEM:
Human food products and beverages contain, at least background levels of deoxynivalenol.
QUESTION:
Given the dietary intake of DON, what are the corresponding levels in urine.
TOXICOKINETIC MODEL:
A fraction of dietary DON intake is taken up across the gut wall with a finite absorption half-life, so no instantaneous absorption is assumed. Distribution of DON is assumed to be fast with re-spect to absorption, metabolism and excretion kinetics and con-sequently the human body is considered as one compartment. In this model it is assumed that DON is only metabolised through glucuronidation. Furthermore it is assumed that (a fraction of) non-metabolised DON and DON-glucuronide are only excreted renally.
DONHumUriCal EXCEL Sheet:
The calculator is intended for a few exercises to show differences in cu-mulative excretion of DON and DON-glucuronide when varying some model parameters like body weight, DON absorption and elimination half-life, percentage of non-metabolised DON excretion, DON distribu-tion volume, dietary DON intake, fracdistribu-tion of DON absorbed across the gut wall and urine production (green fields). A standard model is pre-sented of which parameters (standard values; yellow fields) cannot be changed. To compare, actual values can be accessed, but some of the model parameter values are the result of calculations with "green fields" parameters that have been input. These resulting values (blue fields) cannot be accessed, too. Resulting concentration-time curves of
concen-fractional die-tary DON
ab-sorption renal excretion of DON renal excretion of DON-glucuronide DON distribution, metabolism, ex-cretion
Page 34 of 39
trations in serum and, most important, urine are shown graphically for standard and actual values.
DON is administered once, twice or three times a day (7:00, 12:00 and 18:00 hours) and administration cannot be changed by the user(s). Explanation of model parameters
Parameters that can be edited by the user:
• Human body weight (kg): standard value for an adult is given: 74 kg.
• DON absorption half-life (h): half-life for absorption is assumed to be shorter than for elimination. Standard value for absorption is set at half the value for elimination.
• DON elimination half-life (h): half-life for elimination is assumed to be longer than for absorption. Standard value for elimination is set at double the value for absorption.
• Percentage DON renal excretion (%): this is the percentage of the amount of DON excreted unchanged in the urine. The default value is set at 5%. As a consequence, 95% is glucuronidated. • DON distribution volume (L/kg bw): the distribution volume (Vd)
of DON is assumed to be higher than the total body water (com-parable to the Vd of DON in pigs). The default value is set at 1.3 L/kg bw.
• Total daily DON intake (µg/kg body weight): The default value is set at the TDI: 1 µg/kg bw/day.
• DON-easy sheet only: fixed dose value: if =1, then the dose is fixed to the value chosen above; if =0, then the dose is randomly chosen with an average equal to the value chosen above and varying uniformly between 50% and 150% of that mean value. • DON-easy sheet only: number of meals per day containing DON
(1, 2 or 3)
• Fraction DON absorbed (%): equivalent of the bioavailability. De-fault value is set at 70%.
• Urine volume voided (L/3 hours): the default value is set at 200 mL and is based on an average daily urine production of 1.6 L for an adult.
Parameters that are fixed or derived from editable parameters:
• DON absorption rate (/h): is calculated from the absorption half-life.
• DON total elimination rate (/h): is calculated from the elimination half-life. The total elimination rate is the sum of the renal and the metabolic rate of DON.
• DON renal excretion rate (/h): is set at 5% of the DON total elim-ination rate.
• DON glucuronidation rate (/h): is set at 95% of the DON total elimination rate.
• Total daily DON intake (µg): calculated from total daily dietary DON per kilogram body weight and human body weight. • Total daily DON absorbed (µg): calculated from the total daily
DON intake and the fraction DON absorbed.
• Meals: The total daily DON absorbed is evenly divided over three meals. These meals are consumed at three time points: 7:00, 12:00 and 18:00 hours (0, 5 and 11 hours and time with respect to first daily intake).
• Urine sampling interval (h): the default value is set at a theoreti-cal value of 3 hours. Obviously this is not true during night rest.
• Parameter assumption:
• It is assumed that renal excretion of DON-glucuronide is fast with respect to DON absorption and elimination: it is not an explicitly defined model parameter.
7.1.2 DON model implementation
Consider the mono-exponential kinetics of a substance:
( )
dA F D t kA
dt
= ⋅
−
where A denotes the amount of substance, k the exponential rate of elimination, F the fraction of dose absorbed and D the time dependent dosing regimen. In the following three cases of the last will be consid-ered: instantaneous uptake of the total dose applied, e.g. when absorp-tion kinetics is fast as compared to eliminaabsorp-tion kinetics, constant uptake of the total dose applied during the day, e.g. when there is no clear time point associated with oral intake, and, in between those two, finite ki-netics uptake.
Most often, the kinetic problem described above is solved from time
0
t =
onwards, but in this case, the problem will be considered from some time t onwards which is typically a time point at which the daily (or whatever the time unit) dose changes. It is assumed that there will be no change during a time interval∆
t
, so during this interval(
)
(
)
(
), 0
,
( ) given
dA t
F D t
kA t
t A t
dt
τ
τ
τ
τ
+
= ⋅
+ −
+
≤ < ∆
The analytical solution to this problem is standard.
In case of instantaneous absorption, the solution is given by
(
)
(
)
k( )
( ) , 0
A t
+ =
τ
e
−τA t FD t
+
≤ < ∆
τ
t
Note that at the time point t, caused by instantaneous absorption, the amount of substance jumps discontinually from
A t
( )
toA t FD t
( )
+
( )
.In case constant uptake of the total dose, the solution is given by
(
)
(
)
( )
( )
(
)
k( )
FD t
k1
( )
kFD t
1
k, 0
A t
e
A t
e
A t e
e
t
k
k
τ τ τ ττ
−
− −τ
+ =
+
−
=
+
−
≤ < ∆
and from time point t onwards the amount is gradually rising until, if the time interval
∆
t
would be large enough, a steady value would bereached.
In case of finite kinetics uptake the analytical approach has to be a little bit more subtle to account for the case that the interval
∆
t
is not suffi-ciently long to deplete the total amount of substance that was taken in and there is still a non-negligible amount left into the gut. Note that forPage 36 of 39
the finite uptake kinecs model it is tacitly assumed that the total amount of substance taken in enters the gastro-intestinal tract as a bolus and from that tract is taken up. So, trace should be kept of the amount of substance still left into the gastro-intestinal tract. This amount is denot-ed by G and actually denotes the amount that will be taken up in due course. The analytical solution to the gastrointestinal sub-model is simp-ly
(
)
(
)
ka( )
( )
G t
+ =
τ
e
− τG t FD t
+
where
k
ais the finite exponential rate of absorption. With this quantity,the solution to the kinetic model is
(
)
(
)
(
)
( )
k a( )
( )
ka k ak
A t
A t e
G t FD t e
e
k k
τ τ ττ
− − −+ =
+
+
−
−
Note that the approach outlined above gives completely freedom for the interval lengths
∆
t
, which may vary from interval to interval, and for the intra-interval time points to output the solution. Also note that in case of instantaneous absorption, for pictural reason, it would be prefer-able to output both the valuesA t
( )
andA t FD t
( )
+
( )
at the time point of oral intake. The approach lends itself most conveniently to the imple-mentation in Excel-sheets.7.2 Excel calculator and toxicokinetic model for OTA
7.2.1 Excel calculator or OTA
The Excel sheet for OTA is called: OTA in Human Urine Calculator (OTA-HumUriCal).
PROBLEM:
Human food products and beverages contain, at least background levels of ochratoxin A.
QUESTION:
Given the dietary intake of OTA, what are the corresponding levels in urine.
TOXICOKINETIC MODEL: fractional dietary
OTA absorption
renal excretion of OTA Central compart-ment: OTA distribution Peripheral compart-ment: OTA distribution
A fraction of dietary OTA intake is taken up across the gut wall into the central compartment. Distribution of OTA occurs between this and a pe-ripheral compartment. It is assumed that OTA is, metabolized or not, excreted renally.
OTAHumUriCal EXCEL SHEET:
The calculator is intended for a few exercises to show differences in cu-mulative excretion of OTA and possible metabolites when varying some model parameters like body weight, elimination half-life, OTA distribu-tion volume, dietary OTA intake, fracdistribu-tion of OTA absorbed across the gut wall and urine production (green fields). A standard model is presented of which parameters (standard values; yellow fields) cannot be changed. To compare, actual values can be accessed, but some of the model pa-rameter values are the result of calculations with "green fields" parame-ters that have been input. These resulting values (blue fields) cannot be accessed, too. Resulting concentration-time curves of concentrations in plasma and, most important, urine are shown graphically for standard and actual values.
Explanation of model parameters Parameters that can be edited by the user:
• Human body weight (kg): standard value for an adult is given: 62 kg.
• OTA distribution half-life (h): half-life for distribution between the compartments.
• OTA initial distribution volume (L): distribution volume of the central compartment.
• OTA elimination half-life (h): half-life for elimination is assumed to be longer than for distribution.
• OTA distribution volume (L): distribution volume of the terminal elimination phase.
• Fraction OTA absorbed (%): equivalent of the bioavailability. De-fault value is set at 70%.
• OTA-easy sheet only: fixed dose value: if =1, then the dose is fixed to the value chosen above; if =0, then the dose is randomly chosen with an average equal to the value chosen above and varying uniformly between 50% and 150% of that mean value. • Daily OTA intake (µg/kg body weight): mean or fixed value • Urine volume voided (L/days): the default value is set at 1.6 L for
an adult.
• Percentage of OTA excreted: standard set at 50%. Parameters that are fixed or derived from editable parameters:
• Distribution phase exponential rate: log(2)/absorption half-live. • Elimination phase exponential rate: log(2)/elimination half-live. • Transfer rate from central to peripheral compartment.
• Transfer rate from peripheral to central compartment. • Rate of elimination from the central compartment.
Page 38 of 39
7.2.2 OTA model implementation
Consider the bi-exponential kinetics of a substance:
(
)
( )
0
c c e p c p c p pA
FD t
k k
k
A
d
A
k
k
A
dt
−
+
=
−
−
where
A
c,A
pdenote the amounts of substance in the central andperiph-eral compartments,
k
eis the exponential rate of elimination from thecentral compartment,
k
c the exponential rate of transfer from the cen-tral to the peripheral compartment,k
p the exponential rate of transferfrom the peripheral to the central compartment, F the fraction of dose absorbed and D the time dependent dosing regimen that enters the cen-tral compartment. Also here, three cases of the last will be considered: instantaneous uptake of the total dose applied, e.g. when absorption kinetics is fast as compared to elimination kinetics, constant uptake of the total dose applied during the day, e.g. when there is no clear time point associated with oral intake, and, in between those two, finite ki-netics uptake.
Instead of 1 function of time A a vector function of time is in order as well as a 2 × 2 matrix K instead of a constant k. Also this case has standard solutions with exponents, but to this the matrix K has to be written as the product of matrices
1
K
= − Λ
S S
− where(
)
(
)
2 1 1 2 2 1 2 24
0
,
,
0
4
c e p c e p e p p p c e c e c e p c e p e pk k k
k k k
k k
k
k
S
k k
k k
k k k
k k k
k k
λ
λ
λ
λ
λ
λ
= + + −
+ +
−
Λ =
=
+ +
+ +
= + + +
+ +
−
are the diagonal matrix of eigenvalues, the matrix of eigenvectors and 1
,
2λ λ
the two eigenvalues expressed in terms of the kinetic model’s pa-rameters. For the diagonal matrixΛ
, its exponentiation is1 2
0
exp(
)
0
e
e
λ τ λ ττ
− −
− Λ =
After these preliminaries, the solution to the kinetic problem proceeds as above.
In case of instantaneous absorption, the solution is given by
(
)
1( )
(
)
exp
( )
, 0
0
c c p pA
A
FD t
t
S
S
t
t
A
τ
τ
−A
τ
+ =
− Λ
+
≤ < ∆
Note that at the time point t, caused by instantaneous absorption, the amount of substance in the central compartment jumps discontinually
from
A t
c( )
toA t FD t
c( )
+
( )
. Also note that, even if interest is only in theamount in the central compartment, trace should be kept of the amount in the peripheral compartment as well.
In case constant uptake of the total dose, the solution is given by
(
)
1 1(
( )
)
1( )
(
)
exp
( )
exp
0
c c p pA
A
FD t
t
S
S
t
I S
A
τ
τ
−A
−τ
−
+ =
− Λ
+ Λ
Λ −
In case of the finite kinetics absorption model, the solution is