www.quickprinter.be
Q
176
5,50 €
3de bach TEW
powerpoints + lesnotities
uickprinter
Koningstraat 13
2000 Antwerpen
Economic Policy
Economic policy
1
Chapter 1: Concepts and limits of Economic Policy
Introduction
Definition of economic policy (not in question)
Economic policy is an action of a policymaker to influence the economy. It is an action to realize stability, allocation of goods and services and distribution.
Explanation for the three alternative approaches to Economic Policy
1. Positive economy:
• Definition: It’s an analysis that try to explain how an economic system works or try to predict how an economic system will change (evolve) in time.
• Instruments: exogenous so you use a fixed instrument. For example, fixed taxes. When you change something and then we look what is the effect on something else.
2. Normative economy:
• Definition: It’s an analysis that search for the best way to choose between different policy plans.
• Instruments: endogenous so you use specific instruments to achieve a fixed target. The targets are set by the policymaker and the instruments to achieve this target are given by the economy.
• Role of the economist: the economist is an adviser for the policymaker for making the targets that needs to be achieved.
• The theme: take in account the social utility
3. Political economy:
• Definition: it’s an analysis that search for the best way to choose between different policy regimes. The act of the government.
• Instruments: endogenous instruments so you use a variable instrument. • The theme: Maximalization of the utility
The definition of policymakers with their function and examples. (not in questions)
1. Definition
A policymaker is a person who makes policies
2. Function:
• Policymaker set an enforce the rules of the economic game (tax and spend) • Issue and manage currencies
• Produce goods and services • Fix problems (or pretend to) • Negotiate one with each other
3. Example:
• G8 (2012): Barroso (It), Medvedev (Rus), Naoto (Jap), Harper (Canada), Hollande (Fr), Obama (USA), Merkel (Dui) Cameron (UK), Van Rompuy (EU)/ Central bank
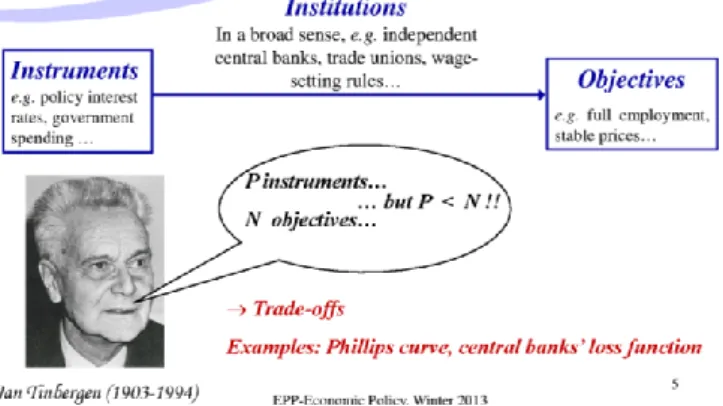
2 Explanation of the general Framework by Jan Tinbergen and the Tinbergen Rule
1. The general Framework
• There is a relation between the instruments that are used to achieve the targets. The instruments have an influence on the targets. Between the instruments and the targets are the institutions. The institutions use a specific group of instruments to achieve a specific target. The institutions use only these instruments that are important for achieving the target.
• !! The Brexit is a big change in institutions!!
2. The Tinbergen Rule: There is a trade-off between the instruments and the objectives.
• Rule (P = N): We have P instruments that we can use to achieve N objectives or targets. You need to have just as much instruments as targets, so you use every instrument to achieve a target. Then and only then you can achieve every target by using every instrument. The number of instruments needs to be equal to the
number of objectives.
• P > N: When you have more instruments than objectives. Then there is a overspill of instruments.
• P < N: When there are less instruments then objectives, you need to make a choice between witch objectives you want to achieve and which not. You can’t achieve every objective because you can’t use one instrument twice. Then there is a trade-off between to objectives.
• Ex. Phillip curve: a trade-off between employment and inflation with only one instrument, namely the interest rate.
Graphic example of a trade-off
This is a general example of a trade-off: you got two objectives (1 and 2). In this case there is a negative relation between objective 1 and objective 2. So that means:” if
you want more of objective 1, you will have less of objective 2.”
3 Graphs that are not in the questions
This graph shows a trade-off between employment and productivity in 2005. There are some indications for a negative relation between these two objectives. So that means: “When you want
more employment, you will have less productivity”
and vice versa.
But Norway prefers a higher employment combined with a higher productivity.
At first sight there seems to be a negative trade-off but there are some exceptions! You can fight the
trade-off with the right instruments.
In the beginning there was a central plan economy which is reformed to a capital economy. This graph gives the impact on the GDP caused by a transition in the economy. For some countries, we can see that the GDP dropped but followed by a increase in GDP. The result of the transition was a much higher output in long term.
85
Theories
What causes unemployment according to the neoclassical view. Use a graph to clarify your answer. How according to the neoclassical economists can unemployment be reduced? 5
1. Definition
Neoclassical unemployment occurs when real wages are kept above the market clearing wage rate, leading to a surplus of labor supplied. Neoclassical unemployment is sometimes known as real wage unemployment because it refers to real wages being too high.
2. Graph
▪ Real wage: the price of labor.
▪ Demand of labor: the business, negative slope because when the real wage is high firms will prefer capital and no labor.
▪ Supply of labor: positive slope because the consumer between the choice leisure and consumption goods (real wages go up they work more and less leisure)
3. Causes of neoclassical view
• Powerful trade unions which bargain for wages above the equilibrium. • Minimum wages that create a legal minimum for wages.
• Deflation and ‘sticky wages’. Deflation is a period of falling prices. If there are falling prices, to maintain full employment, it may be necessary to cut wages. However, workers and firms often avoid nominal wage cuts – for the psychological cost. Therefore, during a period of deflation, classical unemployment is more likely to occur
• Neoclassical economists stress the importance of this type of unemployment. They argue that if wages were more flexible, then most unemployment could be solved.
4. Way to reduce the unemployment
By lowering the labor cost, the labor cost is to high and that cause the unemployment.
86 Same for the Keynesian view (no graph needed here). 6
1. Definition
Cyclical or Keynesian unemployment, also known as deficient-demand unemployment, occurs when there is not enough aggregate demand in the economy to provide jobs for everyone who wants to work. Demand for most goods and services falls, less production is needed and consequently fewer workers are needed, wages are sticky and do not fall to meet the equilibrium level, and mass unemployment results.
2. Causes Keynesian unemployment (the demand side)
A drop-in consumption
3. Way to reduce the unemployment
Resolvable by government intervention.
One suggested intervention involves deficit spending to boost employment and demand.
Another intervention involves an expansionary monetary policy that increases the demand of money which should reduce interest rates which should lead to an increase in non-governmental spending.
What is the tax wedge? Give an example. How is unemployment related to the tax wedge?
1. Definition tax wedge
The difference between the total labor cost and the net wages.
2. Relation between tax wedge and unemployment
The relation between labor taxes and the unemployment rate (right). You would expect that higher wage tax implies a higher unemployment rate, but is that true? There is a positive relationship between the two and that is an argument for institution (IMF) to lower the wage wedge. The relationship between the two isn’t very strong because of a lot of outsiders.
87 Same for unemployment benefits. How are unemployment benefits related to the tax wedge?
Unemployment benefits than can contribute to a wage level that is above the wage level on the labor market equilibrium.
There is made a distinction between benefits of one year and five-year average (red). What you see is that unemployment benefits are relatively high and then you see that the second bare the red one is almost as high then the first, normally you will expect a decline of the red bars (Belgium). The relevance today is with the summer agreement, with the labor deal, the policy is to increase the unemployment benefits to increase for the first 6 months and then sharply decrease the unemployment benefits.
What do economists mean by labor market institutions? Give some examples. How can labor market institutions contribute to a high/ low degree of unemployment?
1. The meaning of labor market institutions
Labor market institutions are institutions that regulate the labor market. That means that the have an influence on the working of the labor market. They make the rules that are active on the labor market, so the labor market is very strictly regulated and controlled by them.
2. Examples of labor market institutions
▪ The minimum wages ▪ Powerful trade unions
▪ Unemployment benefits system ▪ Labor cost
▪ The employment protection ▪ …
3. The contribution of labor market institutions to a high/ Low degree of unemployment
▪ A high minimum wage can prevent the labor market of clearing. More unemployed workers by the low skilled.
▪ A powerful trade union want to have high wages and will protect the people that work. They do not care about the people that are unemployed. That means that unemployed is high.
▪ The employment protection needs to make sure there are less discharges so that people have longer one job. This will create a low degree of unemployment.
88 What is the NAIRU? Illustrate with a Philips curve graph. What determines the NAIRU: explain using a model (model consists of 2 equations and the long-run solution). Define all variables and parameters. What are according to the model the main reasons for unemployment? (not in questions)
1. Definition Non-Accelerating Inflation Rate of Unemployment, NAIRU
Non-Accelerating Inflation Rate of Unemployment (NAIRU) is the unemployment rate consistent with maintaining stable inflation. According to the standard macroeconomic theory, inflation will tend to rise if the unemployment rate falls below the natural rate. Conversely, when the unemployment rate rises above the natural rate, inflation tends to fall. Thus, the natural rate and the NAIRU are often viewed as two names for the same thing, providing an important benchmark for gauging the state of the business cycle, the outlook for future inflation, and the appropriate stance of monetary policy.
2. Graph
3. Explanation model
We start with the Phillips curve that can be defined by: ∆𝑊 = 𝜙(𝐿)∆𝑃 + 𝑎 − 𝑏𝑢 With:
- W: the difference in nominal wage - (L): ???
- P: the difference in real/nominal price levels - a: the real wage dynamics
- b: the real wage flexibility - u: the unemployment rate
The difference of the price level is the same as the marginal cost, so that means that: ∆𝑃 = ∆𝑊 − ∆𝜋
With:
- : the productivity
You have two solutions to find the natural rate of unemployment, NAIRU. (a) The long-term solution
𝑢∗=(𝑎−∆𝜋)
𝑏
(b) The short-term solution ∆𝑃 = 𝜙(𝐿)Δ𝑃 − 𝑏(𝑢 − 𝑢∗)
With u*: NAIRU, In the short term there is some relation between employment and inflation in the longer term is often absent.
89
4. The main reasons for unemployment
The concept of the NAIRU carries over from natural rate theory the ideas that the causes of unemployment lie within the labor market and that the labor market poses the ultimate constraint on the economy’s productive capacity (or, in other word, that the inflation barrier is rooted in the labor market). The phrase itself non-accelerating inflation implies an inflation barrier to full employment. Inflation would quickly accelerate if actual unemployment fell below the inflation barrier posed by the NAIRU.
5. Different policies
▪ Structural policy is lowering u*
o By an act on productivity (), real wage dynamics (a) and the real wage flexibility (b)
o But not a clear micro foundation for a and b ▪ Stabilization policy is moving u closer u*
o u > u* P < (L)P: expansionary policy o u < u* P > (L)P: restrictive policy Explain the Beveridge curve. 7 (not in questions)
1. Definition
The Beveridge curve was developed in the mid twentieth century in order to depict the relationship between job vacancies and unemployment. The Beveridge curve is drawn to the following specifications:
▪ The horizontal axis shows the unemployment rate (as typically defined).
▪ The vertical axis shows the job vacancy rate, which is the number of job vacancies as a proportion or percentage of the labor force. (In other words, the job vacancy rate is the number of empty jobs divided by the labor force and possibly multiplied by 100 percent, and the labor force is defined in the same way as it is in the unemployment rate.)
2. Graph
In most cases, the Beveridge curve slopes downward and is bowed toward the origin, as shown in the diagram above. The logic for the downward slops is that, when there are a lot of unfilled jobs, unemployment must be relatively low or otherwise the unemployed people would go work in the empty jobs. Similarly, it stands to reason that job openings must be low if unemployment is high.
90 Same for the wage-setting (WS) – price setting (PS) model of unemployment. (not in questions)
1. Definition WS-PS model
The natural rate of unemployment is the unemployment rate such that the real wage chosen in wage setting is equal to the real wage implied by price setting.
2. Graph
3. Explanation model
We have to different curves: - The price setting curve (PS)
𝑃 − 𝑊𝑎 = 𝛽0− 𝛽1𝑢 With:
o P: the price level
o Wa: the average nominal wage level
o 𝛽0: ?? o 𝛽1𝑢:???
o 𝑢: the unemployment rate - The wage setting curve (WS)
𝑊 − 𝑃𝑎 = 𝛾0− 𝛾1𝑢 With:
o W: the nominal wage level o Pa: the average price level
o 𝛾0:??? o 𝛾1𝑢:??
o 𝑢: the unemployment rate
4. The main reasons for unemployment
▪ Labor market regulations ▪ Product market regulations
▪ Unemployment benefits, participation to unions ▪ Tax wedges, minimum wages
5. Micro foundation
▪ PS: monopolistic competition