National Institute for Public Health and the Environment
Refined exposure assessment of smoke
flavouring primary products with use
levels provided by the industry.
A pilot study into data collection of use
levels
RIVM Letter report 320026003 R.C. Sprong
Colophon
© RIVM 2013
Parts of this publication may be reproduced, provided acknowledgement is given to the 'National Institute for Public Health and the Environment', along with the title and year of publication.
R.C. Sprong
Contact:
Corinne Sprong
Centre for Nutrition, Prevention and Health Services
Corinne.Sprong@rivm.nl
This study was performed by order and for the account of the Ministry of Health, Welfare and Sports, within the framework of project V320026 (Beleidsadvisering chemische voedselveiligheid VWS)
Rapport in het kort
Verfijning berekening blootstelling aan rookaroma met behulp van gebruikersgehalten aangeleverd door de industrie
Een pilotstudy naar dataverzameling van gebruikersgehalten
Aan sommige voedingsmiddelen wordt rookaroma toegevoegd, zoals rookworst en bepaalde smaken chips. De blootstelling aan rookaroma kan nauwkeuriger worden geschat als de industrie de daadwerkelijke gehalten per product aanlevert. Deze gehalten worden vervolgens gekoppeld aan de hoeveelheid die mensen per dag aan producten consumeren die rookaroma’s bevatten. Dit blijkt uit een pilotstudie van het RIVM. Het is van belang om de blootstelling aan rookaroma’s te berekenen om na te gaan of die binnen de veilige marge valt. In de huidige methode worden de gegevens over de concentraties verkregen op basis van informatie die de producenten van rookaroma aanleveren over het gebruik ervan in bredere productgroepen (zoals ‘vlees en vleesproducten’ en ‘snacks’). Deze gegevens worden vervolgens geëxtrapoleerd naar de dagelijkse consumptie van de producten uit die volledige productgroepen. Hierdoor wordt vaak een hogere blootstelling aan rookaroma’s geschat dan feitelijk het geval is. Meerdere partijen zijn gebaat bij een nauwkeurigere schatting. De risicomanager (het ministerie van VWS) hoeft geen kostbaar monitoringsprogramma op te zetten dat op metingen is gebaseerd. Daarnaast krijgen de blootstellingsdes-kundigen de beschikking over nauwkeurigere gegevens. Ten slotte kan de industrie er voordeel bij hebben, als de nauwkeurige berekeningen resulteren in lagere blootstellingsberekening.
Het onderzoek is uitgevoerd op initiatief van het ministerie van Volksgezondheid, Welzijn en Sport (VWS) en de Federatie Nederlandse Levensmiddelen Industrie (FNLI). De resultaten gelden voor Nederland. De blootstellingschatting kan niet gebruikt worden voor de risicobeoordeling van één type rookaroma. Om dat te kunnen specificeren, is het nodig om te weten hoeveel producten dat rookaroma bevatten. Een voorbeeld is het percentage van een type chips dat een bepaald rookaroma bevat op het geheel aan chipsproducten.
Trefwoorden:
Rookaroma, gerookt voedsel, jonge kinderen, volwassenen, blootstelling via de voeding
Abstract
Refined exposure assessment of smoke flavouring with use levels provided by the industry
A pilot study into data collection of use levels
The exposure to smoke flavour primary products can be more accurately assessed using data obtained from the industry. The cooperation between risk managers, exposure assessors and the food industry results in a win-win-situation for all parties by 1) providing a cost-effective approach for risk managers, 2) providing exposure assessors a reliable and representative data set and 3) a possible benefit for the industry due to the chance of a lower exposure estimate. This conclusion was drawn by RIVM from a pilot study in which the total dietary intake of smoke flavour primary products was estimated by applying the use levels provided by the food industry. The pilot study into data collection was performed on the initiative of the Dutch Ministry of Health, Welfare and Sport (VWS) and the Federation of the Dutch Food and Grocery Industry (FNLI). Previously, exposure estimates were performed with
aggregated food categories. In this study, use levels of smoke flavour primary products obtained from the industry were linked to individual food consumption data of children aged 2 – 6 years and of the population aged 7-69 years, using disaggregated food categories. The reported data were suitable for exposure assessment, provided that they were sufficiently representative for foods consumed in the Netherlands.
To evaluate the method, the exposure assessment was performed for the total intake of all smoke flavour primary products. Therefore, the exposure estimates of the current study cannot be used for the risk assessment of individual smoke flavour primary products. Nevertheless, this would be possible with the current dataset using the method described in this report, provided that additional data on market shares of foods or of individual smoke flavour primary products are available.
The monitoring system may be used to assess exposure levels of additives and flavourings in other European Member States. It is recommended to explore the use of the monitoring system in other European Member States, with smoke flavouring primary products as a case study.
Keywords:
Contents
1 Introduction—6 2 Intake calculations—8
2.1 Collection of smoke flavour concentration data—8 2.2 Presence of smoke flavour in food groups—9
2.3 Calculation of processing factors for smoke flavour—9 2.4 Assumptions—10
2.5 Food coding system—10 2.6 Intake calculations—10 2.7 Tiered approach—10
2.8 Monte Carlo Risk Assessment—11 2.1 APET method—11
2.2 SMK-EPIC method—12
3 Results—13
3.1 Response—13
3.2 Use levels for intake calculation—13
3.3 Presence of smoke flavour in food groups—13 3.4 Exposure—15
4 Discussion—18
4.1 Evaluation of the pilot study—18
4.1.1 Completeness and representativeness of the data—18 4.1.2 Presence smoke flavour in food groups—18
4.1.3 Processing factor smoke flavour for processed meat and fish—19 4.1.4 Exposure estimate—19
4.1.5 Main contributors—20 4.1.6 FoodEx1 coding—20
4.1.7 Comparison with SMK-EPIC method—20
4.2 Need for other exposure assessments smoke flavour primary products—21 4.3 Public-private cooperation for data collection system for exposure monitoring—
21
4.3.1 Advantages for the exposure assessor—21 4.3.2 Advantages for the risk manager—22 4.3.3 MCRA as tool for applicants—24
5 Conclusions and recommendations—25
5.1 Conclusions—25 5.2 Recommendations—25
Acknowledgements—26 References—27
Appendix I Template for use levels, to be completed by food industries.—29 Appendix II. FoodEx 1 codings used in this exposure assessment.—32
1
Introduction
According to regulations EU 1332/2008 (EU 2008a), 1333/2008 (EU 2008b) and 1334/2008 (EU 2008c) both Member states and industries are obliged to provide information on actual use and intake of food enzymes, additives and flavouring systems. In 2011, the Dutch Ministry of Health, Welfare and Sports, the
Federation of Dutch Food and Grocery Industry (FNLI) and RIVM started a pilot study, in which the cooperation with the industry on providing use levels was explored. To this end, the food additives E120 (Carmine) and E133 (Brilliant Blue) were used as a case study (Wapperom et al. 2011). The conclusion of this pilot study was that cooperation with the industry resulted in a win-win-situation for all parties:
1. Delivery of use levels by the industry is a cost-effective approach for Member States to monitor exposure to agents added to food, since collection of data on use levels is less costly than a monitoring system based on analysing food; 2. Exposure assessors obtain a more reliable and representative data set
compared with other methods of data collection on use levels;
3. Industries may benefit by providing use levels, due to the chance of a lower exposure estimate compared with more traditionally methods, as has been shown for the food additives E120 and E133. Therefore, they are more willing to cooperate.
On request of the Dutch Ministry of Health, Welfare and Sports, the present study was performed to evaluate the method of Wapperom et al. (2011) for food flavourings using smoke flavour primary products.
Smoke flavour primary products are made by condensation of smoke, followed by phase separation, in which the aqueous part is separated from the water- insoluble polycyclic aromatic hydrocarbon-rich tar phase. They comprise of water and incompletely characterized substances (a.o. phenols, carbonyls and
carboxylic acids). Smoke flavour primary products are used in processes that substitute traditional smoking, such as regenerated smoke, showering
(spraying) and immersion. In addition, smoke flavour primary products can be mixed through dough or they can be used as a flavour in mixed spices and condiments or as flavour in snacks. Limited toxicological data on smoke flavour primary products are available (EFSA 2010b). Therefore, the Panel on Food contact Material, Enzymes, Flavourings and Processing Aids (CEF) of the European Food Safety Authority (EFSA) concluded in 2010 that it was not possible to allocate an Acceptable Daily Intake for smoke flavourings. Instead, for various smoke flavour primary products, margins of safety based on the No-Observed-Adverse-Effect-Level were calculated (EFSA 2010b). Based on the current expected exposure calculations, the margins of safety may raise cause for some concern for some smoke flavour primary products.
EFSA calculated the intake of smoke flavouring primary products in 2009 (EFSA 2009a), using several methods:
1. Maximised Survey-Derived Daily Intake (MSDI); 2. Single Portion Exposure Technique (SPET);
3. Theoretical Added Maximum Daily Intake and its modified version (TAMDI/mTAMDI);
4. Smoke Flavouring Theoretical Added Maximum Daily Intake (SMK-TAMDI); 5. Smoke Flavouring EPIC model (SMK-EPIC).
The SMK-EPIC model was the most refined model used in the calculation, and is therefore used for comparison in this report. The SMK-EPIC model couples normal or upper use levels of smoke flavouring advised by the industry in 18 food categories to food consumption surveys performed in the EPIC study. Data on normal and upper use levels were obtained from 11 smoke flavour primary products submitted for EFSA evaluation. After this assessment in 2009, 8 new opinions on smoke flavour primary products became available containing new exposure calculations according to the SMK-EPIC model (EFSA 2009b, 2010a, 2010c, 2011a, 2011b, 2012a, 2012b, 2012c).
The SMK-EPIC model is a conservative approach based on:
Normal and upper use levels provided by the producers of smoke flavour primary products and not by the food industry;
German male adults, which have the highest European consumption of smoked meat, fish and cheese (EFSA 2009a);
Presence in 18 food categories as outlined in Commission Regulation (EC) No 1565/2000 (EC 2000);
Assuming a similar ratio between the consumption of smoked fish (products) and fish (products) as the ratio between consumption of smoked meat and processed meat;
Assuming a similar ratio between the consumption of smoked cheese and cheese as the ratio between the consumption of smoked meat and processed meat;
A mean body weight of 60 kg.
The SMK-EPIC model can be further refined by using use levels provided by the industry and a more refined coupling of concentrations values to food
consumption. The current report describes a pilot study for data collection of use levels to be applied for refined monitoring exposure to smoke flavour primary products. According to the Guidance on data submission for flavourings evaluation (EFSA 2012), dietary exposure to flavours should be assessed in adults and children. The highest of these values among adults and children, expressed by kg body weight, should be used as the basis for the safety evaluation of the substance. Therefore, the current study includes exposure assessments for children aged 2-6 years, children aged 7 – 18 years, and adults aged 19 to 69 years.
2
Intake calculations
2.1 Collection of smoke flavour concentration data
Data on use levels on smoke flavour and their primary products were obtained from food companies with products containing smoke flavour on the Dutch Market. Figure 1 shows a schematic presentation of the data collection process. To obtain data on smoke flavour primary products use levels, a template made by RIVM (see Appendix 1) was used. Some food industries stated to use smoke flavour as part of a mixed ingredient, such as ‘brine’ or flavours, such as ‘bacon’ or ‘barbecue’ flavour. When uncertainties occurred on the concentration of smoke flavour primary products in flavours or mixed ingredients, flavour houses or producers of mixed ingredients were approached. In addition, when
uncertainties occurred on the content of primary product in smoke flavour, the producers of smoke flavour primary products were approached. Collection of all these data was facilitated by the federation of Dutch Food and Grocery Industry (FNLI; see Figuur 1).
RIVM
FNLI
Food Industry Flavour houses or other
producers mixed ingredients Producers Primary products 1. Request for use levels 2. Delivery use levels 3. Delivery use levels 4. Questions concentrations primary products 5. Questions concentrations primary products 8. Delivery use levels mixed ingredients 7. Questions concentrations primary products mixed ingredients 10. Questions concentrations primary products 6. Details on producers mixed ingredients or primary products 11. Delivery concentrations primary products 9. Delivery use levels mixed ingredients 12. Delivery concentrations primary products
2.2 Presence of smoke flavour in food groups
The concentration data obtained from the industry predominantly consisted of foods that contain smoke flavour. However, for some food categories, not all food products contain smoke flavour. For example, for the food group potato crisps, only flavours like ‘pepper’, ‘bacon’, ‘barbecue’ or ‘bolognaise’ may contain smoke flavour, whereas other flavours like ‘cheese and onion’ or ‘salt and vinegar’ do not. Since the food consumption data do not differentiate between these flavours, assuming 100 per cent presence of smoke flavour in potato crisps will overestimate the exposure assessment to smoke flavour. This also accounts for other food groups, such as soup, sauces and condiments. To correct for < 100 per cent presence of smoke flavour in particular food groups, the presence of smoke flavour in food products (%) was estimated. To this end, the INNOVA database (INNOVA 2012) was searched for food products on the Dutch market between 2009 and 2012. For each food group that may contain smoke flavour, the percentage of food products that contains smoke flavour was established by counting the number of products that stated to contain smoke flavour and by counting the total number of food products in this food category. In addition, websites of particular brands, e.g. ‘cup-a-soup’, were searched to determine the number of smoke flavour-containing products and the total number of food products.
2.3 Calculation of processing factors for smoke flavour
Smoke flavour can be used in processes using regenerated smoke or in processes using a solution, i.e. showering (spraying) or immersion (e.g. co-extrusion of sausages). The mentioned applications are used for meat, fish or cheese. To calculate the uptake of smoke flavour primary products by food products during these processes, weight changes were used. These data were obtained for cooked smoked sausage and for Frankfurter sausages by one food industry, which uses the showering technique. The processing factor was calculated using the following assumptions:
1. The weight gain of sausages during the showering process consists of 100 per cent smoke flavour solution (primary product and carrier solution, which contains primarily water). By knowing the percentage primary product in the smoke flavour solution, the concentration of primary product in the sausage can be calculated.
For example, if a sausage of 90 g gains 10 g weight, and the concentration of smoke flavour primary product in the smoke flavour solution is 2 per cent, the final concentration of smoke flavour primary product 0.2 g/100 g. 2. After showering or immersion, sausages are dried, which results in a weight
loss. Since it is unknown what fraction of the smoke flavour primary product evaporates, the weight loss was assumed to be solely due to water, thus all the primary product is retained in the sausage. For example, when the sausage weight decreases with 10 per cent, then the concentration of the smoke flavouring will increase with a factor 1.11.
3. Canned sausages stored in a solution will gain weight. This weight gain is used to calculate the final concentration of smoke flavour primary product in the food item. For example, if a sausage weight of 100 g increases to 130 g, then the concentration of smoke flavour primary product will reduce with a factor 1.3. Since no data is available on migration of smoke flavour primary product to the storage solution, it is assumed that all smoke flavour primary product is retained in the sausage, which is a conservative approach.
The processing factors were used for all other smoked sausages and Frankfurters of other brands. In addition, the highest processing factor (Frankfurter sausages), was used for all other food products with unknown processing factor, such as fish.
2.4 Assumptions
The following assumptions were made:
1. When the use range of smoke flavor or its primary product (e.g. 17-25 mg smoke flavor primary product/kg food product) was provided by the industry, the highest concentration was used for the exposure assessment. In addition, when data were provided as < 20 mg/kg, a concentration of 20 mg/kg was used for the exposure assessment.
2. For smoked fish, only data for tuna were available. These use levels were used for all categories of smoked fish products.
3. Use levels were provided for 'metworst'. The Dutch food consumption surveys does not include data on consumption of 'metworst'. Consumption data for ‘metworst’ like products, such as Saveloy sausage and salami are available, which can be smoked according to the INNOVA database. No concentration data of Saveloy sausage and salami were available. Therefore, the use levels of 'metworst' are used for Saveloy sausage and salami.
2.5 Food coding system
Foods were coded by the FoodEx1 coding system at level 2 to 4 (EFSA 2011c; Appendix II) or by the Dutch NEVO coding system (http://www.rivm.nl/nevo/).
2.6 Intake calculations
Calculations for young children were performed using food consumption data of the Dutch National Food Consumption Survey-Young children (Ocké et al., 2008). This survey covers the dietary habits of young children aged 2 to 6 years and was conducted in 2005 and 2006. Calculations for subjects > 6 years were performed using food consumption data of the Dutch National Food consumption Survey 2007-2010 (van Rossum et al., 2011). This survey includes the eating habits of people aged 7-69 y, with the exception of pregnant and breast-feeding women.
2.7 Tiered approach
In the previous assessment with use levels of food colours (Wapperom et al. 2011); a 3 tiered approach was proposed:
Tier 1: using aggregated food categories and maximum permitted levels; Tier 2a: aggregated food categories and typical or maximum use levels; Tier 2b: partly disaggregated food categories and typical or maximum use
levels;
Tier 3: Individual food consumption and typical or maximum use levels. Because maximum permitted levels are not set for smoke flavour primary products, tier1 as proposed by Wapperom et al. (2011) cannot be performed. With the FoodEx1 coding at level 2, tier 2a and tier 3 calculations can be performed, whereas with the Dutch NEVO coding system, tier 3 calculations can be performed. Tier 3 is subdivided in tier 3a and tier 3b:
Tier 3a: 100 per cent presence of smoke flavour in all food groups that may contain smoke flavour and only upper use levels are used;
Tier 3b: 100 per cent presence of smoke flavour in all food groups that may contain smoke flavour and normal use levels (using all obtained use levels) are used.
In this study, another tier (tier 4) was explored: Use of all use levels and correction for food groups that do not always contain smoke flavour, such as snacks or sauces. For example, when smoke flavour is present in only
10 per cent of corn chips, zero concentrations are introduced to correct for the absence of smoke flavour in 90 per cent of corn chips.
2.8 Monte Carlo Risk Assessment
To assess the long-term exposure, statistical models should be used that correct the variation in long-term exposure between individuals for the within individual variation (Hoffmann et al., 2002; Nusser et al., 1996; Slob, 1993). However, an important prerequisite for this is that the logarithmic transformed daily exposure distribution is normally distributed (de Boer et al., 2009). Since, the exposure data were not normally distributed for smoke flavour primary products
(Appendix III), the observed individual means (OIM) method was used, which multiplies the average intake of food products by the mean concentration of smoke flavouring in that food product. This implies that the high exposure percentiles are conservatively estimated (Figure 2.) The Monte Carlo Risk Assessment programme (MCRA), Release 7.1
(de Boer and van der Voet,
2010)
was used for the exposure assessment.By using the bootstrap approach, the uncertainty around the exposure estimate due to the limited size of the concentration and food consumption dataset was determined. The uncertainty is reported as the 95 per cent confidence interval around the percentiles of exposure.
2.1 APET method
According to the guidance on the data required for the risk assessment of flavourings to be used in or on foods (EFSA 2010d), the Added Portion Exposure Technique (APET) should be used to estimate dietary exposure for adults and children. This method is developed for applicants of flavours and takes into account the consumption of added flavours as well as the consumption of the particular flavour from other dietary sources. Briefly, this technique couples normal and upper use levels of a flavour with standard portions. The APET method categorizes sub-categories in 2 food groups: beverages and solid foods. For each food group, only the sub-category resulting in the highest potential dietary exposure is considered. For example, if processed meat provides the highest exposure for solid food compared with processed fish, cheese, snacks etc., only the exposure of processed meat is taken into account. The APET is calculated by summing the highest exposure value from the solid food category with the highest exposure value from the beverage food category. Next the exposure estimate is corrected for an assumed body weight of 60 kg for adults, and 15 for a 3-year old child, respectively.
Figure 2. The effect of intra-individual variation on exposure distributions. Figure is obtained from the National Cancer Institute.
2.2 SMK-EPIC method
The SMK-EPIC method used by EFSA (2009a) was also used to calculate exposure assessment.
3
Results
3.1 Response
In total, 58 companies were approached by FNLI. Of these companies, 26 delivered data (45 per cent). Of these 26 companies, 3 stated not to use smoke flavour on the Dutch market. The data included main brands available in the Netherlands. Data also comprised the food groups in which smoke flavour is used according to the producers of smoke flavour primary products (personal communication). No data were obtained for non-alcoholic beverages, such as lapsang souchon tea, and alcoholic beverages, such as whisky.
3.2 Use levels for intake calculation
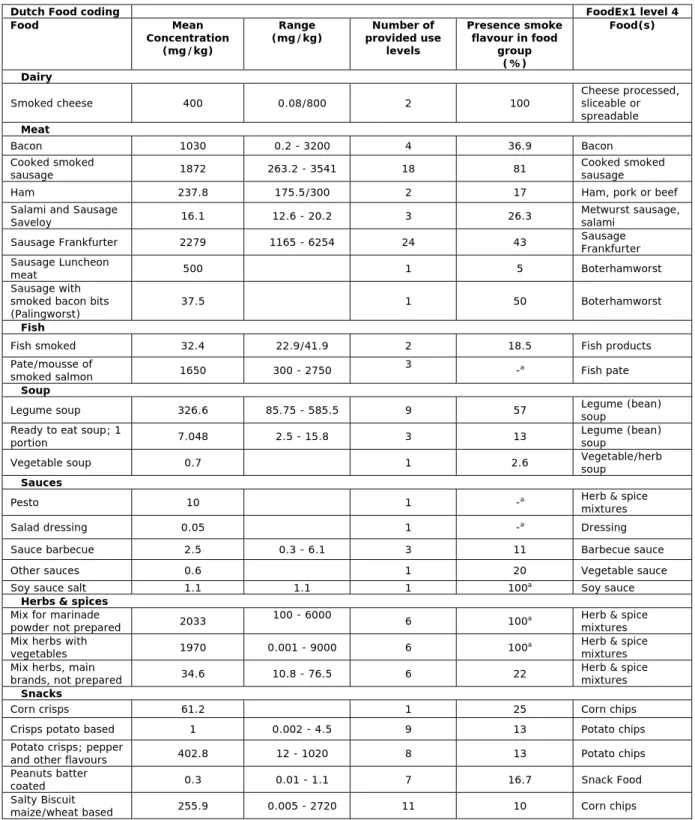
The use levels used in the calculation with the Dutch food coding system are listed in Table 1. Within product groups, use levels may vary considerably. Differences between the Dutch food coding system and the FoodEx1 coding level 4 are presented in Table 1. For meat and some products of the other food categories, the FoodEx1 coding level 4 is as detailed as the Dutch food coding system. For foods belonging to the categories herbs and spices, and snacks, the Dutch food coding system is more detailed.
3.3 Presence of smoke flavour in food groups
The presence of smoke flavour in food groups is listed in Table 1. For some food categories, it was very laborious to obtain data on the percentage of products containing smoke flavour, due to large food categories with more than
1000 entries. In addition, the presence of smoke flavour in Frankfurter sausage (43 per cent) was unexpectedly low. For this reason, the presence was checked by counting the number of Frankfurter sausage labelled to contain smoke flavour in a local large supermarket, yielding a presence of 67 per cent. Therefore, the INNOVA database may not always be representative for the percentage food products containing smoke flavour on the Dutch market. For this reason, tier 4 calculations were not performed.
Table 1. Concentration values smoke flavour primary products per food group as used in the intake assessment and the presence of smoke flavour in food groups according to the INNOVA database.
Dutch Food coding FoodEx1 level 4
Food Mean Concentration
(mg/kg)
Range
(mg/kg) provided use Number of levels Presence smoke flavour in food group (%) Food(s) Dairy
Smoked cheese 400 0.08/800 2 100 Cheese processed, sliceable or spreadable
Meat
Bacon 1030 0.2 - 3200 4 36.9 Bacon
Cooked smoked
sausage 1872 263.2 - 3541 18 81 Cooked smoked sausage
Ham 237.8 175.5/300 2 17 Ham, pork or beef
Salami and Sausage
Saveloy 16.1 12.6 - 20.2 3 26.3 Metwurst sausage, salami Sausage Frankfurter 2279 1165 - 6254 24 43 Sausage Frankfurter Sausage Luncheon
meat 500 1 5 Boterhamworst
Sausage with smoked bacon bits
(Palingworst) 37.5 1 50 Boterhamworst
Fish
Fish smoked 32.4 22.9/41.9 2 18.5 Fish products
Pate/mousse of
smoked salmon 1650 300 - 2750 3 -a Fish pate
Soup
Legume soup 326.6 85.75 - 585.5 9 57 Legume (bean) soup Ready to eat soup; 1
portion 7.048 2.5 - 15.8 3 13 Legume (bean) soup
Vegetable soup 0.7 1 2.6 Vegetable/herb soup
Sauces
Pesto 10 1 -a Herb & spice
mixtures
Salad dressing 0.05 1 -a Dressing
Sauce barbecue 2.5 0.3 - 6.1 3 11 Barbecue sauce
Other sauces 0.6 1 20 Vegetable sauce
Soy sauce salt 1.1 1.1 1 100a Soy sauce
Herbs & spices
Mix for marinade
powder not prepared 2033 100 - 6000 6 100a Herb & spice mixtures Mix herbs with
vegetables 1970 0.001 - 9000 6 100a Herb & spice mixtures Mix herbs, main
brands, not prepared 34.6 10.8 - 76.5 6 22 Herb & spice mixtures
Snacks
Corn crisps 61.2 1 25 Corn chips
Crisps potato based 1 0.002 - 4.5 9 13 Potato chips Potato crisps; pepper
and other flavours 402.8 12 - 1020 8 13 Potato chips Peanuts batter
coated 0.3 0.01 - 1.1 7 16.7 Snack Food
Salty Biscuit
maize/wheat based 255.9 0.005 - 2720 11 10 Corn chips a For some food groups, it was difficult to calculate the presence of smoke flavour in food groups.
3.4 Exposure
Tier 2 calculations were performed using the methods of SMK-EPIC, APET method and MCRA using FoodEx1 level 2 coding. Table 2 shows the results of these calculations. For the FoodEx1 coding, only calculations with the Dutch National Food Consumption Survey-Young children can be performed, since the data of the Food survey 2007-2010 are not with FoodEx1 coding. Tier 2
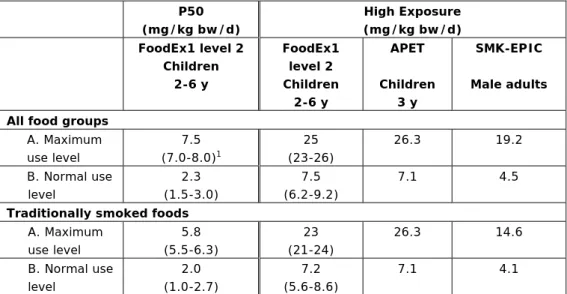
calculations for high exposure in children are comparable for the APET method and FoodEX1 level 2 calculations. The SMK-EPIC method yields lower exposure estimates. Since the SMK-EPIC method calculates the intake for adults instead of children, the lower exposure is most likely due to the lower food intake per kg bodyweight of adults compared with children. Median exposure estimates were lower using the FoodEx1 level 2 exposure estimates, compared with the FAIM template. To calculate the exposure for traditionally foods only, data of non-traditionally smoke food groups were omitted from the calculation. The exposure estimates performed with only traditionally smoked foods resulted in exposure estimates that were comparable to exposure estimates with all food groups included. This indicates that traditionally smoked foods contributed most to the exposure estimates.
Table 2. Tier 2 calculations using the SMK-EPIC model, the APET method and MCRA using FoodEx1 level 2 coding.
P50 (mg/kg bw/d) High Exposure (mg/kg bw/d) FoodEx1 level 2 Children 2-6 y FoodEx1 level 2 Children 2-6 y APET Children 3 y SMK-EPIC Male adults All food groups
A. Maximum use level 7.5 (7.0-8.0)1 25 (23-26) 26.3 19.2 B. Normal use level 2.3 (1.5-3.0) 7.5 (6.2-9.2) 7.1 4.5 Traditionally smoked foods
A. Maximum use level 5.8 (5.5-6.3) 23 (21-24) 26.3 14.6 B. Normal use level 2.0 (1.0-2.7) 7.2 (5.6-8.6) 7.1 4.1 1 95% confidence intervals
Tier 3 calculations were performed using the MCRA method using FoodEx1 level 4 coding and the Dutch food coding system. Table 3 shows the results of these calculations. Tier 3 calculations resulted in lower estimates than tier 2 calculations. Compared with the upper use levels (tier 3a), the exposure calculated with all use levels (tier 3b) is a factor 2 lower for the high intake percentiles in all age groups. Median intake of smoke flavour was not affected by tier selection.
Table 3. Tier 3 calculations using the FoodEx1 level 4 coding and using the Dutch NEVO coding system
FoodEx1 Dutch coding
Tier 3 Children 3-6 y Children 3-6 y Children 7-18 y Adults 19-69 y P50 (mg/kg bw/d) A. Upper use levels 0.18 (0.11-0.23)1 0.008 (0.003-0.011) 0.030 (0.009-0.044) 0.014 (0.005-0.019) B. Normal use levels 0.08 (0.03-0.1) 0.007 (0.004 – 0.010) 0.029 (0.012 – 0.037) 0.010 (0.006 – 0.014) P95 (mg/kg bw/d) A. Upper use levels 7.8 (6.9-9.3) 7.6 (6.1-8.8) 4.4 (3.7-5.2) 2.2 (1.9-2.5) B. Normal use levels 3.2 (2.8-3.8) 3.3 (2.8-3.9) 2.1 (1.7-2.5) 1.1 (0.9-1.4) 1 95% confidence intervals
Exposure estimates for children aged 7 to 18 years were a factor 2 higher compared with adults, for median intake as well as for the high intake percentiles (Table 3). In contrast, median intake levels for children aged 2 to 6 years did not differ compared with adults. However, the exposure estimate of the high intake percentile for children aged 2 to 6 years was a factor 3 higher for tier 3b (all use levels) compared with adults. For tier 3a (only upper use levels), the exposure estimate for the high intake percentile increases with a factor 3.5 for children aged 2 to 6 years compared with adults.
The exposures estimation with the Dutch food coding system and with the FoodEx1 coding system at level 4, resulted in similar exposure rates for the high intake percentile (Table 3). However, median intake of smoke flavour primary products was higher for the FoodEx1 Level 4 coding in both tiers (factor 22.5 and 11 for tier 3a and tier 3b, respectively).
Table 4 shows the main contributors to median and high (p99.9) dietary exposure, respectively, as calculated with the Dutch food coding system. For median intake, main contributors were cooked smoked sausage and Frankfurters sausage, herbs & spices, crisps, legume (bean or pea) soup, and other
processed meat such as bacon and sausage luncheon meat, depending on the age group and tier used. Cooked smoked sausage and Frankfurter sausage were the main contributors to high dietary exposure in all age groups. Comparable results were obtained with the FoodEx1 coding level 4 (Table 4).
Table 4. Main contributors to median and high exposure of the Dutch population to smoke flavour primary products, respectively, determined with FoodEx1 at level 4 or with the Dutch food coding system.
Tier 3 Young children
2-6 y Children 7-18 y 19-69 y Adults P50
FoodEx1 Level 4
A. Upper use levels Frankfurter sausage (33.1%) Cooked smoked sausage (22.5%) Bacon (12%)
Herbs & spices (12%) Potato crisps (9.5%) Legume soup (8.2%)
Calculation not performed Calculation not performed
B. Normal use levels Frankfurter sausage (33.6%) Cooked smoked sausage (29.8%) Bacon (10.7%)
Legume soup (9.7%) Herb & spices (6.6%)
Calculation not performed Calculation not performed
Dutch food coding
A. Upper use levels Frankfurter sausage (48.2%) Cooked smoked sausage (29.2%) Herbs & spices (13.0%)
Frankfurter sausage (53.2%) Cooked smoked sausage (24%)
Crisps (8.0%)
Cooked smoked sausage (41.8%)
Frankfurter sausage (14.9%) Legume soup (11.6%)
B. Normal use levels Frankfurter sausage (40.7%) Cooked smoked sausage (35.8%)
Frankfurter sausage (42%) Cooked smoked sausage (27.5%)
Bacon (7%)
Cooked smoked sausage (42%)
Frankfurter sausage (14.9%) Legume soup (12.4%)
High Exposure
FoodEx1 Level 4
A. Upper use levels Frankfurter sausage (64%) Cooked smoked sausage (25.2%) Bacon (10.7%)
Calculation not performed Calculation not performed
B. Normal use levels Frankfurter sausage (60.3%) Cooked smoked sausage (30.7%) Bacon (8.9%)
Calculation not performed Calculation not performed
Dutch food coding
A. Upper use levels Frankfurter sausage (83.4%) Cooked smoked sausage (16.6%)
Frankfurter sausage (87.8%) Bacon (1%)
Frankfurter sausage (51.9%) Cooked smoked sausage (48.1%)
B. Normal use levels Frankfurter sausage (77.6%) Cooked smoke sausage (22.4%)
Frankfurter sausage (77.4%) Cooked smoke sausage (18.2%)
Cooked smoked sausage (71.7%)
4
Discussion
This pilot study shows that data collection of use levels by the industry can be used for refined exposure assessment of (smoke) flavourings. Similar findings have been previously shown for additives (Wapperom et al., 2011). A major prerequisite for exposure calculation with use levels is that sufficient and reliable data are available.
4.1 Evaluation of the pilot study
Completeness and representativeness of the data
Forty five percent of the approached industries responded with data supply. Main manufacturers and brands were included, except for fish where one of the largest producer of smoked fish products on the Dutch market was not able to provide data. Due to the high presence of main brands in the concentration database, the data will cover a large part of the market. However, details on market share are not present. Data on market share are highly confidential and therefore not easily obtained from the food industry. Market share data can be obtained from specific companies, but are very expensive. Another way to obtain data on market share is to include more brands in the food consumption survey. At present, only some main brands are included in the Dutch food consumption surveys.
Data on smoke flavour in non-alcoholic beverages (e.g. lapsang souchong tea, i.e. tea with strong smoke taste) and alcoholic beverages (e.g. whisky, which is made of smoke-dried grains) were not obtained. This may result in a small underestimation of the exposure estimate of smoke flavour primary products in the adult population. Due to the expected small consumption of both lapsang souchong tea and alcoholic beverage in children aged 2-6 y, the contribution of these beverages to the total exposure in children is probably negligable. An alternative for use levels is measuring concentrations of smoke flavour primary product components in food. Nevertheless, this is not suitable: First, analysis of compounds in food is a costly approach. In addition, since several components of primary products are not characterised, analytical determination currently is not an option. Therefore, collection of use levels is at present the most reliable and cost-effective approach.
Data on food products without smoke flavour, the so-called ‘zeroes’ are insufficient. The food industry was requested to react when no smoke flavour was used for food products on the Dutch market. Only 3 manufacturers stated not to use smoke flavour. However, no information was obtained on which food products did not contain smoke flavour. Therefore, in future data collections, the need for data providing on ‘zero’ food products needs to be emphasized.
Presence smoke flavour in food groups
To compensate for the lack of ‘zeroes’, the presence of smoke flavour in food products was determined using the INNOVA database. As already stated in the result section, the reliability of this method is questionable. In addition, the
presence in food groups can be obscured by market share. For example, if 20 per cent of products from a particular food group do not contain smoke flavour, this does not necessarily mean that 20 per cent of the consumed foods from this food group do not contain smoke flavour when market shares of foods from this particular food group are either large or small. Therefore, therefore tier 4 calculations are not performed.
Processing factors smoke flavour for processed meat and fish
Processing factors were obtained for smoke flavour applications by regenerated smoke, showering or immersion from one manufacturer of cooked smoked sausage and Frankfurter sausages. These processing factors were extrapolated to other cooked smoked or Frankfurter sausages and smoked fish products. However, it is not clear whether the same processing factors can be applied to different application processes. Theoretically, the texture and composition of the food may affect the degree of cross-linking of smoke flavour compounds with proteins and thus in the final content of smoke flavour. Therefore, data on processing factors for all foods for which regenerated smoke, showering or immersion techniques are used are desirable. This can be obtained by weighing foods, as has been done for sausages, or preferably by measuring key
compounds present in smoke flavouring. To reduce uncertainties in processing factors, the importance of these processing factors needs to be stressed in future data collections.
Exposure estimate
Tier 2 calculations resulted in higher exposure estimates compared with tier 3 calculations. This is because the use of aggregated food categories. For example the FoodEx1 level 2 coding contains the food category ready-to-eat soups, which contains all kind of soups. The concentration of smoke flavour primary products in ready-to-eat soups, is dominated by use levels in legume soup (Table 1). It should be noted that the Dutch pea soup or bean soup contains cooked smoked sausage and/or bacon and these ingredients are the main contributors to use levels in legume soup. Therefore, applying these use levels to all ready-to-eat soups overestimates the intake of smoke flavouring. The same accounts for sauces, snacks, condiments, dressings and herb and spice mixtures. Flavours associated with smoking, such as ‘barbecue’ or ‘bacon’ flavour, contain higher use levels than flavours that are not associated with smoke flavour, such as ‘pepper’. Moreover, it is assumed that all sausages, preserved meat, fish products and cheese contain the same amount of smoke flavour primary products as their smoked counterparts. All these assumptions together,
ultimately result in an overestimation of the exposure to smoke flavour primary products. This also accounts for the APET and the SMK-EPIC method, which both use aggregated food categories.
Given the large range in use levels of smoke flavour primary products in food categories, the use of maximum use levels in all food items that may contain smoke flavour (tier 3a) will lead to an overestimation. The use of all use levels provided by the industry for all food items that may contain smoke flavour (tier 3b), probably leads to a small overestimation of exposure, because some food categories that comprise different flavours (e.g. ‘mix herbs with vegetables’ and ‘corn crisps’) are all assumed to contain smoke flavour. At present, the
data on market share. Therefore, tier 3b can be regarded as the most realistic tier up to now.
Main contributors
Regardless of the calculation method used, the main contributors to the high intake are predominantly foods that used to be traditionally smoked, such as cooked smoked sausage, Frankfurter sausage and bacon, and not to food groups that are ‘artificially’ flavoured, such as crisps, soups and sauces. Omitting non-traditionally smoked foods did not significantly affect high intake exposure.
FoodEx1 coding
The FoodEx1 coding level 4 system resulted in higher estimates for the median intake of smoke flavour compared with the Dutch coding system. This is because some food categories are less detailed than the Dutch food coding system. For example, ‘potato crisps’ is in the FoodEx1 coding 1 food group including ‘natural’ and other flavours, whereas in the Dutch food coding system, these are separate food groups. However, for the high percentile, dietary exposure to smoke
flavour primary products is comparable. This is because of the FoodEx1 level 4 coding being as detailed for the main contributors as the Dutch food coding system. Therefore, the FoodEx1 coding system can be used for refined exposure assessments in European countries.
Comparison with SMK‐EPIC method
The exposure assessment of EFSA (EFSA 2009a) was performed with the SMK-EPIC methods using male adults, because of the higher meat and fish
consumption of the male population. In the current study, males and females were included. To exclude the possibility that inclusion of females lowers the exposure estimate, the calculations were repeated for men only. Exclusion of women resulted in a small increase in median intake levels of smoke flavouring, but did not affect high percentiles of intake (Table 6). This is because the subjects in the high intake percentiles are males with high meat consumption. Therefore, the total population can be used for exposure assessment to smoke flavour primary products. Compared with the SMK-EPIC model, exposure estimates for the high exposure were a factor 7 lower, when upper use levels were used, and a factor 3 lower when normal use levels were used.
Table 6. Median (p50) and high exposure (mg/kg bw/d) of the male and total Dutch population aged 19-69 years to smoke flavour primary products, determined with the Dutch food coding system.
P50 High exposure
Male Male and
female
Male Male and female SMK-EPIC Upper use level 0.025 0.014 2.4 2.2 19.2 Normal use level 0.021 0.010 1.3 1.1 4.5
The Guidance on data submission for flavourings (EFSA 2010d) states that dietary exposure should be assessed in adults and children, and that the highest
of these values among adults and children, expressed per kg bodyweight should be used for the as the basis for the safety evaluation. The EFSA assessment (2009) did not include children. The present study shows that children indeed have a higher exposure to smoke flavour primary products (Table 2) compared with adults. This is because children have a higher food consumption rate per kg body weight. Therefore, the exposure estimate of children needs to be
addressed in future exposure assessments to smoke flavour primary products.
4.2 Need for other exposure assessments smoke flavour primary products
The result of this pilot study shows that refinement of the exposure assessment to smoke flavouring primary products is possible and can lead to lower exposure estimates. However, two major remarks need to be stressed.
1. In the present study, the total intake of smoke flavour primary products is assessed for evaluation of the data collection method. However, since each smoke flavour primary product has its own NOAEL and thereby its own margin of safety (EFSA 2009b, 2010a, 2010c, 2011a, 2011b, 2012a, 2012b, 2012c), exposure assessments should be performed for each smoke flavour primary product. The method of data collection in this report is a useful tool for exposure assessment of individual smoke flavour primary products, since information on use of individual smoke flavour primary products in food groups is present in the dataset. However, for a representative exposure calculation of individual smoke flavour primary products, data on market share is needed. It is recommended to explore cost-effective methods on market share, for example by requesting food industries to distribute information to exposure assessors on the premise this information would be handled strictly confidentially.
2. The present study only accounts for the Dutch situation. It is not clear whether different exposure estimates will be obtained in other countries, with other use levels, distinct eating patterns and other methods of food
consumption surveys. For example, when higher use levels are applied in countries with a high consumption of foods which used to be traditionally smoked, the exposure estimate will increase. For the discussion on the safety on smoke flavour primary products on the European level, it is recommended that more refined exposure estimates are performed using data of other countries.
4.3 Public-private cooperation for data collection system for exposure monitoring
The conclusion from the two pilot studies, i.e. food additives (Wapperom et al. 2011) and smoke flavouring, is that public-private cooperation on data collection is a powerful tool for exposure assessment and the subsequent risk
management. This data collection method has several advantages for the risk assessor as well as for the risk manager:
Advantages for the exposure assessor
High quality, representative data are essential for adequate exposure
assessment. An important advantage of the system described in this report, is that exposure assessors obtain a representative dataset. Branch organisations can help to estimate the presence of main brands in the database, although an
described in this report, is that national branch organisations can build bridges between the industry, (governmental) institutes and governments. By
emphasizing the need for data by national branch organisations, industries are more willing to provide data, resulting in a reliable and representative data set. In addition, a main advantage of this system is that exposure assessors are able to get in contact with data providers via FNLI to fill gaps in the database or to clear indistinctness in data. When using data from international branch
organisations such as NATCOL or Food Drink Europe, this is often not possible as these central organisations collect data from their members and do not have precise information on these data.
Advantages for the risk manager
According to Article 20 of the European Regulation on flavours (EFSA 2010d) the Member States shall establish systems to monitor the consumption and use of flavourings on a risk-based approach. The method described in this report can be used for data collection for exposure monitoring, as stated above. Another main advantage is that the data are country-specific, in contrast to data obtained from international branch organisations. Although a European dataset can be very useful for a first exposure estimate (tier 1), regional differences may occur due to differences in use levels and eating habits. When a
panEuropean assessment results in a possible health risk for a Member State, it is advisable to investigate whether further refinement is possible, as part of a tiered approach. Figure 2 shows a general flow chart on this tiered approach, as well as items to be addressed and the decisions to be made when comparing the international risk assessment with the national refined risk assessment. Besides an optimised linkage of concentration data and foods consumed, and a refined model for long-term exposure assessment, a national use level database can further refine the exposure assessment. Figure 3 shows a flow chart on how data collection on additives and (smoke) flavours can be organised on the national level.
The results of the present pilot study underpin the conclusions of the prior pilot study (Wapperom et al., 2011): cooperation with the industry, results in a win-win-situation for all parties:
Delivery of use levels by the industry is a cost-effective approach for Member States to monitor exposure to agents added to food, since collection of data on use levels is less costly than a monitoring system based on analysing food;
Exposure assessors obtain a more reliable and representative data set compared with other methods of data collection on use levels;
Industries may benefit by providing use levels, due to the chance of a lower exposure estimate compared with more traditionally methods. Therefore, they are more willing to cooperate.
Recently, the EU-project FACET has been finalised. This project aimed at the creation of a food chemical exposure surveillance system. Within the FACET software, food consumption surveys of 8 countries are available as well as a panEuropean database on use levels of 19 additives and 41 flavours. Whereas it is possible to upload one’s own concentration data, it is not possible to upload one’s own food consumption surveys. Within the calculation tool MCRA, it is possible to upload both types of data. RIVM can help other countries with setting up this system, by preparations of protocols and templates for data collection, by making the MCRA calculation tool available and by preparing tools (e-learning
tools and training session) on how to use the system and the calculation tool, as is shown in the EU project ACROPOLIS (http://acropolis-eu.com/). In this project, the calculation tool MCRA is used to estimate aggregate exposure to pesticides with food consumption surveys of different Member States, which were classified with FoodEx1.
Highly aggregated food categories with EU concentration database Tier 1 assessment Possible risk identified (e.g. > ADI) No risk estimated (e.g. < ADI) No action needed Refined assessment using more detailed food groups and/or national concentration databases
Possible risk identified (e.g. > ADI)
Characterisation of main contributors
Advise (inter)national authorities for foods to
be monitored Adequate
maximum permitted levels?
Yes No
Advise (inter)national authorities on setting adequate maximum permitted
levels
1. Compare EU database with national database: Identify uncertainties and data gaps.
2. Identify level of overestimation due to aggregated food categories in relation to disaggregated categories
No risk estimated (e.g. < ADI): Not a national problem for MS
No action needed. Share optimal calculation
method with other MS
Figure 2. Flow chart of a tiered approach with EU assessment as tier 1, use of refined national calculations and decisions to be made when a possible risk is identified.
Call for data collection on use levels additives or flavourings
Governments or national institutes approaches national branch organisations
National branch organisations approaches food industries with call for data and appropiate templates
Use levels provided to (governmental) institutes
Check for completeness and quality of data by (governmental) institutes
National dataset Data available for panEuropean approach
Figure 3. Flow chart of national data collection on use levels of additives and flavourings.
MCRA as tool for applicants
The MCRA tool can be made available for applicants of additives and flavours, including smoke flavour primary products. The Dutch food consumption surveys and, upon approval, those of other countries can be made available for
applicants. By introducing a method for uploading MPL or use levels for foods to which the additive or flavour is added, the MCRA tool can be used to calculate the expected exposure. Currently, this approach is explored in the
5
Conclusions and recommendations
5.1 Conclusions
The method of data collection of smoke flavour primary products by public private cooperation between the national government and national branch organisations, resulted in a cost-effective, powerful tool for refined exposure assessment with a win-win-situation for both risk manager and the industry. Nevertheless, this accounts for the Dutch situation and needs to be confirmed in other countries. The FoodEx1 coding may be used for calculations in other countries.
The present study showed that exposure assessments of smoke flavouring primary products must include calculations for children, since children have a higher exposure than adults, because of their higher food intake per kg body weight.
For the evaluation of the method, the exposure assessment was performed for the total intake of smoke flavour primary products. Therefore, the exposure estimates of the current study cannot be used for the risk assessment of individual smoke flavour primary products. Since each individual smoke flavour primary product has its own NOAEL and thereby its own margin of safety, exposure assessments should be performed for each smoke flavour primary product. The method described in this report is also a powerful tool for exposure assessments of individual smoke flavour primary products, since data on
individual smoke flavour primary products are available in the data set. However, additional data on market shares of foods or of primary products are necessary to perform exposure assessments for individual smoke flavour primary products.
5.2 Recommendations
A feasibility study to explore the data collection system in other countries is recommended. Data collection on individual smoke flavour primary products and the subsequent exposure assessment may be used as a case study. The RIVM can help other countries or organisations to set up this system.
Because information on market shares is important for determining the completeness of the data set, and in case of smoke flavouring also for the exposure assessment of individual smoke flavouring products, it is
recommended to explore cost-effective methods to obtain information on market shares.
Acknowledgements
The author would like to thank Henny Brants for her help on the food consumption survey coding systems, Geert de Rooy from FNLI for his highly effective approach to obtain data from food industries, Margret Mooren from Unilever for her fruitful help on establishing the template and processing factors, and Jacob van Klaveren, Martine Bakker and Wim Mennes (RIVM) for their valuable comments on the almost final version of the letter report.
References
de Boer WJ, van der Voet H (2010). MCRA 7. A web-based program for Monte Carlo Risk Assessment. Reference Manual 2010-08-25. Bilthoven, Wageningen, Biometris, Wageningen UR and National Institute for Public Health and the Environment (RIVM).
de Boer WJ, van der Voet H, Bokkers BGH, Bakker MI, Boon PE (2009).
Comparison of two models for the estimation of usual intake addressing zero consumptions and non-normality. Food Additives and
Contaminants: Part A 26: 1433-1449.
EFSA (2009a). Dietary exposure assessment methods for smoke flavouring primary products. Scientific opinion of the panel on Food Contact Materials, Enzymes, flavourings and processing aids. EFSA journal RN-284, 1-30.
EFSA (2009b). Safety of smoke flavour primary product Scansmoke SEF7525. EFSA journal 1224, 1-26.
EFSA (2010a) Opinion on the safety of smoke flavour primary product TRADISMOKE MAX. EFSA journal 8(1): 1394.
EFSA (2010b) Statement on the safety evaluation of smoke flavourings primary products: Interpretation of the margin of safety. EFSA journal
8(1):1325.
EFSA (2010c) Scientific opinion on safety of smoke flavour primary product-Scansmoke R909. EFSA journal 8(1):1395.
EFSA (2011a) Scientific opinion on the safety of smoke flavour primary product Zesti smoke code 10-2011 update. EFSA journal 9(7):2307.
EFSA (2011b) Scientific opinion on the safety of smoke flavour primary product Fumokomp- 2011 update. EFSA journal 9(7):2308.
EFSA (2011c) Evaluation of the FoodEx, the food classification system applied to the development of the EFSA comprehensive European food
consumption database. EFSA journal 9(3):1970.
EFSA (2012a) Scientific opinion on the safety of smoke flavouring primary product SmokEZ Enviro 23- 2012 update. EFSA journal 10(7): 2929. EFSA (2012b) Scientific opinion on the safety of smoke flavouring primary
product SmokEz C-10-2012 update. EFSA journal 10(7):2830. EFSA (2012c). Scientific opinion on the safety of smoke flavouring primary
product AM01-2010 update. EFSA journal 10(2):2580.
EFSA 2010d. Guidance on the data required for the risk assessment of flavourings to be used in or on foods. EFSA journal 8(6):1623. EU (2008a) Regulation (EC) No 1332/2008 of the European Parliament and of
the Council of 16 December 2008 on food enzymes and amending Council Directive 83/417/EEC, Council Regulation (EC) No 1493/1999, Directive 2000/13/EC, Council Directive 2001/112/EC and Regulation (EC) No 258/97 Text with EEA relevance
EU (2008b) Regulation (EC) No 1333/2008 of the European parliament and of the Council of 16 December 2008 on food additives.
EU (2008c) Regulation (EC) No 1334/2008 of the European parliament and of the Council of 16 December 2008 on flavourings and certain food ingredients with flavouring properties for use in and on foods and amending Council regulation (EEC) No 1601/91, regulations (EC) No 2232/96 and (EC) No 110/2008 and directive 2000/13/EC.
regulation No 2232/96 of the European Parliament and of the council. Official jornal of the European Communitees L80/8
Hoffmann K, Boeing H, Dufour A, Volatier JL, Telman J, Virtanen M, Becker W, De Henauw S (2002). Estimating the distribution of usual dietary intake by short-term measurements. European Journal of Clinical Nutrition 56 Suppl. 2: S53-S62.
INNOVA 2012. INNOVA Market insights 2012. http://new.innovadatabase.com NEVO http://www.rivm.nl/nevo/
Nusser SM, Carriquiry AL, Dodd KW, Fuller WA (1996). A semiparametric transformation approach to estimating usual daily intake distributions. Journal of the American Statistical Association 91(436): 1440-1449. Ocké MC, van Rossum CTM, Fransen HP, Buurma EJM, de Boer EJ, Brants HAM,
Niekerk EM, van der Laan JD, Drijvers JJMM, Ghameshlou Z (2008). Dutch National Food Consumption Survey - Young children 2005/2006. Report nr.:350070001. Bilthoven, National Institute for Public Health and the Environment (RIVM). Available online: www.rivm.nl.
Slob W (1993). Modeling long-term exposure of the whole population to chemicals in food. Risk Analysis 13(5): 525-530.
van Rossum CTM, Fransen HP, Verkaik-Kloosterman J, Buurma-Rethans EJM, Ocké MC (2011). Dutch National Food Consumption Survey 2007-2010. Diet of children and adults aged 7 to 69 years. Report nr.:350050006. Bilthoven, National Institute for Public Health and the Environment (RIVM). Available online: www.rivm.nl
Wapperom D, van Donkersgoed G, Koopman N, Niekerk EM, van Rossum CTM, van Klaveren JD, Bakker MI (2011) Exposure assesment of food additives with use levels provided by industry. A pilot study. Report nr 320026002/2011. Bilthoven, National Institute for Public Health and the Environment (RIVM). Available online: www.rivm.nl
Appendix I Template for use levels, to be completed by food industries.
This part forms the general part of the template, which was send to food industries. Fictive examples are shown
.
Company Brand Product Product description Food category
FoodEx1
Application method Remarks
Smokey Smokey Cooked smoked
sausage smoked sausage Low fat cooked A.06.09.004 Cooked smoked sausage Showering
Smokey Smokey Frankfurter sausage Frankfurter sausage;
pork meat A.06.09.004 Cooked smoked sausage Showering
mAny mAny Cooked smoked
sausage Cooked smoked sausage (beef) A.06.09.004 Cooked smoked sausage Combination of different methods
mAny mAny BBQ sauce Barbecue sauce with
smoke flavour A.16.05 Condiment Mixed through product (e.g. dough/soup/sauce)
mAny mAny BBQ crisps Potato crips;
Appendix I continued. Template for actual use levels, to be completed by food industries.
This part of the template addresses the use of smoke flavour for the applications regenerated smoke, showering, immersion and mixed through dough. Fictive examples are shown.
For the applications regenerated smoke, showering and immersion For application in dough
Brand smoke flavour Concentration Primary Product (g/100g smoke flavor) Diluted before uses? Dilution Drying product after addition smoke flavour? Use of storage solution after addition smoke flavour? Brand name smoke flavour Concentration Primary Product (g/100g smoke flavor) Diluted
before use? Dilution Concentration smoke flavour in product (g/100 g)
Smock 1 2 yes 1 part
smoke flavour and
4 parts water
yes no
Smock 2 3 yes 1 part
smoke flavour and
3 parts water
yes yes
Smock 3 1 no - yes no smock 3 1 No - 0.4
smock 3 1 Yes 1 part smoke
flavour and 1 part water
Appendix I continued. Template for actual use levels, to be
completed by food industries.
This part of the template the use of smoke flavour for application in mixed ingredients. Fictive examples are shown.
Brand mixed
ingredient Producer mixed ingredient Description mixed ingredient Concentration smoke flavour in mixed ingredient(g/100g) Concentration mixed ingredient in product (g/100 g) Flavor X Tasty
ingredients aroma met Barbecue rookaroma
Appendix II. FoodEx1 coding used in this exposure
assessment.
Level 4 Level 2
Foodcode Foodname Foodcode Foodname
A.04.03 Tree nuts A.04.03 Tree nuts
A.06.08.001 Ham, pork A.06.08 Preserved meat
A.06.08.002 Ham, beef A.06.08 Preserved meat
A.06.08.007 Bacon A.06.08 Preserved meat
A.06.09.002.002 Mettwurst, sausage A.06.09 Sausages
A.06.09.004 Cooked smoked sausage A.06.09 Sausages
A.06.09.004.003 Boterhamworst A.06.09 Sausages
A.06.09.004.005 Frankfurters, sausage A.06.09 Sausages
A.06.09.006.001 Italian-type salami A.06.09 Sausages
A.06.09.006.003 Beerwurst A.06.09 Sausages
A.06.09.006.005 Cooked salami A.06.09 Sausages
A.06.09.006.008 German salami A.06.09 Sausages
A.06.09.006.009 Hungarian-type salami A.06.09 Sausages
A.06.11.001 Meat paste A.06.011 Meat and meat
products (including edible offal)
A.07.02 Fish products A.07.02 Fish products
A.07.02.005 Fish pâté A.07.02 Fish products
A.08.08.003 Cheese, processed, sliceable A.08.08 Cheese
A.08.08.004 Cheese, processed
spreadable A.08.08 Cheese
A.16.03 Herb and spice mixtures A.16.03 Herb and spice
mixtures
A.16.05.007 Barbecue saus A.16.05 Condiments
A.16.05.011 Soy sauce A.16.05 Condiments
A.16.06.001 Dressing A.16.06 Dressing
A.16.08.001 Cream sauce A.16.08 Savoury sauces
A.16.08.001 White sauce (Bechamel
sauce, Cheese sauce) A.16.08 Savoury sauces
A.16.08.010 Vegetable sauce A.16.08 Savoury sauces
A.19.02.003 Rice, meat, and vegetables
meal A.19.02 Rice-based meals
A.19.10.001 Vegetable/herb soup A.19.10 Ready to eat soups
A.19.10.006 Legume(bean) soup A.19.10 Ready to eat soups
A.20.01 Snack Food A.20.01 Snack Food
A.20.01.001 Potato crisps A.20.01 Snack Food
Appendix III Non-normality of the transformed positive
intake distribution
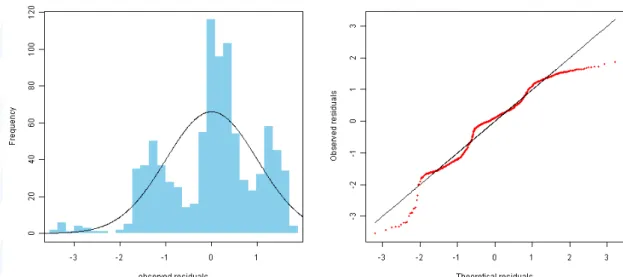
To assess the long-term dietary exposure to substances, statistical models should be used that estimate the long-term exposure by correcting for the within-person variation. An example of such a model is lognormal-normal (LNN) model, implemented in MCRA. Such models can however only be applied when the condition of normality of the logarithmic transformed positive daily exposure distribution is approximately met (de Boer et al., 2009). This assumption should therefore always be checked by using, for example, the normal quantile–
quantile (q–q) plot, a graphical display of residuals. This graphical method was found preferable to the use of formal lack-of-normality significance tests (de Boer et al., 2009).
Using the q-q plot, it was ascertained that the conversion for smoke flavour primary product was far from optimal, given the deviation from normality of the logarithmically transformed positive exposure distribution (difference between the black line and blue graph (left panel of Figure 4), and the deviation of the red line from the straight black (right panel of Figure 4)). The LNN approach was therefore not used to assess the long-term dietary exposure.
National Institute for Public Health and the Environment