Dietary exposure to dioxins in
the Netherlands
RIVM Letter report 2014-0001 P. E. Boon et al.
Colophon
© RIVM 2014
Parts of this publication may be reproduced, provided acknowledgement is given to the 'National Institute for Public Health and the Environment', along with the title and year of publication.
This is a publication of:
National Institute for Public Health and the Environment
P.O. Box 1│3720 BA Bilthoven The Netherlands
www.rivm.nl/en Polly E. Boon
(RIVM)
Jan Dirk te Biesebeek (RIVM) Lianne de Wit-Bos (RIVM) Gerda van Donkersgoed (RIVM)
Contact: Polly Boon
Department for Food Safety
Centre for Nutrition, Prevention and Health Services polly.boon@rivm.nl
This study was performed by order and for the account of the Netherlands Food and Consumer Product Safety Authority (NVWA), Office of Risk Assessment, within the framework of project ‘Intake calculations and modelling’, research question 9.1.85.
Publiekssamenvatting
De inname van dioxinen in Nederland
De inname van dioxinen via de voeding geeft op dit moment in Nederland geen aanleiding tot zorg voor de volksgezondheid. In 2014 ligt de berekende inname bij de Nederlandse bevolking als geheel namelijk voor het eerst niet boven de gezondheidslimiet. De belangrijkste dioxinebronnen blijven melk, rundvlees en plantaardige oliën en vetten. Dit blijkt uit nieuwe berekeningen van het RIVM. De daling komt doordat er de afgelopen decennia steeds minder dioxinen in onze voeding zit. De verwachting is dat de concentraties in voedsel inmiddels hun laagste niveau hebben bereikt en niet verder zullen dalen. Mogelijk heeft ook een ander consumptiepatroon aan de daling bijgedragen. Dioxinen zitten namelijk vooral in vette onderdelen van voedingsmiddelen en mensen kiezen steeds vaker voor vetarme producten. Het blijft echter belangrijk
dioxinegehalten in producten te meten om vast te kunnen stellen dat de inname in de algehele populatie op een acceptabel niveau blijft en om eventuele
incidenteel verhoogde dioxinegehalten in producten te signaleren.
De werkelijke inname ligt mogelijk nog lager dan de hier berekende inname. Bij de berekeningen zijn tien jaar oude concentratiedata gebruikt voor plantaardige oliën en vetten. Gezien de daling in dioxinegehalten in dierlijke producten en de hoge bijdrage van plantaardige oliën en vetten aan de totale inname van dioxinen, is de verwachting dat het gebruik van recente dioxinegehalten voor deze productgroep tot een nog lagere innameschatting zal leiden. Dit geldt ook voor het meenemen van het effect van de wijze waarop voedingsmiddelen worden bereid in de berekening. Er zijn namelijk aanwijzingen dat een deel van de dioxinen verdwijnt als een product wordt gekookt.
Voor deze berekeningen zijn voedselconsumptiegegevens van de
Voedselconsumptiepeiling (VCP) gecombineerd met concentratiegegevens van deze groep stoffen in producten. Vervolgens is de berekende inname vergeleken met de gezondheidslimiet voor deze stofgroep. Deze limiet is gebaseerd op de hoeveelheid van een stof of stofgroep waar mensen hun hele leven gemiddeld aan mogen worden blootgesteld zonder dat dit nadelige gevolgen heeft voor de gezondheid.
Trefwoorden
Dioxinen, jonge kinderen, kinderen, volwassenen, langetermijninname, statistisch modelleren
Abstract
Dietary exposure to dioxins in the Netherlands
The present dietary exposure to dioxins in the Netherlands does not pose risks to public health, as the calculated intake in 2014 did not exceed the defined limit value. Milk, meat (especially beef), and vegetable oils and fats remain the main sources of exposure. These are the main conclusions of a study performed by RIVM.
The decrease in exposure is due to a reduction in dioxin concentrations in our diet over the past few decades. The expectation is that the concentrations in food products have reached their lowest value and will not decrease further. Changes in dietary patterns may also have contributed to the decrease in exposure. Dioxins are mainly present in fat components of food products, and consumers are increasingly opting for food products with reduced fat content. However, it continues to be important to analyse dioxin levels in food products to determine if the intake remains at an acceptable level and to spot possible incidental high dioxin levels in food products.
The real intake may still be lower than the intake reported here. Ten year old concentration data in vegetable oils and fats were used in the assessment. Given the decrease in dioxin concentration in animal products and the high
contribution of vegetable oils and fats to the total exposure to dioxins, the use of recent dioxin concentrations in this food group may result in an even lower exposure estimate. Taking account of the effect of food preparation on dioxin concentrations may further reduce this estimate. There are indications that dioxin concentrations are reduced during cooking.
To calculate the dietary exposure to dioxins in the Netherlands, food
consumption data derived from the Dutch National Food Consumption Survey were combined with the most recent available data on dioxin concentrations in foods. The calculated intake was then compared to the health limit value for dioxins. This limit value is based on the amount of a substance to which people may be exposed on average during their lifetime without detrimental
consequences for health.
Keywords
Dioxins, young children, children, adults, long-term exposure, statistical modelling
Contents
1Introduction — 9
2
Intake calculations — 11
2.1
Food consumption data — 11
2.2
Concentration data — 11
2.3
Linkage between food consumption and concentration data — 12
2.4
Long-term dietary exposure assessment — 13
2.5
Exposure versus health based guidance level — 14
3
Results — 15
3.1
Long-term dietary exposure assessment — 15
3.2
Contribution of food groups — 15
3.3
Exposure versus health based guidance level — 17
4
Discussion — 19
4.1
Comparison with two other Dutch studies — 19
4.2
Methodological issues — 21
4.3
Conclusion — 25
Acknowledgements — 27
References — 29
Appendix A Description of consumption data used in the exposure assessment to dioxins — 32
Appendix B Toxic equivalence factors (TEFs) — 34
Appendix C Total number of samples analysed and the mean dioxin
concentration following three scenarios of assigning dioxin concentrations to congener concentrations below limit of detection (LOD) or quantification (LOQ) — 35
Appendix D Modelling of long-term exposure using LNN — 37
Appendix E Description of the bootstrap — 38
Appendix F Percentiles of long-term dietary exposure of persons aged 2 to 69 years living in the Netherlands to dioxins following two scenarios of assigning dioxin concentrations to congener concentrations below limit of detection (LOD) or quantification (LOQ) — 39
1
Introduction
The National Institute for Public Health and the Environment (RIVM) is frequently confronted by the Netherlands Food and Consumer Product Safety Authority (NVWA) with questions concerning the dietary intake of dioxins. The latest question dates from October 2013, concerning the consumption of eggs from private owners (non-commercial). To answer these questions, a reliable estimate of the background intake of dioxins by the total Dutch population is needed. However, the most recent intake estimates for this population dates from 2008 (de Mul et al., 2008). In that study, the intake of dioxins was
estimated by combining food consumption data of the third Dutch National Food Consumption Survey (DNFCS) performed in 1997-1998 with dioxin
concentrations analysed in 2001-2004 (de Mul et al., 2008). An updated intake assessment was performed in 2009 (Boon et al., 2009). However, this
assessment only addressed the intake in young children aged 2 to 6 years (DNFCS-Young Children 2005/2006) using dioxin concentration data of products of animal origin of 2005-2006, and of vegetable origin from de Mul et al. (2008). Given changes in dietary habits over time (Geurts et al., 2013; van Rossum et al., 2011) and possible changes in dioxin concentrations in products since the last intake assessment for the total Dutch population, an updated dioxin intake assessment with recent concentrations and consumption data is desirable. In 2011, food consumption data of a survey conducted in 2007 to 2010 among persons aged 7 to 69 years living in the Netherlands (DNFCS 2007-2010) was released. Furthermore, recent dioxin concentrations in different products of animal origin are available from the Dutch monitoring programme on dioxins, dioxin-like PCBs, indicator PCBs and flame retardants in primary agricultural products1 and the one on contaminants in Dutch fish and fishery products2. The objective of the current study is to estimate the dietary exposure to dioxins in the Dutch population aged 7 to 69 years using recent information on food consumption and concentration. To cover as much ages as possible, we also estimated the dietary exposure in children aged 2 to 6 years using food consumption data of the DNFCS-Young Children 2005/2006. In this report, the terms exposure and intake are used alternatively, referring both to the ingestion of dioxins via food
1
www.wageningenur.nl/en/Expertise-Services/Research-Institutes/rikilt/Research/Chemical-contamination/Contaminants/Dioxin-analysis/Monitoring-dioxins-PCBs-and-flame-retardants.htm)
2
Intake calculations
2.1 Food consumption data
Calculations for young children were performed using food consumption data of the DNFCS-Young children (Ocké et al., 2008). This survey covers the dietary habits of young children aged 2 to 6 years and was conducted in 2005 and 2006. Calculations for the population aged 7 to 69 years were performed using food consumption data of the DNFCS 2007-2010 (van Rossum et al., 2011). For a more detailed description of both surveys, see Appendix A.
2.2 Concentration data
Concentration data on products of animal origin, including milk, eggs and meat (poultry, beef, pork, sheep, deer and horse) were obtained from the Dutch monitoring programme on dioxins, dioxin-like PCBs, indicator PCBs and flame-retardants in primary agricultural products1. As part of this programme, samples are taken at farms and slaughterhouses, and analysed on a yearly basis. A subset of these samples are reported to the European Union within the framework of the EU monitoring of background levels of dioxins, dioxin-like PCBs, non-dioxin-like PCBs and flame retardants in foodstuffs. This subset was used in the exposure assessment reported here. Concentration data on marine fish and shellfish were obtained from the Dutch monitoring programme on contaminants in Dutch fish and fishery products2. Both monitoring programmes are performed on behalf of the Ministry of Economic Affairs. Samples analysed in 2010-2013 were included in the exposure assessment. Additional dioxin
concentrations in products of vegetable origin (including vegetables, fruits, potato, wheat and vegetable oils and fats) were obtained from different sources (Table 2-1). All concentration data were stored in the Quality Programme of Agricultural Products (KAP) database3.
The collective term dioxin(s) includes the polychlorinated dibenzo-p-dioxins (PCDDs), the polychlorinated dibenzofurans (PCDFs), and the mono-ortho (mo- PCBs) and non-ortho polychlorinated biphenyls (no-PCBs), the so-called ‘dioxin-like PCBs’. Each of these four groups of chemicals consists of a number of individual congeners (Appendix B). To arrive at a total dioxin concentration, the concentrations per congener should be added using toxic equivalence factors (TEFs). The TEF represents the relative toxic potency of each congener
compared to 2,3,7,8-TCDD. By multiplying each dioxin concentration by its TEF and by subsequent adding up, the total dioxin concentration can be calculated in pg TEQ per g product or fat. This procedure was applied to calculate the total dioxin concentration per sample using the TEFs published in 2006 (van den Berg et al., 2006) (Appendix B). The sample concentrations belonging to the products milk, meat and eggs were expressed per g fat, while the samples belonging to the remaining products were expressed per g product. Concentrations in
processed foods, such as cheese, butter, minced meat, etc., were included in the exposure assessment via a food conversion model (see section 2.3).
For more details on the concentration data per product (group), see Appendix C.
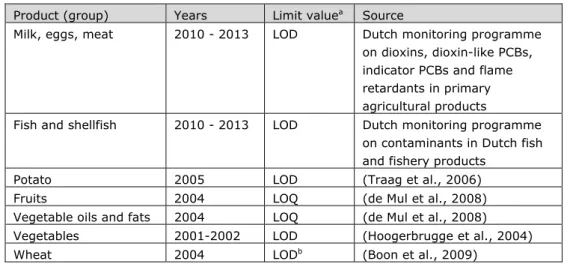
Table 2-1. Overview of concentration data used to assess dietary exposure to dioxins. Product (group) Years Limit valuea Source
Milk, eggs, meat 2010 - 2013 LOD Dutch monitoring programme on dioxins, dioxin-like PCBs, indicator PCBs and flame retardants in primary agricultural products
Fish and shellfish 2010 - 2013 LOD Dutch monitoring programme on contaminants in Dutch fish and fishery products
Potato 2005 LOD (Traag et al., 2006) Fruits 2004 LOQ (de Mul et al., 2008) Vegetable oils and fats 2004 LOQ (de Mul et al., 2008) Vegetables 2001-2002 LOD (Hoogerbrugge et al., 2004) Wheat 2004 LODb (Boon et al., 2009)
a Concentration below which congeners are reported as “less than”: LOD = limit of
detection; LOQ = limit of quantification. For more details, see section 2.4.
b In Boon et al. (2009), the limit values were all reported as the limit of reporting.
Examining the underlying concentration database used in this study showed that for the wheat sample the LOD was reported by the laboratory.
2.3 Linkage between food consumption and concentration data
Dioxins are analysed in raw products, also called raw agricultural commodities (RACs). To model the dietary exposure to chemicals using concentrations analysed in RACs a link between the analysed concentrations and food consumption data is needed.
For the exposure to dioxins, it is important to realise that foods recorded in food consumption surveys include foods consisting of one RAC ingredient (identical to RACs, such as fruits, vegetables, full-fat milk and eggs) and composite foods consisting of more than one RAC ingredient (e.g. pizza, salads, cheese and butter). Furthermore, since dioxins are present in the fat fraction of a food, the fat content of a food is important for determining its dioxin concentration. For example, dioxin levels will be lower in semi-skimmed milk products compared to full-fat milk products.
Based on this, consumed foods were linked to the concentrations analysed in RACs in three ways:
Consumed foods consisting of one ingredient (or RACs)
Concentrations analysed in RACs were linked directly to single ingredient foods if possible. As not all foods consisting of one ingredient that may contain dioxins were analysed, these foods were linked to analysed RACs that were expected to have comparable dioxin concentrations. In this way, possible underestimation of the exposure was avoided. This meant that dioxin concentrations analysed in fruits and vegetables were linked to consumption levels of all fruits and
vegetables recorded in both food consumption surveys. Five consumed, but not analysed fish types were assigned the dioxin concentrations analysed in fish types with comparable fat percentages4. Consumed, but not analysed shellfish
4 Anchovy to concentrations of mackerel, Pollack to concentrations of cod, and bream, carp and tuna to
(such as lobster and oyster) were all linked to dioxin concentrations analysed in crab. Finally, meat of turkey was linked to those analysed in other poultry.
Composite foods
To include exposure via the consumption of composite foods in the assessment, a food conversion model was used. In this model, dioxin concentrations per RAC are converted to equivalent concentrations in composite foods (Geraets et al., 2011; van Dooren et al., 1995). This model first converts foods to their corresponding RAC ingredients (including their fat weight fractions5). For example, pizza may be split into equivalent amounts of its RAC ingredients wheat, tomato and milk, and cheese in its RAC ingredient milk. Then, the chemical concentrations analysed in these RAC ingredients are attributed to these fractions, and summed to result in the chemical concentration in pizza and cheese. In this way, also composite foods containing relevant RACs as
ingredients are included in the exposure assessment.
Foods with one ingredient but with a different fat percentage
Linkage of these foods was based on the fat weight fraction of the consumed food. For example, concentrations of dioxins analysed in raw (full-fat) milk were linked to semi-skimmed and skimmed milk (products) taking into account the fat percentage of these milk (products). This was also done using the food
conversion model that contains the fat weight fractions per food. 2.4 Long-term dietary exposure assessment
The long-term (or usual) dietary exposure to dioxins was assessed, because dioxins may result in adverse effects in the long run. For this purpose, the Monte Carlo Risk Assessment (MCRA) software, release 8.0 was used (de Boer et al., 2013). This software contains the LogNormal-Normal (LNN) model, which was used in the current assessment to assess the long-term exposure to dioxins (Goedhart et al., 2012; van Klaveren et al., 2012).
For this model, first daily consumption patterns of individuals were multiplied with the mean dioxin concentration per consumed food, and summed over foods per day per individual. Subsequently, these daily exposures were corrected for the day-to-day variation in exposure using LNN to estimate the long-term exposure. See Appendix D for a description of LNN.
All daily estimated exposures were adjusted for individual body weight and expressed in “pg TEQ/kg bw per day”. All results were weighted for small deviances in socio-demographic factors6 and season7, and additionally for day of the week for persons aged 7 to 69 years, to make the results representative for the relevant Dutch population and for all days of the week and all seasons (Ocké et al., 2008; van Rossum et al., 2011). The reported percentiles of the usual exposure distributions are P50, P90, P95 and P99. Given the very likely higher exposure in younger children and for a comparison of the current exposure estimates with those reported in Boon et al. (2009), the exposure in the age group of 2 to 6 years was calculated by age. For the older age group (7 to 69 years) the exposure was estimated for the whole age range as done in de Mul et al. (2008), and because the interest with dioxins lies with long-term exposure.
5 This is relevant for the RACs in which the dioxin concentrations are expressed per g fat. 6 Include age, gender, educational level of the head of the household, region and urbanization. 7 To correct for a higher representation of winter and autumn than spring and summer
By using the bootstrap approach, the uncertainty in the dietary exposure assessment due to the sampling size of concentration and food consumption data was quantified. The uncertainty is reported as the 95% confidence interval around the percentiles of exposure. See Appendix E for a description of the bootstrap.
Samples with congener levels below LOQ/LOD
In the dioxin concentration database, a number of samples were reported to contain part of the congeners below the limit of quantification (LOQ) or detection (LOD)8. In samples of products of animal origin, vegetables, potato and wheat, these congeners were reported as below LOD. In the samples of fruits, and vegetable oils and fats, the LOQ was reported (Table 2-1).
In the intake calculations, we assigned ½LOD or ½LOQ to congener
concentrations below LOD and LOQ in products of animal origin, and vegetable oils and fats (medium bound (MB) scenario). Congener concentrations in vegetables, fruits, potato and wheat samples below the limit value were assumed zero, because of the very low fat content of these products. Assigning half the limit value to these food groups would very likely overestimate the true concentrations (Boon et al., 2009). To study the sensitivity of the intake
calculations to the concentration assigned to congeners with a concentration below LOD or LOQ, two other scenarios were performed in which either zero (lower bound (LB) scenario) or the limit itself (upper bound (UB) scenario) was assigned to these concentrations. Appendix F lists the results of these scenarios. Also in these two scenarios congener concentrations below LOD or LOQ in vegetables, fruits, potato and wheat samples were assumed zero.
Effect of processing
As described in Boon et al. (2009), dioxin concentrations may be susceptible to cooking effects resulting in lower concentrations in the consumed (cooked) product. This effect was however not included in the dietary exposure assessment due to very limited and highly variable (and thus unreliable)
information available at that time. In the present study, the effect of cooking on dioxin concentrations was also not addressed, resulting in a possible (slight) overestimation of the exposure.
2.5 Exposure versus health based guidance level
To assess if there is a possible health risk related to the exposure to dioxins, the P99 of exposure was compared to the provisional tolerable daily intake (pTDI) of 2 pg TEQ/kg bw per day (SCF, 2001). The percentages of persons with an estimated long-term dietary exposure to dioxins exceeding this health based guidance level were also calculated.
8 The LOD is the lowest quantity of a substance that can be distinguished from a blank value, but cannot be
quantified as a positive concentration. The LOQ is the lowest quantity of a substance that can be quantified as a positive concentration and is always higher than the LOD.
3
Results
3.1 Long-term dietary exposure assessment
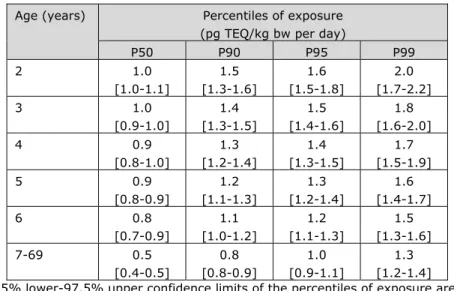
The dietary exposure to dioxins decreased with age. The median dietary
exposure to dioxins decreased from 1.0 pg TEQ/kg bw per day for 2-year olds to 0.5 pg TEQ/kg bw per day for 7 to 69-year olds (Table 3-1). Corresponding numbers for the P99 of exposure were 2.0 and 1.3 pg TEQ/kg bw per day, respectively. Given the uncertainty around the exposure estimates due to the sampling size of the concentration and consumption database (section 2.4), the exposure could be as high as 2.1 pg TEQ/kg bw per day for 2-year olds
(Table 3-1).
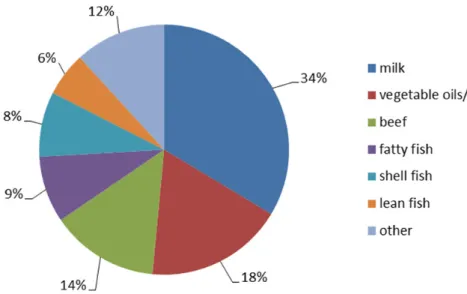
3.2 Contribution of food groups
The food groups that contributed at least 5% to the long-term dioxin exposure in young children aged 2 to 6 years and in the population aged 7 to 69 years are presented in Figure 3-1 and 3-2, respectively. For both age groups, milk
contributed most to the exposure, followed by vegetable oils and fats, and beef, making up over 65% of the total exposure.
Table 3-1. Percentiles of long-term dietary exposure to dioxins in persons aged 2 to 69 years in the Netherlands following medium bounda scenario of assigning dioxin
concentrations to congeners reported at levels below limit of detection (LOD) or quantification (LOQ).
Age (years) Percentiles of exposure (pg TEQ/kg bw per day)
P50 P90 P95 P99 2 1.0 [1.0-1.1] 1.5 [1.3-1.6] 1.6 [1.5-1.8] 2.0 [1.7-2.2] 3 1.0 [0.9-1.0] 1.4 [1.3-1.5] 1.5 [1.4-1.6] 1.8 [1.6-2.0] 4 0.9 [0.8-1.0] 1.3 [1.2-1.4] 1.4 [1.3-1.5] 1.7 [1.5-1.9] 5 0.9 [0.8-0.9] 1.2 [1.1-1.3] 1.3 [1.2-1.4] 1.6 [1.4-1.7] 6 0.8 [0.7-0.9] 1.1 [1.0-1.2] 1.2 [1.1-1.3] 1.5 [1.3-1.6] 7-69 0.5 [0.4-0.5] 0.8 [0.8-0.9] 1.0 [0.9-1.1] 1.3 [1.2-1.4] Note: 2.5% lower-97.5% upper confidence limits of the percentiles of exposure are reported between brackets.
aCongener concentrations below LOD or LOQ equalled ½LOD or ½LOQ, except for
vegetables, fruits, potato and wheat for which congener concentrations below LOD or LOQ equalled zero.
Figure 3-1. Contribution (%) of food groups contributing at least 5% to the long-term dietary exposure to dioxins in children aged 2 to 6 years in the Netherlands in which congener concentrations below limit of detection (LOD) or quantification (LOQ) equalled ½LOD or ½LOQ, except for vegetables, fruits, potato and wheat for which congener concentrations below LOD or LOQ equalled zero.
Figure 3-2. Contribution (%) of food groups contributing at least 5% to the long-term dietary exposure to dioxins in persons aged 7 to 69 years in the Netherlands in which congener concentrations below limit of detection (LOD) or quantification (LOQ) equalled ½LOD or ½LOQ, except for vegetables, fruits, potato and wheat for which congener concentrations below LOD or LOQ equalled zero.
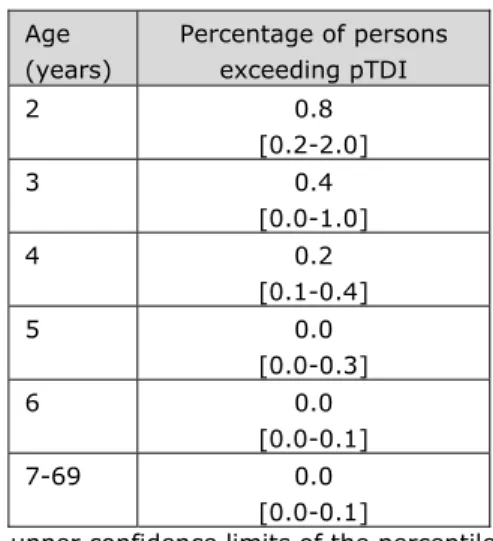
3.3 Exposure versus health based guidance level
For the indication of a possible health risk, the P99 of exposure was compared to the pTDI of 2 pg TEQ/kg bw per day. The results show that the P99 did not exceed this health based guidance level at the ages 3 and older, including the 97.5% upper confidence limits (Table 3-1). This was also true for the 2-year olds, except for the 97.5% upper confidence limit. Given the uncertainty in the dietary exposure assessment due to the sampling size of concentration and food consumption data, the percentage of children exceeding the pTDI could be as high as 2.0% (Table 3-2).
Table 3-2. Percentages of persons aged 2 to 69 years in the Netherlands with a long-term dietary exposure to dioxins above the provisional tolerable daily intake (pTDI;
2 pg TEQ/kg bw per day) following medium bounda scenario of assigning dioxin
concentrations to congeners reported at levels below limit of detection (LOD) or quantification (LOQ). Age (years) Percentage of persons exceeding pTDI 2 0.8 [0.2-2.0] 3 0.4 [0.0-1.0] 4 0.2 [0.1-0.4] 5 0.0 [0.0-0.3] 6 0.0 [0.0-0.1] 7-69 0.0 [0.0-0.1]
Note: 2.5% lower-97.5% upper confidence limits of the percentiles of exposure are reported between brackets.
aCongener concentrations below LOD or LOQ equalled ½LOD or ½LOQ, except for
vegetables, fruits, potato and wheat for which congener concentrations below LOD or LOQ equalled zero.
4
Discussion
The present study describes the dietary exposure assessment of dioxins in persons aged 2 to 69 years in the Netherlands. Below, the results are discussed in relation to two previous studies into dietary exposure to dioxins in the Netherlands, and to the methodology and input data used.
4.1 Comparison with two other Dutch studies
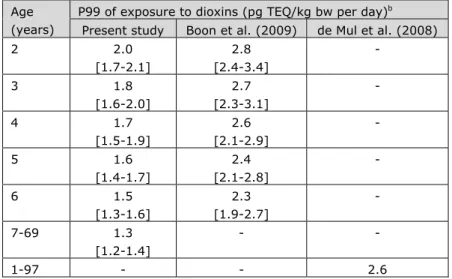
The two most recent exposure studies to dioxins in the Netherlands were published in 2009 for young children (Boon et al, 2009) and in 2008 for the population aged 1 to 97 years (de Mul et al., 2008). In Table 4-1, the P99 of exposure of these two studies are listed together with the exposure results of the present study.
The comparison shows that the long-term exposure to dioxins was lower in the present study compared to the previous calculations. In young children, the dietary exposure to dioxins was about a factor 1.5 lower than in the 2009 study. The confidence intervals of both studies did not overlap (Table 4-1). Compared to the exposure results of de Mul et al. (2008), the exposure in the age group 7 to 69 was decreased by a factor 2. As in the present calculations the ages 1 to 6 years were not included in the 7 to 69 years age group, this decrease may be slightly overestimated. Furthermore, de Mul et al. (2008) assigned half the limit value to congener concentrations analysed below the relevant limit value in vegetables, fruits, potato and wheat samples, as opposed to zero in the present study and Boon et al. (2009). Due to the low dioxin concentrations in these products, we however do not expect that this difference contributed to the
Table 4-1. Long-term dietary exposure to dioxins in three studies using medium bounda
scenario of assigning dioxin concentrations to congener levels reported below relevant limit values.
Age (years)
P99 of exposure to dioxins (pg TEQ/kg bw per day)b
Present study Boon et al. (2009) de Mul et al. (2008) 2 2.0 [1.7-2.1] 2.8 [2.4-3.4] - 3 1.8 [1.6-2.0] 2.7 [2.3-3.1] - 4 1.7 [1.5-1.9] 2.6 [2.1-2.9] - 5 1.6 [1.4-1.7] 2.4 [2.1-2.8] - 6 1.5 [1.3-1.6] 2.3 [1.9-2.7] - 7-69 1.3 [1.2-1.4] - - 1-97 - - 2.6
Note: 2.5% lower-97.5% upper confidence limits of the percentiles of exposure are reported between brackets. In de Mul et al. (2008), no confidence limits were reported.
aCongener concentrations reported below limit values equalled half these values. In the
present study and Boon et al. (2009), vegetables, fruits, potato and wheat samples with congener concentrations below limit values were assumed zero.
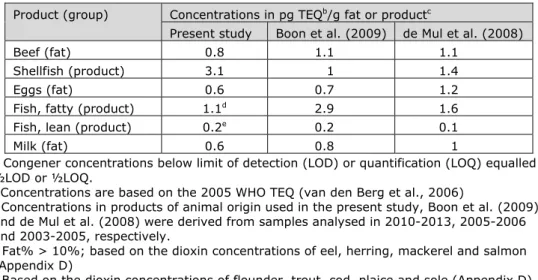
Table 4-2. Dioxin concentrations in products of animal origin used in three studies following medium bounda scenario of assigning dioxin concentrations to congener levels
reported below relevant limit values.
Product (group) Concentrations in pg TEQb/g fat or productc
Present study Boon et al. (2009) de Mul et al. (2008)
Beef (fat) 0.8 1.1 1.1
Shellfish (product) 3.1 1 1.4
Eggs (fat) 0.6 0.7 1.2
Fish, fatty (product) 1.1d 2.9 1.6
Fish, lean (product) 0.2e 0.2 0.1
Milk (fat) 0.6 0.8 1
aCongener concentrations below limit of detection (LOD) or quantification (LOQ) equalled
½LOD or ½LOQ.
b Concentrations are based on the 2005 WHO TEQ (van den Berg et al., 2006)
c Concentrations in products of animal origin used in the present study, Boon et al. (2009)
and de Mul et al. (2008) were derived from samples analysed in 2010-2013, 2005-2006 and 2003-2005, respectively.
d Fat% > 10%; based on the dioxin concentrations of eel, herring, mackerel and salmon
(Appendix D)
e Based on the dioxin concentrations of flounder, trout, cod, plaice and sole (Appendix D)
observed difference in exposure estimates between the two studies. The
contribution of the major food groups to the exposure was comparable between the three studies: milk(products), meat, and vegetable oils and fats.
The observed decrease in exposure (Table 4-1) is very likely due to a change in dioxin concentrations and/or a change in the consumption of foods that
contribute to the exposure to dioxins over time. As the exposure in young children was decreased compared to Boon et al (2009), while using the same consumption data and methodology to assess the exposure9, this decrease is very likely (partly) due to changes in concentrations. For a comparison between the concentrations used in products of animal origin, see Table 4-2.
Concentrations in products of vegetable origin were similar between studies. The dioxin concentrations in beef, eggs, fatty fish and milk were decreased
compared to those used in Boon et al. (2009). This included two food groups contributing largely to the exposure (milk and beef; see Figure 3-1), and indicates that the observed reduction in dioxin exposure in children aged 2 to 6 years was due to a decrease in dioxin concentrations over time. In Boon et al. (2009), the concentrations in products of animal origin (including fish and shellfish) were obtained from the same source (Dutch monitoring programmes; Table 2-1) as in the present study.
The decrease in exposure in the older age group compared to de Mul et al. (2008) may also be due to a decrease in dioxin concentrations. For example, also here the dioxin levels in the two food groups contributing significantly to the exposure (milk and beef) were reduced in the present study (Table 4-2).
However, in de Mul et al. (2008), concentrations used were a combination of samples derived from the Dutch monitoring programmes (Table 2-1) and from a survey in which composite samples of foods bought at supermarkets were analysed for dioxins. Because of this, a direct comparison between the used 9 Assigning concentrations to congener levels reported below relevant limit values, no processing effects,
assigning concentrations to foods as recorded in the food consumption survey and statistical model to assess long-term exposure.
dioxin concentrations is not possible and differences should be interpreted with care.
A study into the trend of dioxin concentrations in products of animal origin (except (shell)fish) from 2001-2011 showed that the dioxin concentrations have decreased since 2005-2006 in The Netherlands, although this reduction seems to be at a standstill over the last 3-4 years (Schoss et al., In preparation). This trend analysis was based on the subset of concentration data sent to the EU (section 2.2). European Food Safety Authority (EFSA) has reported a decline in the exposure to dioxins at the European level over the period of 2002-2010 (EFSA, 2012). However, EFSA indicates that this decline should be interpreted with care. The observed reduction may be (partly) influenced by methodological issues, such as differences in used LOD/LOQs over time, and possible pollution of the EFSA database with food products from targeted monitoring programs. Also in the present study, the observed decrease in dioxin concentrations may be influenced by changes in LOD/LOQ over time. However, Schoss et al. (In preparation) observed that for beef and milk samples, a trend analysis over time was suitable since almost no samples were below the limit value and the
difference in LB and UB dioxin concentrations was marginal. This was also true in the present study, and could also be applicable to shellfish and eggs
(Appendix C).
A possible additional explanation for the observed reduction in exposure to dioxins compared to de Mul et al. (2008) was the use of updated food
consumption data. In de Mul et al. (2008), food consumption data of the third DNFCS were used to estimate the exposure to dioxins. This dataset contains food consumption data that were collected in 1997/1998. A comparison between the DNFCS of 1987 and 2007-2010 (used in this report) showed a shift in the consumption of full-fat dairy products to semi-skimmed and skimmed types (Geurts et al., 2013). As milk is a major contributor to the dioxin exposure in the Dutch population, this shift in consumption may have resulted in a
decreased exposure to dioxins. In addition, a shift in consumption of margarine to low-fat butter/margarine products was observed. It is however not clear whether these changes in consumption also occurred between DNFCS 1997/1998 (used in de Mul et al. (2008)) and the present study. For other important products, such as meat and fish, no relevant changes in consumption were observed (Geurts et al., 2013).
Another difference between the earlier studies and the present study is the use of weighing factors to correct for small deviances in socio-demographic factors and season for both populations, and additionally for day of the week for the age group of 7 to 69 years. Running the exposure assessment for both populations without these factors showed however that the exposure results were hardly affected (data not shown). The difference in exposure could therefore not be explained by the use of these factors.
4.2 Methodological issues
The different sources that contribute to the total uncertainty of the exposure assessment to dioxins in this report are summarized in Table 4-3, including the direction and magnitude of the uncertainty, using the format as proposed by EFSA (2006). This table addresses the most important sources contributing to the uncertainty of the exposure assessment.
Food consumption data
The food consumption data used in this assessment were the most recent food consumption data available for the Netherlands. Due to the use of correction factors for small deviances in socio-demographic factors and season for both populations, and additionally for day of the week for persons aged 7 to 69 years, the exposure results are representative for the Dutch population aged 2 to 69 years.
Concentration data
Dioxin concentrations in products of animal origin were the most recent data available in the Netherlands. These samples are collected on a yearly basis. By using only the results that are reported to the EU within the framework of the EU monitoring of background levels of dioxins, dioxin-like PCBs, non-dioxin-like PCBs and flame retardants in foodstuffs it was ensured that the data were non-targeted. This was also true for the samples of products of vegetable origin, which were analysed as part of different research studies into dioxin
concentrations in food. Samples of fish and shellfish were also non-targeted, and included both farmed and wild types. For (North Sea) crab, all results were used in the assessment, including analyses performed in body, claws and legs. As mainly meat present in legs and claws are consumed, the use of all
concentration data analysed in crab may have resulted in an overestimation of the exposure, due to higher dioxin levels in the body. However, because of the low contribution of crab (including lobster and oyster) to the overall dietary exposure to dioxins (<5%), we expect that this has not significantly affected the results.
In the assessment, the dioxin concentrations of the three most recent years (2010-2013) were used to increase the number of concentrations included in the assessment, as well as to address natural variation in dioxin concentrations between years. During these years no trend in lower or higher concentrations over time were observed (data not shown).
The dioxin concentrations analysed in samples of vegetable oils and fats, vegetables, fruits, potato and wheat refer to data sampled before 2006 (Table 2-1). Given the observed decline in dioxin concentrations in products of animal origin (Table 4-2), these data may no longer be representative for the current dioxin concentrations in these products, and their use may have resulted in an overestimation of the exposure. However, the contribution of these
products, except for vegetable oils and fats, to the overall exposure to dioxins was very low (Figure 3-1 and 3-2). The use of possibly lower concentrations may therefore not necessarily result in lower exposure estimates in both age groups. This is however not true for vegetable oils and fats, given the relatively large contribution of this product group to the total exposure in both age groups (Figure 3-1 and 3-2). It is therefore recommended to analyse this product group again to establish whether the concentrations have also decreased and to update the exposure assessment further if needed. This product group is not included in the two Dutch monitoring programmes.
In the exposure assessment, concentrations analysed in wheat were only linked to the consumption of wheat and not to the consumption of other cereals. This may have resulted in an underestimation of the exposure. We however expect that the underestimation will be negligible given the very low concentration of dioxin in wheat (Appendix C). Furthermore, wheat is the major cereal consumed
in the Netherlands10. Neglecting the consumption of the other cereals is therefore not expected to affect the exposure estimate significantly.
To assess the uncertainty related to the concentrations assigned to congeners analysed at a concentration below a limit value, we also calculated the exposure assigning either zero (lower bound (LB) scenario) or the limit value itself (upper bound (UB) scenario) to products of animal origin and vegetable oils and fats (section 2.4). The exposure levels in the LB scenario were on average a factor 0.8 lower, whereas those of the UB scenario a factor 1.2 higher (Appendix F). The main contributor to this uncertainty was the product group vegetable oils and fats. The difference between the LB and UB dioxin concentrations was highest in this product group (Appendix C), resulting in a significant difference in its contribution to the total dioxin exposure in the LB and UB scenario’s vs. MB scenario. In the LB scenario, the contribution dropped to 7% in young children (22% in MB scenario) and 5% in persons aged 7 to 69 years (18% in MB scenario). In the UB scenario, the contribution increased to 28% and 24%, respectively. Use of an analytical method with a lower LOQ could reduce this uncertainty. In addition, information about whether the concentrations were between LOD and LOQ, or below LOD could contribute to this.
Linking food consumption data and concentration data
All analyses available for the exposure assessment were performed in raw products (RACs). To use these analyses in the exposure assessment, a conversion model is needed (see section 2.3). In this model, concentrations analysed in these products are converted into concentrations in the foods recorded in the food consumption surveys using recipe data and subsequently conversion factors to convert ingredients (e.g. flour) to their corresponding RACs (e.g. wheat). Linking concentrations analysed in RACs using the conversion model has the advantage that processed foods are included in the assessment without the need for analysing them separately. Furthermore, analyses in RACs are done as part of different monitoring obligations prescribed in legislation and therefore available without need for additional funding. However, a disadvantage of this approach is that there is no direct link between analysed and consumed foods. As a result, there is always an uncertainty whether the calculated concentrations in foods via the conversion model are representative for the concentrations in the foods actually consumed. In addition, recipes may change over time. These recipes are presently not updated and may therefore not be representative of the foods currently on the market. Furthermore, in the food conversion model variation in recipes and conversion factors is not addressed. Because of these different factors, the use of the food conversion model can result in over- or underestimation of the exposure. It is not possible to indicate which direction is most likely or whether these uncertainties level out in the final exposure estimate.
Another disadvantage of using monitoring data in an exposure assessment is that these data refer to samples that are obtained to monitor compliance with limits set in legislation. These samples may therefore be targeted to products that are expected to exceed these limit values, and may thus not be
representative of the concentrations people are exposed to in daily life. As discussed above, we judge that this is of limited relevance in the present study.
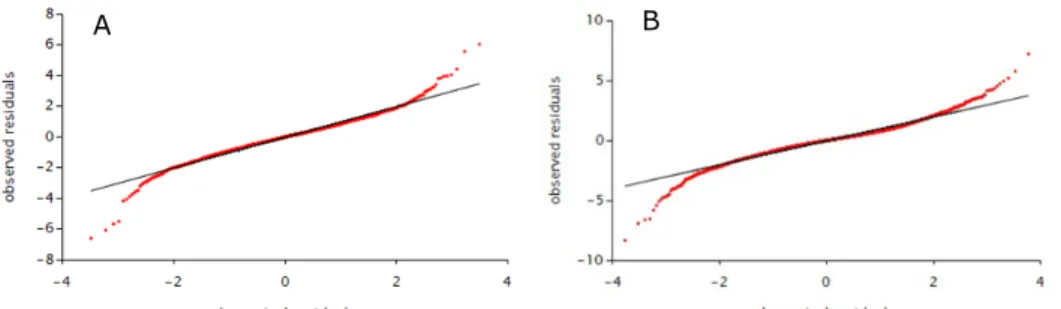
Figure 4-1. Observed vs. theoretical residuals of the positive daily exposure distribution to dioxins in children aged 2 to 6 years (A) and persons aged 7 to 69 years (B) in the Netherlands in which congener concentrations below limit of detection (LOD) or quantification (LOQ) equalled ½LOD or ½LOQ, except for vegetables, fruits, potato and wheat samples for which congener concentrations below LOD or LOQ equalled zero.
Modelling of exposure
To model the exposure to dioxins LNN was used (Appendix D). Like other models, LNN is based on the assumption that daily positive exposures are normally distributed after transformation. A normal distribution is a prerequisite for removal of the within-person’s variation from the daily positive exposure distribution (Appendix D). If this condition is not met, the use of LNN might be debatable or not fit for purpose. Normality can be checked by using the normal quantile–quantile (q–q) plot, a graphical display of observed vs. theoretical residuals (de Boer et al., 2009). Figure 4-1 shows the q-q plot for the daily positive exposure distribution to dioxins in young children (left panel) and persons aged 7 to 69 years (right panel). The distribution can be considered close to normal when the observed vs. theoretical residuals (in red) follow approximately a straight line. For the central part of both daily positive exposure distributions a normal distribution was a reasonable assumption, but in the tails (both upper and lower) the fit deteriorated quickly (Figure 4-1). In the upper tail, of interest when dealing with adverse chemicals such as dioxins, the model tended to underestimate the exposure in both age groups (Figure 4-1). The P97.5 and P99 of exposure correspond with theoretical residuals of 2 and 2.3, respectively. The q-q plots show that these residuals were still reasonably approximated by a normal distribution in both age groups, justifying the use of LNN to model the long-term exposure to dioxins.
Health based guidance level
For the indication of a possible health concern, the P99 of exposure was compared to the pTDI of 2 pg TEQ/kg bw per day, as derived by the Scientific Committee of Food (SCF, 2001). Recently, the Environmental Protection Agency (EPA) in the US (2012) derived a “Reference Dose” (RfD) of 0.7 pg TEQ/kg bw per day (US EPA, 2012). This health based guidance value is based on two epidemiological, human studies, and indicates that toxicity of dioxins in humans may be underestimated when using the pTDI. However, a definitive decision on the relevance of this lower health based guidance value needs a careful
evaluation at the European level (EFSA).
In persons aged 2 to 69 years, the P99 of exposure did not exceed the pTDI of 2 pg TEQ/kg bw per day: percentage of persons exceeding the pTDI < 1% for all ages (Table 3-2). Given the uncertainty due to the sampling size of the food consumption and concentration data, the percentage of 2-year olds exceeding this health based guidance level could be as high as 2.0%.
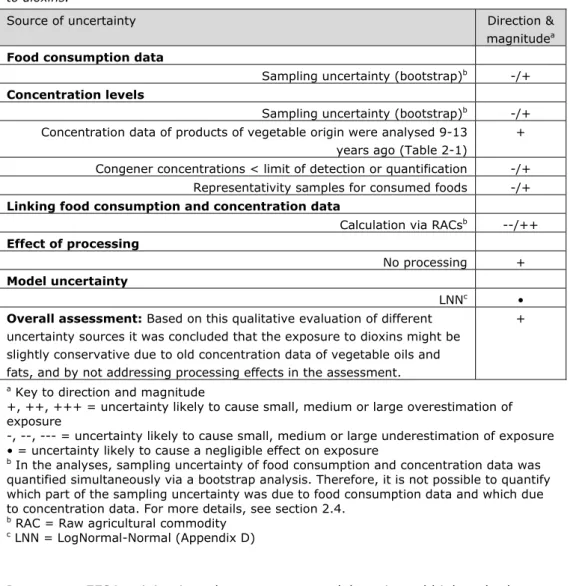
Table 4-3. Sources, direction and magnitude of uncertainty in dietary exposure assessment to dioxins.
Source of uncertainty Direction & magnitudea
Food consumption data
Sampling uncertainty (bootstrap)b -/+
Concentration levels
Sampling uncertainty (bootstrap)b -/+
Concentration data of products of vegetable origin were analysed 9-13 years ago (Table 2-1)
+ Congener concentrations < limit of detection or quantification -/+
Representativity samples for consumed foods -/+
Linking food consumption and concentration data
Calculation via RACsb --/++
Effect of processing
No processing +
Model uncertainty
LNNc •
Overall assessment: Based on this qualitative evaluation of different
uncertainty sources it was concluded that the exposure to dioxins might be slightly conservative due to old concentration data of vegetable oils and fats, and by not addressing processing effects in the assessment.
+
a Key to direction and magnitude
+, ++, +++ = uncertainty likely to cause small, medium or large overestimation of exposure
-, --, --- = uncertainty likely to cause small, medium or large underestimation of exposure • = uncertainty likely to cause a negligible effect on exposure
b In the analyses, sampling uncertainty of food consumption and concentration data was
quantified simultaneously via a bootstrap analysis. Therefore, it is not possible to quantify which part of the sampling uncertainty was due to food consumption data and which due to concentration data. For more details, see section 2.4.
b RAC = Raw agricultural commodity c LNN = LogNormal-Normal (Appendix D)
In a recent EFSA opinion into the exposure to polybrominated biphenyl ethers (PBDE), the P95 of exposure was used to determine whether the latter indicated a health concern for ”high consumers” (EFSA, 2011). As mentioned above in the present study, an even more strict ”high consumer” criterion, i.e. the P99 of exposure, was used. Furthermore, maximally 2.0% of the 2-year olds exceeded the pTDI and maximally 0.1% of the 7 to 69-year olds. In accordance with EFSA’s risk characterisation of PBDEs, we conclude that the exposure to dioxins in 2 to 69-years olds in the Netherlands does not indicate a health concern.
Summary
The different issues contributing to the uncertainty of the exposure estimates are summarized in Table 4-3. Overall, the estimated exposure to dioxins may be slightly overestimated due to the use of old concentration data of vegetable oils and fats and by not addressing processing effects.
4.3 Conclusion
The long-term dietary exposure to dioxins has decreased since the two previous studies performed in 2008 and 2009. The percentage of persons exceeding the pTDI < 1% for persons aged 2 to 69 years (Table 3-2). Given the uncertainty due to the sampling size of the food consumption and concentration data, the
percentage of 2-year olds exceeding this health based guidance value could be as high as 2.0% (Table 3-2). The exposure to dioxins in 2 to 69-years olds in the Netherlands does therefore not indicate a health concern. The decrease in exposure compared to the two earlier studies is very likely due to a reduction in dioxin concentrations (Table 4-2). Changes in dietary patterns, and especially the shift of consumption of full-fat milk products to semi-skimmed and skimmed, may also have contributed to a reduction in exposure to dioxins over time in the older age group.
In the assessment, concentration data of products of vegetable origin were used that were analysed 9 to 13 years ago (Table 2-1). Given the decline in dioxin concentrations in products of animal origin (Table 4-2) and the high contribution of vegetable oils and fats to the total dietary exposure to dioxins, it is
recommended that this product group is analysed to establish whether the concentrations have also decreased and to update the exposure assessment further if needed. As this product group is not part of the Dutch monitoring programmes, this should be done in a separate survey. Given the low
contribution of the other products of vegetable origin to the overall exposure to dioxins, we do not expect that updated concentrations for these products will result in a lower exposure estimate. Additionally, the exposure assessment can be refined by including the effect of food preparation on dioxin concentrations in the assessment.
The exposure estimates reported here are the most recent ones on the
background exposure to dioxins via food in the Netherlands covering the whole population. The estimates can be used to refine exposure assessments
performed in the past couple of years based on incidents in which high dioxin concentrations were detected in, for example, eggs of private (non-commercial) farmers. Estimates can also be used to address new incidents that may occur in the future.
Acknowledgements
The authors would like to thank Bas Bokkers, Marco Zeilmaker, Teetske van Gorcum and Esther Brandon of the RIVM for their valuable comments on the almost final version of the letter report, and the RIKILT-Institute of Food Safety for providing the concentration data on dioxins in products of animal origin.
References
Boon, P.E., Bakker, M.I., van Klaveren, J.D., van Rossum, C.T.M. (2009) Risk assessment of the dietary exposure to contaminants and pesticide residues in young children in the Netherlands. RIVM report 350070002. National Institute for Public Health and the Environment (RIVM), Bilthoven. Available online:
www.rivm.nl.
de Boer, W., Goedhart, P.W., Hart, A., Kennedy, M.C., Kruisselbrink, J., Owen, H., Roelofs, W., van der Voet, H. (2013) MCRA 8.0 a web-based program for Monte Carlo Risk Assessment. Reference Manual. December 2013. Biometris, Wageningen UR, National Institute for Public Health and the Environment (RIVM) and Food and Environmmental Research Agency (Fera), Wageningen, Bilthoven, The Netherlands and York, UK.
de Boer, W.J., van der Voet, H., Bokkers, B.G.H., Bakker, M.I., Boon, P.E.(2009) Comparison of two models for the estimation of usual intake addressing zero consumptions and non-normality. Food Additives and Contaminants: Part A 26: 1433-1449.
de Mul, A., Bakker, M.I., Zeilmaker, M.J., Traag, W.A., van Leeuwen, S.P.J., Hoogenboom, L.A.P., Boon, P.E., van Klaveren, J.D.(2008) Dietary exposure to dioxins and dioxin-like PCBs in the Netherlands anno 2004. Regulatory
Toxicology and Pharmacology 51: 278-287.
Efron B (1979). Bootstrap methods: another look at the jackknife. Annals of Statistics 7: 1-26.
Efron B, Tibshirani R (1993) An introduction to the bootstrap. New York: Chapman & Hall.
EFSA (2006) Opinion of the Scientific Committee related to uncertainties in dietary exposure assessment. The EFSA Journal 438: 1-54. Available online:
www.efsa.europa.eu.
EFSA (2011) Opinion on polybrominated diphenyl ethers (PBDEs) in food. EFSA Journal 9(5):2156. [274 pp.]. Available online: www.efsa.europa.eu.
EFSA (2012) Update of the monitoring of levels of dioxins and PCBs in food and feed. EFSA Journal 10(7):2832. [82 pp.]. Available online: www.efsa.europa.eu. Geraets, L., te Biesebeek, J.D., van Donkersgoed, G., Koopman, N., Boon, P.E.(2011) The intake of acrylamide, nitrate and ochratoxin A in the population aged 7 to 69 years living in the Netherlands. RIVM Letter report 12949A01. National Institute for Public Health and the Environment (RIVM), Bilthoven. Geurts, M., van Rossum, C.T.M., Brants, H., Verkaik-Kloosterman, J.,
Westenbrink, S (2013) Veranderingen in het aanbod van voedingsmiddelen en de voedselconsumptie. Resultaten gebaseerd op bijna 25 jaar
voedselconsumptieonderzoek. RIVM rapport 090429001. Rijksinstituut voor Volksgezondheid en Milieu (RIVM), Bilthoven. Available online: www.rivm.nl.
Goedhart, P.W., van der Voet, H., Knüppel, S., Dekkers, A.L.M., Dodd, K.W., Boeing, H., van Klaveren, J.D. (2012) A comparison by simulation of different methods to estimate the usual intake distribution for episodically consumed foods. Supporting Publications 2012:EN-299. [65 pp.]. Available online:
www.efsa.europa.eu/publications.
Hoogerbrugge, R., Bakker, M.I., Hijman, W.C., Den Boer, A.C., Den Hartoge, R.S., Baumann, R.A. (2004) Dioxins in Dutch vegetables. RIVM report 310305003. National Institute for Public Health and the Environment (RIVM), Bilthoven. Available online: www.rivm.nl.
Ocké, M.C., van Rossum, C.T.M., Fransen, H.P., Buurma, E.J.M., de Boer, E.J., Brants, H.A.M., Niekerk, E.M., van der Laan, J.D., Drijvers, J.J.M.M.,
Ghameshlou, Z. (2008) Dutch National Food Consumption Survey - Young children 2005/2006. RIVM report 350070001. National Institute for Public Health and the Environment (RIVM), Bilthoven. Available online: www.rivm.nl.
SCF (2001) Opinion of the Scientific Committee on Food in the risk assessment of dioxins and dioxin-like PCBs in food (update based on new scientific
information available since the adoption of the SCF opinion of 22nd November 2000, Adopted on 30 May 2001). CS/CNTM/DIOXIN/20 final. European Commission, Brussels. Available online: ec.europa.eu/food/fs/sc/scf.
Schoss, S., Adamse, P., Immerzeel, J., Prortier, L., Traag, W.A., Hoogenboom, L.A.P. (2001-2011) In preparation. Levels of dioxins and dioxin-like PCBs in food of animal origin in the Netherlands during the last decade.
Traag, W.A., Hoogenboom, L.A.P. (2006) Onderzoek naar dioxinegehaltes in door particulieren geteelde groenten en fruit afkomstig uit de Rijnmond RIKILT report 2006.012. RIKILT- Instituut voor Voedselveiligheid, Wageningen UR, Wageningen. Available online: www.rikilt.wur.nl.
US EPA (2012) EPA's reanalysis of key issues related to dioxin toxicity and responses to NAS comments, Volume 1 (CAS No. 1746-01-06). EPA/600/R- 10/038F. U.S. Environmental Protection Agency, Washington, DC. Available online: www.epa.gov/iris.
van den Berg, M., Birnbaum, L.S., Denison, M., De Vito, M., Farland, W., Feeley, M., Fiedler, H., Hakansson, H., Hanberg, A., Haws, L., Rose, M., Safe, S., Schrenk, D., Tohyama, C., Tritscher, A., Tuomisto, J., Tysklind, M., Walker, N., Peterson, R.E. (2006) The 2005 World Health Organization reevaluation of human and mammalian toxic equivalency factors for dioxins and dioxin-like compounds. Toxicological Sciences 93: 223-241.
van Dooren, M.M.H., Boeijen, I., van Klaveren, J.D., van Donkersgoed, G.(1995) Conversie van consumeerbare voedingsmiddelen naar primaire agrarische produkten. RIKILT rapport 95.17. RIKILT-Instituut voor Voedselveiligheid, Wageningen UR, Wageningen. Available online: www.rikilt.wur.nl.
van Klaveren, J.D., Goedhart, P., Wapperom, D., van der Voet, H. (2012) A European tool for usual intake distribution estimation in relation to data
collection by EFSA. External Scientific Report. Supporting Publications 2012:EN- 300. [42 pp.]. Available online: www.efsa.europa.eu/publications.
van Rossum, C.T.M., Fransen, H.P., Verkaik-Kloosterman, J., Buurma-Rethans, E.J.M., Ocké, M.C. (2011) Dutch National Food Consumption Survey 2007-2010. Diet of children and adults aged 7 to 69 years. RIVM report 350050006. National Institute for Public Health and the Environment (RIVM), Bilthoven. Available online: www.rivm.nl.
Appendix A Description of consumption data used in the
exposure assessment to dioxins
DNFCS-Young Children 2005/2006 (Ocké et al., 2008)
The target population of the DNFCS-Young Children 2005/2006 consisted of boys and girls aged 2 to 6 years living in the Netherlands. Respondents were selected from representative consumer panels of Market Research Agency GfK. Panel characteristics, such as socio-demographic characteristics, are known to GfK. Persons in these panels participate in all types of surveys and were not specially selected on nutritional characteristics. Institutionalised persons were excluded, as well as children whose parents/carers did not have sufficient knowledge of the Dutch language. Per family, only one child was included to avoid correlations in dietary consumption patterns between children of the same family. In total, 1,634 children were invited to participate in the study, of which 1,279 consented (net response of 78%). During recruitment, the
representativeness of the study population was monitored and, if necessary, the recruitment was adjusted for age and sex, education of the head of the
household, level of urbanisation, place of residence and region. The study population was representative regarding socio-demographic characteristics (including region and education of the head of the household), but densely populated areas were slightly underrepresented.
The food consumption data were collected in the period October 2005 to November 2006 via a food diary on two non-consecutive days (separated by about 8 to 13 days). Parents/carers were visited at home by a trained employee of GfK. During the home visit survey materials were presented and overall instructions were given.
Portion size of the foods and meals were estimated by using photographs, domestic measures (a small and a large spoon were supplied to standardise estimates), standard units, weight and/or volume. The usual volume of cups and glasses used was measured by the carer. All days of the week were equally represented, but the winter and autumn period were slightly overrepresented compared to the spring and summer period. National and/or religious holidays or holidays of the participants were not included in the survey.
DNFCS 2007-2010 (van Rossum et al., 2011)
The target population of the DNFCS 2007-2010 consisted of people aged 7 to 69 years living in the Netherlands. Pregnant and breast-feeding women, as well as institutionalised people were not included. Respondents were selected from representative consumer panels of GfK. A maximum of one person per
household was included in the survey to avoid correlations in dietary
consumption patterns between members of the same family. In addition, the panels only included people with sufficient knowledge of the Dutch language. In total, 5,502 individuals were invited to participate in the study, of which 3,819 consented (net response of 69%). Children were overrepresented in the study population and adults underrepresented.
The food consumption data were collected over a 3-year period from March 2007 to April 2010 via two non-consecutive 24-hour dietary recalls (separated by 2 to 6 weeks). Children aged 7 to 15 years were interviewed face to face during home visits in the presence of at least one of the child’s parents or carers.
Participants aged 16 and over were interviewed by telephone, at dates and times unannounced to the participants.
Portion sizes of the foods consumed were quantified in several ways: by means of quantities as shown on photos in a provided picture booklet, or in household measures, standard units, by weight and/or volume. The survey covered all days of the weeks and all four seasons. National and/or religious holidays or holidays of the participants were not included in the survey.
Appendix B Toxic equivalence factors (TEFs)
Congener WHO 2005 TEFa
Chlorinated dibenzo-p-dioxins 2,3,7,8-TCDD 1 1,2,3,7,8-PeCDD 1 1,2,3,4,7,8-HxCDD 0.1 1,2,3,6,7,8-HxCDD 0.1 1,2,3,7,8,9-HxCDD 0.1 1,2,3,4,6,7,8-HpCDD 0.01 OCDD 0.0003 Chlorinated dibenzofurans 2,3,7,8-TCDF 0.1 1,2,3,7,8-PeCDF 0.03 2,3,4,7,8-PeCDF 0.3 1,2,3,4,7,8-HxCDF 0.1 1,2,3,6,7,8-HxCDF 0.1 1,2,3,7,8,9-HxCDF 0.1 2,3,4,6,7,8-HxCDF 0.1 1,2,3,4,6,7,8-HpCDF 0.01 1,2,3,4,7,8,9-HpCDF 0.01 OCDF 0.0003 Non-ortho-substituted PCBs 3,3’,4,4’-tetraCB (PCB 77) 0.0001 3,4,4’,5-tetraCB (PCB 81) 0.0003 3,3’,4,4’,5-pentaCB (PCB 126) 0.1 3,3’,4,4’,5,5’-hexaCB (PCB 169) 0.03 Mono-ortho-substituted PCBs 2,3,3’,4,4’-pentaCB (PCB 105) 0.00003 2,3,4,4’,5-pentaCB (PCB 114) 0.00003 2,3’,4,4’,5-pentaCB (PCB 118) 0.00003 2’,3,4,4’,5-pentaCB (PCB 123) 0.00003 2,3,3’,4,4’,5-hexaCB (PCB 156) 0.00003 2,3,3’,4,4’,5’-hexaCB (PCB 157) 0.00003 2,3’,4,4’,5,5’-hexaCB (PCB 167) 0.00003 2,3,3’,4,4’,5,5’-heptaCB (PCB 189) 0.00003
Appendix C Total number of samples analysed and the mean
dioxin concentration following three scenarios of assigning
dioxin concentrations to congener concentrations below limit
of detection (LOD) or quantification (LOQ)
Product (group) Nr of
samples Mean concentration (in pg WHO-TEQ/g product or fat)
LB scenarioa MB scenariob UB scenarioc
Vegetable oils and fats
(per g product)
Peanut oil 1 0.0465 0.179 0.312 Coconut oil 1 0.0465 0.179 0.312 Maize germ oil 1 0.0465 0.179 0.312 Maize/corn oil 1 0.0465 0.179 0.312 Olive oil 1 0.0465 0.179 0.312 Palm kernel oil 1 0.0465 0.179 0.312 Soya bean oil 1 0.0465 0.179 0.312 Sun flower oil 1 0.00014 0.137 0.275 Vegetable oils and fats 1 0.0465 0.179 0.312
Potato (per g product) 1 0.0001 0.0001 0.0001 Wheat (per g product) 1 0.0001 0.0001 0.0001 Meat (per g fat)
Meat of cow (beef) 52 0.727 0.755 0.783 Liver of cow 3 4.12 4.14 4.15 Pork meat 65 0.032 0.11 0.187 Pork liver 5 0.446 0.505 0.563 Meat of sheep 33 1.41 1.42 1.43 Meat of horse 4 6.0 6.0 6.0 Meat of calf 30 0.415 0.455 0.495 Meat of veal calf 2 0.49 0.51 0.531 Meat of chicken 5 0.169 0.231 0.293 Meat of other poultry 3 0.043 0.149 0.255 Meat of goat 3 0.508 0.539 0.569 Meat of deer (farmed) 6 2.89 2.89 2.90
Meat of rabbit (tame) 1 0.116 0.192 0.269
Cow’s milk (per g fat) 41 0.589 0.613 0.638 Egg (per g fat) Egg yolk 62 0.535 0.573 0.611 Fish (per g product) Eel 9 1.55 1.57 1.6 Flounder 2 1.04 1.06 1.09 Trout 3 0.125 0.199 0.274 Cod 7 0.21 0.278 0.346 Herring 5 0.796 0.821 0.847 Gurnard (king) 1 0.365 0.442 0.519 Mackerel 2 0.767 0.836 0.904 Pangasius 3 0.00862 0.0903 0.172 Dab 2 0.35 0.407 0.464 Plaice 3 0.213 0.273 0.333 Tilapia 3 0.00833 0.0901 0.172 Sole 3 0.256 0.32 0.385 Salmon 6 0.57 0.622 0.673 Bass 2 2.09 2.11 2.12
Product (group) Nr of
samples Mean concentration (in pg WHO-TEQ/g product or fat)
LB scenarioa MB scenariob UB scenarioc
Shellfish (per g product) Crab 3 11.1 11.1 11.1 Shrimps 8 1.05 1.06 1.08 Mussel 4 0.981 1.01 1.03 Fruitsd (per g product) 40 0.005 0.005 0.005 Vegetables (per g product) Root/tuber vegetables 10 0.0002 0.0002 0.0002 Other vegetables (incl. mushrooms)e 52 0.001 0.001 0.001 a LB = lower bound, congener concentrations below LOD or LOQ were assigned a
concentration of 0 pg TEQ/kg fat or product.
b MB = medium bound, congener concentrations below LOD and LOQ equalled ½LOD or
½LOQ, except for vegetables, fruits, potato and wheat for which congener concentrations below LOD or LOQ equalled zero.
c UB = upper bound, congener concentrations below LOD or LOQ equalled LOD or LOQ,
except for vegetables, fruits, potato and wheat for which congener concentrations below LOD or LOQ equalled zero.
dGrapefruit, mandarin/clementine, pear
Appendix D Modelling of long-term exposure using LNN
LNN models exposure frequencies and exposure amounts separately, followed by an integration step (Goedhart et al., 2012). For the consumption frequencies, LNN fits a logistic regression model to the number of days with consumption per individual, providing both an estimate of the mean consumption frequency and of the variation between individuals in this frequency (dispersion factor). For the modelling of the positive amounts, LNN first transforms the positive daily exposure distribution into a more normal distribution using a logarithmic or power function. Then, a normal-distribution based variance components model is fitted to remove the within-person’s variation. The resulting between-person normal distribution is then back-transformed and combined with the exposure frequency distribution to estimate the long-term dietary exposure distribution. This is achieved by sampling a large number of times from both the exposure frequency distribution and the back-transformed positive exposure distribution (Monte Carlo integration). In this report, we used a logarithmic transformation for the positive daily exposure distribution. The correlation between intake frequency and amount was assumed zero.
Appendix E Description of the bootstrap
There are different sources of uncertainty in dietary exposure assessments. One of these sources is the uncertainty due to the limited size of the dataset. The smaller the dataset, the more uncertain the data are. This uncertainty can be quantified by using the bootstrap method (Efron, 1979; Efron and Tibshirani, 1993).
With this method a bootstrap database is generated of the same size as the original database for both the food consumption and concentration database by sampling with replacement from the original datasets. These bootstrap
databases are considered as databases that could have been obtained from the original population if another sample was randomly drawn. These two bootstrap databases are then used for the exposure calculations and derivation of the relevant percentiles. Repeating this process many times results in a bootstrap distribution for each percentile that allows for the derivation of confidence intervals around it. The bootstrap approach was used in this report by
generating 100 food consumption and 100 concentration bootstrap databases and calculating the chronic or acute (with at least 10,000 iterations each) dietary exposure. Of the resulting bootstrap distributions per percentile a 95% uncertainty interval was calculated by computing the 2.5% and 97.5% points of the empirical distribution.
Note that by bootstrapping both the consumption and concentration database in one analysis it is not possible to quantify which part of the uncertainty was due to a limited number of consumption or concentration data.
Netherlands following two scenarios of assigning dioxin concentrations to congener concentrations below
limit of detection (LOD) or quantification (LOQ)
Age (years) Percentiles of exposure (pg TEQ/kg bw per day)
LB scenarioa UB scenariob P50 P90 P95 P99 P50 P90 P95 P99 2 0.8 [0.7-0.9] 1.2 [1.1-1.3] 1.3 [1.2-1.5] 1.7 [1.5-1.9] 1.3 [1.2-1.3] 1.7 [1.6-1.9] 1.9 [1.7-2.0] 2.3 [2.0-2.5] 3 0.7 [0.7-0.8] 1.1 [1.0-1.2] 1.2 [1.1-1.4] 1.5 [1.4-1.7] 1.2 [1.1-1.2] 1.6 [1.5-1.8] 1.8 [1.7-1.9] 2.1 [1.9-2.3] 4 0.7 [0.6-0.7] 1.0 [0.9-1.1] 1.2 [1.0-1.3] 1.4 [1.2-1.6] 1.1 [1.0-1.2] 1.5 [1.4-1.6] 1.7 [1.5-1.8] 2.0 [1.8-2.2] 5 0.6 [0.6-0.7] 1.0 [0.8-1.0] 1.1 [0.9-1.2] 1.3 [1.2-1.5] 1.1 [1.0-1.1] 1.4 [1.3-1.6] 1.6 [1.5-1.7] 1.9 [1.7-2.1] 6 0.6 [0.5-0.7] 0.9 [0.8-1.0] 1.0 [0.9-1.1] 1.2 [1.1-1.4] 1.0 [0.9-1.0] 1.4 [1.3-1.5] 1.5 [1.4-1.6] 1.8 [1.6-1.9] 7-69 0.4 [0.3-0.4] 0.7 [0.6-0.7] 0.8 [0.7-0.9] 1.1 [1.0-1.2] 0.6 [0.6-0.6] 1.0 [0.9-1.1] 1.2 [1.1-1.2] 1.5 [1.4-1.6] Note: 2.5% lower - 97.5% upper confidence limits of the percentiles of exposure are reported between brackets.
a LB = lower bound, congener concentrations below LOD or LOQ were assigned a concentration of 0 pg TEQ/kg fat or product.
b UB = upper bound, congener concentrations below LOD or LOQ equalled LOD or LOQ, except for vegetables, fruits, potato and wheat for which congener