Verification of moisture content
in test soils
Letter report 601516016/2009 P.L.A. van Vlaardingen | C.E. Smit
RIVM Letter report 601516016/2009
Verification of moisture content in test soils
P.L.A. van Vlaardingen C.E. Smit
Contact:
P.L.A. van Vlaardingen
Expertise Centre for Substances peter.van.vlaardingen@rivm.nl
2 RIVM Letter report 601516016
© RIVM 2009
Parts of this publication may be reproduced, provided acknowledgement is given to the 'National Institute for Public Health and the Environment', along with the title and year of publication.
Rapport in het kort
Verificatie van vochtgehalte in testgronden
Bij de wetenschappelijke evaluatie van studies naar microbiële afbraak van stoffen in de bodem speelt het bodemvochtgehalte een grote rol. Een te droge of te natte bodem kan de activiteit van de microbiële populatie nadelig beïnvloeden. Het bodemvochtgehalte is dus een belangrijke parameter, maar hij ontbreekt regelmatig in studies. In die gevallen kan het vochtgehalte worden ingeschat vanuit een aantal basisparameters uit de studie en een bestaande, externe vochtkarakterisitiek van een bodemtype. Dit rapport biedt een uitgewerkt methode voor deze verificatie. De basis voor de berekeningen zijn twee verzamelingen van vochtkarakteristieken, bepaald aan grote hoeveelheden Nederlandse en andere Europese bodems. Het rapport biedt verschillende methodes om een vochtgehalte te verifiëren,
gebaseerd op de beschikbare informatie. De uitkomst van de berekening kan worden gebruikt in de beoordeling van het experiment. Bij het rapport horen twee spreadsheets waarmee de in het rapport uitgewerkte berekeningen kunnen worden uitgevoerd. Downloaden van de spreadsheets is mogelijk via de RIVM website ‘Risico’s van stoffen’ (http://www.rivm.nl/rvs/).
Abstract
Verification of moisture content in test soils
In the scientific evaluation of experimental studies on the degradation of substances in soil, the moisture content of the soil is very important. A soil that is too dry or too wet can negatively influence the activity of the microbial population. Soil moisture content is thus an important parameter, but is often not reported. In those cases, it can be estimated by means of a number of basic parameters from the study and external moisture characteristics for a given soil type. This report presents a method to perform this verification. The basis for the calculations are two collections of moisture characteristics, determined on a large number of Dutch and other European soils. In the presented methodology, a moisture characteristic from one of the two collections is selected on the basis of the texture
classification of the test soil. Different verification methods for moisture content are offered, depending on the available information. The outcome of the calculations can be used in the validity assessment of the experiment. The calculations presented in the report can be performed with two spreadsheets that can be downloaded from the RIVM website ‘Risico’s van stoffen’ (http://www.rivm.nl/rvs/).
Acknowledgements
The authors are grateful to Ir. A.M.A. van der Linden, ing. C.J.A.M.Posthuma-Doodeman,
Drs. R.H.L.J. Fleuren and Ir. A.J. Verschoor for careful reading and comments to the manuscript and spreadsheets. Ing. C.J.A.M.Posthuma-Doodeman and Drs. R.H.L.J. Fleuren carefully evaluated the spreadsheets on mathematical integrity and correct implementation of data. We would like to thank Dr. J.H.M. Wösten for comments on the manuscript and spreadsheets and for kindly providing information on both the Staringreeks and HYPRES data.
Contents
1 Introduction 11
2 Moisture content of soils used in laboratory studies 13
3 Estimating particle size fraction at 50 µm 15
3.1 Texture classes 15
3.2 Extrapolation from 63 µm to 50 µm 15
4 Use of class pedotransfer functions 19
4.1 Databases 19
4.1.1 Staringreeks 19
4.1.2 HYPRES 19
4.2 Data used 19
4.3 Estimating test soil moisture content by external verification – using the
spreadsheet application 20
4.3.1 Spreadsheets 20
4.3.2 Prerequisite 20
4.3.3 Use of the spreadsheets 20
5 Description of spreadsheet calculations 25
5.1 Variables used in calculations 25
5.2 Calculations with pF curves 26
5.3 Functioning of the Staringreeks and HYPRES spreadsheets 27
5.3.1 Soil texture class assignment 27
5.3.2 Calculation of pF at applied moisture content 28
5.3.3 Calculation of pF at 75% of field capacity 28
5.3.4 Calculation of moisture content, θ(h), at given pF 29
1
Introduction
The goal of this report is to provide a calculation method that enables a risk assessor to estimate the moisture content of a test soil used in fate or ecotoxicity experiments.
In soil microbial degradation studies it is important that the moisture condition of the soil is optimal, i.e. the soil should not be too dry or too wet. The amount of water in a soil influences e.g. microbial activity: low water content causes high osmotic pressure and reduced microbial activity. The amount of water in a soil, along with a combination of forces1 in the soil-water matrix, brings about a negative
pressure in the soil water. This water pressure is the variable which is often used to express the moisture content of a soil. Research laboratories moisturise the test soil2 in their studies to a prescribed
'target' moisture content, which can be expressed in several ways: e.g. "60% of maximum water holding capacity (MWHC)", "0.75 times field capacity (FC)", "pF 2.5" or "⅓ bar". Since these
standardised expressions are never accompanied by measurements of actual moisture content of the soil used in the degradation tests, there is a need for extra judgement on their validity.
Information on the water retention characteristics of a test soil is also needed for the normalisation of field degradation data to reference moisture conditions, as required according to FOCUS (FOCUS, 2006). For that purpose, the moisture content at pF 2 or 100 % FC has to be estimated.
To facilitate an external verification of the moisture content of test soils, two Microsoft Excel ® spreadsheets were developed. The present report contains background information on the methodology and the calculations employed.
The spreadsheets can be downloaded at the following URL:
http://www.rivm.nl/rvs/Images/Staringreeks_FSM012_v1_tcm35-53192.xls http://www.rivm.nl/rvs/Images/HYPRES_FSM012_v1_tcm35-53193.xls
2
Moisture content of soils used in laboratory studies
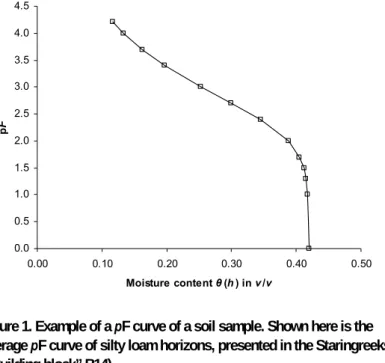
The relationship between (matric) soil water pressure and water content is commonly called a water-retention curve. A common graphical form is the pF curve, of which an example is shown in Figure 1.
0.0 0.5 1.0 1.5 2.0 2.5 3.0 3.5 4.0 4.5 0.00 0.10 0.20 0.30 0.40 0.50 Moisture content θ (h ) in v /v p F
Figure 1. Example of a pF curve of a soil sample. Shown here is the average pF curve of silty loam horizons, presented in the Staringreeks (“Building block” B14).
pF is the logarithm of the absolute value of the soil water pressure, which is plotted against moisture
content, expressed in volume per volume units. In practice, each individual soil sample has a different
pF curve. However, it has been shown that generalisations can be made when a collection of pF curves
for a given soil texture class are averaged, since the relationship between pressure and moisture content is closely related to soil texture. Such averaged pF relationships for soil texture classes are called class pedotransfer functions. In this report, we make use of two collections of class pedotransfer functions: the Staringreeks and the HYPRES (HYdraulic PRroperties of European Soils). Each of these
collections is based on a database containing physical information of soil samples (see sections 4.1.1 and 4.1.2 for more detail on these datasbases).
3
Estimating particle size fraction at 50 µm
3.1
Texture classes
Starting point of the calculations is the characterisation of a test soil with respect to its particle size distribution. To that end, a set of particle size classes (defined by particle size limits) is needed. Different systems of particle size limits are in use in various countries. In the Dutch soil classification system, three texture classes are defined (Table 1, De Bakker and Schelling, 1989). The texture classes of the Dutch system correspond with those of the classification systems of the United States
Department of Agriculture (USDA) and the Food and Agriculture Organisation (FAO). These texture classes were also used to define the soil texture classes distinguished in databases underlying both the Staringreeks and HYPRES (HYdraulic PRroperties of European Soils) (see sections 4.1.1 and 4.1.2).
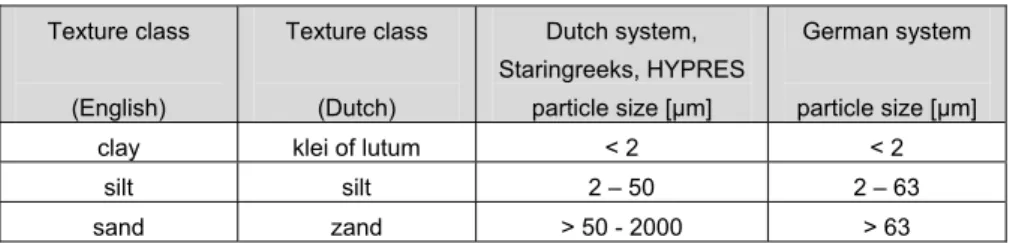
Table 1 Texture classes and particle size limits used in the Dutch soil classification system, the Staringreeks and HYPRES and in Germany.
Texture class (English) Texture class (Dutch) Dutch system, Staringreeks, HYPRES particle size [µm] German system particle size [µm]
clay klei of lutum < 2 < 2
silt silt 2 – 50 2 – 63
sand zand > 50 - 2000 > 63
In the Netherlands, the percentage loam (Dutch: leem) is defined as the particle-size fraction < 50 µm. The percentage loam can be calculated as %loam = %clay + %silt
(In Dutch: %leem = %klei + %silt). Although the category ‘loam’ is not used as a texture class for soil classification in the Netherlands, it is used to categorise the texture classes that are distinguished in the Staringreeks (Wösten et al., 2001).
3.2
Extrapolation from 63 µm to 50 µm
The pedotransfer functions as presented in both the Staringreeks and HYPRES are based on texture classes classified using the size limits 2 µm and 50 µm (see also section 3.1). Several other
16 RIVM Letter report 601516016
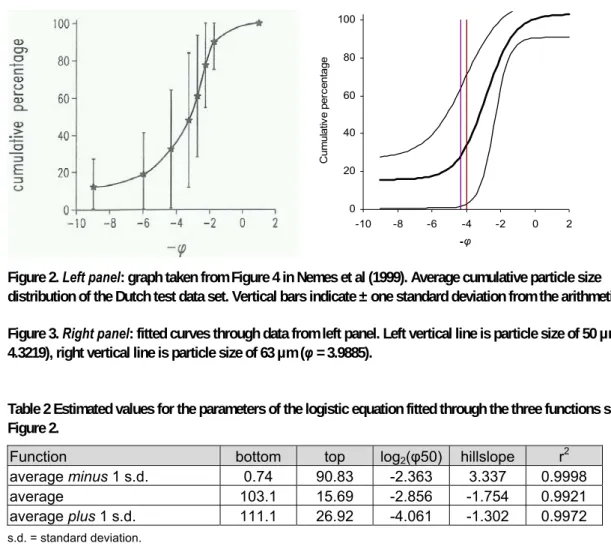
The external dataset used by Nemes et al. consisted of particle size measurements of 3453 individual soil horizons from the Netherlands. A cumulative particle size distribution of all soil horizons in this external data set was published in their paper and is shown in Figure 2.
In Figure 2, φ as plotted on the x-axis, is defined as –log2 (particle size in mm). The relationships shown
Figure 2 (average curve and data points for + or – one standard deviation) were digitised using the software program TechDig (Jones, 1998). A four parameter logistic equation was then fitted through the resulting data sets, thus giving three logistic equations. The fitted equation has the general formula:
y = bottom + (top –bottom)/(1 + 2^((log2(φ50)-x)*hillslope)), in which:
− bottom and top are the lower and upper (asymptotic) values for the cumulative percentage (y-axis) of the logistic curve;
− log2(φ50) is the logarithm (to the base 2) of the median estimate for φ;
− hillslope is the slope of the curve at log2(φ50).
0 20 40 60 80 100 -10 -8 -6 -4 -2 0 2 -φ C um ul at iv e pe rc en ta ge
Figure 2. Left panel: graph taken from Figure 4 in Nemes et al (1999). Average cumulative particle size
distribution of the Dutch test data set. Vertical bars indicate ± one standard deviation from the arithmetic mean. Figure 3. Right panel: fitted curves through data from left panel. Left vertical line is particle size of 50 µm (φ = 4.3219), right vertical line is particle size of 63 µm (φ = 3.9885).
Table 2 Estimated values for the parameters of the logistic equation fitted through the three functions shown in Figure 2.
Function bottom top log2(φ50) hillslope r2
average minus 1 s.d. 0.74 90.83 -2.363 3.337 0.9998
average 103.1 15.69 -2.856 -1.754 0.9921
average plus 1 s.d. 111.1 26.92 -4.061 -1.302 0.9972
Using the parameter estimates as reported in Table 2, we calculated the cumulative percentage of particles at 50 µm (φ = 4.3219) and at 63 µm (φ = 3.9885) for each of the three curves. The resulting functions are shown in Figure 3 and the cumulative percentages are shown in Table 3.
Table 3 Calculated cumulative particle size fractions at 50 and 63 µm, for the three relationships shown in Figure 2 Particle size [µm] φ -φ cumulative % of particles (average − 1s.d.) cumulative % of particles (average) cumulative % of particles (average + 1s.d.) 63 3.9885 -3.9885 2.8 33.3 70.4 50 4.3219 -4.3219 1.7 28.3 64.1 Calculated difference: 1.1 5.0 6.3 s.d. = standard deviation.
The calculated difference between the cumulative percentage of particles at 63 µm and at 50 µm is 1.1 for the relationship “average minus one s.d.”, 5.0 for the average relationship and 6.3 for the
relationship “average plus one s.d.”. This shows that there are considerable uncertainties in this specific extrapolation when all soil horizons are grouped. The method as proposed by Nemes et al. (1999) would be preferable, however for pragmatic reasons (no external data set is available) we propose to use the average calculated difference of 5% from Table 3 as follows:
In order to extrapolate particle size estimations performed using the German system to the Dutch system, add 5% to the sand fraction determined using the German system and subtract 5% from the silt fraction determined using the German system.
Worked example
Particle size distribution using German system:
sand (>63 µm): 65% silt (≥ 2 µm and ≤ 63 µm): 25% clay (<2 µm): 10% Becomes: sand (>50 µm): 70% silt (≥ 2 µm and ≤ 50 µm): 20% clay (<2 µm): 10%
4
Use of class pedotransfer functions
4.1
Databases
4.1.1
Staringreeks
The 'Staringreeks' was derived using a collection of soil-physical characteristics measured on 832 individual soil samples collected in the Netherlands. In Alterra report 153 (Wösten et al., 2001) on water retention and hydraulic characteristics of soils and subsoils in The Netherlands, soil samples were assigned to one of eighteen texture classes (also called building blocks, coded B1 to B18), using the Dutch soil classification system (De Bakker and Schelling, 1989; see section 3.1). Since water retention characteristics for each soil sample are known, a class pedotransfer function for each soil texture class can be calculated. This collection of transfer functions, split in top soils and subsoils, is called the 'Staringreeks' in the rest of this report.
4.1.2
HYPRES
A comparable procedure was followed using soil samples collected over Europe. The database containing these data is called HYPRES (Wösten et al., 1998, Wösten et al., 1999 or
http://www.macaulay.ac.uk/hypres/). In this dataset, six soil texture classes have been distinguished: organic, coarse, medium, medium fine, fine and very fine, based on textural characteristics. Here also, a distinction between top soils and subsoils was made. Hence, this is a collection of six class pedotransfer functions for six soil texture classes, based on 4030 European soil samples.
4.2
Data used
For both the Staringreeks and HYPRES (see sections above for references), the average class pedotransfer functions were reported for the different soil texture classes discerned in the respective datasets. Presented are the values for the optimised parameters of the Mualem-Van Genuchten equation (see section 5.2, Equation 1), so that we can find pF at each given moisture content (in v/v). It is important to note that both databases have classified their in soil texture classes using the same texture class system (see section 3.1).
20 RIVM Letter report 601516016
4.3
Estimating test soil moisture content by external verification – using the
spreadsheet application
4.3.1
Spreadsheets
The two spreadsheets can be downloaded at the following URL:
http://www.rivm.nl/rvs/Images/Staringreeks_FSM012_v1_tcm35-53192.xls http://www.rivm.nl/rvs/Images/HYPRES_FSM012_v1_tcm35-53193.xls
4.3.2
Prerequisite
Assumption: if a soil texture class is assigned to the test soil using identical texture classes (see section 3.1) as used in the two databases Staringreeks and HYPRES, we can approximate its water retention characteristics by using the average water-retention relationship for that soil texture class from the databases.
The methods described in this document are based on the assumption above. It is realised that this approach implies a major generalisation. However, since in general there is no other possibility to verify the moisture content of the soil in an experiment, we use this approach, keeping in mind its limitations.
4.3.3
Use of the spreadsheets
4.3.3.1 Introduction
Using the textural composition of the test soil, viz. percentage sand, percentage clay, percentage silt and in some cases the percentage of organic matter, a soil is assigned a soil texture class of either the Staringreeks or HYPRES.
In a well described experiment, it should be reported that the test soil is moisturised to a given value, which is termed actual moisture content (θact) in the context here. Using the actual moisture content and
the specific pF relationship from the Staringreeks or HYPRES (described as a mathematical function) for the soil texture class that was assigned to the test soil, the pF value of the test soil during the experiment can be approximated. The outcome (pF value of the test soil) is compared to a predefined range of pF values. This range indicates the correct moisture content with respect to microbial acticity for a given soil texture class.
To facilitate unified calculation procedures by all risk assessors, the procedure has been programmed in a user friendly MS Excel® spreadsheet. The pedotransfer functions from both the Staringreeks and HYPRES databases have each been programmed in a separate spreadsheet. These are called Staringreeks_FSM012_v1.xls and HYPRES_FSM012_v1.xls, respectively. Both are equal in calculation options and functionality.
Only one screen is made visible in both spreadsheets, in which all calculations can be performed. If the user wishes to see the underlying calculation, do as follows:
In the Excel spreadsheet, click on Format, in the Excel menu toolbar; then select Sheet and
Unhide. Calculation sheets can be made visible, but spreadsheets are password protected and can not be altered.
In order to hide sheets do the following: click Format in the MS Excel menu toolbar, and then select Format, Sheet, Hide.
4.3.3.2 Stepwise procedure
The calculation to be performed is dependent on the type of information on soil characteristics and moisture content, given in the study report. Since the reported data among various study reports are not uniform, different options for calculations arise. Options are outlined below. In case a spreadsheet is mentioned in the options below, this can be either the Staringreeks or HYPRES spreadsheet. It is up to the user to decide which of the two spreadsheets is preferred, or perhaps, to use both. Four different types of calcuations can be performed with both spreadsheets, which are called ‘Modules’ in the following text.
Option 1
1. In this case, the spreadsheets are not needed. The soil moisture content is brought at such a level, that the matric potential is ⅓ bar, which equals
-339.905 cm water pressure (see section 5.1, last bullet). Hence, pF of the test soil = log(339.905) = 2.53.
2. If deemed necessary, an approximation of the moisture content of the soil can be calculated when the soil characterisation is known (%sand, %silt, %clay and %o.m.).To that end, continue at Option 5.
Option 2
1. Enter the percentages sand, silt, clay and organic matter in Module 1 of the spreadsheet. In the Output box of Module 1, your soil has now been assigned a soil texture class.
2. The other modules of the spreadsheet can not be used.
3. Use Table 4 (Staringreeks) and/or Table 5 (HYPRES), to look up the tabulated pF value at the intersection of the soil texture class (rows) as assigned in Module 1 of the spreadsheet
(description under point 1), and the actual moisture content at which the test soil is brought (columns).
Reported is: soil moisture content is brought to ⅓ bar.
Soil texture characterisation is given: %sand, %silt, %clay and %o.m. Moisture content is given as x% of MWHC or 75% of field capacity. MWHC and field capacity of the test soil are not given.
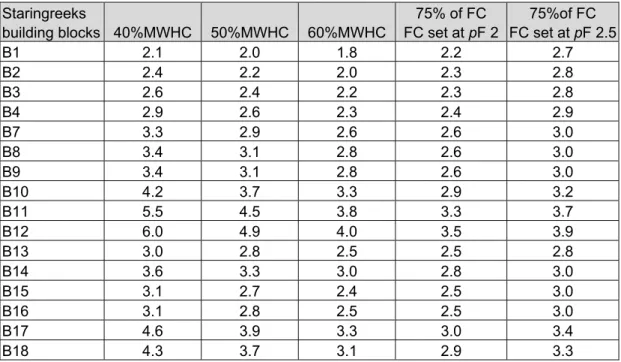
22 RIVM Letter report 601516016 Table 4 pF values for soil texture classes distinguished in the Staringreeks at several levels of moisture content, expressed as moisture content (MWHC) or as pressure head (FC).
Staringreeks building blocks 40%MWHC 50%MWHC 60%MWHC 75% of FC FC set at pF 2 75%of FC FC set at pF 2.5 B1 2.1 2.0 1.8 2.2 2.7 B2 2.4 2.2 2.0 2.3 2.8 B3 2.6 2.4 2.2 2.3 2.8 B4 2.9 2.6 2.3 2.4 2.9 B7 3.3 2.9 2.6 2.6 3.0 B8 3.4 3.1 2.8 2.6 3.0 B9 3.4 3.1 2.8 2.6 3.0 B10 4.2 3.7 3.3 2.9 3.2 B11 5.5 4.5 3.8 3.3 3.7 B12 6.0 4.9 4.0 3.5 3.9 B13 3.0 2.8 2.5 2.5 2.8 B14 3.6 3.3 3.0 2.8 3.0 B15 3.1 2.7 2.4 2.5 3.0 B16 3.1 2.8 2.5 2.5 3.0 B17 4.6 3.9 3.3 3.0 3.4 B18 4.3 3.7 3.1 2.9 3.3
FC = field capacity, MWHC = maximum water holding capacity.
Table 5 pF values for soil texture classes distinguished in HYPRES at several levels of moisture content, expressed as moisture content (MWHC) or as pressure head (FC).
HYPRES classes 40%MWHC 50%MWHC 60%MWHC 75% of FC FC set at pF 2 75%of FC FC set at pF 2.5 Organic 3.9 3.4 3.0 2.8 3.2 Coarse 2.6 2.3 2.0 2.4 2.9 Medium 3.8 3.2 2.8 2.8 3.2 Medium fine 3.7 3.3 3.0 2.7 3.1 Fine 5.5 4.5 3.7 3.3 3.8 Very Fine 5.5 4.6 3.8 3.3 3.8
FC = field capacity, MWHC = maximum water holding capacity.
Option 3
1. Enter the percentages sand, silt, clay and organic matter in Module 1 of the spreadsheet. In the Output box of Module 1, your soil has now been assigned a soil texture class.
2. In Module 2 of the spreadsheet, fill in the MWHC of the test soil, expressed as a percentage. 3. In the next cell (list box), select whether this MWHC is expressed in w/w units (gravimetric
water content) or in v/v units (volumetric water content). Select a value from the list.
4. In the next cell (list box), select the pF value at which the MWHC is determined. The default value is pF 1. Select a value from the list.
5. Enter the MWHC (in %) to which the test soil is moisturised. Soil texture characterisation is given: %sand, %silt, %clay and %o.m. MWHC of the test soil is given.
6. If the MWHC is reported as a gravimetric water content (in w/w units), the dry bulk densitity of the test soil should be entered in Module 2. If this value is not reported, the cell should be cleared and a default value of 1.5 kg.dm-3 will be used in the calculation.
7. In the Output cell of Module 2, the pF of the test soil at θact is shown.
Option 4
1. Enter the percentages sand, silt, clay and organic matter in Module 1 of the spreadsheet. In the Output box of Module 1, your soil has now been assigned a soil texture class.
2. Skip Module 2 and go to Module 3.
3. In Module 3 of the spreadsheet, enter the field capacity θfc. The field capacity is a moisture
content, it should be entered here in %.
4. In the next cell (list box), select whether this field capacity is expressed in w/w units (gravimetric water content) or in v/v units (volumetric water content). Select a value from the list.
5. In the Output cell of Module 3, the pF of the test soil at ¾ of field capacity is shown.
Option 5
Calculation of moisture content at given pF
Module 4 in the spreadsheets offers the possibility to calculate moisture content at a given pF for the soil texture class selected in Module 1. This procedure is in fact an automated ‘reading off the pF curve’. The procedure is not needed for evaluation of studies, but might be useful to gain insight in the shape of the class transfer function used. The Output in this module is moisture content, θ(h), in v/v units.
Soil texture characterisation is given: %sand, %silt, %clay and %o.m. MWHC is given.
Moisture content is given as 75% of field capacity.
Soil texture characterisation is given: %sand, %silt, %clay and %o.m. pF is given.
5
Description of spreadsheet calculations
5.1
Variables used in calculations
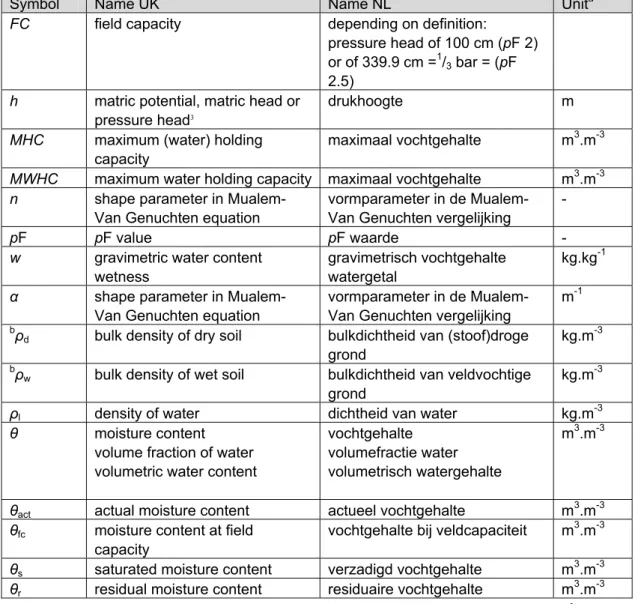
Basic equations used in spreadsheets calculations and their variables are listed in this section. Information is compiled from Koorevaar et al. (1983) and Locher and De Bakker (1990). Table 6 explains the variables used in the sections 5.1, 5.2 and 5.3.
Table 6 Declaration of variables used in the sections 5.1 - 5.3.
Symbol Name UK Name NL Unita
FC field capacity depending on definition:
pressure head of 100 cm (pF 2) or of 339.9 cm =1/3 bar = (pF
2.5)
h matric potential, matric head or pressure head3
drukhoogte m
MHC maximum (water) holding capacity
maximaal vochtgehalte m3.m-3
MWHC maximum water holding capacity maximaal vochtgehalte m3.m-3
n shape parameter in Mualem-Van Genuchten equation
vormparameter in de Mualem-Van Genuchten vergelijking
-
pF pF value pF waarde -
w gravimetric water content wetness
gravimetrisch vochtgehalte watergetal
kg.kg-1
α shape parameter in Mualem-Van Genuchten equation
vormparameter in de Mualem-Van Genuchten vergelijking
m-1 bρ
d bulk density of dry soil bulkdichtheid van (stoof)droge
grond
kg.m-3 bρ
w bulk density of wet soil bulkdichtheid van veldvochtige
grond
kg.m-3
ρl density of water dichtheid van water kg.m-3
θ moisture content
volume fraction of water volumetric water content
vochtgehalte volumefractie water volumetrisch watergehalte
26 RIVM Letter report 601516016
Pressure head h, is a way to express the pressure in soil water; it is usually presented in units of cm.
h is often expressed as its pF value, which is defined as:
)
cm
/
(
log
p
F
=
10−
h
, with h < 0. The volume fraction of water θ, (moisture content) is equal to the ratio of the volume of the liquid phase and the total volume of the soil. It can be expressed using densities:
l d b w b
ρ
ρ
ρ
θ
=
−
In practice, moisture content of a soil is generally determined as wetness w, which is defined as the mass ratio of water to the (dry) solid phase:
d b d b w b
ρ
ρ
ρ
−
=
w
θ and w are related as follows:
w
l d bρ
ρ
θ
=
Using a standard bulk soil density of 1.5 kg.dm-3 and a density of 1 kg.dm-3 for water, this equation is generalised and simplifies to:
w
4
.
1
=
θ
In case bρd (dry bulk density) is determined in a study, it should be used in the above equation,
replacing the value of 1.5.
The relationship between the volume fraction of water and the pressure head is called water characteristic (Dutch: vochtkarakteristiek). A synonym for this relationship is soil water retention curve (Dutch: waterretentiecurve). The relationship is called pF -curve when plotted on a semi-logarithmic scale, with pressure head expressed as pF on the ordinate.
The water content retained in a soil profile after percolation of excess rain or irrigation water is called field capacity (Dutch: veldcapaciteit). This moisture content differs per soil texture class and in the field situation, it is also dependent on the height of the groundwater table. The matric potential at field capacity differs per soil texture class, and can vary considerably around an average value of pF = 2. For practical reasons pF at field capacity is often set at 2 or 2.5. Recalculation of 1/3 bar to cm water pressure.
1 bar = 105 Pa (by definition) = 105 N.m-2 = 10 N.cm-2.
Further, 1 kg = 9.80665 N (by definition) or 1 N = 1/9.80665 kg. Hence, 1/3 bar = 10/3 × 1/9.80665 = 0.339905 kg.cm-2 = 339.905 g.cm-2. Using a density for water of 1 kg.dm-3 = 1 g.cm-3, to convert g to cm3, gives: 1/3 bar = 339.905 cm water. The corresponding pF = 2.53.
5.2
Calculations with pF curves
In order to calculate a pF value at a given (‘actual’) moisture content of a test soil, the closed form equation published by Van Genuchten (1980), also known as the ‘Mualem-Van Genuchten’ equation, is used by Wösten et al. (2001) to describe water retention curves:
n n
h
h
/ 1 1 r s r)
1
(
)
(
−+
−
+
=
α
θ
θ
θ
θ
Equation 1was rewritten to obtain the inverse form, with |h| as a function of θact:
α
θ
θ
θ
θ
θ
n nh
1
)
(
1 1 r act r s act−
⎟
⎟
⎠
⎞
⎜
⎜
⎝
⎛
−
−
=
− Equation 25.3
Functioning of the Staringreeks and HYPRES spreadsheets
Both spreadsheets are set up identically. Methods are described below and differences between the two spreadsheets are highlighted.
5.3.1
Soil texture class assignment
After entering the percentages of soil particles in sand, silt and clay fractions (Dutch system), these value are used to classify the soil according to the ‘building blocks’ (soil texture classes) distinghuised in either the Staringreeks or HYPRES. The texture classification for both systems as published in Wösten et al. (2001) for the Staringreeks and Wösten et al. (1998) and Wösten et al. (1999) for HYPRES, are implemented in the spreadsheets to assign a soil texture class to the test soil. The following additional information to the assignment procedure was obtained from J.H.M. Wösten (personal communication).
Staringreeks
Soils are first subdivided in clay and sandy soils. If %clay >8%, the soil is a clay soil. If %clay <8%, the soil is a sandy soil. Sandy soils are further subdivided according to their loam content and clay soils are subdivided according to clay content (details in Wösten et al., 2001).
Note 1
The soil building blocks B5 (coarse sand) and B6 (boulder clay) cannot be assigned using the spreadsheets developed in this project. This is caused by the fact that the texture classification for B5 and B6 in Wösten et al. (2001) is too indefinite to distinguish these types. However, these two soil texture classes will not be encountered as laboratory test soils used in studies for environmental risk assessments. Therefore soil texture classes B5 and B6 are omitted from the Staringreeks spreadsheet. Note 2
28 RIVM Letter report 601516016
the FAO methodology as described in section 3.2 and Figure 9 of Wösten et al. (1998) is implemented, making use of %clay and %o.m..
Assignment of soil texture classes to the mineral soils is based on %clay and %sand. The implemented classification scheme is described in Wösten et al. 1998 and 1999.
Note. Dividing percentages of soil particles over a soil texture class system is in fact equal to dropping of items in bins of a frequency distribution. In such a bin dropping procedure, a solution for values exactly equal to a class limit should be present. Both underlying references do not give a solution to this problem. The following rule was therefore applied. A class limit can only contain a value when it
functions as a lower limit of a class. One exception is the class limit 100%, which can always contain a value.
Example using HYPRES classes:
− The class Coarse, given as clay <18% is interpreted as 0% ≤ clay < 18%. − The class Medium, given as 18%< clay <35% is interpreted as
18% ≤ clay < 35%.
5.3.2
Calculation of pF at applied moisture content
− User enters MWHC as percentage (MWHC_input).
− User enters % of MWHC to which the testsoil is moisturised (Percentage_MWHC). − User enters whether MWHC is based on v/v or w/w.
− User selects the pF at which the MWHC was determined (pF _at_MWHC). − MWHC_input is recalculated to a fraction (MWHC_fraction).
− If the MWHC is entered as v/v, the MWHC is set equal to MWHC_fraction.
− If the MWHC is entered as w/w, MWHC_fraction is multiplied by a default density of 1.5 L.kg-1 or
by a density entered by the user (result is MWHC_calc).
− If the input cell containing the user defined density is left or made empty, the default density is used.
− Depending on the pF _at_MWHC selected by the user, a correction factor (Correction_factir_MWHC) is selected:
− → if pF _at_MWHC = 0, Correction _factor_MWHC is 1.
− → if pF _at_MWHC = 1, Correction _factor_MWHC is equal to the ratio of θ(h) at pF 0 and θ(h) at pF 1 for the selected soil texture class.
− → if pF_at_MWHC = 2, Correction _factor_MWHC is equal to the ratio of θ(h) at pF 0 and θ(h) at
pF 2 for the selected soil texture class.
Note: the ratios of θ(h) at pF 0 and pF 1 or pF 2 are calculated in the worksheet named Correction MWHC.
− MWHC_calc is multiplied by Correction _factor_MWHC, resulting in MWHC_vv_pF0. − MWHC_vv_pF0 is multiplied by the percentage of the MWHC/100 at which the test soil is
brought (Percentage_MWHC/100). This results in θact.
− Using the inverted class transfer function (Equation 2, section 5.2) for the assigned soil texture class, the value for |h| at θact is calculated. This value for |h| is subsequently expressed as pF, which
is the result of this calculation.
5.3.3
Calculation of pF at 75% of field capacity
− User enters Field capacity (θ_fc_input) in %.
− User enters whether field capacity is based on v/v or w/w. − θ_fc_input is recalculated to a fraction (θ_fc_fraction).
− If the field capacity is entered as w/w, θ_fc_fraction is multiplied by a default density of 1.5 L.kg-1, or by a density entered by the user (result is θfc_act).
− If the cell containing the user defined density is left or made empty, the default density is used. − The resulting is θ_fc_act is recalculated to 75% of field capacity by multiplying by 0.75 (resulting
parameter is called 0.75*θfc_act).
− Using the inverted class transfer function (Equation 2, section 5.2) for the assigned soil texture class, the value for |h| at 0.75*θfc_act is calculated. This value for |h| is subsequently expressed as pF, which is the result of this calculation.
5.3.4
Calculation of moisture content, θ(h), at given pF
− The user enters a pF value.
− Using the class pedotransfer function (Equation 1, section 5.2) for the assigned soil texture class, the value for θ(h) is calculated. This value is presented as the result of this calculation.
References
De Bakker H, Schelling J. 1989. Systeem van bodemclassificatie voor Nederland. 2e ed. Wageningen,
The Netherlands: Centrum voor Landbouwpublikaties en Landbouwdocumentatie. 209 pp. FOCUS. 2006. Guidance Document on Estimating Persistence and Degradation Kinetics from
Environmental Fate Studies on Pesticides in EU Registration. Brussels, Belgium: SANCO. Report of the FOCUS Work Group on Degradation Kinetics. EC Document Reference Sanco/10058/2005 version 2.0. 434 pp.
Jones, R. B. 1998. TechDig [computer program]. version 2.0d. Mundelein, IL, USA: R.B. Jones. Koorevaar P, Menelik G, Dirksen C. 1983. Elements of soil physics. Amsterdam, the Netherlands:
Elsevier. 228 pp.
Locher WP, De Bakker H, eds. 1990. Bodemkunde van Nederland. Deel 1 - Algemene bodemkunde. 2e ed. Den Bosch, The Netherlands: Malmberg. 439 pp.
Nemes A, Wösten JHM, Lilly A, Oude Voshaar JH. 1999. Evaluation of different procedures to interpolate particle-size distributions to achieve compatibility within soil databases. Geoderma 90: 187-202.
Van Genuchten MTh. 1980. A closed-form equation for predicting the hydraulic conductivity of unsaturated soils. Soil Sci Soc Am J 44: 892-898.
Wösten JHM, Lilly A, Nemes A, Le Bas C. 1998. Using existing soil data to derive hydraulic parameters for simulation models in environmental studies and in land use planning. Wageningen: DLO-Staring Centre. Report no. 156. 106 pp.
Wösten JHM, Lilly A, Nemes A, Le Bas C. 1999. Development and use of a database of hydraulic properties of European soils. Geoderma 90: 169-185.
Wösten JHM, Veerman GJ, De Groot WJM, Stolte J. 2001. Waterretentie- en
doorlatendheidskarakteristieken van boven- en ondergronden in Nederland: de Staringreeks - Vernieuwde uitgave 2001. Wageningen: Alterra. Report no. 153. 86 pp.
RIVM
National Institute for Public Health and the Environment P.O. Box 1
3720 BA Bilthoven The Netherlands www.rivm.com
![Table 3 Calculated cumulative particle size fractions at 50 and 63 µm, for the three relationships shown in Figure 2 Particle size [µm] φ -φ cumulative % of particles (average − 1s.d.) cumulative % of particles (average) cumulative % of particles](https://thumb-eu.123doks.com/thumbv2/5doknet/3058147.8734/18.892.149.741.305.433/calculated-cumulative-fractions-relationships-particle-cumulative-cumulative-cumulative.webp)